- 1Institute of Marine Science and Technology, Shandong University, Qingdao, China
- 2Research Centre for Indian Ocean Ecosystem, Tianjin University of Science and Technology, Tianjin, China
- 3Tianjin Key Laboratory of Marine Resources and Chemistry, Tianjin University of Science and Technology, Tianjin, China
The approach of fast repetition rate fluorometry (FRRF) requires a conversion factor (Φe : C/nPSII) to derive ecologically-relevant carbon uptake rates (PPz,t). However, the required Φe : C/nPSII is commonly measured by 14C assimilation and varies greatly across phytoplankton taxonomy and environmental conditions. Consequently, the use of FRRF to estimate gross primary productivity (GPz,t), alone or in combination with other approaches, has been restricted by both inherent conversion and procedural inconsistencies. Within this study, based on a hypothesis that the non-photochemical quenching (NPQNSV) can be used as a proxy for the variability and magnitude of Φe : C/nPSII, we thus proposed an independent field model coupling with the NPQNSV-based Φe : C/nPSII for FRRF-derived carbon, without the need for additional Φe : C/nPSII in the Bay of Bengal (BOB). Therewith, this robust algorithm was verified by the parallel measures of electron transport rates and 14C-uptake PPz,t. NPQNSV is theoretically caused by the effects of excess irradiance pressure, however, it showed a light and depth-independent response on large spatial scales of the BOB. Trends observed for the maximum quantum efficiency (Fv/Fm), the quantum efficiency of energy conversion (/) and the efficiency of charge separation (/) were similar and representative, which displayed a relative maximum at the subsurface and were collectively limited by excess irradiance. In particular, most observed values of Fv/Fm in the BOB were only about half of the values expected for nutrient replete phytoplankton. FRRF-based estimates of electron transport at PSII (ETRRCII) varied significantly, from 0.01 to 8.01 mol e− mol RCII−1 s−1, and showed profound responses to depth and irradiance across the BOB, but fitting with the logistic model. N, P, and irradiance are key environmental drivers in explaining the broad-scale variability of photosynthetic parameters. Furthermore, taxonomic shifts and physiological changes may be better predictors of photosynthetic parameters, and facilitate the selection of better adapted species to optimize photosynthetic efficiency under any particular set of ambient light condition.
Introduction
A convenient starting-point in marine ecosystem cycle is the photosynthesis from phytoplankton, with a possible very minor contribution of a few species of truly photosynthetic bacteria (McDermott et al., 1995). Marine phytoplankton annually fix between 30 and 50 billion metric tons of carbon, which account for ~40–50% of global carbon fixation (Raymont, 2014). On ecological and geological scales, there is profound evidence of the significance of phytoplankton photosynthesis in global biogeochemical cycling. The ability to accurately measure, monitor, and predict spatiotemporal variations of ocean primary productivity and its dynamic response to external environmental conditions is therefore crucial. Traditionally, the rates of phytoplankton primary productivity have been measured tracing the evolution of O2 or the assimilation of CO2 (Tortell, 2000), as well as using the 14C-method in conjunction with a simulated in situ incubator (Gall et al., 1999). However, these techniques have a number of well-known limitations, e.g., high labor intensity and cost associated with routine sample processing, low spatial and temporal resolution, and bottle artifacts due to exclusion of contamination. Thus, there is somewhat a need for a simple, non-intrusive and inexpensive assay for productivity estimates in both coastal and oligotrophic open water researches that adequately deals with the now constrained problems. More recently, active chlorophyll a fluorescence (ChlF) approaches which refer to measures of the quantum yield of linear electron transport through photosystem II (PSII), including fast repetition rate fluorometry (FRRF), can afford instantaneous estimates of gross primary productivity (GPz,t) at unprecedented high spatial and temporal resolution, avoiding the artifacts related to bottle containment (Kolber and Falkowski, 1993; Kolber et al., 1998; Smyth et al., 2004).
FRRF has been widely considered a major development for marine research in global efforts to better understand environmental regulation of GPz,t (Suggett et al., 2009). This is, to some extent, due to FRRF-derived GPz,t rates are typically based on the estimates of electron transfer rate at PSII (i.e., rates of charge separation, ETRRCII, mol e− mol RCII−1 s−1), which can be converted into ecologically relevant units of carbon fixation combining with derived conversion factor. The conversion factor linking ETRRCII and CO2 uptake rates covers two parameters, the amount of chlorophyll a (Chl a) per reaction center at functional PSII (RCII; 1/nPSII, mol chl a mol RCII−1) and the electron requirement for conversion of per inorganic carbon (Φe : C, mol e− mol C−1) (Schuback et al., 2016). On the basis of large empirical comparison of FRRF-derived ETRRCII and 14C-uptake measurements, the conversion factor Φe : C/nPSII required to derive carbon fixation estimates from the FRRF-derived rates of ETRRCII appears highly variable in response to the interacting effects of micronutrient and light availability (Zhu et al., 2017), over diurnal cycles (Schuback, 2016), and in response to changes in the composition of phytoplankton assemblages (Schuback et al., 2017). In particular, the long time in 14C-incubation experiments may exacerbate cumulative processes such as spectral quality of the light sources used and photodamage under excess irradiance, and then influence the absolute magnitude of derived Φe : C/nPSII. Overall, the commonly captured Φe : C/nPSII in the coupling between FRRF-derived productivity rates and 14C-assimilation data is great plasticity and not constant given its variable response to taxonomy and ambient conditions. In future work, an effort should be made to derive accurate algorithms for extrapolating the Φe : C/nPSII from FRRF-based measurements and to simulate their regulation mechanism on physiological level.
Regulation of absorption and utilization of light energy is necessary for algae to alleviate excess excitation energy after charge separation and minimize the potential for photooxidative damage (Schreiber et al., 1986). As such, marine phytoplankton evolve to optimize photosynthetic efficiency under a range of fluctuating light conditions since the way of getting rid of excess light to achieve energy-allocation balance, which can be estimated as non-photochemical quenching (NPQNSV) (Schreiber et al., 1986; Müller et al., 2001). Subsequent studies have demonstrated that the NPQNSV provides mechanistic insight into the processes decoupling photosynthetic electron transport and CO2-assimilation (e.g., Zehr and Kudela, 2009). Both Schuback et al. (2015, 2016) and Hughes et al. (2018) demonstrated the Φe : C/nPSII variance can be correlated to FRRF-based measurements of NPQNSV, interpreted as an indication of processes consuming photosynthetically derived energy and decoupling linear electron flow from carbon uptake. Accordingly, the NPQNSV can be used as a proxy for the variance and magnitude of Φe : C/nPSII between 14C-uptake rates and FRRf-derived ETRRCII to estimate the carbon-based rates of productivity.
Yet to our knowledge, there are no direct experimental investigates in GPz,t of natural phytoplankton assemblages based on ChlF yields as measured by FRRF in the Bay of Bengal (BOB). We thus conducted parallel measures of FRRF-derived GPz,t and (14C) carbon uptake rates (PPz,t) for the BOB. Most importantly, we presented an independent field model based on the NPQNSV-proxy hypothesis, without the need for additional Φe : C/nPSII in natural phytoplankton assemblages. Despite the precursor of NPQNSV-based Φe : C/nPSII derived from subarctic Pacific, to validate whether this hypothesis is possible to apply in the BOB, we subsequently compared our model with previously reported models from other marine ecosystems and synchronously measured PPz,t dataset. On large spatial scales, this is also the first study that shows NPQNSV, Fv/Fm, /, /, ETRRCII, FRRF-derived GPz,t and 14C-uptake PPz,t in natural phytoplankton assemblages to better understand the potential environmental responses and physiological processes accounting for their variability in the BOB.
Methods
Study Area and Sample Collection
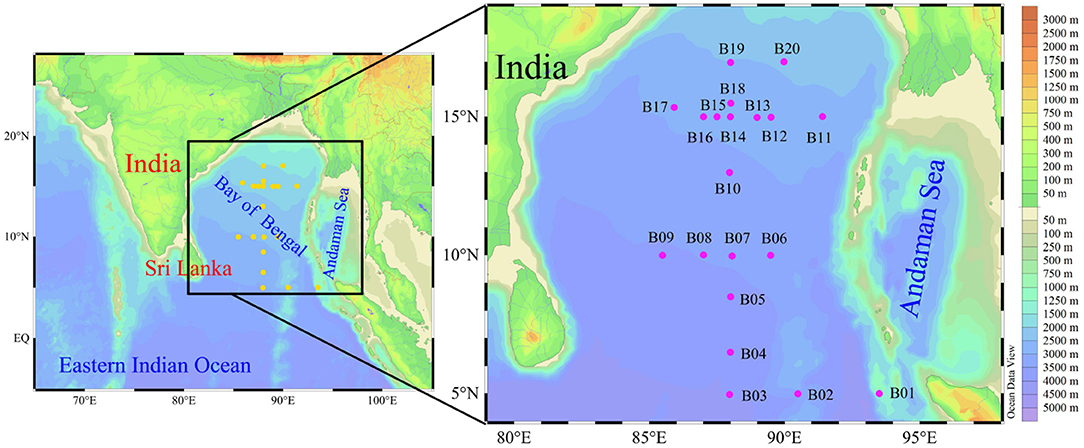
Field sampling was conducted in the BOB and its adjacent shelf (5°N~20°N, 85°E~95°E) during winter 2016 (between 15th November and 18th December). Our study area covered the entire sea basin of BOB, and 20 stations (B01–B20) were investigated (Figure 1). Water samples for FRRF measurement (FastOcean, Chelsea Technologies Group, Ltd.) from the upper euphotic depth (Zeu, depth with 1% of surface PAR) were collected using a rosette equipped with 12L Niskin bottles (General Oceanics) and a CTD (Conductivity, Temperature and Depth; SBE 19 Plus). Samples for phytoplankton (cell size > 2 μm) were fixed with 1–2% buffered formalin and were identified under an inverted microscope (Motic BA300) following the methods outlined in Utermöhl (1958). Five hundred milliliters of seawater were filtered through 0.7 μm GF/F filters under low vacuum pressure (<0.04 MPa) to retrieve the Chl a. Filters were extracted in 5 mL 90% acetone for 24 h in darkness at −20°C, and the Chl a concentrations were determined fluorimetrically using a pre-calibrated fluorometer following Welschmeyer (1994). Hundred milliliter seawater for nitrate + nitrite + ammonium (DIN), phosphate (DIP), and silicate (DSi) was measured using a Technicon AA3 Auto-Analyzer (Bran+Luebbe) following Dai et al. (2008). Detection limit based on this approach was 0.01 μmol L−1. The depth profile of photosynthetically active radiation (PAR, μmol quanta m−2 s−1, 400–700 nm) was measured using an underwater PAR sensor (RBR, XRX-620). The optical extinction coefficient (including in situ PAR), Kd (m−1), was calculated as:
where E0 is surface light intensity and Ez is light intensity at depth Z (m).
FRRF-Derived Photophysiological Parameters
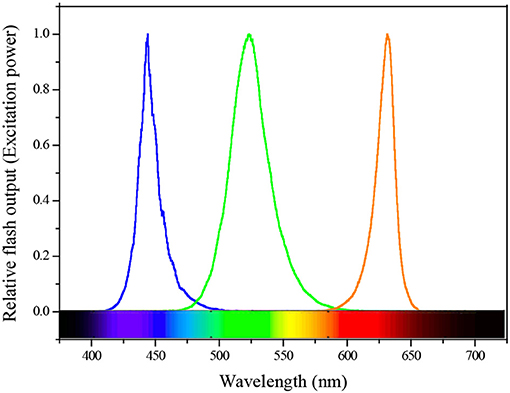
All active ChlF measurements were conducted on a FastOcean FRRF3 sensor with Act2 system in the field. Water samples were kept in low light to allow the oxidation of electron transport chain (ETC) and relaxation of NPQ. A single-turnover (ST) protocol consisted of 100 flashlets (Fet, a single 1 μs excitation pulse from the LEDs within a FRRF3 sensor) with 2.0 μs Fet pitch (interval between the start of one Fet and the next). During the cruise, we measured the ST flashlet sequences continuously (2.0 μs interval) and optimized the length of each light step to allow all derived parameters to reach steady state. Excitation power was provided by LEDs at three wavelengths centered on 450 (blue), 530 (green), and 624 (orange) nm (Figure 2), and was automatically selected to saturate the observed fluorescence transients. The blue LEDs will excite Chl a pigment, which covers most photosynthetic algae such as diatoms and dinoflagellates etc. Cyanobacteria will have some Chl a in their core complexes, but do not use Chl a as their primary pigment to absorb light, instead they have phycobilisomes containing various phycobilin pigments, which excite at longer wavelengths ranging from green and orange/red light (McConnell et al., 2002). In ocean mixed phytoplankton communities, therefore, we simultaneously added three wavelengths to cover the broad range of absorption spectrum to improve the light absorption and generate a saturating pulse (enough light absorbed to close all RCIIs). Each sample was exposed sequentially to 12 actinic background irradiances spanning from 0 to 1,200 μmol quanta m−2 s−1 to retrieve fluorescence-light response curves, also provided at three wavelengths. The time of subsequent light adaptation is twice as long as the initial dark condition. This is because a high proportion of phytoplankton assemblages require substantially longer to adapt to the initial transition between dark and light than to adapt to small increases in photon irradiance.
ChlF yields and FRRF-derived parameters corresponding to each actinic light level were recorded from the average of all acquisitions (Acqs). Fo is the initial ChlF yield induced by a weak light flash when all RCIIs are opened for charge separation in dark regulated state. After a series of increasing excitation pulses, the ChlF yield eventually reaches a maximal value Fm when RCIIs are all closed. By parameterizing the fluorescence-light response curve of ChlF yield from Fo to Fm, the effective absorption cross section of PSII (σPSII) can be derived. The ChlF yield is controlled by the competition among the processes of fluorescence (f ), heat dissipation (h), and photochemistry (p). If C is the scale factor, and K is the rate constant of these processes (Kolber et al., 1998; Xie et al., 2018), then, Fo = CKf /(Kf+Kh+Kp); Fm = CKf /(Kf+Kh). In light regulated state, Kh is assumed to change due to increased activity of non-photochemical quenching (NPQ). F′ = CKf /(Kf+xKh+Kp); = CKf /(Kf+xKh). In this way, we determined the fluorescence yields Fo and Fm for dark-regulated state and F' and for light-regulated state according to the biophysical model of Kolber et al. (1998). Fv and were calculated, respectively, as:
In dark-adapted state, the maximum quantum efficiency of PSII was calculated using the ratio of Fv/Fm as perKitajima and Butler (1975):
Rather, the quantum efficiency of photochemical energy conversion in PSII under the light-regulated state, / (), was derived as follows (Oxborough et al., 2000):
Fo' was estimated as (Oxborough and Baker, 1997):
The photochemical quenching of variable fluorescence (/), which quantifies the fraction of functional RCII (QA oxidized) at each light level in the open state, was calculated as Machlis (1963):
ETRRCII (mol e− mol RCII−1 s−1) in functional RCII was derived as the product of PAR (E, μmol quanta m−2 s−1), the σPSII at E (Å RCII−1) and the efficiency with which charge separation occurs in RCII. The constant value 6.022 × 10⁻³ converts μmol quanta to quanta and Å2 (10−20 m2) to m2 (Kolber and Falkowski, 1993).
The NPQ at given light level was calculated as the normalized Stern-Volmer quenching coefficient, defined as NPQNSV (Mitchell et al., 2002):
Carbon Fixation of 14C Assimilation
14C-uptake incubation experiments were conducted with water collected from the surface (~5 m) and from depths corresponding to 50, 30, 10, and 1% of surface PAR. The sampling depths were determined according to the estimated Kd (Equation 1). To simulate submarine irradiances, we screened sunlight by different combinations of neutral density filters. Seawater samples were prescreened through 200 μm mesh and then placed in two light and one dark acid-cleaned polycarbonate bottles of 250 mL. Carbon fixation was obtained from the uptake of NaH14CO3 (Strickland and Parsons, 1972), which was filled into each incubation bottle with trace amounts (10 μCi). The incubators were maintained at in situ temperature by a seawater circulation system. After 6 h incubation, water samples were filtered through 25 mm GF/F filters under low vacuum (<0.04 MPa). Radioactivity on the filters was measured with a liquid scintillation counter (Tri-Carb 2900TR) after removing residual inorganic carbon by concentrated HCl fuming overnight and immersing the filters within scintillation counting cocktail (10 mL; Ultima Gold, PerkinElmer). Carbon uptake rates (PPz,t, mg C (mg chla)−1 h−1 m−3) derived from 6 h incubations were calculated as follows:
Where Ra is the average activity of NaH14CO3 added to three light bottles (kBq), Rd is the activity of NaH14CO3 added to dark bottle (kBq), T, and p(Chla) are the incubation time (h) and total Chl a concentration (mg m−3), respectively. p(C) is the total amounts of CO2 concentration (mg m−3), which was estimated from salinity as per an empirical equation p(C) = (0.067 × Salinity−0.05) × 12,000. R is the total activity of NaH14CO3 added to the incubation bottle (kBq). The isotope discrimination between 14C and 12C was corrected by the factor of 1.05.
The integrated PPz,t over Zeu depth [PPzeu, mg C (mg chla)−1 h−1 m−2] was calculated as:
where PPi is the PPz,t at sampling layer i [mg C (mg chla)−1 h−1 m−3], n is the number of sampling layer, and Di is the depth at sampling layer i (m).
Model Assumption and FRRF-Based Carbon Fixation
The conversion factor Φe : C/nPSII between the ETRRCII (mol e− mol RCII−1 s−1) and FRRF-measured carbon fixation (mol C mol chl a−1 s−1) was calculated as:
Although the Φe : C/nPSII has provided a potential basis for improving estimates of phytoplankton primary productivity, the magnitude of Φe : C/nPSII is well-known to change significantly (1.15–54.2) with a multitude of interacting environmental factors (Boyd et al., 1997). The statistical error remains larger even if a constant Φe : C/nPSII derived from the averaging has been used in previous field studies (Schuback et al., 2016; Zhu et al., 2017). Therefore, we could not assume a permanent value for Φe : C/nPSII to estimate the GPz,t of natural phytoplankton in field experiment. Schuback et al. (2015) found a strong correlation between the expression of NPQNSV and Φe : C/nPSII (R2 = 0.70, P < 0.0001), subsequently presented that the use of NPQNSV can help to predict ETRRCII required Φe : C/nPSII and FRRF-derived carbon fixation without the need for any additional measurements and inherent assumptions, since ETRRCII estimate is tightly paired with corresponding NPQNSV estimate. Actually, such abiotic and biotic factors would be lost using a static (regional) Φe : C/nPSII especially to monitor the physiological responses to ambient changes on primary productivity, but are desirably captured with the NPQNSV-based approach. As such, the NPQNSV-based Φe : C/nPSII approach is realistic and crucial if the aim is to monitor the effects of environmental variations on primary productivity of natural phytoplankton assemblages. Meanwhile, this approach is not labor-intensive and practical for routine field sampling over large spatial scales. The calculation equation for NPQNSV-based Φe : C/nPSII was shown as follows (Schuback et al., 2015):
Thereupon we proposed a hypothesis for FRRF-derived carbon fixation (FC) without the need for additional Φe : C/nPSII in natural phytoplankton assemblages. The relationship between NPQNSV and FC according to the above Equations (7, 8, 12, and 13) was calculated as:
Where FC is the FRRF-measured gross carbon fixation per unit Chl a (mol C mol chl a−1 s−1), FRRF-GPz,t [mg C (mg chla)−1 h−1] was calculated as: GPz,t = 3.85 × 10⁴ × FC, the factor 3.85 × 10⁴ converts mol C mol chl a−1 s−1 to mg C (mg chla)−1 h−1 (Smyth et al., 2004).
Statistical Analyses
Spearman and Pearson correlation analysis were used to examine covariance of photosynthetic parameters (such as NPQ, Fv/Fm, /, /, and ETRRCII) with environment factors (SPSS, Version 19, IBM). Regression models and t-test were then applied for testing significant differences between groups of data. However, these regression models provided the predictive shape of the response curve of the photosynthetic parameters to environmental variables and highlighted the variance (R2).
Results
NPQNSV
Samples of in situ NPQ were similarly taken at 20 stations in the BOB (Figure 1). FRRF-based fluorescence curve fits were retrieved to derive the NPQNSV at 12 light levels, while in situ NPQ data were simultaneously obtained using the FastOcean FRRF3 sensor. The NPQNSV values were calculated from the relationship presented in Equation (9), estimated as Fo'/Fv'. Not surprisingly, in situ NPQ values and the above calculated NPQNSV in the same waters were well-correlated (Pearson correlation coefficient P = 0.91 for the close correlation between in situ NPQ and NPQNSV, p < 0.0001, n = 72), in turn, confirming that our fundamental fluorescence parameters (i.e., Fo, Fm, F′, and ) are reasonable and reliable. Empirical supporting evidence is presented. Further, the calculated NPQNSV values could be converted to in situ NPQ using their correlated relationships (in situ NPQ = 0.93NPQNSV + 0.23, Figure 3A).
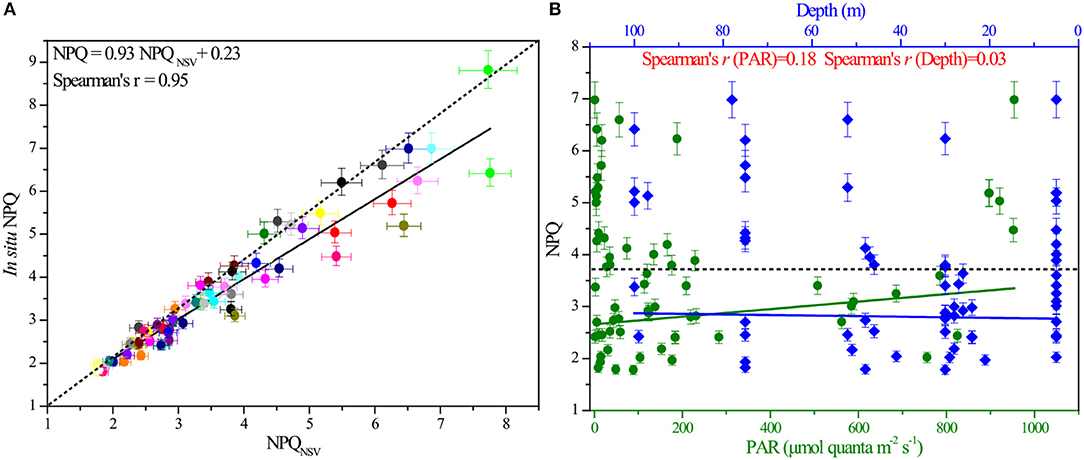
Figure 3. The correlation between in situ NPQ and NPQNSV, as well as the responses of in situ NPQ to light and depth. (A) In situ NPQ derived from FRRF measurements plotted against NPQNSV calculated by fluorescence parameters of the same water (Spearman's rank correlation coefficient S = 0.95, n = 72). (B) Responses of NPQ to changes in light and depth over the course of the in situ experiment (SPAR = 0.18, Sdepth = 0.03). NPQ was derived from the in situ FRRF measurements and is unitless. The dashed line indicates the average value of NPQ.
The non-photochemical variable NPQ at in situ irradiance levels ranged from 1.78 to 6.98, with an average value (±standard error, SE) of 3.61 ± 1.36, and showed prominent variability both within and between stations in the BOB. Theoretically, this different expression of NPQ appears to be induced by the effects of excess irradiance pressure on the photosynthetic ETC in PSII. To clearly understand the variable pattern at large spatial scales, all the data points of NPQ against PAR and depth were analyzed as shown in Figure 3B. Operationally, this in situ parameter showed a remarkably light and depth-independent response (PPAR = 0.01, Pdepth = 0.28; p > 0.01, n = 72).
Variability of Photosynthetic Parameters
To better understand the efficiency of photochemistry in PSII and its dynamic response to ambient regime observed over large spatial scales, we examined changes of in situ FRRF-derived ChlF parameters (Fv/Fm, /, and /) for the in-depth analysis of our data, and all data points (n = 72) of these photophysiological parameters against depth and light were analyzed to plot the related fitting curves.
Values of Fv/Fm, measured in the dark-regulated state, varied from 0.11 to 0.37 and averaged at 0.23 ± 0.04 (±SE). The parameter Fq'/Fm', the overall quantum efficiency of photochemical energy conversion in PSII () in the light-regulated state, ranged from 0.05 to 0.32, with an average (±SE) of 0.18 ± 0.07. In contrast, / values [ranged from 0.38 to 1.02, averaged at 0.78 ± 0.15 (±SE)], representing the efficiency of charge separation in functional RCII, were relatively higher at all irradiance levels. This is attributable to the fact that served as an estimate of the fraction of open RCII at given light level always approaches one at low irradiance. In situ curve fitting, though not statistically significant, variation trends observed for these parameters were similar and representative throughout the BOB. Fv/Fm, /, and / initially increased with depth and displayed a relative maximum at the subsurface (30–50 m), then decreased rapidly down to the minimum nearby the Zeu depth ( = 0.18, 0.32, and 0.43, respectively; Figure 4A). While at a continuous irradiance of 0~300 μmol quanta m−2 s−1, they remained high and relatively constant, but declined after continuing to increase in irradiance ( = 0.17, 0.32, and 0.77, respectively; Figure 4B).
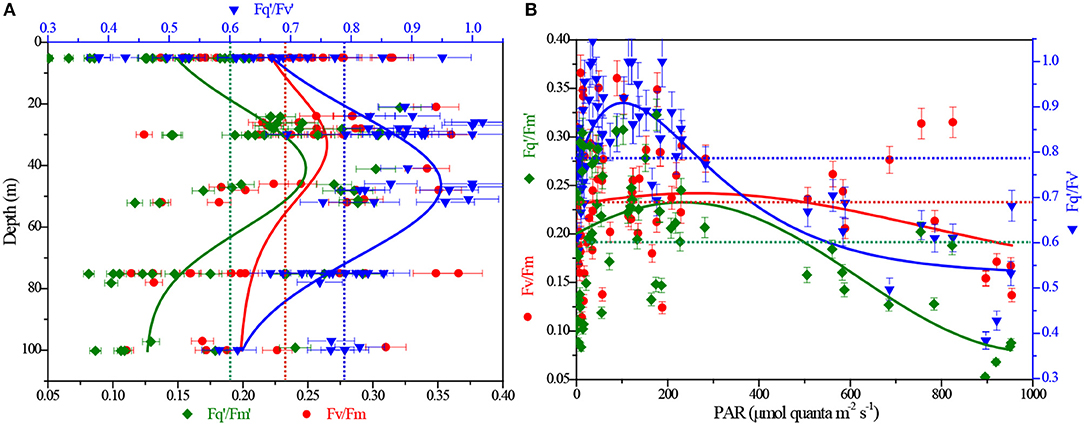
Figure 4. Depth and light dependency of ChlF-derived Fv/Fm, / and / from FRRF measurements. (A) Fv/Fm, / and / vs. depth; (B) Fv/Fm, / and / vs. light. The red, olive and blue dashed lines represent the averaging of Fv/Fm, / and /, respectively.
ETRRCII and FC
Working with natural phytoplankton assemblages in the BOB, we examined the interacting effects of depth (P vs. D curves) and instantaneous light level (P vs. E curves) on the rates of ETRRCII and FC (Figure 5). Both rates were calculated as a function of irradiance and showed the expected light dependency. At broad-scale natural state, however, P vs. E curve was not fit with the exponential model of Webb et al. (1974), who observed all data points would be excluded from the fitting procedure as a result of photoinhibition in lab cultures. Interestingly, the P vs. D and P vs. E curves were simultaneously fit to the logistic model in present study.
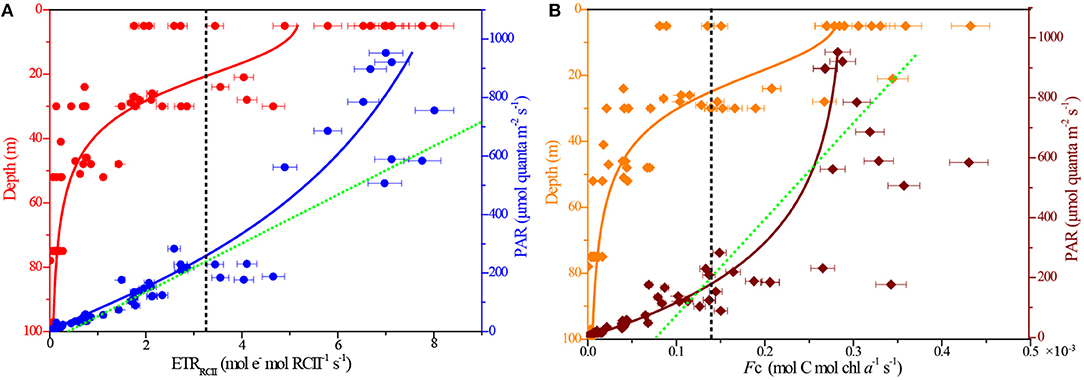
Figure 5. Depth and light responses of rates of ETRRCII and FC. (A) ETRRCII vs. depth (R2 = 0.68) and PAR (R2 = 0.87); (B) FC vs. depth (R2 = 0.96) and PAR (R2 = 0.83). The black dashed lines, respectively, indicate their average values. The green dashed lines, respectively, represent the theoretical exponential model of Webb et al. (1974) for the P vs. E curves.
The rates of ETRRCII varied greatly, ranging by more than 2 orders of magnitude from 0.01 to 8.01 mol e− mol RCII−1 s−1, with an average (±SE) of 3.21 ± 0.95 mol e− mol RCII−1 s−1. Maximum value of FC was 0.43 × 10⁻³ mol C mol chl a−1 s−1 at the surface, and the average value (±SE) was 0.14 ± 0.05 × 10⁻³ mol C mol chl a−1 s−1. Very similar responses to depth and irradiance were observed, respectively, between the ETRRCII and FC (Figure 5). In our P vs. D curve fits, both ETRRCII and FC showed statistically significant decline with depth (PETR = −0.74, PFc = −0.75; p < 0.0001). In contrast, there was significant increase in the P vs. E curve fits following light addition (PETR = 0.93, PFc = 0.87; p < 0.0001), indicating the light-dependent responses in both ETRRCII and FC for natural phytoplankton were not readily limited by high irradiance under large spatial scales. This result appears to be exemplified to differing degrees by the contrast in the relationship between NPQ and PAR (see Figure 3B). Overall, the P vs. D and P vs. E curves demonstrated significant and interactive effects of depth and irradiance availability on the rates of ETRRCII and FC.
Variability of Phytoplankton, FRRF-GPZeu and 14C-PPZeu
The abundance proportions of phytoplankton classes in the natural community were averaged, consisting of approximately 57% diatoms, 14% dinoflagellates, 26% cyanobacteria, and 3% chrysophytes. The contributions of diatoms and cyanobacteria to total phytoplankton abundance taken together amounted to about 83%, to some extent, further confirming that they were the numerically dominant component of phytoplankton communities, and had crucial role in primary productivity (Figure 6a). The FRRF-GPz,t integrated over Zeu depth (GPZeu) varied by 2 orders of magnitude across the BOB, from 0.95 to 15.17 mg C (mg chla)−1 h−1 m−2, with an average value (±SE) of 4.62 ± 0.97 mg C (mg chla)−1 h−1 m−2. We observed great changes in the spatial distributions of both phytoplankton abundance and GPZeu across the BOB, however, they did not change in parallel (Figures 6a,b). At all stations (n = 20), GPZeu were relatively high at B06, B07, and B09, while the maximum abundance of phytoplankton were at B07, B09, and B12. Even though not statistically significant (P = 0.28; p > 0.05), the distributional trends observed for phytoplankton abundance and GPZeu were similar throughout the BOB. The high-GPZeu zones were primarily dominated by diatoms and cyanobacteria, where they contributed over more than 78% to the total abundance of phytoplankton. As a consequence, this result further confirms that the variability in diatoms and cyanobacteria appear to be the primary drivers of variability in GPZeu.
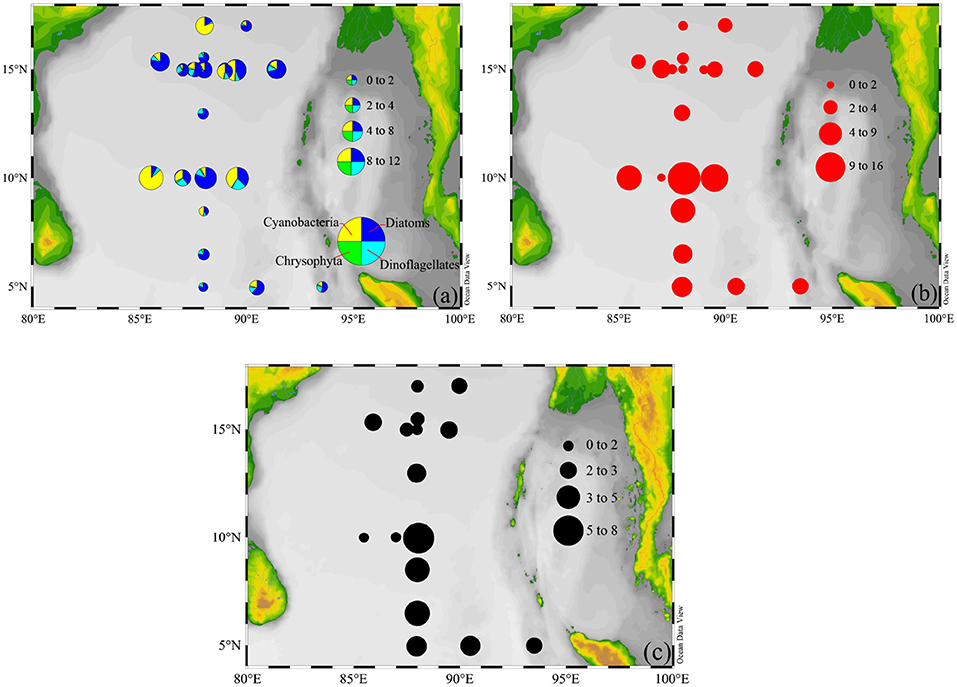
Figure 6. Spatial distributions of (a) phytoplankton abundance (×104 cells m−3), (b) FRRF-GPZeu, and (c) 14C-PPZeu [mg C (mg chla)−1 h−1 m−2] within the upper Zeu depth.
14C-PPZeu ranged from 0.86 to 8.04 mg C (mg chla)−1 h−1 m−2, with mean (±SE) of 2.79 ± 0.12 mg C (mg chla)−1 h−1 m−2 for 16 stations. As expected, spatial distribution of 14C-PPZeu was highly similar with that of FRRF-GPZeu (Figures 6b,c). It is well to emphasize that 14C-PPZeu and FRRF-GPZeu across the study area were strongly positively correlated with each other (Figure 7; P = 0.79, R2 = 0.60; S = 0.79, p < 0.0001, n = 16), revealing that our hypothesis (Equation 14) can be reasonably applied to derive FRRF-GPz,t rate. As such, we proposed a simple field model for FRRF-carbon estimate in the BOB, without the need for additional Φe : C/nPSII, which was calculated as per the hypothesis (Equation 14) and the linear PPZeu-GPZeu relationship.
Overall, our independent field model is realistic and robust for the FRRF-derived carbon estimate in the BOB, but just our research is not yet fine enough to fully prove its reliability in other oceans. Therefore, more data are needed to further enhance the applicability of FRRF-based field model to other ecosystems.
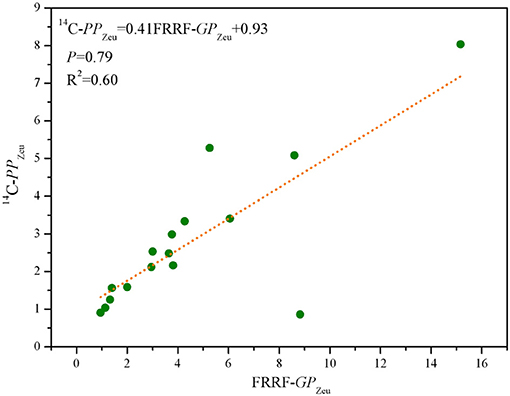
Figure 7. Scatter plots of FRRF-GPZeu and 14C-PPZeu [mg C (mg chla)−1 h−1 m−2] for pooled data of 16 stations in the BOB.
Discussion
Light and Depth Responses of NPQ
As a result observed in Figure 4, the expression of NPQ showed a light and depth-independent response. Although Schuback et al. (2015) revealed that NPQNSV increased with increasing light and decreased in response to iron addition, she attributed this effect to a more stable irradiance level in incubation experiments, relative to in situ flexible light environment. Regardless of irradiance influence, mono-specific laboratory culture of marine phytoplankton species, isolating natural phytoplankton assemblages, may especially contribute to the light and iron dependency of NPQNSV, yet it is unlikely to occur in natural mixed phytoplankton assemblages under open ocean condition, in part because the species-specific differences observed in incubation bottles are not consistent with changes in natural phytoplankton composition observed in field experiments. Furthermore, the in situ environmental factors, for example physical and biological instability, variable stratification, temperature and other micronutrients (e.g., Mn, Cu, and Zn) may also slightly affect the conversion of light energy and therefore the expression of NPQNSV (Georgieva and Yordanov, 1994; Raven et al., 1999; Smyth et al., 2004). In summary, on large spatial scales, it is tempting to speculate that the variation of NPQ could not be simply explained by light and iron-dependent responses, but also needed to be combined with the joint effects of complex taxonomic composition and variable environmental conditions.
Application of NPQNSV-based Φe : C/NPSII for Our Field Model
The NPQNSV and Φe : C/nPSII are not entirely independent parameters. In particular, the process acting to regulate electron transport and process preventing over-reduction of the ETC after charge separation are both controlled by excess excitation energy, it is reasonable to expect that their magnitude mechanistically correlates (Schuback et al., 2016). In addition, a wide variety of endogenous and exogenous mechanisms related to the relaxation of high excitation pressure experienced by the ETC can simultaneously influence NPQNSV and Φe : C/nPSII in a consistent manner (Ruban et al., 2012). From a photophysiological point of view, because excess light energy can be dissipated as heat before reaching RCII, the effects of increased excitation pressure on the ETC will ultimately cause the increased decoupling of CO2-assimilation and ETRRCII (Schuback et al., 2015). For instance, the expression of NPQNSV will increase if light is saturating, and concomitant with an increase in Φe : C/nPSII (Kaiblinger and Dokulil, 2006), this is because excess energy transfer to RCII and over-reduction of the ETC can be initially alleviated by a number of alternative electron pathways after charge separation, thereafter resulting in a strong correlation between the NPQNSV and Φe : C/nPSII in PSII (Laureau et al., 2013). For this reason, the applicability of NPQNSV-based Φe : C/nPSII is currently crucial to considering in the development of ChlF-based GPz,t estimates.
The intimate NPQNSV-Φe : C/nPSII relationship in Equation (13) was in some a result of their co-dependence on the ChlF parameters , , and F′. However, these ChlF signals normalized to the rates of ETRRCII are derived by an iterative non-linear fitting procedure (Kolber et al., 1998), indicating that the hypothesis which we proposed in Equation (14) for FC from natural phytoplankton assemblages was empirical rather than mechanistic, thereby providing a measure of GPz,t. Notwithstanding some potential sources of uncertainty in the absolute value of NPQNSV-based Φe : C/nPSII, the good agreement between our FRRF-derived GPZeu and 14C-uptake PPZeu (Figure 7; P = 0.79, R2 = 0.60; p < 0.0001) suggests that our independent field model for FRRF-derived primary productivity is operationally robust and suitable in the BOB. Recently, some work have pointed that a close link exist between alternative electron sinks involving midstream plastoquinol oxidase (PTOX) and the expression of NPQNSV, providing a new mechanistic insight into the process on the coupling between Φe : C/nPSII and NPQNSV (Laureau et al., 2013; Alric and Johnson, 2017). Consequently, to further enhance the accuracy and suitability of our FRRF-based field model in the BOB, even in other marine ecosystems, more data are needed in future work.
Interacting Effects of Ambient Conditions on FRRF Parameters
Fv/Fm has been used to characterize variation in the quantum efficiency of PSII. The maximum value equals 0.65 when all functional RCII are operating at maximum efficiency. Most often, Fv/Fm ranges from 0.65 in highly-productive regions to <0.3 in oligotrophic gyres (Falkowski and Kolber, 1995; Behrenfeld et al., 1996; Jin et al., 2016). In the BOB, most observed values of Fv/Fm (0.11~0.37) were only about half of the values expected for nutrient replete phytoplankton (Figure 4), hence indicating a biophysical consequences of nutrient limitation for phytoplankton assemblages. Consistent with previous observations, the range of DIN and DIP concentrations encountered in the euphotic layer exert a significant influence on values of the Fv/Fm as well as the NPQNSV and ETRRCII (Table 1). However, nutrient concentrations alone are inadequate to explain and predict the variability of these FRRF parameters over large spatial scales.

Table 1. Pearson's rank correlation coefficients between photosynthetic parameters and environmental factors.
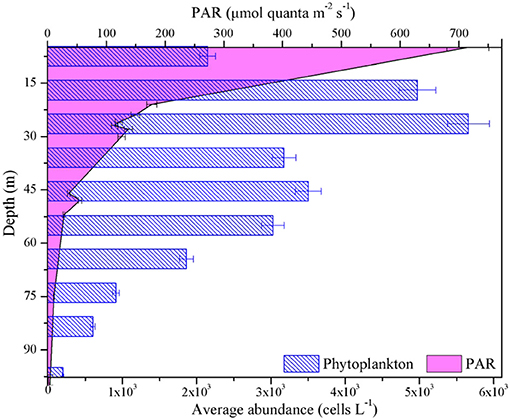
The average light intensity was comparatively high (~700 ± 338 μmol quanta m−2 s−1) in surface layer of BOB (Figure 8), Fv/Fm, /, and / concurrently showed an inverse relationship to light availability during high excitation pressure (PAR > 300 μmol quanta m−2 s−1, Figure 4B and Table 1), thereby indicating that the low values of them in the high-light region near the surface may be caused by the photo-protective mechanisms (including endogenous changes in metabolic energy allocation), some extent, namely the NPQ process (Öquist et al., 1992; Campbell and Tyystjärvi, 2012). Their increase at subsurface further confirms the inhibition of surface supersaturating irradiance and the presence of slow-relaxing NPQ components (Figure 4A). Likewise, low temperature usually has limited the ETRRCII due to low ribulose-1, 5-bisphosphate carboxylase/oxygenase activity (van de Poll and Buma, 2009; Jin et al., 2016). Accordingly, the negative correlation between these ChlF parameters and nutrients is likely attributable to the changes of temperature and light environment in vertical profiles (Figure 8 and Table 1).
Furthermore, average abundance of phytoplankton responded strongly to depth in the BOB, similarly with maximum value near the subsurface (Figure 8). Therefore, the phytoplankton may also affect these in situ photophysiological parameters, as demonstrated by rapid changes in relative flash output and wavelengths, as well as the expression of NPQ. Indeed, the variability in Fv/Fm, /, and / is thought to be highly associated with physiological state of the phytoplankton assemblages (Olaizola et al., 1996). Recently, a number of studies have collectively shown that change in community structure within phytoplankton assemblages appears to be a factor increasingly important in explaining patterns of photosynthetic parameters, likely reflecting the selection of better adapted species by environmental drivers (Zhu et al., 2017; Kulk et al., 2018; Xie et al., 2018). It is well to emphasize that diatoms and cyanobacteria have made a significant contribution to the dynamics of these photosynthetic parameters in this study. In summary, the changes in Fv/Fm, /, and / associated with depth may have resulted from both, photophysiological responses to ambient conditions and changes in community structure of phytoplankton assemblages.
Ideally, changes in ETRRCII and FC in phytoplankton field assemblages were limited by excess irradiance (Webb et al., 1974; Mitchell et al., 2002). However, on large spatial scales, these two rates of variability were, to a large extent, not susceptible to light fluctuations in ambient light of sufficient intensity (Figure 5). Since environmental forcing generates selective pressures on phytoplankton community structure presenting within an ecosystem, resulting in marked changes in photosynthetic parameters (as discussed above). Taxonomic shifts of phytoplankton community facilitate the selection of better adapted species to optimize photosynthetic efficiency under any particular set of ambient light condition (Figures 6, 8). Furthermore, high excitation pressure will effectively select for phytoplankton assemblages with the best ability to adapt for high irradiance condition by adjusting effective absorption cross section of PSII (Jin et al., 2016) and ameliorating the flow of excitation energy into of PSII (Schuback et al., 2015), potentially leading to the high values of ETRRCII and FC under high irradiances.
Contrasting Primary Productivity Between FRRF Models and 14C Dataset
To verify whether the NPQNSV-proxy hypothesis is possible to apply in the BOB, we subsequently compared our model with previously reported models from other ecosystems and synchronously measured PPz,t (14C) dataset. Apart from the calculation of GPz,t from the field model described in present study, another simple approach (defined as Model 1) also involved measuring the instantaneous depth-dependent rates of GPz,t, which when integrated over Zeu depth produced the values of GPZeu (Smyth et al., 2004). The factor of 1.56 × 10⁻⁴ accounting for the conversion from mol C mol chl a−1 s−1 to mg C (mg chla)−1 h−1 includes the following conversions: 12 g C mol−1 C, 892 g Chl a mol−1, 3,600 s h−1, 6.02 × 10²³ molecules mol−1 and 1020 m−2 photon.
In this model, the GPz,t is calculated as the product of the concentration of per RCII in PSII, the effective cross-section of RCII (σPSII), the quantum efficiency of photosynthesis () and irradiance (E).
Where GPi is the GPz,t at sampling layer i, n is the number of sampling layer, and Di is the depth at sampling layer i.
Smyth et al. (2004) particularly proposed the already included the effect of NPQNSV which could be manifested by a reduction in σPSII from its maximum value. The measurements of changes in σPSII under a variety of background irradiance reveal that the effect of NPQNSV on the σPSII is relatively small (0.15–0.20 σPSII change per unit of NPQNSV change) (Falkowski et al., 1986). However, this use of relative to FRRF-derived NPQNSV data could lead to an overestimation of the GPz,t (see below).
Theoretically, four electrons derived from water are subsequently used to reduce a single molecule of CO2 to the level of carbohydrate. Nonetheless, energy losses occur primarily during the processes of excitation energy transfer from the light-harvesting antenna pigments to the RCII, moreover, not all electrons from RCII are further transferred to the terminal acceptors of PSI, such as CO2, some are used to reduce and (Kolber and Falkowski, 1993). Electron flow between water and terminal acceptors is coupled in steady state, and the photosynthetic quotients (PQs) for new production are estimated to be 1.1–1.4, even 1.8 or higher that appears to result from comparisons of gross oxygen production to net CO2 assimilation (Laws, 1991). It is well to emphasize that the photosynthetic rates from the FRRF (gross) for natural phytoplankton communities will approach the theoretical maximum (GPmax), especially if we assume that the PQ is 1. The GPmax was calculated on the basis of PSII charge separation rate per unit volume (JVPSII, electrons (PSII m−3) s−1), which generally correlates well with the photosynthetic O2 evolution (Kolber and Falkowski, 1993; Hoppe et al., 2015).
Where [RCII] is the concentration of functional PSII reaction centers, 1-C is the fraction of RCII in the open state (QA oxidized, capable of stable charge separation), ELED is the measuring beam intensity with units of photons m−2 s−1, KR is an instrument-specific constant, with units of photons m−3 s−1. Consequently, the JVPSII roughly provides an estimate of GPmax with units of mg C (mg chla)−1 h−1 (defined as Model 2). The constant k includes the following conversions: 3,600 s h−1 and 0.25 C quanta−1.
Therefore, a comparison of the water column integrated primary production is obtained from the instantaneous FRRF models and synchronized 14C dataset (Figure 9). Although the dataset was limited, changes in absolute values of these models among sampling stations were statistically significant (S > 0.79, p < 0.0001), suggesting that the rates of primary productivity derived from our independent field model can be acquired accurately and reasonably. The operational efficiency of photosynthesis has been estimated from the ratio of GPZeu and GPmax to be averagely about 24% for natural phytoplankton assemblages. Although estimates of the theoretical upper limit of photosynthetic efficiency in microalgae have not been conducted as systematically, this average efficiency is more double than the theoretical efficiency of plant photosynthesis (Ort et al., 2011). Meanwhile, Ort et al. (2011) proposed that the primary reason why the observed photosynthetic efficiency in field experiment is higher than theoretical efficiency is light adaptation of photosynthesis. Indeed, over large spatial scales, the photosynthesis of phytoplankton assemblages in the BOB responds non-linearly to increases in insolation (Figures 4,5).
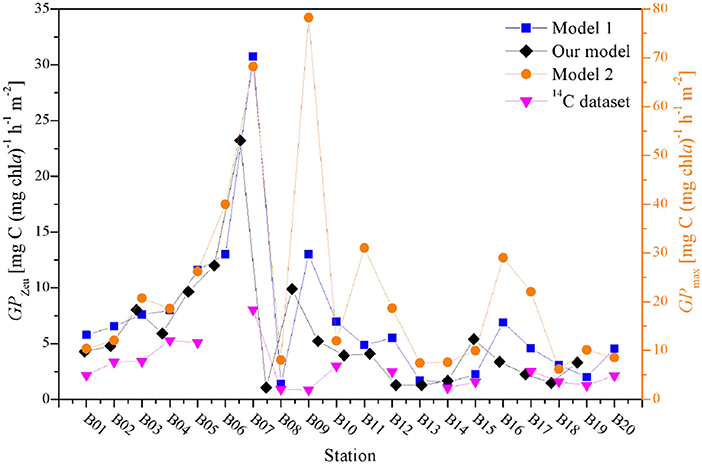
Figure 9. A comparison among the water column integrated primary production from different FRRF approaches and synchronized 14C dataset.
Ethics Statement
I would like to declare on behalf of my co-authors that the described work applies to our study and is original research that has not been published previously, and not under consideration for publication elsewhere, in whole or in part.
Author Contributions
JS conceived the ideas and designed methodology. YW and XZ performed the experiments and analysis. YW wrote the manuscript and prepared the tables and figures. HL provided the data of synchronous 14C-assimilation. All authors edited the manuscript. No conflict of interest exits in the submission of this manuscript, and manuscript is finally approved by all authors for publication.
Funding
This research was financially supported by the National Nature Science Foundation of China grants (41876134, 41676112, and 41276124), the University Innovation Team Training Program for Tianjin (TD12-5003), the Tianjin 131 Innovation Team Program (20180314), and the Changjiang Scholar Program of Chinese Ministry of Education (T2014253) to JS.
Conflict of Interest Statement
The authors declare that the research was conducted in the absence of any commercial or financial relationships that could be construed as a potential conflict of interest.
References
Alric, J., and Johnson, X. (2017). Alternative electron transport pathways in photosynthesis: a confluence of regulation. Curr. Opin. Plant Biol. 37, 78–86. doi: 10.1016/j.pbi.2017.03.014
Behrenfeld, M. J., Bale, A. J., Kolber, Z. S., Aiken, J., and Falkowski, P. G. (1996). Confirmation of iron limitation of phytoplankton photosynthesis in the equatorial Pacific Ocean. Nature 383, 508–511. doi: 10.1038/383508a0
Boyd, P. W., Aiken, J., and Kolber, Z. (1997). Comparison of radiocarbon and fluorescence based (pump and probe) measurements of phytoplankton photosynthetic characteristics in the Northeast Atlantic Ocean. Mar. Ecol. Prog. Ser. 149, 215–226. doi: 10.3354/meps149215
Campbell, D. A., and Tyystjärvi, E. (2012). Parameterization of photosystem II photoinactivation and repair. Biochim. Biophys. Acta 1817, 258–265. doi: 10.1016/j.bbabio.2011.04.010
Dai, M., Wang, L., Guo, X., Zhai, W., Li, Q., He, B., et al. (2008). Nitrification and inorganic nitrogen distribution in a large perturbed river/estuarine system: the Pearl River Estuary, China. Biogeosciences 5, 1227–1244. doi: 10.5194/bg-5-1227-2008
Falkowski, P. G., and Kolber, Z. (1995). Variations in chlorophyll fluorescence yields in phytoplankton in the world oceans. Funct. Plant Biol. 22, 341–355. doi: 10.1071/PP9950341
Falkowski, P. G., Wyman, K., Ley, A. C., and Mauzerall, D. C. (1986). Relationship of steady-state photosynthesis to fluorescence in eucaryotic algae. Biochim. Biophys. Acta 849, 183–192. doi: 10.1016/0005-2728(86)90024-1
Gall, M., Hawes, I., and Boyd, P. (1999). Predicting rates of primary production in the vicinity of the Subtropical Convergence east of New Zealand. N. Z. J. Mar. Freshwater Res. 33, 443–455. doi: 10.1080/00288330.1999.9516890
Georgieva, K., and Yordanov, I. (1994). Temperature dependence of photochemical and non-photochemical fluorescence quenching in intact pea leaves. J. Plant Physiol. 144, 754–759. doi: 10.1016/S0176-1617(11)80673-5
Hoppe, C. J., Holtz, L. M., Trimborn, S., and Rost, B. (2015). Ocean acidification decreases the light-use efficiency in an Antarctic diatom under dynamic but not constant light. New Phytol. 207, 159–171. doi: 10.1111/nph.13334
Hughes, D. J., Varkey, D., Doblin, M. A., Ingleton, T., Mcinnes, A., Ralph, P. J., et al. (2018). Impact of nitrogen availability upon the electron requirement for carbon fixation in australian coastal phytoplankton communities. Limnol. Oceanogr. 63, 1891–1910. doi: 10.1002/lno.10814
Jin, P., Gao, G., Liu, X., Li, F., Tong, S., Ding, J., et al. (2016). Contrasting photophysiological characteristics of phytoplankton assemblages in the Northern South China Sea. PLoS ONE 11:e0153555. doi: 10.1371/journal.pone.0153555
Kaiblinger, C., and Dokulil, M. T. (2006). Application of fast repetition rate fluorometry to phytoplankton photosynthetic parameters in freshwaters. Photosyn. Res. 88, 19–30. doi: 10.1007/s11120-005-9018-8
Kitajima, M., and Butler, W. L. (1975). Quenching of chlorophyll fluorescence and primary photochemistry in chloroplasts by dibromothymoquinone. Biochim. Biophys. Acta 376, 105–115. doi: 10.1016/0005-2728(75)90209-1
Kolber, Z., and Falkowski, P. G. (1993). Use of active fluorescence to estimate phytoplankton photosynthesis in situ. Limnol. Oceanogr. 38, 1646–1665. doi: 10.4319/lo.1993.38.8.1646
Kolber, Z. S., Prášil, O., and Falkowski, P. G. (1998). Measurements of variable chlorophyll fluorescence using fast repetition rate techniques: defining methodology and experimental protocols. Biochim. Biophys. Acta 1367, 88–106. doi: 10.1016/S0005-2728(98)00135-2
Kulk, G., van de Poll, W. H., and Buma, A. G. (2018). Photophysiology of nitrate limited phytoplankton communities in Kongsfjorden, Spitsbergen. Limnol. Oceanogr. 63, 2606–2617. doi: 10.1002/lno.10963
Laureau, C., De Paepe, R., Latouche, G., Moreno-Chacón, M., Finazzi, G., Kuntz, M., et al. (2013). Plastid terminal oxidase (PTOX) has the potential to act as a safety valve for excess excitation energy in the alpine plant species Ranunculus glacialis L. Plant Cell Environ. 36, 1296–1310. doi: 10.1111/pce.12059
Laws, E. A. (1991). Photosynthetic quotients, new production and net community production in the open ocean. Deep Sea Res Part A. 38, 143–167. doi: 10.1016/0198-0149(91)90059-O
Machlis, L. (1963). Studies on Microalgae and Photosynthetic Bacteria. A Collection of Papers. Tokyo: Japanese Society of Plant Physiologists, University of Tokyo Press.
McConnell, M. D., Koop, R., Vasil'ev, S., and Bruce, D. (2002). Regulation of the distribution of chlorophyll and phycobilin-absorbed excitation energy in cyanobacteria. A structure-based model for the light state transition. Plant Physiol. 130, 1201–1212. doi: 10.1104/pp.009845
McDermott, G. M., Prince, S. M., Freer, A. A., Hawthornthwaite-Lawless, A. M., Papiz, M. Z., Cogdell, R., et al. (1995). Crystal structure of an integral membrane light-harvesting complex from photosynthetic bacteria. Nature 374, 517–521. doi: 10.1038/374517a0
Mitchell, B. G., Kahru, M., Wieland, J., Stramska, M., and Mueller, J. L. (2002). “Determination of spectral absorption coefficients of particles, dissolved material and phytoplankton for discrete water samples,” in Ocean Optics Protocols for Satellite Ocean Color Sensor Validation, Revision 3, eds J. L. Mueller and G. S. Fargion (Greenbelt, MD: National Aeronautics and Space Administration, Goddard Space Flight Center), 3, 231–257.
Müller, P., Li, X. P., and Niyogi, K. K. (2001). Non-photochemical quenching. A response to excess light energy. Plant Physiol. 125, 1558–1566. doi: 10.1104/pp.125.4.1558
Olaizola, M., Geider, R. J., Harrison, W. G., Graziano, L. M., Ferrari, G. M., and Schlittenhardt, P. M. (1996). Synoptic study of variations in the fluorescence based maximum quantum efficiency of photosynthesis across the North Atlantic Ocean. Limnol. Oceanogr. 41, 755–765. doi: 10.4319/lo.1996.41.4.0755
Öquist, G., Chow, W. S., and Anderson, J. M. (1992). Photoinhibition of photosynthesis represents a mechanism for the long-term regulation of photosystem II. Planta 186, 450–460. doi: 10.1007/BF00195327
Ort, D. R., Zhu, X., and Melis, A. (2011). Optimizing antenna size to maximize photosynthetic efficiency. Plant Physiol. 155, 79–85. doi: 10.1104/pp.110.165886
Oxborough, K., and Baker, N. R. (1997). Resolving chlorophyll a fluorescence images of photosynthetic efficiency into photochemical and non-photochemical components–calculation of qP and Fv-/Fm-; without measuring Fo. Photosyn. Res. 54, 135–142. doi: 10.1023/A:1005936823310
Oxborough, K., Hanlon, A. R. M., Underwood, G. J. C., and Baker, N. R. (2000). In vivo estimation of the photosystem ii photochemical efficiency of individual microphytobenthic cells using high-resolution imaging of chlorophyll a fluorescence. Limnol. Oceanogr. 45, 1420–1425. doi: 10.4319/lo.2000.45.6.1420
Raven, J. A., Evans, M. C., and Korb, R. E. (1999). The role of trace metals in photosynthetic electron transport in O2-evolving organisms. Photosyn. Res. 60, 111–150. doi: 10.1023/A:1006282714942
Raymont, J. E. (2014). Plankton and Productivity in the Oceans: Volume 1: Phytoplankton. Southampton: Elsevier.
Ruban, A. V., Johnson, M. P., and Duffy, C. D. (2012). The photoprotective molecular switch in the photosystem ii antenna. Biochim. Biophys. Acta 1817, 167–181. doi: 10.1016/j.bbabio.2011.04.007
Schreiber, U., Schliwa, U., and Bilger, W. (1986). Continuous recording of photochemical and non-photochemical chlorophyll fluorescence quenching with a new type of modulation fluorometer. Photosyn. Res. 10, 51–62. doi: 10.1007/BF00024185
Schuback, N. (2016). On the light and iron dependent coupling of carbon fixation and photosynthetic electron transport in Arctic and Subarctic marine phytoplankton (Doctoral dissertation). Vancouver, BC: University of British Columbia.
Schuback, N., Flecken, M., Maldonado, M. T., and Tortell, P. D. (2016). Diurnal variation in the coupling of photosynthetic electron transport and carbon fixation in iron-limited phytoplankton in the NE subarctic Pacific. Biogeosciences 13, 1019–1035. doi: 10.5194/bg-13-1019-2016
Schuback, N., Hoppe, C. J., Tremblay, J. É., Maldonado, M. T., and Tortell, P. D. (2017). Primary productivity and the coupling of photosynthetic electron transport and carbon fixation in the Arctic Ocean. Limnol. Oceanogr. 62, 898–921. doi: 10.1002/lno.10475
Schuback, N., Schallenberg, C., Duckham, C., Maldonado, M. T., and Tortell, P. D. (2015). Interacting effects of light and iron availability on the coupling of photosynthetic electron transport and CO2-assimilation in marine phytoplankton. PLoS ONE 10:e0133235. doi: 10.1371/journal.pone.0133235
Smyth, T. J., Pemberton, K. L., Aiken, J., and Geider, R. J. (2004). A methodology to determine primary production and phytoplankton photosynthetic parameters from fast repetition rate fluorometry. J. Plankton Res. 26, 1337–1350. doi: 10.1093/plankt/fbh124
Strickland, J. D. H., and Parsons, T. R. (1972). A Practical Handbook of Seawater Analysis. Ottawa, ON: Fisheries Research Board of Canada.
Suggett, D. J., Moore, C. M., Hickman, A. E., and Geider, R. J. (2009). Interpretation of fast repetition rate (FRR) fluorescence: signatures of phytoplankton community structure versus physiological state. Mar. Ecol. Prog. Ser. 376, 1–19. doi: 10.3354/meps07830
Tortell, P. D. (2000). Evolutionary and ecological perspectives on carbon acquisition in phytoplankton. Limnol. Oceanogr. 45, 744–750. doi: 10.4319/lo.2000.45.3.0744
Utermöhl, H. (1958). Zur Vervollkommnung der quantitativen Phytoplankton-Methodik: Mit 1 Tabelle und 15 abbildungen im Text und auf 1 Tafel. Int. Vereinigung Theor. Angew. Limnol. Mitteilungen 9, 1–38. doi: 10.1080/05384680.1958.11904091
van de Poll, W. H., and Buma, A. G. J. (2009). Does ultraviolet radiation affect the xanthophyll cycle in marine phytoplankton? Photochem. Photobiol. Sci. 8, 1295–1301. doi: 10.1039/b904501e
Webb, W. L., Newton, M., and Starr, D. (1974). Carbon dioxide exchange of Alnus rubra. Oecologia 17, 281–291. doi: 10.1007/BF00345747
Welschmeyer, N. A. (1994). Fluorometric analysis of chlorophyll a in the presence of chlorophyll b and pheopigments. Limnol. Oceanogr. 39, 1985–1992. doi: 10.4319/lo.1994.39.8.1985
Xie, Y., Laws, E. A., Yang, L., and Huang, B. (2018). Diel patterns of variable fluorescence and carbon fixation of picocyanobacteria Prochlorococcus-dominated phytoplankton in the South China Sea basin. Front. Microbiol. 9:1589. doi: 10.3389/fmicb.2018.01589
Zehr, J. P., and Kudela, R. M. (2009). Photosynthesis in the open ocean. Science 326, 945–946. doi: 10.1126/science.1181277
Keywords: phytoplankton, primary production, Bay of Bengal, photosynthetic parameters, electron transport
Citation: Wei Y, Zhao X, Sun J and Liu H (2019) Fast Repetition Rate Fluorometry (FRRF) Derived Phytoplankton Primary Productivity in the Bay of Bengal. Front. Microbiol. 10:1164. doi: 10.3389/fmicb.2019.01164
Received: 02 September 2018; Accepted: 07 May 2019;
Published: 24 May 2019.
Edited by:
Sophie Rabouille, UMR7621 Laboratoire d'océanographie microbienne (LOMIC), FranceCopyright © 2019 Wei, Zhao, Sun and Liu. This is an open-access article distributed under the terms of the Creative Commons Attribution License (CC BY). The use, distribution or reproduction in other forums is permitted, provided the original author(s) and the copyright owner(s) are credited and that the original publication in this journal is cited, in accordance with accepted academic practice. No use, distribution or reproduction is permitted which does not comply with these terms.
*Correspondence: Jun Sun, cGh5dG9wbGFua3RvbkAxNjMuY29t
 Yuqiu Wei1
 Jun Sun