- Interdisciplinary Centre for Advanced Materials Simulation, Ruhr-Universität Bochum, Bochum, Germany
Crystal plasticity (CP) models have proven to accurately describe elasto-plastic behavior on micro- and nanometer length scales in numerous applications. However, their parameterization requires a series of experiments and inverse analysis of the results. In this regard, nanoindentation promises to be a well-suited tool for realizing a parameterization approach to determine all model parameters. The objective of this work is to develop a parameterization technique for a non-local CP model by means of an accessible and reproducible workflow. To determine its feasibility, tempered lath martensite with two different carbon contents is used as testing material. The workflow combines nanoindentation tests with finite element simulations. First, indentation into single packets of tempered lath martensitic specimen is yielding the load-displacement curves and the residual imprint topology on the surface with the help of atomic force microscopy. In a second step, a finite element simulation of the indentation using non-local crystal plasticity as constitutive model is performed with estimated model parameters. In the next step, non-local CP parameters are systematically adapted in an optimization scheme to reach optimal agreement with experiments. As a final validation step, it is successfully demonstrated that the CP model parameterized by nanoindentation is able to determine the macroscopic stress-strain response of polycrystals. Two observations are made: on the one hand, the material properties locally scatter very strongly, which is caused by fluctuations in microstructure and chemistry. On the other hand, a novel method has been demonstrated, were an inverse analysis is used to parameterize a non-local CP model for highly complex microstructures as those of tempered lath martensite. The novelty of this study is the application of nanoindentation and optimization scheme to parameterize a higher-order CP model of oligocrystals with a complex microstructure like the tempered lath martensite as well as the topology identification method developed and employed for both experiment and numerics.
1. Introduction
The ever-increasing industrial demands on alloys in terms of strength, fracture toughness, ductility and hardness make it necessary to consider the microstructural evolution and features from the very beginning of their design. Of particular technical importance are martensitic steels, which have outstanding properties due to their hierarchical, finely resolved texture, but at the same time present special challenges to their production and modeling. To understand the relationship of their complex microstructure and their properties, several experimental techniques and simulations methods must be incorporated, one of which is nanoindentation test, which allows us to quantify the hardness at the small dimension of martensitic microstructures. Furthermore, nanoindentation is of such importance because it reveals so-called size effects, which are defined as an increase in the apparent hardness with either decreasing indenter size or smaller indentation depth. The indentation size effect was observed in several experimental studies (Swadener et al., 2002; Durst et al., 2008; Engels et al., 2018) and stems from the formation of geometrically necessary dislocations (GNDs), the theoretical concepts of which originate in the 1950s (Nye, 1953; Kröner, 1958; Ashby, 1970). For nanoindentation, various phenomenological models were designed to calculate the hardness as a function of material parameters and tip size: Fleck and Hutchinson (Fleck and Hutchinson, 1993, 1997) developed a model introducing a material length scale into a phenomenological model. Ashby (1970) introduced GNDs for indentation with a flat punch. Nix and Gao (1998) extended the model for conical indenters, and Swadener for spherical indenter tips (Swadener et al., 2002).
All these models have in common, that the assume indentation in an (infinite) single crystal. To simulate indentation in a complex microstructure, a full-field finite element simulation of both tip and substrate is required. The numerical modeling of the elasto-plastic behavior of metals on the micro-scale is typically done by means of a crystal plasticity model. It has shown its practical use for single- or polycrystals and has been implemented in commercial and non-commercial finite element codes (Becker, 1998; Sachtleber et al., 2002; Zhao et al., 2004; Roters et al., 2010). Results can be directly compared to experimental findings for in-depth studies of various quantities, including, strain, strain rates, shear rates, local stresses, forces, texture evolution and various size effects (Huber and Tsakmakis, 1999; Durst et al., 2008). The difficulty is that, in order to realize size effects, first- or even second-order strain gradients (hence the term “non-local”) must be implemented and translated to densities of geometrically necessary dislocations (Arsenlis and Parks, 1999; Arsenlis et al., 2004; Evers et al., 2004), whereas conventional FE codes obviously need to calculate the first-order gradients from the displacement field only. CPFEM simulations of nanoindentation were performed by several authors, who used either local (Liu et al., 2015; Petryk et al., 2017) or non-local formulations (Reuber et al., 2014; Liu et al., 2015; Han et al., 2016), and many of them investigate the behavior of single crystal. In this context, a study on the indentation size effect in single-crystalline ARMCO-iron has recently been published (Engels et al., 2018), in which a special focus is given to the pile-up formation and the non-local behavior.
Tempered lath martensite can be considered to be highly technically relevant due its beneficial engineering properties, which stem from their remarkable hierarchical microstructure, which evolves during its rapid transformation from high-temperature austenite to non-equilibrium, metastable martensite (Kitahara et al., 2005, 2006; Bhadeshia and Honeycombe, 2006; Hutchinson et al., 2011). A detailed characterization of the hierarchical structure of lath martensite was given by Morito et al. (2003, 2006). The hierarchical structure consists of the prior austenite grain, which itself consists of so-called packets, blocks and sub-blocks. Its understanding will help to guide alloy design toward desired mechanical properties, although the calibration of a multi-parameter crystal plasticity model is difficult, in particular, if it is done by means of nanoindentation for the fine and complex martensitic microstructure. The plasticity of tempered lath martensite has not yet been fully understood (Morsdorf et al., 2016). The familiar crystallographic slip by dislocations is strongly influenced by the question whether in-lath- or out-of-lath dislocation movement occurs. Galindo-Nava and del Castillo (2015) suggested a model that incorporates the quantities of block and packet boundaries to describe the macroscopic mechanical properties of lath martensite. Recently, the mechanism of grain boundary sliding has been shown experimentally and has numerically been supported in the work of Mine et al. (2013), Maresca et al. (2014), and Du et al. (2016). As a possible origin of this sliding, fine retained austenite layers between laths are suggested. Though these layers might transform to martensite during ongoing deformation, the glide systems of the austenite allow a simple slip through the boundary and hence promote plastic deformation. Our contribution of the latter effects has not been considered in our study in order to limit the complexity of the developed model.
The general definition of an inverse analysis is to identify unknown parameters of a system by means of an appropriate modeling approach using reference data, which are usually measured experimentally. In mathematical terms, inverse problems are poorly set, since a unique solution of a problem, depending on the number of unknown parameters, does not always exist. This makes it difficult to combine them with model inaccuracies and natural deviations from the reference data.
In the present work, experimental nanoindentation tests were numerically replicated. A well-known problem with inverse analysis is the ambiguity or the uniqueness of the parameter space for a given problem (Chen et al., 2007; Heinrich et al., 2009; Phadikar et al., 2013). The inverse analysis approach assumes one suitable set of materials parameters, which is able to reproduce the experimentally observed mechanical response of a material in case for another single crystal or martensitic packet. If this case is not valid, it is not possible to uniquely identify the material behavior of indented samples by inverse analysis. The uniqueness of the optimized parameter set can be validated with the tensile response of the indented material. Several publications reported about the inverse method and three main techniques in this research field. To extract, for example, tensile properties of materials from instrumented indentation tests, the inverse analysis technique was used in Chollacoop et al. (2003), Bucaille et al. (2003), Ogasawara et al. (2005), Lee et al. (2009), Lee et al. (2010), Ogasawara et al. (2006), Moussa et al. (2014), and Wu and Guan (2014) by considering the representative stress-strain method. Further, Jiang et al. (2009) and Khan et al. (2010) solved this inverse problem with an iterative FE approach and (Muliana et al., 2002; Haj-Ali et al., 2008) under use of artificial neural networks (ANN). Bolzon et al. (2004) also considered the advantage of measuring three-dimensional surface topologies of residual imprints and used these as reference values and estimated constitutive model parameters with an isotropic elasto-plastic material model. Zambaldi et al. (2012) carried out an inverse analysis to identify CP parameters for pure titanium under consideration of surface topology. Bertin et al. (2016) used digital image correlation of in-plane surface deformations instead, whereas Acar et al. (2017) used the results of tension/compression tests and orientation distribution functions.
Using load-displacement information within parameter optimization can be considered as the minimal requirement, but surface topology is also recognized as a valuable input (Rauchs and Bardon, 2011; Meng et al., 2015). An inverse indentation analysis, incorporating the load-displacement data next to the surface topology information in single crystalline FCC materials was performed by Chakraborty and Eisenlohr (2017). The authors identify two most important parameters of their phenomenological constitutive plasticity model, independently from crystal orientations.
This work is intended to further investigate the influence of the pile-up topology and addresses related challenges with an automated optimization procedure, in the following denoted as inverse analysis, considering the pile-up formation, load-displacement behavior and size effect used on the martensite-substructure level. The non-local crystal plasticity model modified by Ma and Hartmaier (2014) is parameterized to mimic the experimental findings of low-alloyed tempered lath martensite with a varied carbon concentration.
2. Experimental Setup and Results
2.1. Tempered Lath Martensite
Conscientious and accurate characterization of the microstructure is a key factor for a successful optimization of the crystal plasticity parameters. After the austenite to martensite phase transformation, which ensures pure lath martensite, boundaries of a prior austenite grain (PAG) can still be identified. A PAG is divided into several packets, and the packet size depends on the former parental austenite grain and the carbon content. Martensite packets are again divided into groups of blocks, and the blocks in each group belong to the same habit plane. Each martensite block includes a group of laths, which are all of close orientations and form in alternating arrangement. In the present study two martensitic alloys were investigated, both with similar chemical compositions, but different carbon content, precisely 10MnCr8-4 and 30MnCr8-4. A similar systematical study on the influence of the carbon content and the orientation relationship was performed experimentally (Hutchinson et al., 2011). The detailed composition can be found in Table 1. The raw materials were produced as hot rolled steel sheets, and tests samples were taken from the core of each steel sheet to avoid decarbonization of the edge layer. The samples were grinded and polished up to 1 μm and prepared for EBSD investigations of indented areas by means of vibropolishing with a fine non-crystallizing 0.02 μm amorphous colloidal silica suspension.

Table 1. Chemical compositions and tensile test results for both compositions used in the present study.
EBSD images of both alloys are shown in Figure 1. A direct comparison of both inverse pole figure maps demonstrated the influence of the increasing carbon content. For a higher C-content, the martensitic microstructure is refined and the packet- and block size decreased. The martensite packet sizes ranged from 6 μm to 65 μm for 10MnCr8-4 and from 4 μm to 50 μm for 30MnCr8-4. The measured block width in the current study had a thickness between 0.7 μm and 7 μm and served as important information for the design of a simplified microscopic nanoindentation model, with which the parameter identification was performed. Residual imprints of interest which are valid for an inverse analysis were chosen according to the following conditions: The residual imprints were placed in the center of a single martensite packet to avoid interactions with a packet- or prior austenite grain boundary. Furthermore, the block structure of these imprints were similar, but the crystallographic features varied.
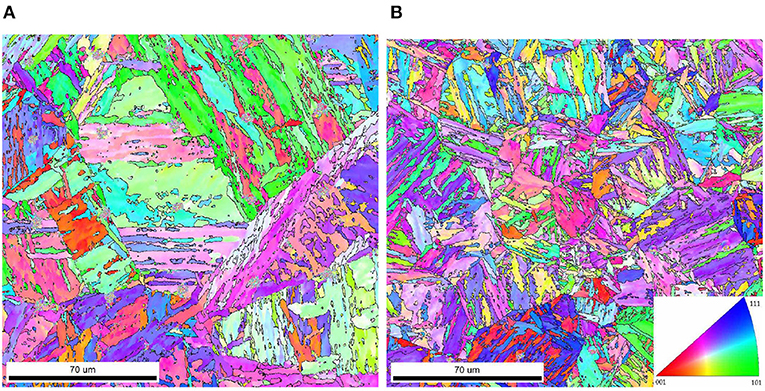
Figure 1. Inverse pole figure maps of tempered lath martensitic microstructures for both alloys with lower and higher carbon content. (A) 10MnCr8-4. (B) 30MnCr8-4.
2.2. Nanoindentation and AFM
Nanoindentation tests were performed using a MTS Nano Indenter XP (MTS Systems Corp., USA), which was kept in a thermally and acoustically insulated room at a constant temperature of 20°C. During nanoindentation tests, load-displacement curves were recorded as shown in Figure 3. Nanoindentation experiments were performed with a sphero-conical tip of 5 μm radius in two different samples of 10MnCr8-4 and 30MnCr8-4.
The indentation tip was calibrated by fused silica indentation. In these nanoindentation tests, a maximum indentation load of 50 mN with a loading rate of 1 mN/s was chosen. Unloading started immediately after a holding period of 10 s. In total, 48 imprints were placed into each sample surface to reach as many residual imprints positioned in a single martensite packet as possible.
After completing all nanoindentation tests, residual imprints were characterized using Electron Backscatter Diffraction (EBSD) to identify the crystallographic orientations of the indented blocks with a high-resolution Scanning Electron Microscope (SEM) of type Quanta FEI 650. This step to identify the imprints within the given microstructure and to determine the position of each residual imprint with respect to the martensitic hierarchy, represents one of the most important points in our study. The crystallographic properties of the surrounding area of each imprint of interest were analyzed and later used as input parameters for the crystal plasticity nanoindentation simulations. The residual imprints identified for the inverse analysis are shown in Figure 2A for 10MnCr8-4 and in Figure 2B for 30MnCr8-4. In addition, Table 2 summarizes the experimentally determined Euler angles used as input values for the numerical part. Residual imprints of indents located in a single martensite packet were characterized using the Atomic Force Microscope (AFM) of CSM Instruments to measure and analyze a high-resolution surface topography up to the nanometer scale (see section 3.2).
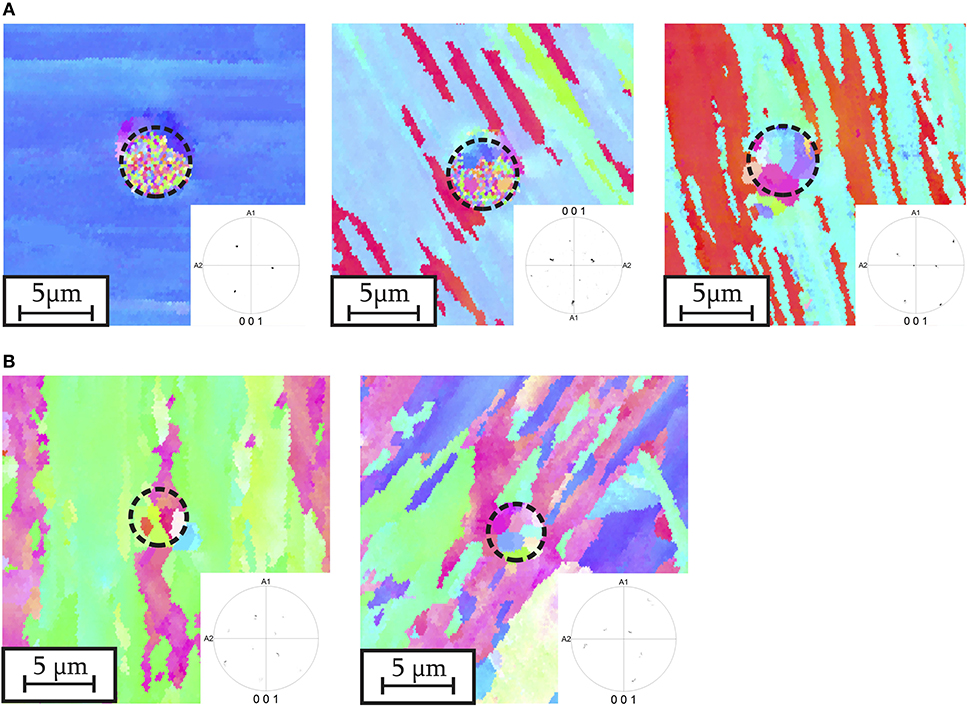
Figure 2. EBSD maps including imprints. (A) Three valid indents in 10MnCr8-4. In addition to the residual imprints, the surrounding microstructure was examined for crystallography and geometry. The residual imprints used for the following inverse analysis are referred to as followed: (left) imprint no. 1., (middle) imprint no. 2 and (right) imprint no. 3. (B) Two valid indents in 30MnCr8-4. In addition to the residual imprints, the surrounding microstructure was examined for crystallography and geometry. The residual imprints used for the following inverse analysis are referred to as followed: (left) imprint no. 1 and (right) imprint no. 2.
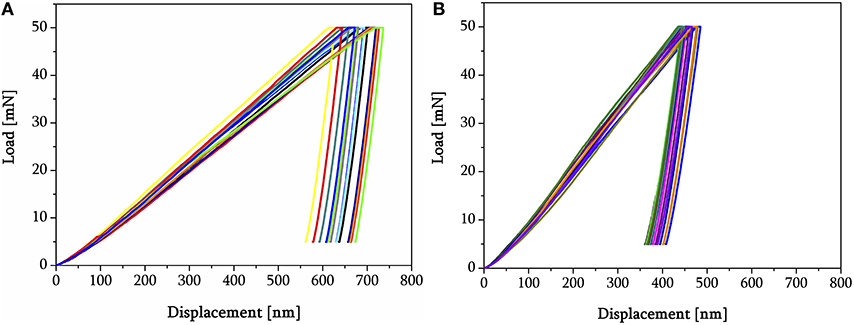
Figure 3. Overview of nanoindentation load-displacement results placed in single lath martensitic packets for both investigated compositions. (A) 10MnCr8-4. (B) 30MnCr8-4.

Table 2. Euler angles, experimentally determined and used as crystallographic input values for nanoindentation simulations.
2.3. Tensile Tests
For the same materials, tensile tests were performed. The representative stress-strain curves providing more information about the material behavior, especially in the context of validation for the optimized crystal plasticity values, are introduced in the following. For each composition, three specimens were cut with the loading axis along rolling direction and taken out from the core of each uncoated hot-rolled steel sheet. Tensile specimens with a gauge diameter of 2 mm and a length of 15 mm were prepared. Tests were performed with a Zwick/Roell tensile testing machine of type Z100 at room temperature with an initial strain rate of 0.5 min−1 and a preload of 25 N. The proof stress Rp0.2, the ultimate tensile strength Rm and the elongation at fracture A5 as well as the total time to fracture are summarized in Table 1. Figure 4 compares two true stress–true strain curves from the mentioned index of materials. The true stress, i.e., the current force acting on the current cross section, was determined for a reference specimen by measuring the remaining gauge diameter with a caliper once the necking occurred. It is apparent that both samples, subjected to the same heat treatment, show far different mechanical characteristics, caused in their individual carbon content. Note that with increasing carbon content, both proof stress Rp,0.2 and ultimate tensile strength Rm increase.
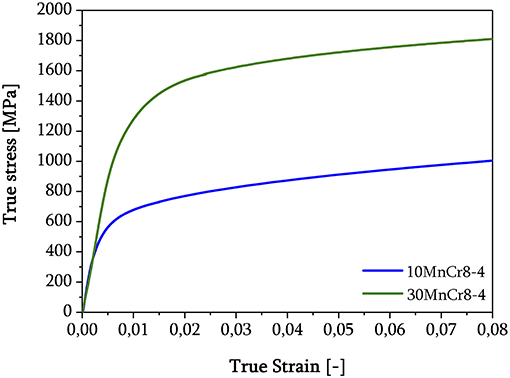
Figure 4. Averages of three stress–strain curves of tensile tests for 10MnCr8-4 and 30MnCr8-4. Note, the necking starts at strain of 2.5% and failure typically at 10%.
2.4. A Non-local Crystal Plasticity Model
In this work, the crystal plasticity (CP) model proposed by Ma and Hartmaier (2014), which extend established CP models (Rice, 1971; Pierce et al., 1982; Kalidindi, 1998) by non-local contributions, was applied and is introduced in the following. One starts with the principle assumption of a multiplicatively decomposed deformation gradient in an elastic and plastic part,
The plastic velocity gradient Lp considers dislocation slip on N slip systems as sole origin of plastic deformations
where is the plastic shear rate, and Mα = dα⊗nα is the Schmid tensor for the slip system α, which is defined by the slip direction dα and the slip plane normal nα. The symbol ⊗ denotes the dyadic product of two vectors resulting in a second rank tensor. Knowing total and plastic deformation gradient, the stress can be calculated using the tensorial form of Hooke's law
The model suggests the flow rule and the hardening law in the following forms
and
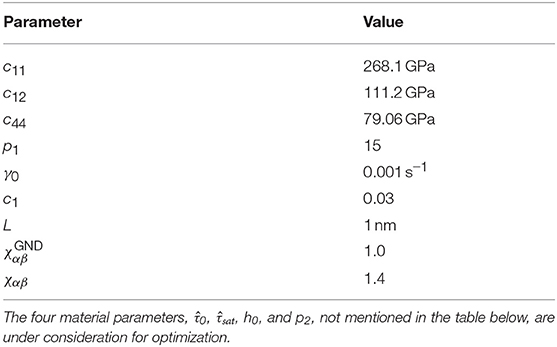
where is the reference shear rate, p1 is the inverse value of the strain rate sensitivity, h0 is the reference hardening parameter, and χαβ is the cross hardening matrix, which is assigned as 1.0 for coplanar slip systems and 1.4 otherwise. is the saturation slip resistance, and p2 is a fitting parameter. The initial value of the slip resistance is defined as . The sign function extracts the sign of a real number. The resolved shear stress τα for each slip system can be calculated from the stress in the intermediate configuration as
As can be seen from the flow rule, Equation (4), two additional terms are added to account for GND hardening. The isotropic term in the denominator considers the hardening effect by additional dislocations, whereas the kinematic term in the nominator can be considered as a back stress term altering the shear stress required to move the dislocations.
The quantitative calculation of the GND terms follows the concept of so-called “super GNDs” densities and requires the evaluation of plastic strain gradients. The second rank dislocation density tensor G in the reference configuration is computed from the curl of Fp as introduced by Nye (1953)
Note that a reconstruction of meaningful crystallographic dislocation populations in a unique way is not possible since the dislocation density tensor only contains information about averages of dislocations and residual Burgers vectors. However, a unique definition of super GNDs can be achieved by projecting the dislocation density tensor to the global Cartesian coordinates of the system. Consequently, the stress fields of the crystallographic GNDs can be described with good accuracy (Ma and Hartmaier, 2014), and the GND density tensor can be separated into nine independent parts by evaluating
where and are permutations of the Cartesian unit vectors and b is the Burgers vector length. The super GND densities α = 1, 2, 3 represent screw-type superdislocations, while the remaining components represent edge-type superdislocations, which are vital for the determination of internal stress fields as a consequence of the super GNDs.
The isotropic hardening for dislocation slip contributed by these super GNDs is expressed in a Taylor-type equation
where c1 is the Taylor hardening coefficient or a geometrical factor and μ is the shear modulus. is the cross hardening matrix between crystallographic mobile dislocations and super GNDs.
The internal stresses caused by GNDs pile-ups at grain boundaries contributes to another hardening effect. This part is calculated by evaluating the second order gradient of Fp, which results in a super GND gradient in the form of
By evaluating these gradients within a small volume of dimension L3, the internal stresses in the intermediate configuration caused by dislocation pile-ups at grain boundaries can be calculated. Thus, the kinematic hardening reads
Within the scope of this study, the aforementioned constitutive laws were directly implemented for the BCC structure. As the crystal structure of the investigated material is BCC, dislocation slip on the common crystallographic 〈111〉{110} slip systems was considered. Although in very recent work (Du et al., 2018) dislocation glide on 〈111〉{112} systems has been observed, the discussion of this research question is still ongoing. In recent work of our group (Engels et al., 2018), we found that considering only slip on 〈111〉{110} systems is completely sufficient to describe the pile-up symmetry of nanoindentations in BCC iron.
To determine the non-local crystal plasticity parameters, the nanoindentation model employed the non-local crystal plasticity model through a user-defined material subroutine (UMAT). The parameters were adapted to fit both load-displacement curves and residual surface topologies. A set of crystal plasticity parameters which were predefined and not part of the optimization space are summarized in Table 3. The values are discussed in detail in section 3.1.
3. Simulation Setup
3.1. Three-Dimensional Nanoindentation Model
A nanoindentation model was created and solved using the finite element software ABAQUS 2017 by Dassault Systèmes (Systemes, 2017). The nanoindentation model was created with the sphero-conical indenter defined as rigid body to exclude tip deformation during nanoindentation simulation. Since the CP model is numerically demanding, a three zone substrate model was built as follows: the inner CP core, which represents the tempered lath martensite, an intermediate frame around this core with a J2-plasticity model (using the stress-strain curves obtained from tensile tests), and an elastic outer shell. The core geometry has the dimensions lx = ly = 25 µm to be comparable to the experimental AFM results of the residual imprints. From the experimental nanoindentation tests it is known that the maximum displacement depth is approximately 700 nm; hence, the core is dimensioned sufficiently large with lz = 13 µm to avoid plastic deformation at the bottom and side interfaces of the core geometry. The maximum number of elements for the representative nanoindentation model of 10MnCr8-4 and 30MnCr8-4 alloy is 58,913, and the core was discretized with brick elements with quadratic shape functions (C3D20). The exact tip radius was determined in SEM at low vacuum to R = 4.95 µm. Block thicknesses were measured to create the core material geometry. The core uses the non-local crystal plasticity formulation with Euler angles assigned to the corresponding block orientations, so that numerical crystallography is implemented as close to the experimental sample conditions as possible. For 10MnCr8-4, a block pattern with (2.5 µm2.5 µm), for 30MnCr8-4, a pattern of (1 µm/5 µm) was used.
The non-local CPFEM nanoindentation simulations mimic the boundary conditions of the experimental nanoindentation experiments, i.e., loading to a maximum force of 50 mN followed by a short holding segment and the subsequent unloading. Loading and unloading were realized with a constant rate of 1 mN/s. Elastic constants were taken from Kim and Johnson (2006), c11 = 268.10 MPa, c12 = 111.20 MPa and c44 = 79.06 MPa. The non-local CPFE nanoindentation model for BCC metals considers shear contributions of 24 slip systems. The cross-hardening matrix χαβ was assumed to have a constant value of 1.4 and describes both coplanar and non-coplanar deformation systems. For the sake of numerical stability in case of the complex contact situation in the nanoindentation model and without loss of generality, the inverse value of the strain rate sensitivity parameter of the flow rule p1 was defined at a rather low value. With a low exponent, the elasto-plastic transition is less pronounced, and hence the numerical solution algorithm for stress and hardening (see Equation 4) becomes more robust, which allows us to cover a wider range of design parameters. Since the loading rates of all considered nanoindentation tests are constant and relatively slow, we do not consider rate effects in experiment or model, which should be valid for small strain rates in general. However, for higher strain rates or varying rates, the CP parameters must be adapted accordingly. For this reason, p1 was assumed to be a constant value of 15, and the reference shear rate is set to 0.001 s−1. With the exception of p1, these choices correspond to the default values described in Ma and Hartmaier (2014). The non-local constitutive model parameter L is chosen according to the average dislocation spacing. The non-local parameter c1, describing the Taylor hardening coefficient, was fitted in a separate work and found to be close to the values we obtained for Armco iron (Engels et al., 2018).
The nanoindentation model is shown in Figure 5A, with a detailed view of the formation of the isotropic GND hardening below the indenter tip in Figure 5B. The crystal plasticity core below the indenter tip including the alternating block structure for both alloys is shown in Figures 5C,D.
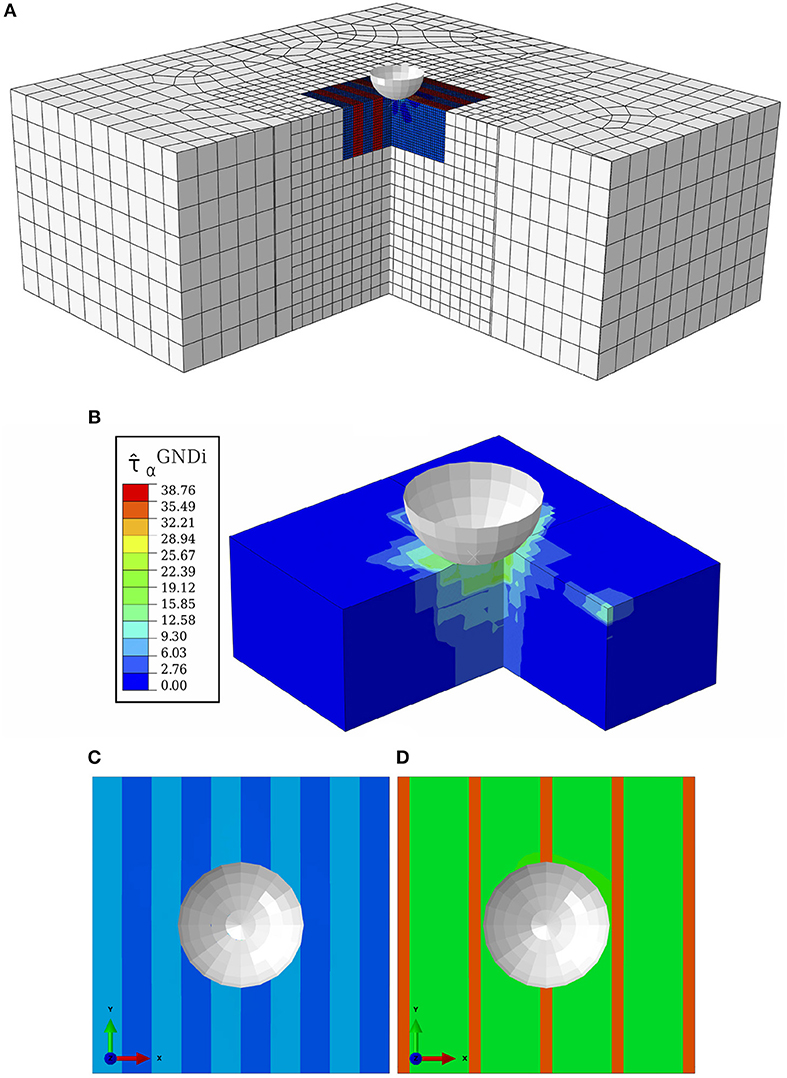
Figure 5. Numerical nanoindentation model with CP material in inner core, embedded by material described by a J2 plasticity model: (A) cut view of the nanoindentation model including the chosen mesh. The mesh becomes coarser from the core to the outside. The visualized alternating block structure in the core of the model is shown. Experimentally determined Euler angles serve as input values. (B) Cut view of crystal plasticity domain in the center, the isotropic part of hardening of geometrically necessary dislocations (in MPa) below the indenter tip is highlighted; (C) simplified alternating block structure for 10MnCr8-4. The block width is 2.5 μm according to experimental observations. (D) Simplified alternating block structure for 30MnCr8-4. The block width alternates from 1 to 5 μm.
3.2. Quantitative Analysis of Residual Imprints
To consistently compare experiments and numerical results in the course of parameter optimization, a topology analysis procedure was developed. Figure 6A shows a residual imprint topology, where colors indicate the vertical displacement u(x, y) of the material.
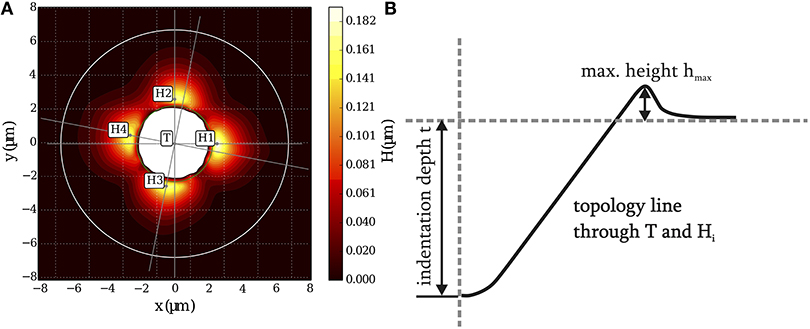
Figure 6. Topology analysis: (A) Contour plot of residual surface topology u(x, y) (surface heights in micron) after residual imprint measured with AFM. Here, only positive values relative to a reference level u0 are shown. Negative values are printed white. The inner circle (rinner) represents the nominal indenter geometry. The outer circle (router) represents the outer radius of evaluation. (B) Schematic illustration of the residual imprint topology identification with quantitative parameters.
Here, only positive values u(x, y)>u0 are shown in color, where
is defined as reference topology level measured along the Nx and Ny edge nodes of the core geometry surface. For the actual characterization, topology lines were created as lines passing through the center (maximum negative displacement) as well as specific local maxima (at pile-ups); see sketch topology in Figure 6B. Because of various different grain orientation symmetries, different types of pile-up patterns may occur. Hence, to obtain a robust algorithm, the following additional requirements for pile-ups were made: (a) pile-ups were ordered by their height, (b) a pile-up must posses a circumferential prominence, i.e., within a section of 30° no other pile-up could be detected, (c) pile-ups were searched within a domain between rinner = 0.9·rtip and router = 2.5·rtip measured from the center of the indent, min(u(x, y)). Using this procedure, we observed a robust and reproducible maxima-detection for both numerics and experiments. Then, topology data were extracted along lines through identified maximum and minimum. The code was implemented in Python.
4. Optimization Procedure
In this work, the general idea of optimization is to mimic nanoindentation response of tempered lath martensitic samples containing two different carbon contents, namely 0.1 and 0.3 wt.-%. Therefore, four adjustable crystal plasticity parameters were chosen. From our previous study Engels et al. (2018) and from literature Chakraborty and Eisenlohr (2017) we learned that , , h0 and p2 are sensitive parameters for nanoindentation and chose them for the present optimization task. The Nelder-Mead method was selected as the optimization algorithm (Nelder and Mead, 1965) because of its robustness of topology fitting. Furthermore as an objective function, a root mean square error was defined for nanoindentation results, load-displacement curves and surface topology data to represent the deviation between simulated and experimentally achieved results.
The general CP parameter optimization procedure can be explained as follows with the help of Figure 7: At the beginning, residual imprints of interest must be identified from the pattern created by automatized indentation. The EBSD data serve this purpose. Only remaining indents located in the middle of a martensite packet are considered as useful. For these indents, Euler angles of the surrounding area of residual imprints using OIM software are determined. Following the non-local crystal plasticity nanoindentation simulations of the respective alloying system and crystallography, the numerical results of the surface topology are evaluated using the algorithm discussed in the previous section. Load-displacement data are obtained from the nodal forces at the tip. The experimental results are then used as reference data to calculate a combined objective function (details in section 4.2), from the individual errors of the surface topology and the load-displacement curve. Based on this, the optimization algorithm is able to adapt a new and more suitable set of CP parameters to start a new optimization loop and minimize the global error. For a global analysis of the adjustable parameter set and their suitable order of magnitude to mimic the microstructural features of tempered lath martensitic samples, a systematic parameter study following a Design of Experiments (DoE) is performed for each residual imprint of optimization. The main purpose for using a parameter study according to a DoE is to define the initial set of CP parameters for the optimization algorithm. In this context, large design spaces are defined for all indents, and for each case the best set of CP parameters with the lowest error obtained from the DoE is selected. In this way, simulation time and number of iterations required to achieve convergence are significantly reduced. Furthermore, the results of this DoE also provide an estimate of the sensitivity of the CP parameters on the surface topology as well as the load-displacement curve of nanoindentation simulations. Detailed information of the DoE is given in the Appendix.
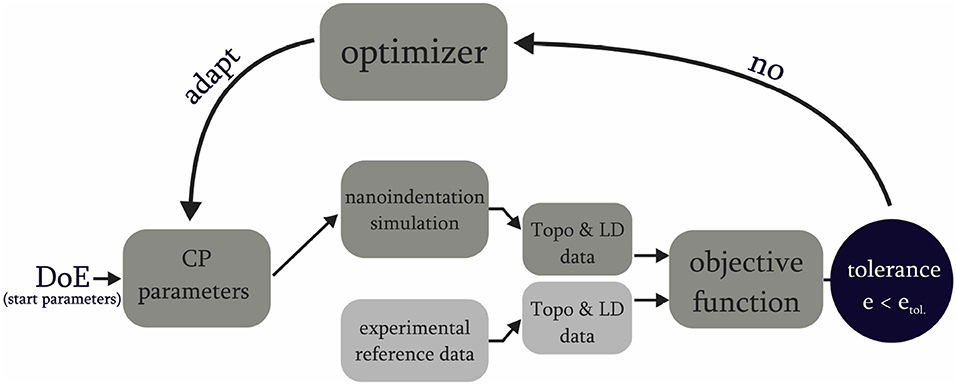
Figure 7. Schematic illustration of iterative design of experiment and optimization setup to identify adjustable parameters from the used crystal plasticity formulation. The tolerance describes the criterion for determining the optimized solution.
4.1. Optimization Algorithm
Owing to the severe numerical effort to parameterize CP parameters from nanoindentation simulations and the limited number of variables, the Nelder-Mead (N-M) algorithm, also known as Downhill Simplex Method, was chosen. The algorithm was originally proposed in Nelder and Mead (1965) and is geometrically intuitive: a space is taken across a subregion and moves from the worst point toward the opposite side of the simplex for better solutions. Within this method, a simplex is created, which is defined as a body in n dimensions, consisting of n+1 vertices. The position of each vertex is defined and describes the simplex completely. An iterative relocation of the worst vertex will take place until the simplex has moved and finally shrunk to the global minimum in the n-dimensional design room. Note, that the Nelder-Mead algorithm is robust for fitting topologies, but requires a lot of iterations to find the global minimum. In the present work, emphasis was put on the robustness of the method rather than on numerical efficiency.
4.2. Objective Function
The aim of the optimization is to determine the best possible parameter set of the crystal plasticity formulation in relation to the experimentally performed nanoindentation experiments on tempered lath martensite. For this purpose, the experimentally evaluated results are passed as reference data in the optimization, and the numerical data resulting from three-dimensional FE nanoindentation experiments are evaluated in the same manner for the sake of comparison.
Both surface topology data and load-displacement curves are used in the objective function. Since the surface topology is a final result that cannot provide direct information about the course during nanoindentation, load-displacement data is also considered. The objective function needs to be minimized
Here, the topology error etot is weighted higher to emphasize the importance of a correct approximation of the pile-up behavior. The first term in Equation (13) reads
where x′ is the coordinate along the surface topology line, N is the number of data points and umin, exp describes the maximum displacement depth of the experimental topology line. The error of the load-displacement curve, eLD, is calculated as the difference of displacement for the same indentation force as
where is the experimental displacement at the indentation force .
Note that the prefactors in Equation (13) do not have any physical meaning and are justified empirically because of the best-obtained optimization results. With the selected objective function and the implemented optimization algorithm, the tolerance criterion for exiting the optimization process is hence defined. However, due to the necessary approximations of the model and unknown parameters of the true microstructure, it cannot be expected that the absolute error converges to a value close to zero, but a finite absolute error must be accepted. The convergence criterion must consequently be based on the change in the error function between two subsequent iteration steps.
The optimization process was conducted in this way: It is initiated with the set of CP parameters obtained from the parameter study according to a DoE and stopped if the absolute difference in etot between two subsequent iterations becomes smaller than 10−4, and the solution is taken as the lowest etot obtained in all iterations. For a complex microstructure like tempered lath martensite combined with CPFE nanoindentation, there is no unambiguous solution to the current state of CP formulation and applied experimental techniques that can map a perfect fit topology as well as load-displacement curves.
Note, that the load-displacement curves alone do not provide any information about the surrounding area, which is also influenced by nanoindentation. Here, above all, the emergence of the pile-up depending on the microstructure, the indentation tip and -force is in focus together with the quality of the used crystal plasticity formulation and its applicability to this very complex microstructure.
5. Optimization Results
The results of the optimizations are presented in Figure 8 (10MnCr8-4) and Figure 9 (30MnCr8-4) and in Table 4. In total, three residual imprints were identified in the lath martensitic microstructure of 10MnCr8-4, which is located in the middle of a single martensite packet. In the simulation, the three imprints were placed in an alternating block structure with a thickness of 2.5 μm each. The block orientations were evaluated with the help of EBSD data and assigned to the nanoindentation model. For the tempered lath martensite 10MnCr8-4, the criteria for terminating the optimization of indent no. 1, 2, and 3 were met at the iteration step 50, 52, and 54, respectively. For the tempered lath martensite 30MnCr8-4, the optimizations of the indent no. 1 and 2 were stopped at the iteration step 44 and 42, respectively.
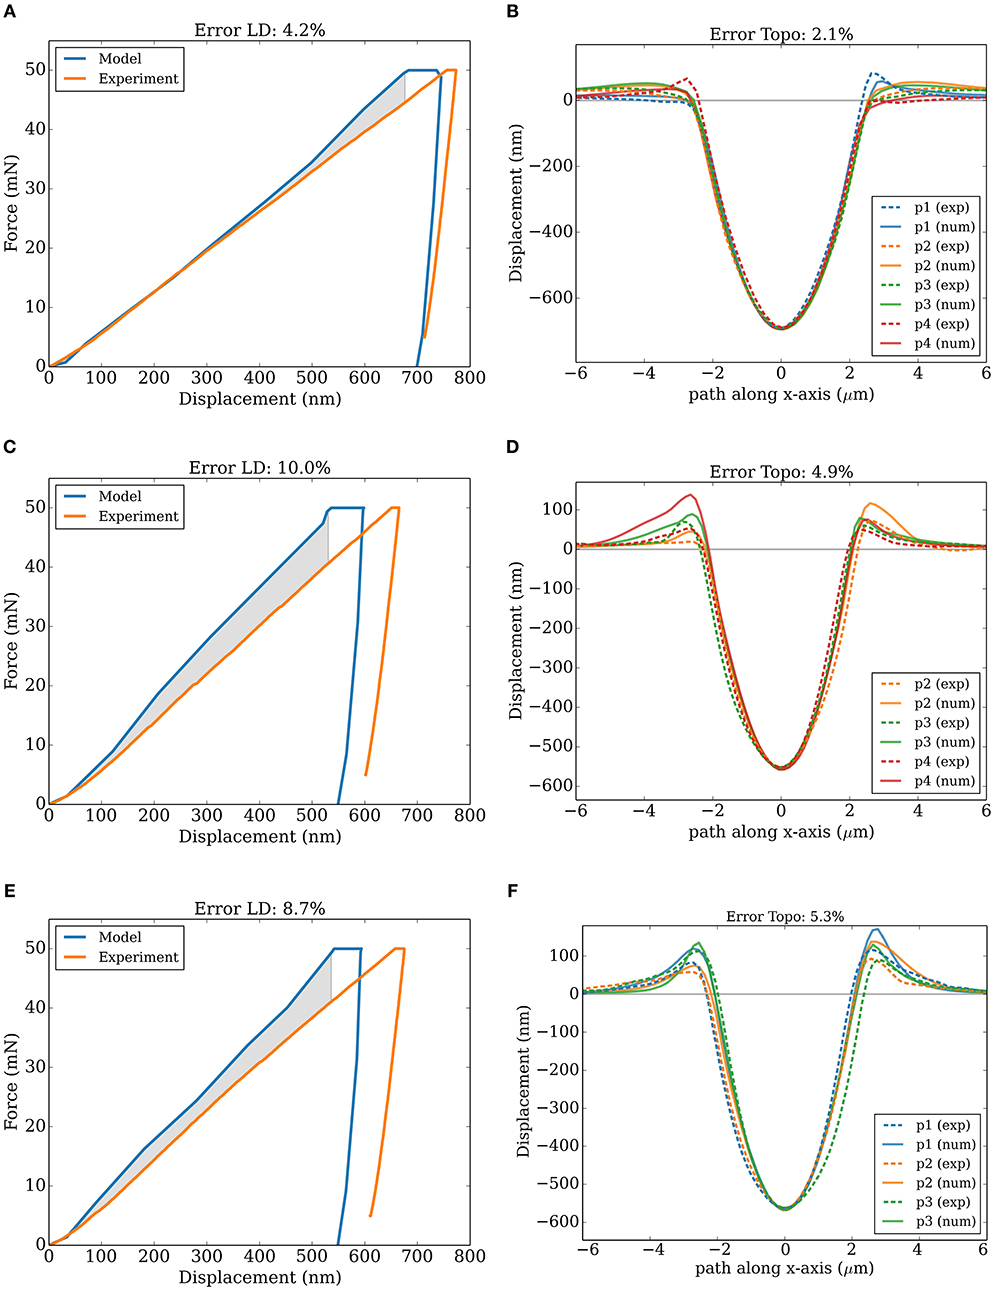
Figure 8. Experimental materials' response to nanoindentation (dashed profile lines, p1 – p4 (exp)) and the numerical fit result (solid lines, p1 – p4 (num)) for three representative residual imprints of alloy 10MnCr8-4. (A,C,E) load-displacement curves and (B,D,F) surface topology lines through each maximum pile-up characteristic. The first row, (A,B), represents the final result of parameterization of indent no. 1, the second row, (C,D), of indent no. 2 and the last row, (E,F), indent no. 3. Please note that Error LD is 1/3 eLD and Error Topo is 2/3 eTopo.
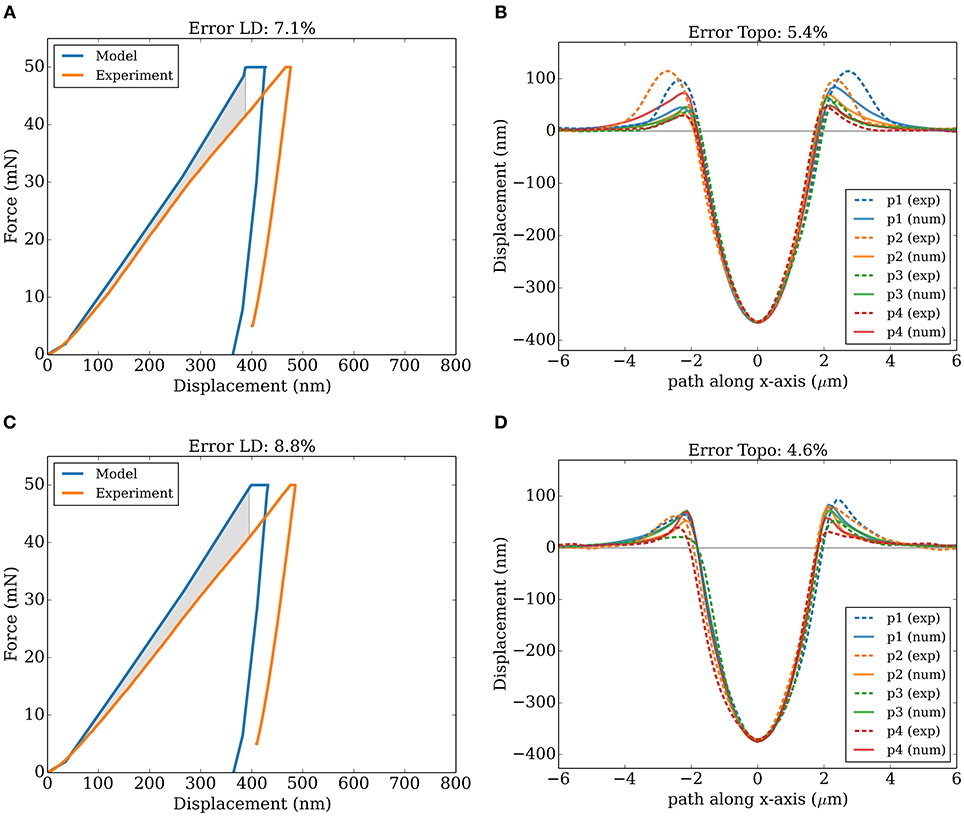
Figure 9. Experimental materials' response to nanoindentation (dashed profile lines, p1 – p4 (exp)) and the numerical fit result (solid lines, p1 – p4 (num)) for two representative residual imprints of alloy 30MnCr8-4. (A,C) load-displacement curves, (B,D) surface topology lines through each maximum pile-up. The first row, (A,B), represents the final result of parameterization of indent no. 1, the second row, (C,D), of indent no. 2.Please note that Error LD is 1/3 eLD and Error Topo is 2/3 eTopo.

Table 4. Identified constitutive crystal plasticity material model parameters of three residual imprints for 10MnCr8-4 alloy and of two residual imprints for 30MnCr8-4 alloy.
On the left side of Figure 8, three individual results are shown in terms of load-displacement curves and on the right side in terms of surface topology lines. Figures 8A,B represent the results of the first residual imprint, Figures 8C,D show the second, and Figures 8E,F the third residual imprint. While a good agreement can be observed for the comparison of the surface topology lines of all three indents, the simulated load-displacement curves of indent number two and three differ slightly in the residual displacement. For this reason, the total error etot is higher, namely between 6.3% and 14.9% for 10MnCr8-4. We relate the significant total error to necessary approximations and unknown parameters that have to be accepted when describing a complex microstructure like tempered lath martensite. Hence, even with a sophisticated non-local crystal plasticity model one cannot expect an absolute accuracy of the description of the plastic deformation on the microstructural level. Compared to previous studies on single crystalline areas, see e.g., Engels et al. (2018), which is a much simpler case, typically a better absolute error can be achieved. However, even in such relatively simple cases numerical modeling cannot be expected to match the experiment with absolute precision. As described before, this algorithm is not fast, but robust and reliable in topology fitting. For this example, 27 iterations (on average) were required to minimize the objective function.
Figure 9 represents the final fitting results for two residual imprints of 30MnCr8-4 for which the crystal plasticity parameters were optimized. Therefore, numerical nanoindentation tests were performed in a block structure, having an alternating width of 1 μm and 5 μm. As for 10MnCr8-4, a small difference in total displacement depth between load-displacement data and surface topology lines can be observed.
6. Validation
To bridge the scale from the single crystalline material to the technically relevant dimension, one has to taken into account the heterogeneous properties of a polycrystal, which can be represented by the locally optimized CP parameters. A numerical volume to mimic the polycrystalline microstructure is denoted as the representative volume element (RVE). Here, RVEs were used to validate the optimized parameter sets of the two martensitic steels. In the present work, this RVE does not attempt to geometrically map the complex martensitic microstructure, but only represents the volume fractions of the particular orientations.
The presented RVE comprises 729 grains in total, each representing a martensite packet. The volume is discretized by 19,683 linear C3D8 elements with a total size of 202.5 × 202.5 × 202.5 μm and 9 × 9 × 9 cubic grains. Each of these cubic grains consists of 3 × 3 × 3 elements. This RVE size corresponds to the averaged calculated packet size of 22.5 μm of the used martensitic alloys. Random crystallographic orientation is chosen. Again, Abaqus and the in-house crystal plasticity UMAT were used.
The RVE of the investigated tempered lath martensitic microstructures is shown in Figure 10.
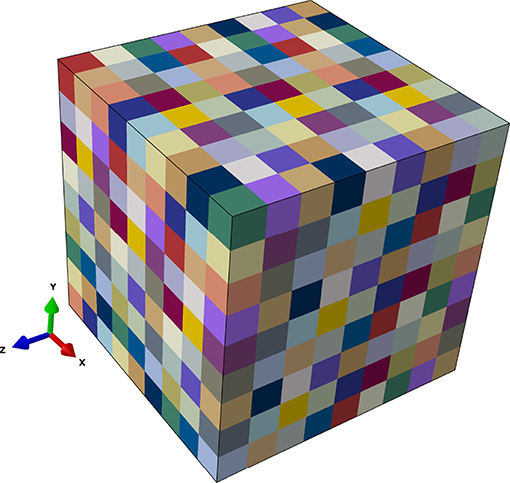
Figure 10. Representative volume element of tempered lath martensitic microstructure. The grain size is chosen according to the microstructural features of parameterized alloys. RVE contains 729 grains with random grain orientation.
To calculate the effective material properties of the RVE, a common homogenization technique is applied. Therefore, it is assumed that the stress of the entire RVE is an arithmetic average over the entire volume. With equally sized sub-volumes, the stress becomes
The question, whether stress- or strain-based boundary conditions are more appropriate for the experimentally measured setup is circumvented by using periodic boundary conditions (PBCs) on the boundaries of the RVE. PBCs are able to constrain the relative displacement between opposing nodes to be the same by coupling. Therefore, reference vertex points, located at each corner of the current RVE, are imposed to the global boundary conditions and strain. Precisely, we use the three-dimensional extension of the concept of Smit et al. (1998); a detailed description of this extension can be found in the work of Boeff (2016). Displacements on one side of the volume are coupled to a corresponding node on the other side.
Figure 11 shows the stress-strain curves of the numerical tensile tests of the polycrystalline RVE for 10MnCr8-4 and 30MnCr8-4. Both simulations were employed with CP model parameters of , , h0, p2 from the optimization. The fixed set of crystal plasticity parameters is summarized in Table 3. The black dashed line corresponds to the experimentally measured stress-strain curve of both alloys. In contrast, the colored solid lines represents the numerical stress-strain curve of both RVEs.
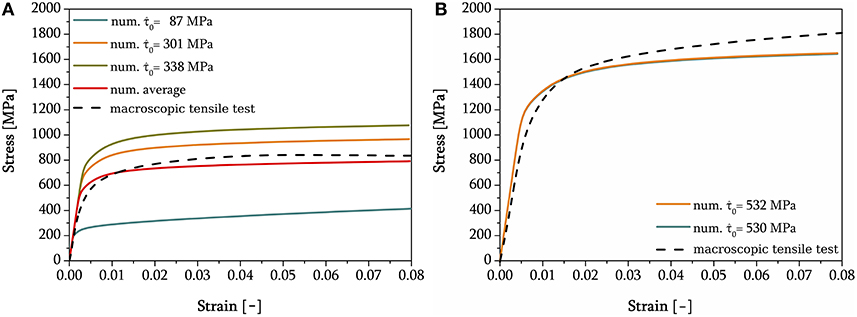
Figure 11. Numerical and experimental true stress–true strain curves of tensile tests for both alloys. Numerical results calculated with polycrystalline representative volume element of Figure 10 obtained with different sets of adjusted CP model parameters. Note, for graphical reasons (B) does not contain an averaged curve. (A) 10MnCr8-4. (B) 30MnCr8-4.
For validation of 10MnCr8-4, the optimized CP values of the residual imprints were averaged, such that the fitted parameters' ability to represent the polycrystalline material behavior can be tested. The representative CP parameters , , h0 and p2 were optimized for a total of three residual imprints and the underlying block structure. These three residual imprints had different crystal properties and a large scatter in their local nanoindentation as well as tensile test results. If these three fitted parameter sets were averaged to reflect the polycrystalline materials' response of 10MnCr8-4, they would represent the polycrystalline material behavior of the used material which is shown as a red solid line in Figure 11A. In the case of 30MnCr8-4, the crystal plasticity parameters for two different residual imprints in different crystallographic regions were optimized. The final sets of parameters are summarized in Table 4. Here, an average of the two optimized sets of parameters is obsolete, since the two parameterized sets, and especially , are very close to each other.
7. Discussion
In the following, individual aspects of the tasks required to perform an inverse analysis for such a complex microstructure are discussed together with the specific results of this investigation.
In total, 96 nanoindentations were carried out on two tempered lath martensite samples of differing carbon contents. Here, a sphero-conical tip with a nominal radius of 5 μm was chosen for two reasons: to be able to recover the imprints in the final SEM and AFM measurements and to have an indent size related to the packet dimensions. Only five (three for 10MnCr8-4 and two for 30MnCr8-4) residual imprints were identified as valid for further inverse analysis in terms of the position of the imprint (i.e., no contact to prior austenite grain- or packet boundaries), block structure (i.e., similar block width) and varying crystallographic orientation sets. The load-displacement curves shown in Figure 3 reveal two prominent results: hardness increases with increasing carbon content (and hence a finer microstructure), and the distribution of the resulting hardness narrows for the same reason. With decreasing average grain size and constant tip size, the dominant effect of the individual block behavior is reduced; instead, a heterogeneous response of multiple, finer blocks results. This can be seen by comparing the indented area of the EBSD images in Figures 2A,B.
But not only the pure number of blocks below the indenter is relevant, also the presence of geometrically necessary dislocation accumulation close to grain boundaries must be considered. This has been shown experimentally by Yang and Vehoff (2007) and, very recently, by discrete dislocation dynamic simulations of Lu et al. (2019). Figure 12 shows a view through the indented model in our simulations. Colors represent the isotropic hardening part of GND's. As can be seen, the magnitude is correlated to the block width, and strong gradients can be seen close to block boundaries. Consequently, the calibration of a crystal plasticity model for lath martensite on the packet scale must not omit these effects. In this work, a nanoindentation model of a packet structure was created, mimicking width and crystal orientations of adjacent blocks obtained from EBSD measurements. For both alloys, the numerical optimization led to a minimum error with a dominating parameter ; the other three free parameters converged to common values. In the case of 10MnCr8-4, the variance in parameter (residual imprint no. 1 is softer than the two others) can be explained by an extraordinary large domain without block boundaries (see Figure 2A, left). This scatter in is accounted for in the polycrystalline simulation by averaging the optimized CP parameters. In the case of 30MnCr8-4, for multiple imprints very similar CP parameters have been found through optimization. Even more, this set directly led to good agreements in terms of the macroscopic stress-strain response as shown in Figure 11. In the work of Chakraborty and Eisenlohr (2017), the robustness of parameter identification against the orientation of indented single (cubic) crystals has been demonstrated, which eases the entire inverse analysis process. In view of our results for lath martensite, we recognize that this observation cannot be directly transferred to heterogeneous microstructures. For our microstructure, we note that a scatter in values exists, but is not caused by differences in the crystallographic orientation, which are implicitly covered by the CP model. The recently identified grain boundary sliding mechanisms in lath martensite, see e.g., Du et al. (2016), have not been considered in this work. In spite of their contribution in tensile tests with well-defined boundary and tensile orientation, their contribution to bulk material is not yet understood. In our numerical setup, the vertical arrangement of the block boundaries parallel to the principle loading direction leads to a low resolved shear stress and hence does not promote this effect. In the nanoindentation experiment, we must assume this parallelism since the EBSD information is two-dimensional.
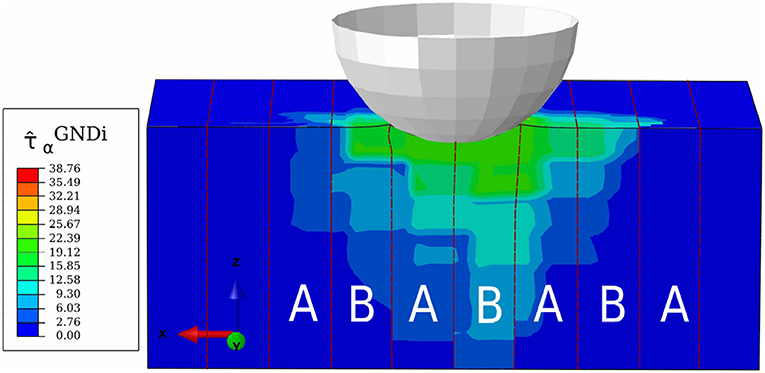
Figure 12. Distribution of isotropic GND hardening (MPa) below the indenter tip after numerical nanoindentation. The red dashed line represents the block boundaries and the characters the alternating crystallographic features.
Recently, Archie et al. (2018) experimentally determined considerable residual stresses in a lath martensite microstructure by using a micro ring-core milling technique. It could be shown that anisotropically distributed residual micro-stresses correlate with the morphology and lath crystallography. As the optimization of parameter , describing the critical resolved shear stress before work hardening takes place, shows certain scatter after optimization, it can be assumed that this is caused by residual stresses which could not be considered in the numerical model. Depending on the different martensite packet sizes and crystallographic orientations, the residual micro-stresses are different due to their complex and rapid phase transformation from the parental phase austenite to lath martensite.
A typical challenge for optimization tasks is the proper choice of the objective function. The topology evaluation method proposed in this study has the advantage, that all maxima with a certain prominence are captured, which could not be guaranteed with alternative, e.g., circular evaluation with fixed radii around the indent. Another advantage of this choice is that no in-plane rotation operation must be performed to align numerical and experimental data. The topology evaluation method of the present study is a further development of Schmaling and Hartmaier (2012). We noted, that the topology error was dominated by the correct match of the indentation depth, which could be enhanced by a weighting of positive and negative displacements in the error determination or by a limitation to positive displacement information. Further, we noted that once the overall indentation depth was met by the optimizer, some of the pile-up error was not within the degrees of freedom of the numerical problem due to varying effects close to the indenter or symmetry deviations in the experiment.
For less-pronounced pile-ups, the numerical modeling error due to the finite element mesh, friction or other effects might inhibit a numerical evaluation with the goal to identify parameters. Further, the effect of an imperfect indenter shape (deviation from the perfect sphere used in the finite element analysis) has shown to be responsible for deviations of the load-displacement curve in inverse analysis (Tyulyukovskiy and Huber, 2007). The authors suggest a correction by means of a neural network approach which is applicable for this study as well. Note that consideration of the load-displacement curve is necessary to capture strain rate effects. In this work, the indentation velocity has been chosen to be slow enough to allow the material to relax entirely.
8. Conclusion
The micromechanical modeling of a technically relevant, highly complex microstructure, here tempered lath martensite, is tackled with an inverse method to parameterize a non-local crystal plasticity (CP) model. The strong heterogeneity on the important length scales is not only the key to beneficial material properties, but also a challenge for quantitative modeling.
In this work, individual aspects for the calibration of a material model by means of nanoindentation were discussed and existing literature was reviewed. Full-field, 3D finite element simulations of nanoindentation were performed. Despite the huge numerical effort required to solve the sensitive contact problem, the overall required computation time remained applicable. A crystal-plasticity model was used, which takes into account isotropic and kinematic hardening from geometrically necessary dislocations (GNDs), which we consider significant for plasticity in tempered lath-martensite. A simple block structure was modeled to enforce the presence of GND pile-up perpendicular to the indentation direction. The width of blocks was obtained from EBSD statistics. The main insight gained by this work includes:
• An alternative evaluation method of the pile-up pattern to be robust for both numerical and experimental data, also in view of different symmetries or artifacts.
• An inverse analysis for the determination of constitutive parameters in martensitic steels from nanoindentation. We also found that the initial resolved shear stress is a dominating parameter.
• An inhomogeneous residual micro-stress distribution in martensite packets occurred during the phase transition process, which could result in different initial packet states. Such phenomena lead to a large scattering in nanoindentation results and in optimized -values in case of 10MnCr8-4.
• Validation of the micromechanical model with a macro-tensile test is possible even for a small number of indents.
The present study demonstrates that the successful parameterization of CP model parameters, which has been demonstrated for single crystals in various publications, can also be performed for complex substructures like tempered lath martensite. It requires a dedicated continuum and CP description of the mechanics on the sub-micrometer scale, a mostly automatized evaluation of experimental and numerical testing to obtain an efficient objective function of the optimization problem, and accurate EBSD and better AFM measurements.
For further improvement, emphasis must be put on statistical evaluations of the influence of block width and an increase of the number of valid indents. In the course of this study, we learned that for a reliable assessment far more experimental nanoindentations are beneficial in order to be able to parameterize them with the help of an appropriate optimization. We note that with a modern, high throughput indentation and EBSD technique, such testing becomes less involved, and the statistical certainty could be increased easily.
Data Availability Statement
The datasets generated for this study are available on request to the authors.
Author Contributions
JE: experimental and numerical work, optimization. NV: RVE generation. AH: non-local crystal plasticity modeling.
Funding
The authors would like to thank the sponsors of the project Damage Tolerant Microstructures in Steel, thyssenkrupp Steel Europe AG, Benteler Steel Tube GmbH and the support by the DFG Open Access Publication Funds of the Ruhr-Universität Bochum. Furthermore, we gratefully acknowledge the support of our colleague Abhishek Biswas for his assistance.
Conflict of Interest
The authors declare that the research was conducted in the absence of any commercial or financial relationships that could be construed as a potential conflict of interest.
References
Acar, P., Ramazani, A., and Sundararaghavan, V. (2017). Crystal plasticity modeling and experimental validation with an orientation distribution function for Ti-7Al alloy. Metals 7:459. doi: 10.3390/met7110459
Archie, F., Mughal, M., Sebastiani, M., Bemporad, E., and Zaefferer, S. (2018). Anisotropic distribution of the micro residual stresses in lath martensite revealed by fib ring-core milling technique. Acta Mater. 150, 327–338. doi: 10.1016/j.actamat.2018.03.030
Arsenlis, A., and Parks, D. (1999). Crystallographic aspects of geometrically-necessary and statistically-stored dislocation density. Acta Mater. 47, 1597–1611. doi: 10.1016/S1359-6454(99)00020-8
Arsenlis, A., Parks, D. M., Becker, R., and Bulatov, V. V. (2004). On the evolution of crystallographic dislocation density in non-homogeneously deforming crystals. J. Mech. Phys. Solids 52, 1213–1246. doi: 10.1016/j.jmps.2003.12.007
Ashby, M. F. (1970). The deformation of plastically non-homogeneous materials. Philos. Mag. 21, 399–424. doi: 10.1080/14786437008238426
Becker, R. (1998). Effects of strain localization on surface roughening during sheet forming. Acta Mater. 46, 1385–1401. doi: 10.1016/S1359-6454(97)00182-1
Bertin, M., Du, C., Hoefnagels, J., and Hild, F. (2016). Crystal plasticity parameter identification with 3d measurements and integrated digital image correlation. Acta Mater. 116, 321–331. doi: 10.1016/j.actamat.2016.06.039
Bhadeshia, H., and Honeycombe, R. (2006). Steels; Microstructure and Properties. Oxford, UK: Butterworth-Heinemann, Imprint of Elsevier.
Boeff, M. (2016). Micromechanical modelling of fatigue crack initiation and growth. (Ph.D. thesis). Ruhr-Universität Bochum, Bochum, Germany.
Bolzon, G., Maier, G., and Panico, M. (2004). Material model calibration by indentation, imprint mapping and inverse analysis. Int. J. Solids Struct. 41, 2957–2975. doi: 10.1016/j.ijsolstr.2004.01.025
Bucaille, J., Stauss, S. E. F., and Michler, J. (2003). Determination of plastic properties of metals by instrumented indentation using different sharp indenters. Acta Mater. 51, 1663–1678. doi: 10.1016/S1359-6454(02)00568-2
Chakraborty, A., and Eisenlohr, P. (2017). Evaluation of an inverse methodology for estimating constitutive parameters in face-centered cubic materials from single crystal indentations. Eur. J. Mech. A 66, 114–124. doi: 10.1016/j.euromechsol.2017.06.012
Chen, X., Ogasawara, N., Zhao, M., and Chiba, N. (2007). On the uniqueness of measuring elastoplastic properties from indentation: the indistinguishable mystical materials. J. Mech. Phys. Solids 55, 1618–1660. doi: 10.1016/j.jmps.2007.01.010
Chollacoop, N., Dao, M., and Suresh, S. (2003). Depth-sensing instrumented indentation with dual sharp indenters. Acta Mater. 51, 3713–3729. doi: 10.1016/S1359-6454(03)00186-1
Du, C., Hoefnagels, J., Vaes, R., and Geers, M. (2016). Plasticity of lath martensite by sliding of substructure boundaries. Script. Mater. 120, 37–40. doi: 10.1016/j.scriptamat.2016.04.006
Du, C., Maresca, F., Geers, M., and Hofnagels, J. (2018). Ferrite slip system activation investigated by uniaxial micro-tensile tests and simulations. Acta Mater. 146, 314–327. doi: 10.1016/j.actamat.2017.12.054
Durst, K., Göken, M., and Phar, G. (2008). Indentation size effect in spherical ans pyramidal indentations. J. Phys. D 41:074005. doi: 10.1088/0022-3727/41/7/074005
Engels, J. K., Gao, S., Amin, W., Biswas, A., Kostka, A., Vajragupta, N., et al. (2018). Indentation size effects in spherical nanoindentation analyzed by experiment and nonlocal crystal plasticity. Materialia 3, 21–30. doi: 10.1016/j.mtla.2018.09.032
Evers, L., Brekelmans, W., and Geers, M. (2004). Non-local crystal plasticity model with intrinsic SSD and GND effects. J. Mech. Phys. Solids 52, 2379–2401. doi: 10.1016/j.jmps.2004.03.007
Fleck, N., and Hutchinson, J. (1993). A phenomenological theory for strain gradient effects in plasticity. J. Mech. Phys. Solids 41, 1825–1857. doi: 10.1016/0022-5096(93)90072-N
Fleck, N., and Hutchinson, J. (1997). A reformulation of strain gradient plasticity. J. Mech. Phys. Solids 49, 2245–2271. doi: 10.1016/S0022-5096(01)00049-7
Galindo-Nava, E., and del Castillo, P. R.-D. (2015). A model for the microstructure behaviour and strength evolution in lath martensite. Acta Mater. 98, 81–93. doi: 10.1016/j.actamat.2015.07.018
Haj-Ali, R., Kim, H., Koh, S., Saxena, S., and Tummala, R. (2008). Nonlinear constitutive models from nanoindentation tests using artificial neural networks. Int. J. Plast. 24, 371–396. doi: 10.1016/j.ijplas.2007.02.001
Han, F., Tang, B., Kou, H., Li, J., Wu, W., and Feng, Y. (2016). Nonlocal Crystal Plasticity Finite Element Simulations of Nanoindentation on T-6-4V Alloy, Chap. 315. Hoboken, NJ: Wiley-Blackwell, 1887–1891. doi: 10.1002/9781119296126.ch315
Heinrich, C., Waas, A., and Wineman, A. (2009). Determination of material properties using nanoindentation and multiple indenter tips. Int. J. Solids Struct. 46, 364–376. doi: 10.1016/j.ijsolstr.2008.08.042
Huber, N., and Tsakmakis, C. (1999). Determination of constitutive properties from spherical indentation data using neural networks. part II: plasticity with nonlinear isotropic and kinematic hardening. J. Mech. Phys. Solids 47, 1589–1607. doi: 10.1016/S0022-5096(98)00110-0
Hutchinson, B., Hagström, J., Karlsson, O., Lindell, D., Tornberg, M., Lindberg, F., et al. (2011). Microstructures and hardness of as-quenched martensites (0.1–0.5). Acta Mater. 59, 5845–5858. doi: 10.1016/j.actamat.2011.05.061
Jiang, J., Fasth, A., Nylén, P., and Choi, W. B. (2009). Depth-sensing instrumented indentation with dual sharp indenters. J. Ther. Spray Technol. 18, 194–200. doi: 10.1007/s11666-009-9310-9
Kalidindi, S. R. (1998). Incorporation of deformation twinning in crystal plasticity models. J. Mech. Phys. Solids 46, 267–290. doi: 10.1016/S0022-5096(97)00051-3
Khan, M., Hainsworth, S., Fitzpatrick, M., and Edwards, L. (2010). A combined experimental and finite element approach for determining mechanical properties of aluminium alloys by nanoindentation. Comput. Mater. Sci. 49, 751–760. doi: 10.1016/j.commatsci.2010.06.018
Kim, S., and Johnson, W. L. (2006). Elastic constants and internal friction of martensitic steel, ferritic pearlitic steel, and α iron. Mater. Sci. Eng. A 452–453, 633–639. doi: 10.1016/j.msea.2006.11.147
Kitahara, H., Ueji, R., Tsuji, N., and Minamino, Y. (2006). Crystallographic features of lath martensite in low-carbon steel. Acta Mater. 54, 1279–1288. doi: 10.1016/j.actamat.2005.11.001
Kitahara, H., Ueji, R., Ueda, M., Tsuji, N., and Minamino, Y. (2005). Crystallographic analysis of plate martensite in Fe-28.5 at.% Ni by FE-SEM/EBSD. Acta Mater. 54, 378–386. doi: 10.1016/j.matchar.2004.12.015
Lee, J., Kim, B., and Lee, H. (2010). A study on robust indentation techniques to evaluate elastic–plastic properties of metals. Int. J. Solids Struct. 47, 647–664. doi: 10.1016/j.ijsolstr.2009.11.003
Lee, J., Lee, C., and Kim, B. (2009). Reverse analysis of nano-indentation using different representative strains and residual indentation profiles. Mater. Design 30, 3395–3404. doi: 10.1016/j.matdes.2009.03.030
Liu, M., Lu, C., Tieu, K. A., Peng, C.-T., and Kong, C. (2015). A combined experimental-numerical approach for determining mechanical properties of aluminum subjects to nanoindentation. Sci. Rep. 5:15072 EP. doi: 10.1038/srep15072
Lu, S., Zhang, B., Li, X., Zhao, J., Zaiser, M., Fan, H., et al. (2019). Grain boundary effect on nanoindentation: a multiscale discrete dislocation dynamics model. J. Mech. Phys. Solids 126, 117–135. doi: 10.1016/j.jmps.2019.02.003
Ma, A., and Hartmaier, A. (2014). On the influence of isotropic and kinematic hardening caused by strain gradients on the deformation behaviour of polycrystals. Philos. Mag. 94, 125–140. doi: 10.1080/14786435.2013.847290
Maresca, F., Kouznetsova, V., and Geers, M. (2014). Subgrain lath martensite mechanics: a numerical–experimental analysis. J. Mech. Phys. Solids 73, 69–83. doi: 10.1016/j.jmps.2014.09.002
Meng, L., Breitkopf, P., Raghavan, B., Mauvoisin, G., Bartier, O., and Hernot, X. (2015). Identification of material properties using indentation test and shape manifold learning approach. Comput. Methods Appl. Mech. Eng. 297, 239–257. doi: 10.1016/j.cma.2015.09.004
Mine, Y., Hirashita, K., Takashima, H., Matsuda, M., and Takashima, K. (2013). Micro-tension behaviour of lath martensite structures of carbon steel. Mater. Sci. Eng. 560, 535–544. doi: 10.1016/j.msea.2012.09.099
Morito, S., Huang, X., Furuhara, T., Maki, T., and Hansen, N. (2006). The morphology and crystallography of lath martensite in alloy steels. Acta Mater. 54, 5323–5331. doi: 10.1016/j.actamat.2006.07.009
Morito, S., Tanaka, H., Konishi, R., Furuhara, T., and Maki, T. (2003). The morphology and crystallography of lath martensite in Fe-C alloys. Acta Mater. 51, 1789–1799. doi: 10.1016/S1359-6454(02)00577-3
Morsdorf, L., Jeannin, O., Barbier, D., Mitsuhara, M., Raabe, D., and Tasan, C. (2016). Multiple mechanisms of lath martensite plasticity. Acta Mater. 121, 202–214. doi: 10.1016/j.actamat.2016.09.006
Moussa, C., Hernot, X., Bartier, O., Delattre, G., and Mauvoisin, G. (2014). Evaluation of the tensile properties of a material through spherical indentation: definition of an average representative strain and a confidence domain. J. Mater. Sci. 49, 592–603. doi: 10.1007/s10853-013-7739-1
Muliana, A., Haj-Ali, R. M., Steward, R., and Saxena, A. (2002). Artificial neural network and finite element modeling of nanoindentation tests. Metallur. Mater. Trans. A 33, 1939–1947. doi: 10.1007/s11661-002-0027-3
Nelder, J., and Mead, R. (1965). A simplex method for function minimization. Comput. J. 7, 308–313. doi: 10.1093/comjnl/7.4.308
Nix, W., and Gao, H. (1998). Indentation size effects in crystalline metals: a law for strain gradient plasticity. J. Mech. Phys. Solids 46, 411–425. doi: 10.1016/S0022-5096(97)00086-0
Nye, J. (1953). Some geometrical relations in dislocated crystals. Acta Metallur. 1, 153–162. doi: 10.1016/0001-6160(53)90054-6
Ogasawara, N., Chiba, N., and Chen, X. (2005). Representative strain of indentation analysis. J. Mater. Sci. 20, 2225–2234. doi: 10.1557/JMR.2005.0280
Ogasawara, N., Chiba, N., and Chen, X. (2006). Limit analysis-based approach to determine the material plastic properties with conical indentation. J. Mater. Sci. 21, 947–957. doi: 10.1557/jmr.2006.0108
Petryk, H., Stupkiewicz, S., and Kucharski, S. (2017). On direct estimation of hardening exponent in crystal plasticity from the spherical indentation test. Int. J. Solids Struct. 112, 209–221. doi: 10.1016/j.ijsolstr.2016.09.025
Phadikar, J., Bogetti, T., and Karlsson, A. (2013). On the uniqueness and sensitivity of indentation testing of isotropic materials. Int. J. Solids Struct. 50, 3242–3253. doi: 10.1016/j.ijsolstr.2013.05.028
Pierce, D., Asaro, R., and Needleman, A. (1982). An analysis of nonuniform and localized deformation in ductile single crystals. Acta Metallur. 30, 1087–1119. doi: 10.1016/0001-6160(82)90005-0
Rauchs, G., and Bardon, J. (2011). Identification of elasto-viscoplastic material parameters by indentation testing and combined finite element modelling and numerical optimization. Finite Elements Anal. Design 47, 653–667. doi: 10.1016/j.finel.2011.01.008
Reuber, C., Eisenlohr, P., Roters, F., and Raabe, D. (2014). Dislocation density distribution around an indent in single-crystalline nickel: Comparing nonlocal crystal plasticity finite-element predictions with experiments. Acta Mater. 71, 333–348. doi: 10.1016/j.actamat.2014.03.012
Rice, J. (1971). Inelastic constitutive relations for solids: an internal theory and its application to metal plasticity. J. Mach. Phys. Solids 19, 433–455. doi: 10.1016/0022-5096(71)90010-X
Roters, F., Eisenlohr, P., Bieler, T., and Raabe, D. (2010). Crystal Plasticity Finite Element Methods. Weinheim: Wiley-VCH Verlag GmbH & Co KGaA.
Sachtleber, M., Zhao, Z., and Raabe, D. (2002). Experimental investigation of plastic grain interaction. Mater. Sci. Eng. 336, 81–87. doi: 10.1016/S0921-5093(01)01974-8
Schmaling, B., and Hartmaier, A. (2012). Determination of plastic material properties by analysis of residual imprint geometry of indentation. J. Mater. Res. 27, 2167–2177. doi: 10.1557/jmr.2012.212
Smit, R., Brekelmans, W., and Meijer, H. (1998). Prediction of the mechanical behavior of nonlinear heterogeneous systems by multi-level finite element modeling. Comput. Methods Appl. Mech. Eng. 155, 181–192. doi: 10.1016/S0045-7825(97)00139-4
Swadener, J., George, E., and Pharr, G. (2002). The correlation of the indentation size effect measured with indenters of various shapes. J. Mech. Phys. Solids 50, 681–694. doi: 10.1016/S0022-5096(01)00103-X
Tyulyukovskiy, E., and Huber, N. (2007). Neural networks for tip correction of spherical indentation curves from bulk metals and thin metal films. J. Mech. Phys. Solids 55, 391–418. doi: 10.1016/j.jmps.2006.07.003
Wu, S., and Guan, K. (2014). Evaluation of tensile properties of austenitic stainless steel 316l with linear hardening by modified indentation method. Mater. Sci. Technol. 30, 1404–1409. doi: 10.1179/1743284713Y.0000000469
Yang, B., and Vehoff, H. (2007). Dependence of nanohardness upon indentation size and grain size - a local examination of the interaction between dislocations and grain boundaries. Acta Mater. 55, 849–856. doi: 10.1016/j.actamat.2006.09.004
Zambaldi, C., Yang, Y., Bieler, T., and Raabe, D. (2012). Orientation informed nanoindentation of α-titanium: indentation pileup in hexagonal metals deforming by prismatic slip. J. Mater. Res. 27, 356–367. doi: 10.1557/jmr.2011.334
Zhao, Z., Radovitzky, R., and Cuitin̄o, A. (2004). A study of surface roughening in fcc metals using direct numerical simulation. Acta Mater. 52, 5791–5804. doi: 10.1016/j.actamat.2004.08.037
Appendix
Design of Experiments
The constitutive parameters saturation slip resistance, , the initial value of the critical resolved shear stress, , the hardening exponent, p2, and the hardening rate parameter, h0 are considered as fitting parameters. In the course of the optimization, these should be adjusted so that there are satisfactory correspondences between the experimental and numerical nanoindentation results in tempered lath martensite.
Parameter sampling is done via Latin Hypercube Sampling (LHS). The LHS allows a broad investigation of the parameter space and an understanding of the influence of the n = 4 CP parameters , , h0, p2 on load-displacement curves and the surface topology for different carbon conditions. The minimum number of an successful design of experiments (DoE) requires 2n simulations. For the respective DoEs, relatively large design spaces were defined. For the residual imprints of alloy 10MnCr8-4, the chosen ranges of CP parameters introduced in section 2.4 are ∈ [40,380] MPa, ∈ [120,750] MPa, h0 ∈ [300,1200] MPa, and p2 ∈ [2.5,12]. In case of 30MnCr8-4, the design space increases and rises significantly for the values of critical resolved shear stress. In detail, the chosen values are ∈ [400,680] MPa, ∈ [545,900] MPa, h0 ∈ [600,1200] MPa, and p2 ∈ [2.5,12].
During the design of runs within the DoEs, especially for the different carbon contents in the tempered lath martensite, it quickly became clear that the initial resolved shear stress has the largest influence on the nanoindentation results, load-displacement curves, and surface topology. Exemplarily, Figure 13 shows the error for multiple parameter sets over the single parameter for 10MnCr8-4, indent no. 1.
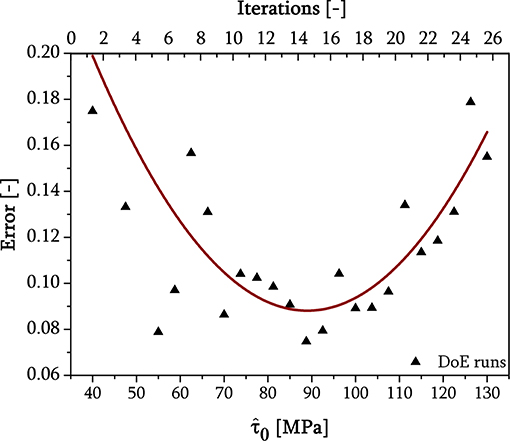
Figure 13. Exemplary total error etot evolution, as a function of number of iterations and the initial resolved shear stress of DoE run for indent no. 1 of 10MnCr8-4. The black triangles represent the numerical error according to Equation (13), whereas the red solid line is a quadratic fit through these numerical results.
This is also consistent with recent studies by Chakraborty and Eisenlohr (2017), who conducted a sensitivity study of crystal plasticity parameters using the elementary effects method of Morris. For further optimization loops the best fit of DoE was taken as start parameters.
Keywords: inverse analysis method, nanoindentation, lath martensite steel, non-local crystal plasticity, micromechanical modeling
Citation: Engels JK, Vajragupta N and Hartmaier A (2019) Parameterization of a Non-local Crystal Plasticity Model for Tempered Lath Martensite Using Nanoindentation and Inverse Method. Front. Mater. 6:247. doi: 10.3389/fmats.2019.00247
Received: 01 April 2019; Accepted: 19 September 2019;
Published: 04 October 2019.
Edited by:
Fernando Fraternali, University of Salerno, ItalyReviewed by:
Giuseppe Failla, Mediterranea University of Reggio Calabria, ItalyNorbert Huber, Helmholtz Centre for Materials and Coastal Research (HZG), Germany
Copyright © 2019 Engels, Vajragupta and Hartmaier. This is an open-access article distributed under the terms of the Creative Commons Attribution License (CC BY). The use, distribution or reproduction in other forums is permitted, provided the original author(s) and the copyright owner(s) are credited and that the original publication in this journal is cited, in accordance with accepted academic practice. No use, distribution or reproduction is permitted which does not comply with these terms.
*Correspondence: Jenni K. Engels, amVubmkuemdsaW5za2kmI3gwMDA0MDtydWIuZGU=
 Jenni K. Engels
 Napat Vajragupta
 Alexander Hartmaier