- 1Interdisciplinary Center for Research in Mathematical and Experimental Psychology (CIIPME), National Council for Scientific and Technical Research (CONICET), Buenos Aires, Argentina
- 2Universidad Argentina de la Empresa (UADE), Instituto de Ciencias Sociales y Disciplinas Proyectuales (INSOD), Buenos Aires, Argentina
- 3KU Leuven, Leuven, Belgium
- 4World Bank Group, Washington, DC, United States
Results-based financing has guided the development of policies with measurable results improving learning outcomes at micro/macro levels. However, it is then necessary to identify factors which predict early and accurately favorable or challenging conditions for learning. Learning outcomes depend on complex interactions between multiple variables, many of which are not fully understood. The objective was to develop valid and accurate models predicting low and high levels of math performance and Vietnamese language, using machine-learning algorithms, as part of an international large-scale project in primary education in Vietnam. The models achieved very high accuracy (95–100%). A strong common pattern has been found for both Math and Vietnamese language, for the low and high levels of performance: the individual cognitive characteristics, physical factors and daily routines/ activities of the child are very important predictive factors of academic performance, as measured by student performance in the final Grade 5 test in math and Vietnamese, respectively. Parental expectations, pre-school attendance and school trajectory of students have added relative importance in the classification. In order to accurately identify an expected low or high academic performance outcome, it is the full pattern of variables contained in the vector of information from each case that should be considered. Because, although each variable in a particular vector has a small contribution to the total predictive weight, it is the overall pattern containing the interactions between these variables that carries the necessary information for the accurate predictions. In addition, the identification of specific patterns for extreme groups of performance provides the necessary guidance for more focused educational interventions/investment and sound educational policies.
Introduction
Vietnam's success in PISA 2012 results, and its implications for the country's educational outcomes has been analyzed from different perspectives in previous research (Parandekar and Sedmik, 2016). Although Vietnam has the lowest per capita income from all countries participating in PISA, it outperforms other seven developing countries that took part in PISA 2012 (see Parandekar and Sedmik, 2016, for a more detailed analysis).
A series of studies using a multivariate regression approach has shown the presence of a unique combination of resources, investments in education, and cultural factors that have resulted in: (a) students being more disciplined and focused in their studies, (b) harder working teachers with close supervision from school principals, and (c) committed and involved parents with high expectations for their children. These conditions could explain the gains observed in the performances in Mathematics, Reading and Sciences. However, further analyses have demonstrated that all these factors could explain only 50% of the positive results of Vietnam (Parandekar and Sedmik, 2016). Modeling large amounts of multiple and complex data in order to understand educational outcomes needs a robust statistical approach. Current applications of artificial intelligence include machine-learning approaches which can be used to build predictive systems based on artificial neural network models (ANN). These models are excellent pattern-recognizer tools, which can use complex data to classify cases into desired outcome categories (e.g., Neal and Wurst, 2001; White and Racine, 2001; Detienne et al., 2003). This methodological approach, applied to a large database of Vietnamese children and their educational, social, and family background information, could lead to a better understanding of specific patterns of socio-cultural and individual differences contributing to their different levels of math and language performance in school.
From previous research, it has become apparent that the prediction of student performance with procedures which lead to the development of models which maximize the predictive accuracy of educational outcomes, could have many useful applications (e.g., Walczak, 1994; Pinninghoff Junemann et al., 2007; Fong et al., 2009; Kanakana and Olanrewaju, 2011; Abu Naser, 2012). They can be used to optimize educational outcomes, and thus, they could contribute to the advancement oflearning theories and practice. It is precisely in educational practices in classrooms and schools where a better identification and a more comprehensive understanding of those variables which are the best predictors of the future low performance of some of the students would be of the greatest benefit. This early diagnosis based on robust methods could be used for the development of better educational policies which improve the management of school resources, in order to implement remediation and support programs at all levels of an educational system, as well serving as an “early warning” indicator of future system performance. Similarly, the early identification of the best indicators of high performance, would allow the understanding of many of the factors leading to successful outcomes. In this way, these predictive tools would also allow offering challenging tasks to overperforming students. Through the knowledge of the interrelationships between the variables leading to different levels of performance, we can achieve a fine-tuning of instructional approaches, and social interventions, according to the students' needs.
The present study was based on existing data from the Young Lives (YL) initiative, specifically those collected in Vietnam. Young Lives data is a longitudinal study of childhood poverty following the lives of 12,000 children in India (Andhra Pradesh), Ethiopia, Peru, and Vietnam over 15 years (www.younglives.org.uk)—to examine cognitive, mathematics and reading (or vocabulary) skills. The general objective of this study was to develop precise models estimating the combined impact of all school and teacher characteristics as well as background and non-school factors on student learning through a machine-learning approach. Specifically, the objetive was to develop precise models, using predictive systems based on ANN that can accurately identify the high-achievers and the low-achievers amongst the Vietnamese students, by identifying differential patterns of factors that contributed to their mathematical and Vietnamese performance. Once identified, some of those factors that play a significant role in the characterization of their performance could be the focus of further program implementations that could have as their objective to raise the expected performance of students predicted to be underachievers according to the models developed.
Machine Learning and Artificial Neural Networks
“Conceptually, a neural network is a computational structure consisting of several highly interconnected computational elements, known as neurons, perceptrons, or nodes. Each ‘neuron' or unit carries out a very simple operation on its inputs and transfers the output to a subsequent node or nodes in the network topology” (Specht, 1991; Musso et al., 2013, p. 46). “Neural networks exhibit polymorphism in structure and parallelism in computation (Mavrovouniotis and Chang, 1992), and it can be represented as a highly-connected structure of processing elements with parallel computation capabilities” (Rumelhar et al., 1986; Musso et al., 2013, p. 46).
Traditional machine learning methods, such as support vector machines (SVMs), decision tress (DT), random forest (RF), nearest neighbor rule (NNR), showed equivalent performance as classifiers over a broad range of databases and applications (Duin, 1996; Caruana and Niculescu-Mizil, 2006; Maroco et al., 2011). However, ANN outperform traditional models if we consider an average over a serie of metrics (Caruana and Niculescu-Mizil, 2006). Given our main objective was to maximize the precision in the prediction of low and high levels of performance, we selected ANN that “rarely perform poorly on any problem or metric, they have excellent overall performance” (Caruana and Niculescu-Mizil, 2006, p. 7), with the aggregate benefit of high flexibility (Duin, 1996). Although other traditional techniques like DT could offer a more easily interpretable or single picture of the relationships between inputs and output, we have prioritized the accuracy performance according to our goal.
A comparative study between all the machine learning approaches which could be applied on the present problem would exceed the objective of this paper (see e.g., King et al., 1995 for a comparative study). Nevertheless, we can summarize that ANNs have several advantages over traditional methods:
a) They require fewer assumptions than traditional statistical methods,
b) They model nonlinear complex relationships among variables,
c) They can handle data at all levels of measurement (nominal, ordinal, interval, ratio),
d) They are robust as general estimators even with sets with some missing and less reliable data.
e) As machine learning algorithms they are capable of adjusting and improving over time, even when there is a gradual shift in the incoming information.
f) Current development of fast and cheaper microprocessors has meant that ANNs are available even in personal computers.
g) Applications of ANNs in the educational field have resulted in the improved accuracy and predictive validity of the models, resulting in the increased accuracy of the classifications. (Boekaerts and Cascallar, 2006; Caruana and Niculescu-Mizil, 2006; Cascallar et al., 2006; Herzog, 2006; Lykourentzou et al., 2009; Asselborn et al., 2018; Yildiz Aybek and Okur, 2018).
Conceptual Scheme of Comparative Variables
Following the explanatory factors available in OECD's PISA framework (OECD, 2013), we organize the predictor variables of the database into 15 sets or categories of factors at four levels of analysis: Students, Parents, Teachers, and Schools. In addition, we added one level of analysis named “Community”. Appendix shows the 15 categories of factors by level of analysis and variables.
Present Study
The main research questions of this study were: (a) Can we predict with maximum accuracy those students with a high (top 33%) and low (bottom 33%) level performance in Vietnamese language and mathematics, at the end of Grade 5? (b) Which non-school factors most influence the low and the high levels of academic outcomes? (c) Which school and teacher factors most influence these outcome levels? (d) Which is the participation of cognitive and non-cognitive, as well as health and other individual factors, in mathematics and language performance?
Materials and Methods
Data Source
The Young Lives study is an international longitudinal study of child poverty which has involved approximately 3,000 children in four low-income countries [Ethiopia, India (Andhra Pradesh), Peru and Vietnam] over a 15-year period. Two cohorts of children are included in each country: 1994–1995 (n = 1,000 children) and 2000–2001 (n = 2,000 children).
In Vietnam, 20 sites were chosen for sampling, all situated in five of Vietnam's 63 provinces (Ben Tre, Da Nang, Hung Yen, Lao Cai, and Phu Yen). They were purposely selected to represent diverse socio-economic levels and geographic and demographic areas. The wealthiest areas were excluded from the country study. These samples are representative of the regions-level populations, but they are not representative at the national level. However, comparisons with the nationally representative Vietnam Household Living Standards Survey (VHLSS) suggest that the Young Lives sample is broadly representative of Vietnam as a whole (see Ha, 2003; Barnett et al., 2013, for further detail).
Random selection of 100 children (6–18 months old in 2001–2002), from each of 20 sites was carried out for the sampling of the younger-cohort children. The attrition rate is <5% for the Young Lives study, on average, and there is no evidence of attrition bias.
Sample
Although the household survey includes 2,000 younger-cohort children (born in 2001–2002), only data from 1,138 Vietnamese students from the initial survey who were also included in the schools survey were part of the present study. This sample excluded those children who were not attending Grade 5 and those students who had migrated) from the selected sites (57% of the total Younger-cohort sample; for more details of the sampling see Rolleston et al., 2013).
The mean age was 11.6 months (SD = 3.2) in the first round (males = 50.5%; see Table 1 for age ranges in each round). The distribution of socio-economic status was: 21.9% very poor, 18.4% poor, 46.4% average, and 13.3% not-poor with a higher index (based on the health index constructed from household quality, consumer durables, and services). A total of 20% of the family groups had an urban residence.
Measures
Household Survey: Three Rounds
The analyses in this paper used the first three rounds of the so called Household Young Lives Data from Vietnam, which were collected in 2002 (Round 1), 2006 (Round 2), and in 2009 (Round 3). We used measures obtained from three questionnaires: household, child, and community questionnaires.
The household questionnaire involves data on parental background, child health, livelihood and assets, socio-economic status, attitudes, aspirations for their child, perceptions of the caregiver, child's weight and height, time-use data for all family members, etc.
Measures from the child questionnaire include social networks, time-use, attitudes and feelings, daily activities, their experiences and attitudes toward work and school, their likes and dislikes, how they feel they are treated by other people, and their hopes and aspirations for the future, as well as reading and mathematics scores.
The community questionnaire asks about the social, economic and environmental context of each community covering various topics such as ethnicity, religion, infrastructure and services.
School Survey
Data corresponding to the school survey were collected in October 2011 from Grade 5 students, in 176 classes in 92 schools. Children completed a background questionnaire at the start of the school year. Mathematics and Vietnamese language tests were administered at the end of the school year.
The school survey instruments included questionnaires for principals, classroom teachers and students, an observation of the school site and classroom facilities. In addition to the tests for the students in mathematics and Vietnamese language, there were tests for the teachers in those classrooms on the “pedagogical content knowledge” of the corresponding subjects (math or language).
In addition, a background questionnaire was completed by the students to collect information about their homes, families and education-related resources, time-use in general and, specifically about time spent on homework and attendance to extra classes.
Non-cognitive and self-regulation factors at the student level were measured with a 4-point Likert-scale questionnaire designed to assess attitudes, feelings, motivation to succeed at school, participation in class, academic self-concept and social network, and bullying (see Appendix for all the variables).
Cognitive factors were measured through several tests: the Peabody Picture of Vocabulary Test (PPVT), Cognitive Development Assessment (CDA), Early Grade Reading Assessment (EGRA), one item reading and a mathematics test (psychometric properties established in the analyses of these tests are very well documented in Cueto et al., 2009; Cueto and León, 2012; See Table 1).
“The Peabody Picture Vocabulary Test (PPVT) is a widely used test of receptive vocabulary with a high reliability (Cueto and León, 2012). It was originally developed in English in 1959 and has been updated several times” (Cueto and León, 2012, p. 6). In the Young Lives study version III was used (204 items; Dunn and Dunn, 1997). In this test, four pictures are presented on a board for the child to choose the one that “best represents the meaning of a stimulus word presented orally by the examiner. All items in the test are not expected to be administered. Instead, the fieldworker has to administer enough items to establish a ceiling and a baseline” (Cueto and León, 2012, p. 6). “The test was translated into each country's main languages by the local team and verified by a local expert before the pilot study conducted prior to the second round of data collection” (Cueto et al., 2009, p. 13).
The Cognitive Development Assessment (CDA) “was developed by the International Evaluation Association (IEA) during the second phase of the Pre-Primary Project in order to assess the effect of attending a pre-school center in the cognitive development of 4-year-old children” (Cueto et al., 2009, p. 13). The test has three subsets: spatial relations, quantity, and time. “For the second round of YL it was decided to administer only one quantitative subset of the CDA. In the quantity subscale, the task was for children to pick an image from a selection of three or four that best reflected the concept verbalized by the examiner (e.g., few, most, nothing, etc.). This subscale had 15 items and all had to be administered to the child. Each correct answer was scored 1 point, with 0 points for wrong answers or no response, amounting to a maximum total score of 15 on the CDA quantity subscale” (Cueto et al., 2009, p. 14).
The Early Grade Reading Assessment (EGRA) is a test that was developed with the support of USAID. It is “an oral assessment” designed to measure the most basic foundation skills for literacy acquisition in the early grades: recognizing letters of the alphabet, reading simple words, understanding sentences and paragraphs, and listening with comprehension” (United States Agency for International Development., 2020). The reliability index was considered acceptable (>0.60; Cueto and León, 2012).
Achievement Items: in Round 1, 2, and 3 of the household survey, the Young Lives team administered three achievement items to the children. The first focused on reading, the second on writing, and the third on mathematics. “The original reading item consisted of three letters (‘T, A, H'), one word (‘hat'), and one sentence (‘The sun is hot'). For the original writing item children were asked to write ‘I like dogs.' Finally, for the original mathematics item children were asked to multiply 2 × 4” (Cueto and León, 2012, p. 5). The reliability of the achievement tests were considered acceptable for research purposes (>0.60; Cueto and León, 2012).
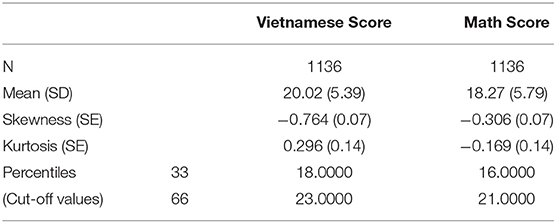
Mathematics and Vietnamese Tests: both instruments in each of these areas consisted of 30 multiple-choice items and were developed in consultation with curriculum experts from the Vietnamese National Institute of Educational Sciences (VNIES) who checked that they corresponded to the national curriculum and had am adequate coverage of the curriculum content. These items were also aligned with those employed in the MOET/World Bank Grade 5 Study to measure learning levels in relation to curricular expectations, covering key subject domains at a range of levels of cognitive demand. Both tests have very good reliability (Math Test, α = 0.860; Vietnamese Language Test, α = 0.831). The descriptive statistics of the two performance measures are presented in Table 2.
Data Analyses
Through an extensive examination of the longitudinal data from Young Lives, several variables from different categories were identified as being those shown to have the most explanatory connection tolearning outcomes in the research literature. These categories were individual biological and cognitive variables, socio-economic factors and environmental variables. All of these variables were integrated into a manageable number of 194 variables (including original and constructed variables; see Appendix) suitable for computer coding within the context of the ANN modeling. In order to do that, we have constructed new variables by adding together a number of items or aggregating several original variables and including them into mini-scales. The aggregation of the variables was intended to create more meaningful categories for the analyses. They were carried out by three expert judges in the content area, and all decisions had to reach a consensus among the expert team. Below are two examples from the school and the household surveys:
Example 1: One important element of the school survey asks about teacher attitude and aims at accessing the teacher's own perception of his/her own ability in teaching or dealing with difficult students, and as a summary of the teacher's efficiency. A four-point Likert scale of 20 items (ranging from “strongly agree” to “strongly disagree”) was employed as part of the teacher questionnaire. Two factors were identified in this instrument, explaining 25% of the variance, after performing an Exploratory Factor Analysis (Maximum Likelihood method, Varimax rotation, KMO = 0.76). The first factor includes 10 positive items (example; “If I really try hard, I can get through even the most difficult or unmotivated students”; Cronbach's alpha = 0.76). The second factor consists of 10 negative items (example; “If parents would do more for their children, teachers could do more too”; Cronbach's alpha = 0.63). It was important to see the independent contribution of those positive and negative attitudes in terms of their effect on educational outcomes at the top and bottom ranges of the students' performance scales.
Example 2: To construct “Total value of home assets” we first calculated a value for every single asset type owned by the household by multiplying a dummy variable which take the value of 1 if a household owns at least one of each consumer durable item multiplied by the number of those durable item assets owned by the household and the value that the household would fetch if they were to sell each of those items. We then aggregate the results for all item sets mentioned in the questionnaire (TV, radio, fan, etc.).
Artificial Neural Networks
This research utilizes a predictive methodology to describe the expected level of performance to be reached by each student (and/or aggregate of students). The expected levels of performance, in mathematics and Vietnamese language, are measured by tests administered at age nine/ten, in Round 4 (R4) of the YL data collection effort. All input variables in the predictive models are introduced from all the data collected up to that point, which include the several cycles of data collection throughout their schooling, in grades 1, 3, and 5 (in the various Rounds of data collection). The predictive classification mathematical models obtained, each represent a model of the results observed in R4 testing, which takes into account not only the individual effect of each predictor variable, but also the complete set of complex interactions among all the predictors. This predictor set is the basis for the input layer of each mathematical model developed.
The output of the predictive model is a classification of the expected performance of each individual student, placing them in the top or lower 33% of the ranking in each one of the areas (mathematics and Vietnamese language; see the cut-off values in Table 2). Both scores used as output (tests for Vietnamese language and for mathematics) had an approximately normal distribution with skewness and kurtosis close to zero (see Table 2). First, we focus on two separate levels of performance (low and high) in different models in order to analyze specific patterns of variables predicting each group level. Which predictors contribute to identify a low or high performance compared to the rest? Then, we focus on the common variables analyzing both levels in one model. One of the main research questions was the identification of all possible different predictors for each of the two extreme performance groups. The goal being to identify any predictor that could be an antecedent of a certain outcome, so as to suggest possible interventions, particularly for predictors that could have occurred in early Rounds of the study.
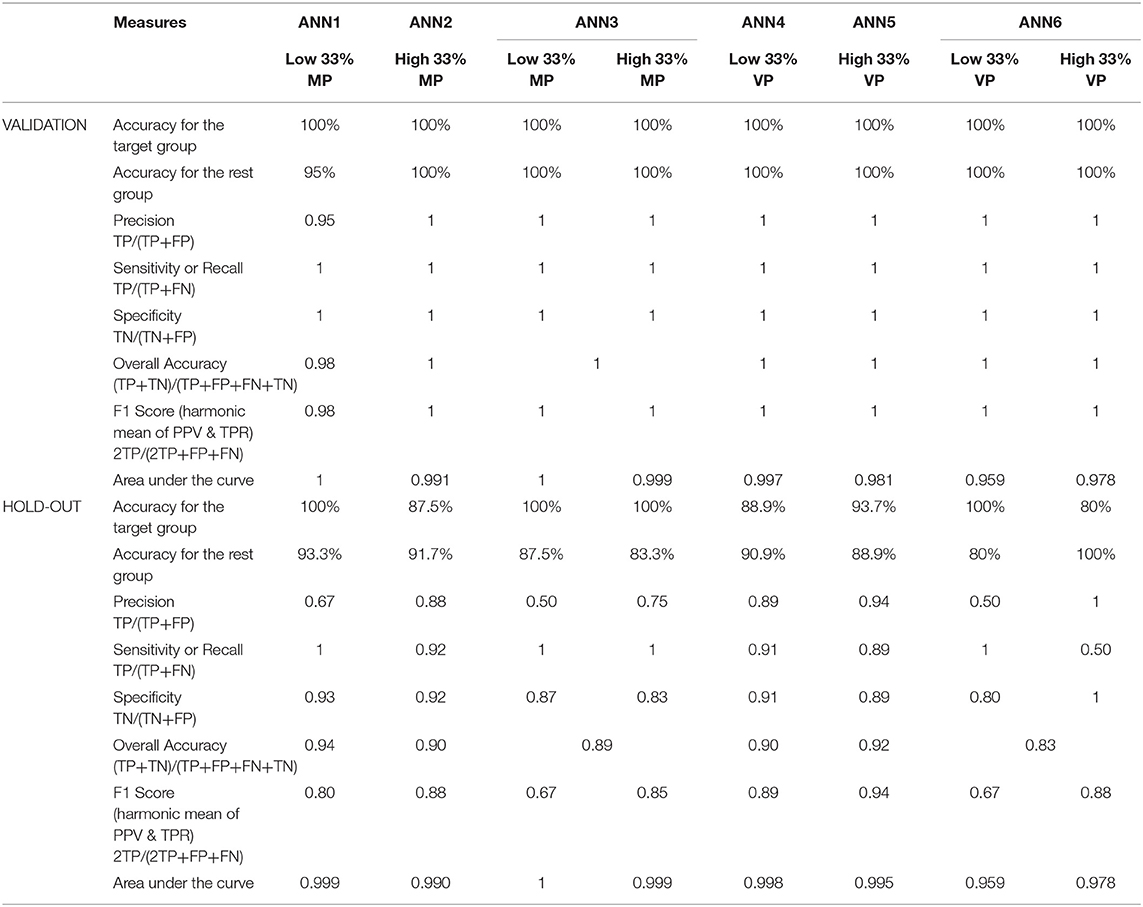
Multilayer perceptron artificial neural networks (involving supervised training of the ANNs), using a backpropagation algorithm were used for each targeted performance group. All models were devoleped using IBM SPSS Statistics version 24. In order to maximize the total accuracy and the predictive precision, all ANN architecture parameters were adjusted. Parameters such as learning rate, momentum, number of hidden layers, transfer functions and number of nodes were adjusted for each model, and their values set so as to minimize errors in the predictive classifications. In addition, the quality of the models was evaluated determining confusion matrices and ROC analyses for each ANN. The search for the “best model” for each of the ANN in the study was carried out in a systematic grid-like fashion, following a methodology suggested by Rodriguez Hernandez, Musso, Cascallar & Kyndt (submitted, 2019). It involved evaluating the outcomes of the various models attempted, systematically exploring the use of two activation functions, with several values of learning rate and of momentum, with one and two hidden layers and automatic adjustment of the number of nodes. The best models identified are the ones which presented the best results in the performance measures, as reported in Table 4.
Results included the predictive classifications, as well as the relative and absolute importance (predictive weight) of each input variable.
In order to develop the models to be used in exploring the issues addressed by the research questions, a full set of ANNs was developed. These models used two dependent variables, performance in the mathematics and in Vietnamese Language tests. These tests were administered at the end of the year in Round 4 of the YL data collection program. The models had the following objectives:
Model 1: Classified between students with the lowest 33% performance in the Mathematics test and the rest of the students.
Model 2: Classified between students with the highest 33% performance in the Mathematics test and the rest of the students.
Model 3: Classified between students with the lowest 33% and with the highest 33% performance levels in the Mathematics test.
Model 4: Classified between students with the lowest 33% performance in the Vietnamese test and the rest of the students.
Model 5: Classified between students with the highest 33% performance in the Vietnamese test and the rest of the students.
Model 6: Classified between students with the lowest 33% and with the highest 33% performance levels in the Vietnamese test.
Although the research questions could have been addressed simply by the development of Models 3 and 6, which classified both the “high 33%” and the “low 33%” performance groups simultaneously within the same model, the other models were developed to explore the possibility of better results if for some reason either extreme group needed to be identified with maximum accuracy.
ANN Procedure
The procedure chosen for the development of the ANN models and the evaluation of the results involved splitting the dataset into three randomly selected sets: (a) a training set, consisting of 60% of the sample for each model; (b) a validation set (20% of the sample), and (c) a hold-out set of data (20% of the sample).
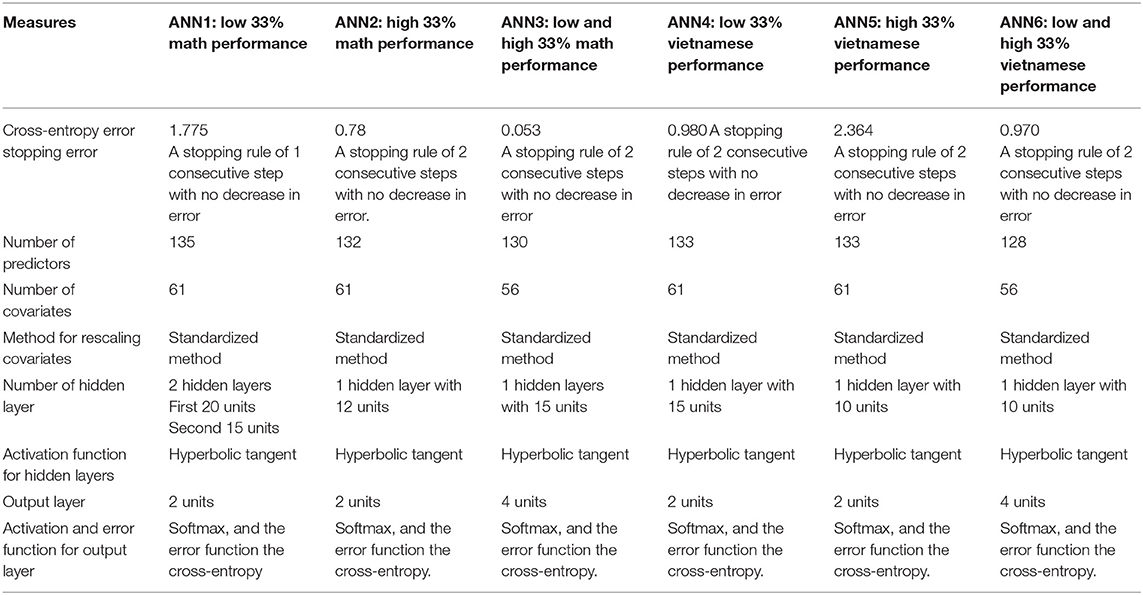
The architecture for each ANN model is presented in Table 3. In training, the system sets out to develop a model of parameter weights using the predictor variables that could minimize the error with the output as specified in the model and which is provided to the analysis. It utilizes the vector matrix containing all predictor variables for each student and by recalculating the parameter weights between the predictors and their interactions, it develops a model that minimizes the error with the expected outcome. These patterns are modified as the data from each student is introduced into the analysis. The model therefore “learns” to distinguish between those patterns which characterize the group which attained a certain performance level, as contrasted to students who do not belong to this group (or who belong to another specified level). Therefore, the correct classification for each record is known to the network, so that the output node can be assigned a “correct” or “incorrect” classification. Then, according to the algorithm used, in our case backpropagation, the network uses the error term to adjust the weights in the hidden layer in order to minimize the error, and gradually improves the classification outcome through an iterative learning process. During this training process the network uses the same set of data as the connection weights are progressively refined. Each ANN contained the same input predictors. Each model contained one or two hidden layers, with several units. The output layer consisted of two units, namely the categories to which the students belong or do not belong. In all ANN models, there was an activation function used for the hidden layer, and a second activation function for the output layer, with an error function. The ANN gives preliminary weights to each predictor and its interactions and changes these weights as the learning progresses.
Once the NN model has reached a predetermined stopping criterion, it runs the same model on the randomly selected sample of cases that were not in the training set. This is the validation phase, in which the same parameters obtained during training are applied to the new data set, not previously shown to the network or used for training. This validation set (20% of the total sample) is a data set in which the correct classification for each vector is not given to the network. As the network classifies these cases, the accuracy of the classification is observed to evaluate the network and to observe any evidence of overfitting. Finally, the hold-out set is used for final testing of the network configuration and obtain an evaluation of the network in a true generalization of its functioning, estimating the actual predictive power of the network model (fixed from the training and validation phases) on a different random set of data that has not been part at all of the training and validation process. The parameters were never directly optimized for this hold-out testing set, thus, it diminishes the risk of overfitting the data and the model algorithms are forced to generalize to previously unseen data, and it is a measure of how well it can identify the presented vectors of information into the output categories.
The predictive weight for each of the variables participating in these models was established, as well as the predictive weight for the categories in which these participating variables were grouped. These categories represented conceptual groupings of the variables collected in the YL program, and which had been found to have enough responses and variation in order to provide information for the neural network models. In addition, several comparisons were also carried out, comparing the predictive weight of these categories, as well as comparisons of the difference in predictive weights for each of the terms of the comparison.
Results
Results for each ANN model are presented in Table 4. These measures provide a means of determining the quality of the solutions offered by the neural network models designed.
Accuracy for the “target group” (Low or High 33%) and Accuracy for the “rest” group are the percentages of the correct classification in each group. Recall (or Sensitivity) refers to the “proportion of correctly identified targets, out of all real targets presented in the set. Precision represents the proportion of correctly identified targets, out of all identified targets by the system” (Musso et al., 2012, p. 3). Specificity is “the proportion of correctly rejected targets from all the targets that should have been rejected by the system” (Musso et al., 2012, p. 3). “The F1-Score is the harmonic mean of Precision and Recall, taking both false positives and false negatives into account. Therefore, it is a more comparable measure across studies with different proportions of classes” (Asselborn et al., 2018, p. 42) The area under the ROC curve (which considers Sensitivity and Specificity) is a rank metric that measure “how well the positive cases are ordered before negative cases and it can be viewed as a summary of the model performance across all possible thresholds” (Caruana and Niculescu-Mizil, 2006, p. 162).
In addition to developing specific models for the predictive classification of “high 33%” or “low 33%” performance groups in each of the academic areas (math and language), two additional ANN models were developed. Each of them (one for math, another for language) consisted in a model to accurately classify simultaneously (that is within the same model, both the “low” and the “high” performance groups (as oppose to the previous models which classified either “low” or “high” predicted performance vs. “the rest”).
Contribution of Predictors for Math Performance
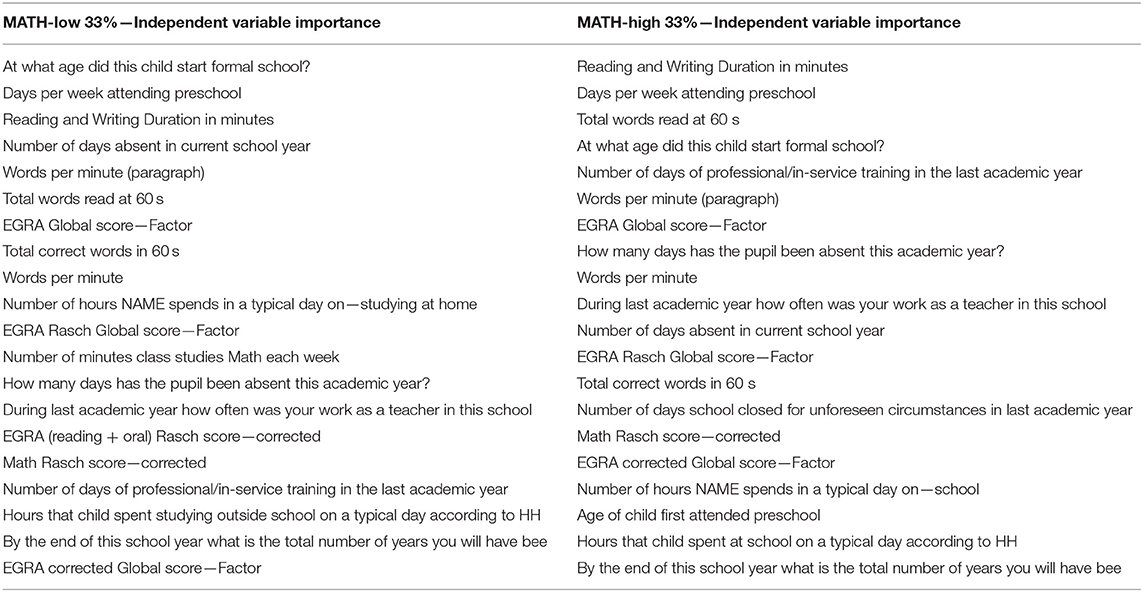
Table 5 shows the top 20 variables by predictive weight for each of the two performance levels (Math Low 33%, Math High 33%).
Results from the predictive model for those students expected to be in the highest 33% of Math Performance, have shown that the top three categories of predictors with the most significant participation were: Cognitive Factors, Child Physical Factors and Health, and Child routines and habits (see Figure 1). In addition, Household Socio-Economic Status, Student Pre-school & School trajectory, as well as Teacher Background, Qualifications, and Attitude, also add predictive weight to the classification of these high performers.
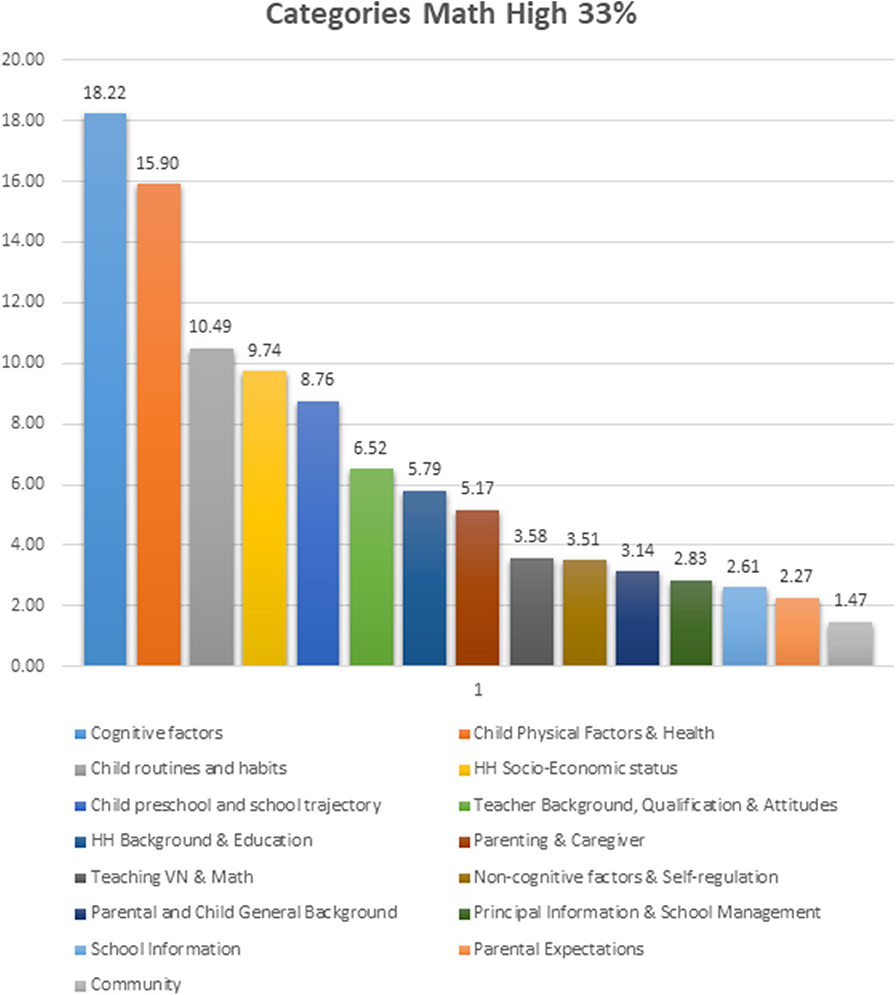
Figure 1. Comparative observed predictive weight contribution for the high 33% of math performance by each of the categories of predictor variables.
For low performers in Math (low 33%), the pattern of those predictors contributing to the prediction were similar (see Figure 2). However, in order to identify the differential contribution of each category of variables for each performance level, the differences between them were analyzed (see Figure 3):
• For the discrimination of low performers in Math (33%): Child Physical/Health, Cognitive Factors, Teaching Vietnamese & Math, HH Socio-Economic Status, and Child pre-school/school trajectory, had more weight compared with the discrimination of those students belonging to the highest 33% of Math performance.
• For the discrimination of high performers in Math (33%): Child routines and habits, Non-cognitive factors & Self-regulation, HH background & Education, Parental and Child General Background, Parental Expectations, Principal Information & School Management, and Teacher Background, Qualification & Attitudes had more weight compared with the discrimination of those students belonging to the low 33% of Math performance.
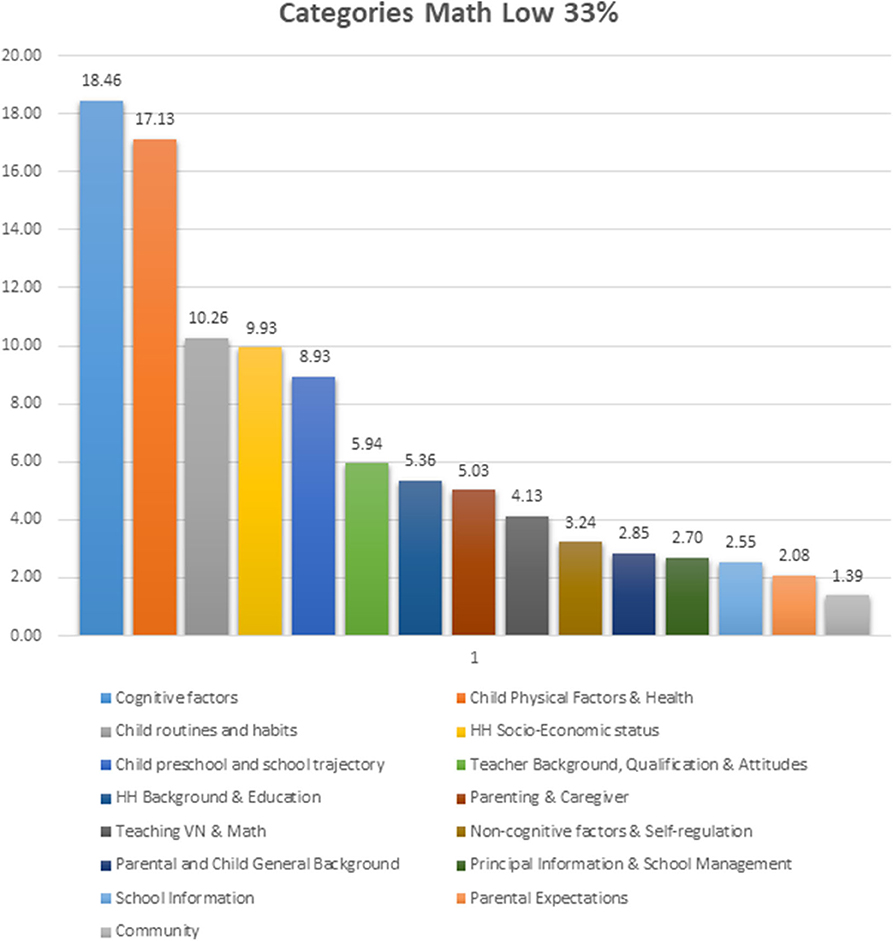
Figure 2. Comparative observed predictive weight contribution for the low 33% of math performance by each of the categories of predictor variables.
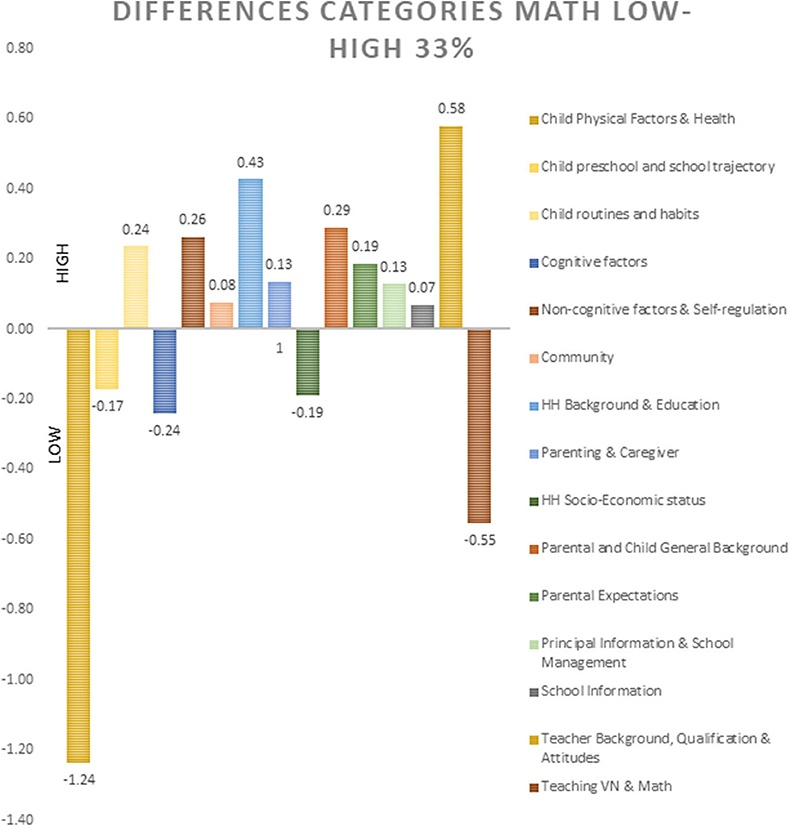
Figure 3. Differential contribution of each category of variables for each math performance level, according to the observed predictive weight.
The predictive model for low and high 33% of Math performance (simultaneously) shows that Child Physical/ Health, Cognitive Factors, HH Socio-Economic Status, and Child routines/habits are the most important variables contributing with more predictive weight (see Figure 4).
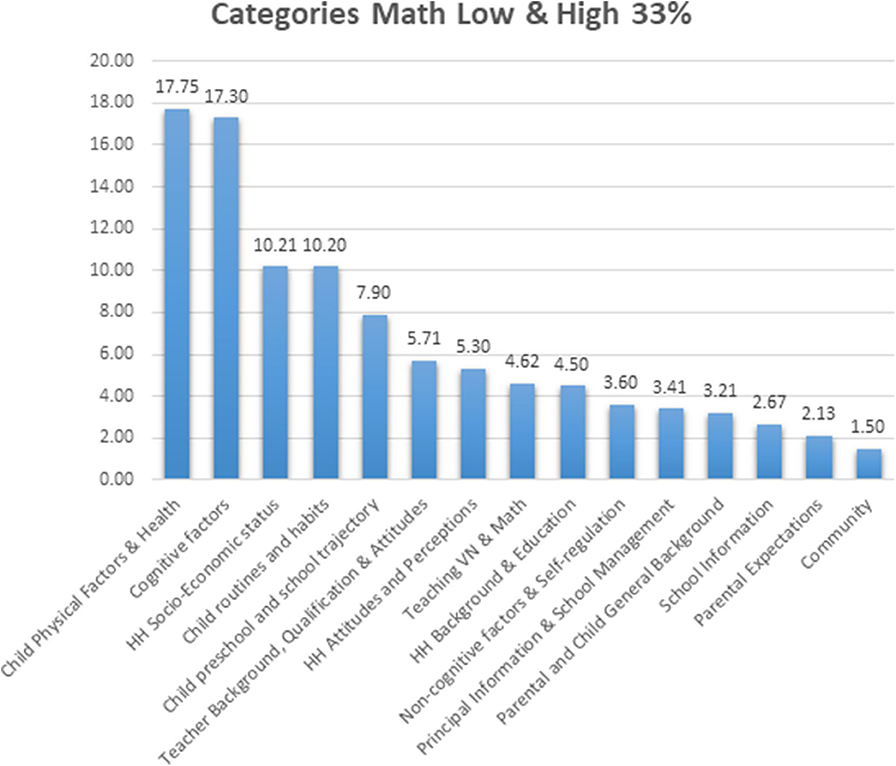
Figure 4. Comparative observed predictive weight contribution for extreme level of math performance by each of the categories of predictor variables.
Regarding the research question about the contribution of school characteristics on both extreme 33% groups of Math Performance (considered at the same time), the category Teacher background, qualification and attitudes provides the most predictive weight, with a minimum participation of Information about the principal and school management, and General characteristics of the school and classroom (see Figure 4).
However, Background, qualification and attitudes of the teacher, together with Principal information and school management, had more weight for high performers compared with low performers in math. On the other hand, Teaching of (Vietnamese) or Math (experience) had more importance for low performers in math (see Figure 3).
Contribution of Predictors for Vietnamese Language Performance
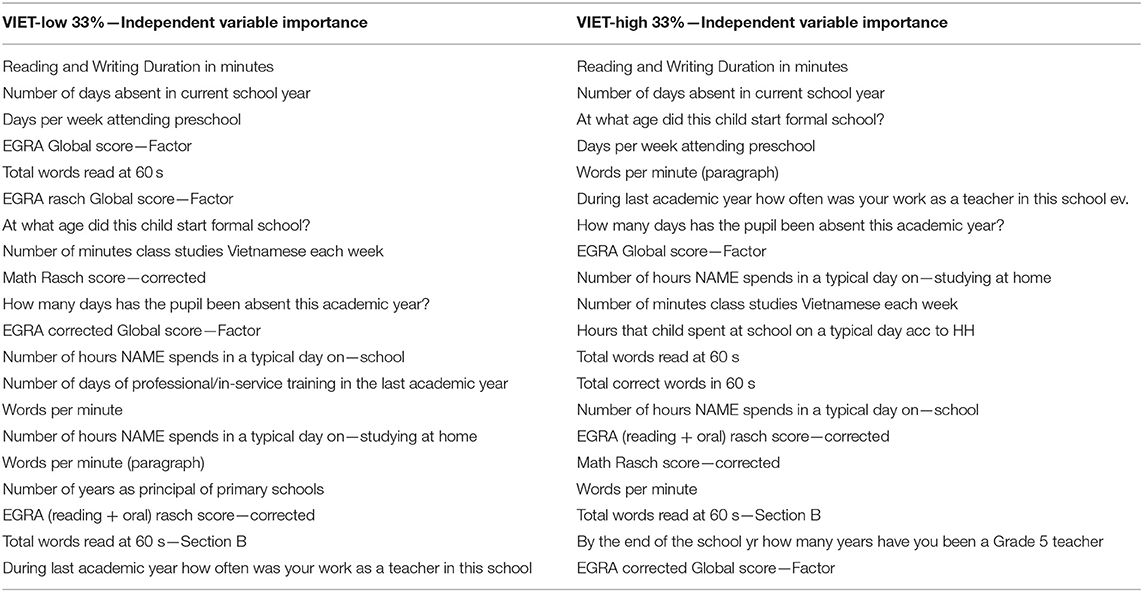
Table 6 shows the top 20 variables by predictive weight for each of the two performance levels (Vietnamese Low 33% and Vietnamese High 33%).
The most important three categories of variables identifying the highest 33% students for Vietnamese performance, were Child physical factors/health, Cognitive factors, and Child routines/habits. Household Socio-Economic Status, and Student pre-school/School trajectory, are next in terms of added predictive weight in the classification of the high 33% performers in Vietnamese (see Figure 5).
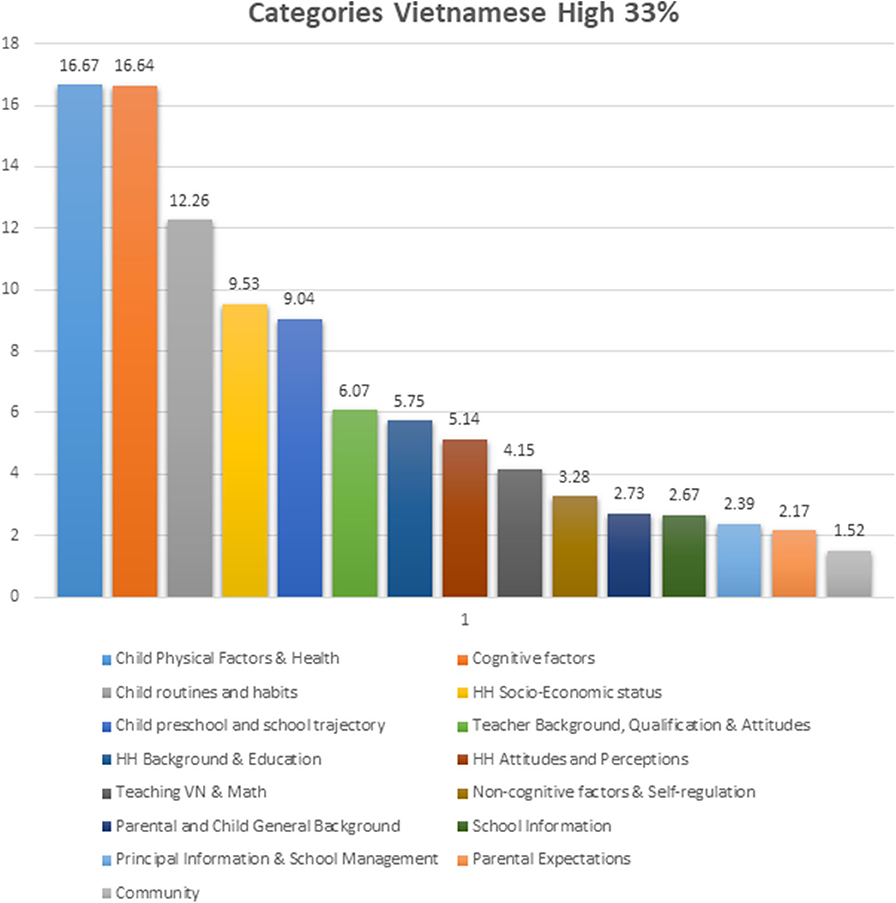
Figure 5. Comparative observed predictive weight contribution for the high 33% of vietnamese performance by each of the categories of predictor variables.
The predictive model for those students expected to be in the lowest 33% of Vietnamese performance has shown that the top three categories of predictors with the most significant participation were Cognitive factors, Child physical factors/health, and Child routines/habits (see Figure 6).
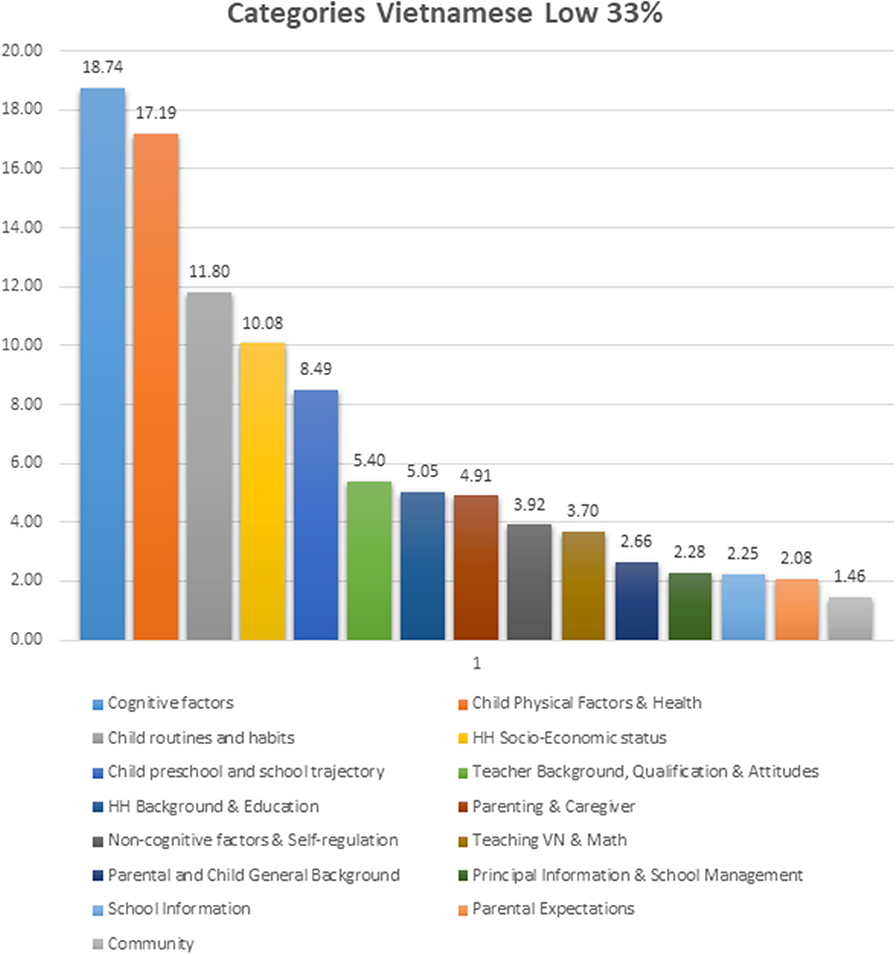
Figure 6. Comparative observed predictive weight contribution for the low 33% of vietnamese performance by each of the categories of predictor variables.
In order to identify the differential contribution of each category of variables for each Vietnamese performance level, the differences between them were analyzed (see Figure 7):
• For the discrimination of low performers in Vietnamese (low 33%): Cognitive factors provided more information than for the discrimination of high performers (high 33%). In addition, Non-cognitive factors & Self-regulation, Child physical/health, and HH Socio-Economic Status, were more important for the discrimination of low performing students, compared with those students belonging to the high 33% of Vietnamese performance.
• For the accurate discrimination of high performers in Vietnamese (high 33%): HH background & Education, Teacher Background, Qualification & Attitudes, Child pre-school/school trajectory, Child Routines/habits, Teaching Vietnamese or Math, and School information had more predictive weight, than the weight these categories had for the discrimination of those students belonging to the low 33% of Vietnamese performance.
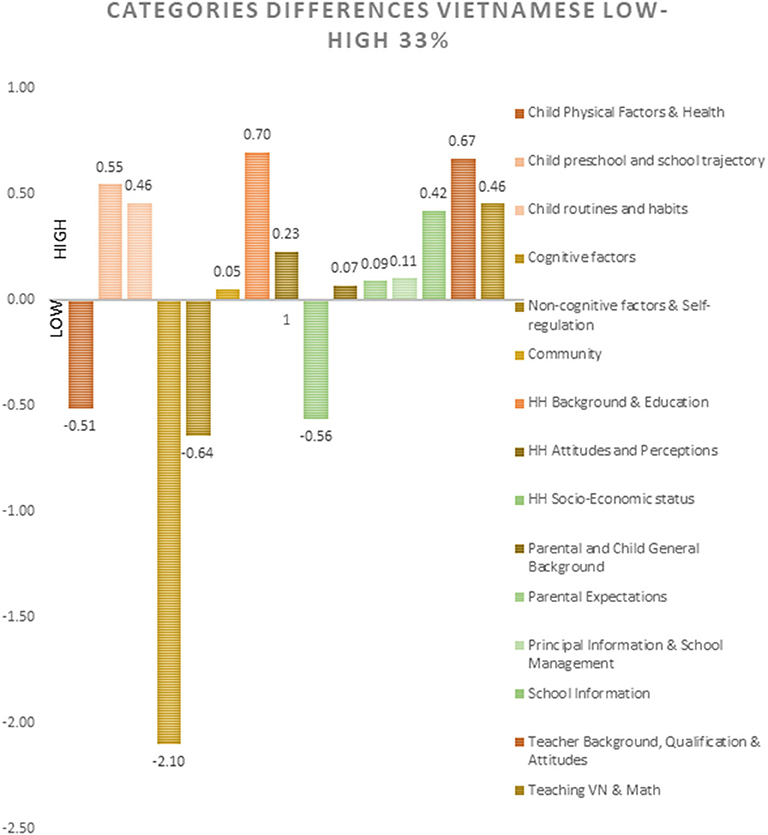
Figure 7. Differential contribution of each category of variables for each vietnamese performance level, according to the observed predictive weight.
The predictive model for the simultaneous discrimination of students in the low 33% and high 33% groups of Vietnamese language performance, has shown that Cognitive Factors, Child Physical/ Health, and Child routines/habits, are the most important predictive categories.
Regarding the research question about the contribution of school characteristics on both extreme groups (low and high 33%) of Vietnamese performance (considered together), Teacher background, qualification and attitudesis the most important predictive category, with a lesser participation of Teaching Vietnamese (or Math) (experience), Information about the principal and school management, and General characteristics of the school and classroom.
The categories of Background, qualification/attitudes of the teacher, Teaching of Vietnamese or Math, and School information, had more predictive weight for high performers (high 33%) compared with low performers (low 33%) in Vietnamese language.
Predictive Weights of School-Related and Teacher Factors
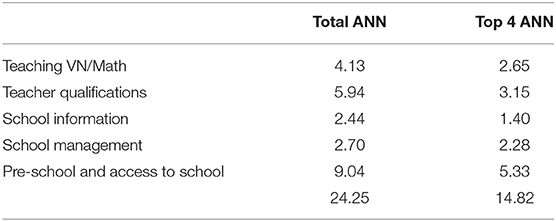
A secondary analysis was carried out to determine the total predicted weight of the variables with the largest weight in the categories involving Teaching/Teacher, School Information and Management, and Attendance to Pre-school/Access to school. Table 7 shows the values obtained for the total weight in each of those categories, as well as the weights obtained for the top 4 predictors in the ANN analyses. If we consider the predictive weights of the top 20 predictors related to the school for each level of performance, they represent 20.93% for Low Math performance, 21.98% for High Math Performance, 21.76% for the prediction of Low Vietnamese performance, and 21.42% for High Vietnamese performance. The total predictive weights of school and teacher variables represent: 46.40% for Low Math performance, 46.19% for High Math performance, 43.93% for Low Vietnamese performance, and 44.98% for High Vietnamese performance.
Discussion
Overall, if we consider the results obtained for the classification of the four groups of interest (low and high 33% of each of two subjet areas), we observe that the ANNs performed remarkably well. If we observe the very good results obtained in the validation and hold-out phases for precision and recall, it is possible to evaluate the networks considering precision as associated with Type I errors (minimizing false positives), and of recall (sensitivity) as related to Type II errors (minimizing false negatives). In this case, the good precision results indicate that the algorithms of the networks classified correctly substantially more cases relevant to each category than irrelevant ones. The very satisfactory recall values indicate that the models classified correctly most of the relevant cases. Similarly, if we observe the high specificity values, we can infer that the network algorithms are correctly classifying those students that do not belong to the “target” group in the respective analysis (that is, it represents the rate of actual true-negatives). The ROC analysis carried out evaluates the usual trade-off between sensitivity and specificity, and is a useful diagnostic tool of the quality of the model, and the resulting area under the curves a measure of the effectiveness of the classification taking into account the trade-off (technically speaking, the trade-off between true positive classification rates and the false positive classification rates (1-specificity), that is probability of detecting a member of the target classification vs. the probability of a false alarm (classifying a student as a member of the target group, when in fact it is not). A perfect classification wold have an area of 1. As explained before, the F1 measure, as a measure of the network's algorithm accuracy, is the harmonic average of the precision and recall (an F1 score's best value is 1, if it has perfect precision and perfect recall. It is a good measure to compare the quality achieved by the different networks (in this study, it ranges between 0.80 and 0.94) indicating a fairly even and good balance in the algorithms. All of these indicators provide a good comparative and individual view of the quality of the ANN models developed, and show ANNs that have achieved a very good level of effectiveness and very good generalization of the results.
The results from all the predictive models using ANN have made possible to detect which set of predictors and how they contribute specifically for each low and high performance (Math and Vietnamese language), on the one hand, and common processes across all students, on the other hand.
A strong common pattern has been found for both Math and Vietnamese language, and for the low and high levels of performance: individual cognitive characteristics, physical factors (nutritional status, anthropometry), and daily routines/activities of the child are the most important predictive factors of academic performance, as measured by student performance in the final Grade 5 test in math and Vietnamese, respectively. Household socio-economic status, pre-school attendance and school trajectory of students have also added predictive weight to the classification. But, it is the combined effect of the full vector of information provided by the complete set of predictor-patterns of the variables for each student that can very accurately model the lowest 33% and the highest 33% levels of performance.
However, if we consider the differential contribution of each set of inputs for the two different math performance levels considered (low 33% and high 33%), the cognitive and physical factors, and some aspects of the teaching of math provided the most predictive weight for the discrimination of the lowest performance level, indicating that these groups of predictor variables provided important information for the classification of the low-performing student group. These results are consistent with extensive previous literature that has demonstrated the crucial role of working memory and attention as cognitive processes in mathematical ability, reasoning, academic achievement and problem solving (e.g., Passolunghi et al., 1999; Engle, 2002; Fuchs et al., 2005; Passolunghi and Pazzaglia, 2005; Checa et al., 2008; Musso et al., 2012; Musso, 2016). Previous studies have also stated the negative impact of inadequate nutrition on the development of WM (Boucher et al., 2011). From a classical statistical approach, a study using the same YL database from Vietnam has also found that child characteristics related to health and ability play a significant role in educational outcomes (Grijalba Espinosa, 2017).
On the other hand, and consistent with previous studies, the teaching, environment and self-regulation factors are more important for the discrimination of the high performers in math, compared to the low math performers (Musso et al., 2013). The most important environmental factors are: the teacher's qualifications and attitudes, the experience of the teacher, background and education of the parents and child, parental expectations regarding the child's achievement, and the principal's information and school management. Although individual cognitive and physical characteristics of the child also contribute to performance, these seem to be much less discriminating among high performers once they reach certain threshold levels needed for basic math performance (Musso et al., 2013). Family characteristics such as socio-economic status and academic support also have been found strongly associated with cognitive achievement in previous studies using the same YL dataset (Grijalba Espinosa, 2017). In addition, the present study contributes with information regarding the specific weights of the variables corresponding to students with different levels of performance. In addition, given that the effects and interaction effects between all cognitive, non-cognitive and social variables at different levels are not linear and unidirectional, ANN are a powerful tool of analysis.
The predictive modeling of Vietnamese language performance has shown similar patterns: physical/ health factors, cognitive factors, and child routines and habits appear to contribute with more predictive weight to the classification of both high and low performers. However, if we compare each category for both performance levels, cognitive factors are more important for the accurate classification of low Vietnamese language performance students. The importance of cognitive processing for verbal abilities, language learning, reading comprehension, and writing have been documented in the literature (e.g., Engle, 2002; Unsworth et al., 2009). Therefore, at the lowest level of Vietnamese language performance, these basic predictors provide important information to discriminate those students who are not able to achieve good language performance.
Contribution of School and Teacher Factors
Regarding the contribution of school and teacher characteristics on both extreme groups (low 33% and high 33% performers), additional important findings resulted from the ANN models. For Math performance, the variables under the category Teacher background, qualification and attitudes of the teacher category (number of days of professional/in-service training in the last academic year, years of experience in the same grade, positive and negative attitudes, highest level teacher training qualification received, number of days of professional/in-service training in the last academic year, and extra work or private tuition to supplement income) are the most important predictors for an accurate classification.
A similar pattern was found for the contribution of school and teacher characteristics for both extreme groups (low 33% and high 33% performers) of Vietnamese language performance. Some variables of the Teacher background, qualification and attitudes of the teacher category are found to be the most important predictors (“During the last academic year how often was your work as a teacher in this school evaluated,” years of experience in the same grade, positive and negative attitudes, highest level of teacher training qualification received, number of days of professional/in-service training in the last academic year, etc.).
However, the Background, qualification and attitudes of the teacher category, together with the Principal information and school management category, had more predictive weight for high performers in math compared with low performers in math. On the other hand, the teaching of Vietnamese or Math category (number of minutes of class studies in Math each week, number of Math homework task-sets each week, difficulty level of Grade 5 Math textbooks, and teacher specialization in Math in post-secondary education) had more importance for low performers in math.
The Background, qualification/attitudes of the teacher, Teaching of Vietnamese (or Math), and the school information categories, had more weight for high performers compared with low performers in Vietnamese language. On the other hand, for low performers, factors related to the “student” categories were more important: cognitive and non-cognitive factors/self-regulation, physical factors and health, and the socio-economic status of the family categories were the ones contributing more strongly to the discrimination between low and high performers.
These different impact of teacher related variables should be taken into account for the planning of in-service and pre-service training programs, and to explore those aspects of the variables that could be enhanced to provide a broader positive impact in educational outcomes.
Implications and Conclusions
These results have important implications for policy makers and for educational research. First, the decisions made by economists tend to focus at the school level (teachers, principals, and learning outcomes) but they are limited in scope if they do not include the child, family, and the social milieu as important levels of analysis. The application of robust predictive systems such as ANN help to design more targeted interventions and/or diagnostic “early-warning” systems tailored to the needs of each performance group. In addition, the study makes clear the fact that in developing environments such as those found in Vietnam, there are clear factors that significantly and strongly impact learning outcomes, which are outside the sphere of traditional educational interventions.
This study suggests that, at least in this case study, resources should be allocated in four priority areas: (1) to promote a healthy cognitive and physical development of children from early in life (early stimulation, early access to school programs, pre and post-natal medical care, etc.), (2) to stimulate positive parental attitudes toward education and expectations/interest regarding the educational trajectories of their children, (3) to identify children and families at risk using indicators like health at birth, and (4) to select and train teachers in order to maximize the teacher characteristics that better predict a high performance (e.g., teacher attitudes in order to promote a positive school environment for learning).
Findings of this study could guide policy and mechanisms of financing to motivate different stakeholders (e.g., incentives for parents that invest in the child's cognitive development, physical health, and nutrition, incentives for those teachers who maximize cognitive early stimulation, incentives for school administrators who improve teacher selection and training).
In addition, the present results are very informative for educational research, specifically for cognitive theoretical advances and the development of learning systems and automated tutoring. The findings support the crucial role of nutrition, family routines and the entire inmediate environment (household) for cognitive development and learning outcomes. Once a certain level of functioning has been achieved, other non-cognitive variables and environmental factors come into play in influencing the desired educational outcomes. Policies and strategies that facilitate reaching those thresholds, and which also favor the approaches that increase the utility of those variables that come into play once the minimum levels are achieved could be informed more precisely by this kind of research.
Predictive systems as those exemplified by ANN offer an important advantage when the objective is a very accurate classification of students (which is also what traditional tests attempt to do). This methodological approach adds the advantage of doing so without all the test development, sampling and administration issues of traditional testing. In addition, ANN maximize the possibility of using very large datasets which can also include a much broader spectrum of all factors influencing a student's overall performance. Thus, this approach represents a more valid method for the prediction and modeling of future educational outcomes due to its overall accuracy and the breadth of the constructs considered to classify the expected performance. “If we can identify specific profiles of students, focusing on the most important variables, this opens major possibilities for the improvement of assessment procedures and the planning of pre-emptive educational interventions” (Musso, 2016, p. 209). In addition, the identification of specific patterns for extreme groups of performance provides a guide for more focused educational interventions, policies and investment.
It is important to consider some limitations about this study. The models were designed to predict performance only in two subjects (math and Vietnamese language at Grade 5). Further research could explore if these findings can be replicated when other content areas of school subjects are considered. Similarly, predictive methods in other countries and cultures could be used to explore the generalization of these models to other social environments. The present study requires a deeper analysis of the patterns of variables and their impact on educational outcomes. Future research should analyze the level of impact that interventions based on these findings improve or not learning outcomes under specific conditions. In addition, from the methodological perspective, carrying out similar studies with a more thorough cross-validation scheme utilizing a k-fold cross-validation procedure would help to more precisely establish the degree of generalizability of the results.
In conclusion, these results suggest that a predictive systems approach based on ANN results in robust models of factors that contribute to low and high levels of performance in mathematics and Vietnamese language in Grade 5 in Vietnam. These models generalize well to validation and hold-out samples. Nonetheless, the number of students in the hold-out sample (as a result of the low number of cases in the whole study) is a limitation that future studies should address by having a greater number of cases in all samples. It is difficult to find databases with all the factors considered in this study, but with an increase in the use electronic interconnected databases, it could be achieved.
This study has shown that ANN minimize classification error and are able to detect the contribution of each factor from the predictor set, taking into account all the complex intercorrelations, thus providing the opportunity to identify those that contribute most to each level of performance. In turn, these findings suggest possible interventions that could maximize the benefits for specific students. In this case, the suggested interventions could maximize the effectiveness of efforts to increase performance levels of low-performing students in mathematics and Vietnamese language in Vietnam.
The relatively small contribution of predictive weight provided by each variable for the predictive classification of performances, suggests that there is no “magic bullet” and that it is the combined and cummulative effect coming from all these variables that has a significant impact on outcomes. This insight suggests that financing mechanisms should be planned taking into account a broad set of educational indicators rather than isolated variables. It has important implications for public policy in general, and for educational policy and education in particular, when considering integrative and focused interventions.
Data Availability Statement
The raw data supporting the conclusions of this article will be made available by the authors, without undue reservation, to any qualified researcher.
Ethics Statement
The studies involving human participants were reviewed and approved by World Bank Group. Written informed consent to participate in this study was provided by the participants' legal guardian/next of kin.
Author Contributions
MM and EC contributed to the conceptualization of the research and to the design of the study, carried out most of the statistical analyses, including jointly developing the neural network models. MM wrote the first draft of the results and discussion, and prepared the final draft. EC contributed to the results and discussion sections and reviewed the final draft. NB contributed to the conceptualization of the study, organized the database, wrote part of the introduction and method sections of the manuscript and also carried out some of the classical statistical analyses. MC contributed to the conceptualization of the study and to the discussion of school related effects. All authors contributed to the manuscript review and revisions, read, and approved the submitted version.
Funding
This research was supported by Results in Education for All Children (REACH) Education Global Practice, World Bank Group.
Conflict of Interest
The authors declare that the research was conducted in the absence of any commercial or financial relationships that could be construed as a potential conflict of interest.
Supplementary Material
The Supplementary Material for this article can be found online at: https://www.frontiersin.org/articles/10.3389/feduc.2020.00104/full#supplementary-material
References
Abu Naser, S. S. (2012). Predicting learners performance using artificial neural networks in linear programming intelligent tutoring system. Inter. J. Artif.l Intell. Appl. (IJAIA) 3, 65–73. doi: 10.5121/ijaia.2012.3206
Asselborn, T., Gargot, T., Kidzinski, L., Johal, W., Cohen, D., Jolly, C., et al. (2018). Automated human-level diagnosis of dysgraphia using a consumer tablet. npj Digital Med. 1:42. doi: 10.1038/s41746-018-0049-x
Barnett, I., Ariana, P., Petrou, S., Penny, M. E., Duc, T. L., Galab, S., et al. (2013). Cohort profile: the Young Lives study. Intern. J. Epidemiol. 42, 701–708. doi: 10.1093/ije/dys082
Boekaerts, M., and Cascallar, E. C. (2006). How far have we moved toward the integration of theory and practice in self-regulation. Educ. Psychol. Rev. 18, 199–210. doi: 10.1007/s10648-006-9013-4
Boucher, O., Burden, M. J., Muckle, G., Saint-Amour, D., Ayotte, P., Dewailly, E., et al. (2011). Neurophysiologic and neurobehavioral evidence of beneficial effects of prenatal omega-3 fatty acid intake on memory function at school age. Am. J. Clin. Nutrit. 93, 1025–1037. doi: 10.3945/ajcn.110.000323
Caruana, R., and Niculescu-Mizil, A. (2006). An Empirical Comparison of Supervised Learning Algorithms Using Different Performance Metrics. Proceedings of the 23rd International Conference on Machine Learning (Pittsburgh, PA).
Cascallar, E. C., Boekaerts, M., and Costigan, T. E. (2006). Assessment in the evaluation of self-regulation as a process. Educ. Psychol. Rev. 18, 297–306. doi: 10.1007/s10648-006-9023-2
Checa, P., Rodríguez-Bailón, R., and Rueda, M. R. (2008). Neurocognitive and temperamental systems of self-regulation and early adolescents' social and academic outcomes. Mind Brain Educ. 2, 177–187. doi: 10.1111/j.1751-228X.2008.00052.x
Cueto, S., and León, J. (2012). Psychometric Characteristics of Cognitive Development and Achievement Instruments in Round 3 of Young Lives. Technical Note 25. Oxford: Department of International Development.
Cueto, S., León, J., Guerrero, G., and Muñoz, I. (2009). Psychometric Characteristics of Cognitive Development and Achievement Instruments in Round 2 of Young Lives, Young Lives Technical Notes. Young Lives.
Detienne, K. B., Detienne, D. H., and Joshi, S. A. (2003). Neural networks as statistical tools for business researchers. Organ. Res. Methods 6, 236–265. doi: 10.1177/1094428103251907
Duin, R. P. W. (1996). A note on comparing classifiers. Pattern Recog. Lett. 17, 529–536. doi: 10.1016/0167-8655(95)00113-1
Dunn, L., and Dunn, L. (1997). Examiner's Manual for the PPVT-III. Form IIIA and IIIB. Minnesota: AGS.
Engle, R. W. (2002). Working memory capacity as executive attention. Curr. Direct. Psychol. Sci. 11, 19–23. doi: 10.1111/1467-8721.00160
Fong, S., Si, Y.-W., and Biuk-Aghai, R. P. (2009). “Applying a hybrid model of neural network and decision tree classifier for predicting university admission,” in Proceedings of the 7th International Conference on Information, Communication, and Signal Processing (ICICS2009), (Macau: IEEE Press), 1–5.
Fuchs, L. S., Compton, D. L., Fuchs, D., Paulsen, K., Bryant, J. D., and Hamlett, C. L. (2005). The prevention, identification, and cognitive determinants of math difficulty. J. Educ. Psychol. 97:493. doi: 10.1037/0022-0663.97.3.493
Grijalba Espinosa, A. (2017). “Estimating the education production function for cognitive and non-cognitive development of children in vietnam through structural equation modeling using young lives data base,” in Master dissertation of Science in Quantitative Research Methods at University College London.
Herzog, S. (2006). Estimating student retention and degree-completion time: decision trees and neural networks vis-à-vis regression. New Direct. Instit. Res. 2006, 17–33. doi: 10.1002/ir.185
Kanakana, G., and Olanrewaju, A. (2011). Predicting Student Performance in Engineering Education Using an Artificial Neural Network at Tshwane University of Technology, Proceedings of the ISEM (Stellenbosch).
King, R., Feng, C., and Shutherland, A. (1995). Statlog: comparison of classification algorithms on large real-world problems. Appl. Artif. Intell. 9, 259–287. doi: 10.1080/08839519508945477
Lykourentzou, I., Giannoukos, I., Mpardis, G., Nikolopoulos, V., and Loumos, V. (2009). Early and dynamic student achievement prediction in e-learning courses using neural networks. J. Am. Soc. Inform. Sci. Technol. 60, 372–380. doi: 10.1002/asi.20970
Maroco, J., Silva, D., Rodrigues, A., Guerreiro, M., Santana, I., and de Mendonça, A. (2011). Data mining methods in the prediction of Dementia: a real-data comparison of the accuracy, sensitivity and specificity of linear discriminant analysis, logistic regression, neural networks, support vector machines, classification trees and random forests. BMC Res. 4:299. doi: 10.1186/1756-0500-4-299
Mavrovouniotis, M. L., and Chang, S. (1992). Hierarchical neural networks. Comp. Chem. Eng. 16, 347–369. doi: 10.1016/0098-1354(92)80053-C
Musso, M. F. (2016). Understanding the Underpinnings of Academic Performance. The Relationship of Basic Cognitive Processes, Self-Regulation Factors and Learning Strategies with Task Characteristics in the Assessment and Prediction of Academic Performance. Doctoral Dissertation. (Belgium: University of Leuven).
Musso, M. F., Kyndt, E., Cascallar, E. C., and Dochy, F. (2012). Predicting mathematical performance: the effect of cognitive processes and self-regulation factors. Educ. Res. Intern. 12:719. doi: 10.1155/2012/250719
Musso, M. F., Kyndt, E., Cascallar, E. C., and Dochy, F. (2013). Predicting general academic performance and identifying the differential contribution of participating variables using artificial neural networks. Front. Learn. Res. 1:13. doi: 10.14786/flr.v1i1.13
OECD (2013). PISA 2012 Results: Excellence Through Equity: Giving Every Student the Chance to Succeed (Vol. II). PISA, OECD Publishing. doi: 10.1787/9789264201132-en
Parandekar, S., and Sedmik, E. (2016). Unraveling a secret: vietnam's outstanding performance on the PISA test. Policy Res. Work. Paper 7630, 1–43. doi: 10.1596/1813-9450-7630
Passolunghi, M. C., Cornoldi, C., and De Liberto, S. (1999). Working memory and intrusions of irrelevant information in a group of specific poor problem solvers. Mem. Cogn. 27, 779–790. doi: 10.3758/BF03198531
Passolunghi, M. C., and Pazzaglia, F. (2005). A comparison of updating processes in children good or poor in arithmetic word problem-solving. Learn. Indiv. Diff. 15, 257–269. doi: 10.1016/j.lindif.2005.03.001
Pinninghoff Junemann, M. A., Salcedo Lagos, P. A., and Contreras Arriagada, R. (2007). “Neural networks to predict schooling failure/success,” in IWINAC2007, PartII, LNCS 4528, eds J. Mira and J. R.'Alvarez (Berlin/Heidelberg: Springer-Verlag, 571–579.
Rolleston, C., James, Z., Pasquier-Doumer, L., Thi Minh Tam, T. N., and Thuc Duc, L. (2013). Young Lives Working Paper 100. Making Progress: Report of the Young Lives School Survey in Vietnam. Oxford, UK: Young Lives, Department of International Development at the University of Oxford, 62.
Rumelhart, D. E., McClelland, J. L., and the PDP research group. (1986). Parallel Distributed Processing: Explorations in the Microstructure of Cognition, Vol 1. Cambridge, MA: MIT Press.
Specht, D. (1991). A general regression neural network. IEEE Trans. Neural Netw. 2, 568–576. doi: 10.1109/72.97934
United States Agency for International Development. (2020). Available online at: https://www.air.org/sites/default/files/downloads/report/ESP%20Remedial%20Reading%20Report%20Egypt_July%202014.pdf (accessed February 22 2020).
Unsworth, N., Redick, T., Heitz, R., Broadway, J., and Engle, R. (2009). Complex working memory span tasks and higher-order cognition: a latent-variable analysis of the relationship between processing and storage. Memory 17, 635–654. doi: 10.1080/09658210902998047
Walczak, S. (1994). Categorizing university student applicants with neural networks. IEEE Intern. Conf. Neural Netw. 6, 3680–3685. doi: 10.1109/ICNN.1994.374796
White, H., and Racine, J. (2001): Statistical inference, the bootstrap, neural network modelling with application to foreign exchange rates. IEEE Trans. Neural Netw. 12, 657–673. doi: 10.1109/72.935080
Keywords: prediction, machine learning, academic performance, educational outcomes, neural networks
Citation: Musso MF, Cascallar EC, Bostani N and Crawford M (2020) Identifying Reliable Predictors of Educational Outcomes Through Machine-Learning Predictive Modeling. Front. Educ. 5:104. doi: 10.3389/feduc.2020.00104
Received: 05 December 2019; Accepted: 04 June 2020;
Published: 16 July 2020.
Edited by:
Okan Bulut, University of Alberta, CanadaReviewed by:
Jinnie Shin, University of Alberta, CanadaRen Liu, University of California, Merced, United States
Copyright © 2020 Musso, Cascallar, Bostani and Crawford. This is an open-access article distributed under the terms of the Creative Commons Attribution License (CC BY). The use, distribution or reproduction in other forums is permitted, provided the original author(s) and the copyright owner(s) are credited and that the original publication in this journal is cited, in accordance with accepted academic practice. No use, distribution or reproduction is permitted which does not comply with these terms.
*Correspondence: Mariel F. Musso, bWFyaWVsLm11c3NvQGhvdG1haWwuY29t
†ORCID: Mariel F. Musso orcid.org/0000-0002-3226-5076
 Mariel F. Musso
 Eduardo C. Cascallar
 Neda Bostani4
