- Department of Education Sciences, LEARN! Research Institute and Amsterdam Center for Learning Analytics, Vrije Universiteit Amsterdam, Amsterdam, Netherlands
Ability grouping has been argued to improve study success because it allows teachers to better tailor their instruction and guidance to the educational needs of students. However, teachers must then be able to assess what to tailor their instruction to. One test, based on the Life-Cycle Theory of Leadership, assesses cognitive skills and personality traits to generate advice on the optimal guidance style per student. This test was used in an upper secondary vocational education school to group students with the same advised guidance style. We investigated whether students actually prefer the advised guidance style and whether teachers can adapt their guidance to the styles advised for the group. The results indicate that students are somewhat more likely than chance to prefer the advised guidance style. Similarly, teachers are somewhat more likely than chance to correctly identify this guidance style of a class, but they do not adapt their guidance to the advised style even though they were motivated to do so. This suggests that assessment can be used to diagnose guidance styles, but not with sufficient fidelity so that it can be acted upon.
Introduction
Study success is important at all levels of higher education, but especially in upper secondary vocational education (hereafter referred to as vocational education). One technique to increase study success is ability grouping, the practice of organizing classrooms to combine students who have been assessed as being similar in ability. In their meta-analyses, Kulik and Kulik (1982) concluded that grouping secondary school students in such ways is beneficial to their performance. Also, if elementary schoolchildren with the same abilities are placed in one group, learning achievements are higher (Duflo et al., 2011; CPB, 2016). Ability grouping may be effective because it leads to positive peer effects, but it may also allow teachers to more effectively tailor their teaching style to the students. This study investigates whether ability grouping indeed leads to more effective tailoring of teachers' teaching styles.
There are many arguments for and against ability grouping (also referred to as academic tracking). Hanushek and Wößmann (2006) for example explain that ability grouping has positive and negative outcomes with regard to achievement. On the one hand, ability grouping is considered positive because homogeneous classrooms allow better focused curricula and appropriately paced instruction. On the other hand, early grouping can result in an increase in inequality in achievement (Hanushek and Wößmann, 2006). Ability grouping may also encourage teachers and students to believe that ability is more fixed than malleable. This way, teachers' expectations may affect student motivation and therefore could play a part in learning and achievement (Ireson et al., 2005) and students may act according to their ability group, also affecting motivation and achievement (Zevenbergen, 2005). Moreover, positive effects on performance are not always found.
Slavin (1990) performed a review about the effects of ability grouping on student achievement in secondary schools, and found little evidence that ability grouping is beneficial to the achievement of students. As an alternative, they found that within-class ability grouping could be more effective. Interestingly, the first limitation (Slavin, 1990) mentions in his review is that it would be important to be able to relate outcome to changes in teacher behaviors or classroom characteristics. He argued that, particularly, the degree to which teachers in ability-grouped schools actually differentiate instruction is questionable, which is a point we will come back to.
Although most studies of ability grouping have been performed in primary or secondary education, some studies have also looked at ability grouping in higher education. Booij et al. (2015) found that placing university students in groups of similar ability has a positive effect on dropout rates and achievement. They assigned circa 600 Economics students either randomly to tutorial groups, or grouped them based on their grade point average (GPA) on the nationwide final exams of secondary education. The students in the lower two thirds of the GPA distribution gained on average 0.19 standard deviations of achievement, when they were in ability-grouped tutorial groups, while the dropout rate was reduced by around 12% points. High-GPA students were unaffected. Indirect confirmation comes from a study by Carrell et al. (2013) who tested the opposite manipulation of maximally mixing students. This was done to maximize the performance of the lowest ability students by grouping freshman United States Air Force Academy students with the highest and the lowest GPA scores. They found the opposite, namely, worse performance in the optimally mixed groups as compared to the control condition of random groups. This suggests again that students do better in more homogeneous groups.
The literature suggests two explanations for the effectiveness of ability grouping, peer effects, and better adapted guidance styles. As an example of the former, Carrell et al. (2013) explain their results from the hypothesis that students prefer to work in groups of similar ability, and form their own (homogeneous) subgroups when in mixed classes. In addition, Booij et al. (2015) showed that students from the lower end of the GPA distribution are more involved in a tracked group than in a mixed ability group; these students also have more positive interaction with their tutorial group peers. As an example of the latter, Duflo et al. (2011) state that all students (lower-achieving particularly) may benefit from ability grouping because it allows teachers to better tailor their instruction and guidance to the students. Indeed, one of the drivers of study success is the quality of student guidance (Nevala and Hawley, 2011; Bettinger and Baker, 2014). In surveys, vocational educational students typically indicate that better support from teachers and mentors is important for them to increase their study success (Derriks and Vergeer, 2010). It is this second explanation for the success of grouping that is investigated in this paper.
For teachers to be able to tailor their instruction and guidance to students, it must be true that different types of students may respond best to different guidance styles, and this can be assessed relatively efficiently. One inspiration for this idea comes from the Life-Cycle Theory of Leadership (Hersey and Blanchard, 1996). The Life-Cycle Theory of Leadership is often used in organizations to analyze and structure the interaction between superiors and workers. According to Hersey and Blanchard (1996), a superior's guidance style should be tuned to the ability (competence) and willingness (commitment) of the worker. When ability is low, the superior should guide a worker on the task. When willingness is low, the superior should guide a worker on the relationship. This relation is shown in Figure 1. Each quadrant leads to a different optimal style of leadership.
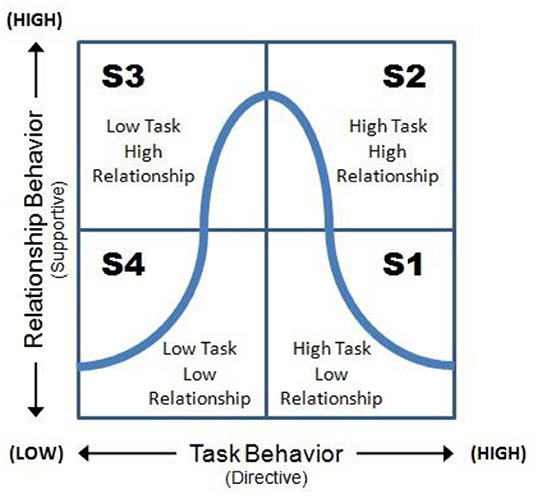
Figure 1. The life-cycle theory of leadership. The quadrants represent degrees of the dimensions, “task,” and “relationships.” Later, four leadership styles were mentioned: S1: directing, S2: coaching, S3: supporting, S4: delegating (Blanchard et al., 1993).
Even though the empirical basis behind the Life-Cycle Theory of Leadership is rather thin, it has been applied widely in the management literature (Cote, 2017). The theory has also been applied to education, with the idea that a teacher is a leader whose guidance style should adapt to the needs of the classroom—again, without strong empirical support (Clark, 1981; Halima, 2006; Raza and Sikandar, 2018). Life-Cycle Theory of Leadership is the inspiration behind the AMN test (Assess, Manage and Navigate), used for entry assessment purposes by up to 60% of Dutch vocational education institutions. The AMN test assesses cognitive and personality ability, including the Big 5, when students enroll in vocational education. Outcomes are summarized in cognitive and personality ability scores that generate an advised guidance style, in accordance with the Life-Cycle Theory of Leadership. Here, interaction between teachers and students is taken to be task- and relationship-related, just as that between superiors and workers in the theory of Hersey and Blanchard (1996). Grouping students according to the advised style would, according to the developers of the AMN test, help teachers in guiding the students optimally.
Recently, a pilot was run in one institute for vocational education in which freshman students were grouped according to the AMN-advised guidance style. We used the opportunity provided by this pilot to investigate whether guidance style can be assessed with sufficient fidelity to act upon. In particular, we investigated whether students indeed have a preference for the guidance style that matches their assessment results from the AMN test, and, whether teachers can recognize guidance style of students within one class. Both would validate the assessment of guidance style. In a further step, we investigated whether teachers tailor their teaching style to the students' assessed guidance style.
This paper proceeds as follows. In section Context, the context of Dutch vocational education and the AMN test are explained. Section Methods and Descriptive Statistics discussed how students are grouped according to guidance styles, and the way teachers address the guidance styles of their students. Section Results presents our findings. Finally, in section Conclusions and Discussion, the conclusions and implications for practice and research will be discussed.
Context
Dutch Education System
This study was performed at a vocational education school in the Netherlands. The Dutch educational system relies heavily on tracking from secondary education onwards. After finishing primary education (grade six), children are tracked into three education levels based on the recommendation of the primary school, informed by a nationwide standardized test (see Figure 2).
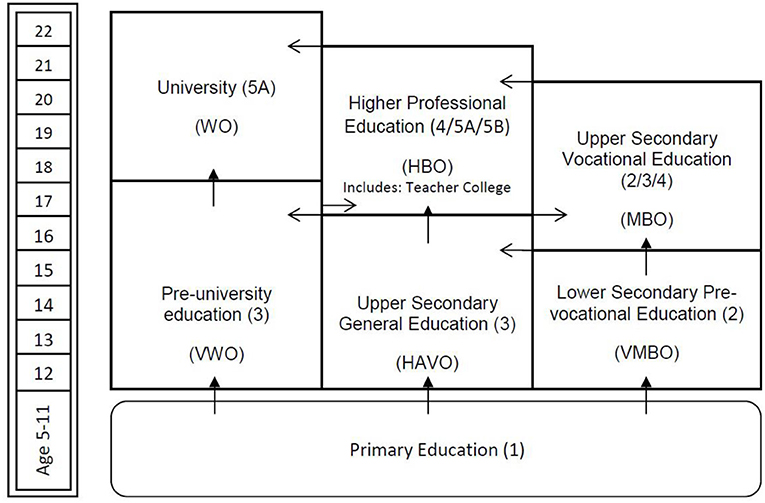
Figure 2. The Dutch education system. After finishing primary education (grade 6), children are tracked into three educational levels based on the recommendation of the primary school. Prevocational Education (VMBO, 4 years), which prepares children for vocational education (3 or 4 years). The middle education level is referred to as upper secondary general education (HAVO, 5 years), which prepares children for higher professional education (HBO, 4 years). The highest education level children can be tracked to is referred to as pre-university education (VWO, 6 years), which prepares children for an academic university study (4 or 5 years). ISCED level in parentheses (Cornelisz and van Klaveren, 2018).
About half of the children are tracked into two forms of general education (labeled HAVO and VWO in Figure 2), while the other half attend the prevocational track (labeled VMBO) between the age of 12 and 16 (Dutch Ministry of Education Culture Science, 2013). Prevocational education prepares children for upper secondary education vocational education (vocational education in this paper, MBO in Dutch). This latter type of education, organized in large institutions, consists of programs that train for specific professions. These programs are typically developed together with the industry in which the graduates will work after completing the program.
Vocational education is itself tracked, with four levels labeled one to four. Depending on this level, vocational education students are on International Standard Classification of Education (ISCED) level two (first stage of secondary education building on primary education, typically with a more subject-oriented curriculum), three (second/final stage of secondary education preparing for tertiary education and/or providing skills relevant to employment, usually with an increased range of subject options and streams), or four (programs providing learning experiences that build on secondary education and prepare for labor market entry and/or tertiary education; the content is broader than secondary but not as complex as tertiary education).
To reach a basic qualification that is considered a minimum requirement to enter the job market in the Netherlands, students have to obtain a level two diploma or higher before leaving vocational education. Study success in vocational education is a main goal of Dutch educational policy because without a degree, students miss the basic qualification to carry out an occupation and contribute to society.
This study was conducted at one vocational education school, ROC TOP Sportacademie Amsterdam, which educates students in sport-related fields on ISCED level three and four. This school has about 300 students and is part of ROC TOP, the umbrella organization (with about 4,000 students). Students at ROC TOP Sportacademie Amsterdam remain in the same group for 95% of their time at school, and during classes, the students see different teachers. Classes are mixed only during some sport lessons.
AMN Test
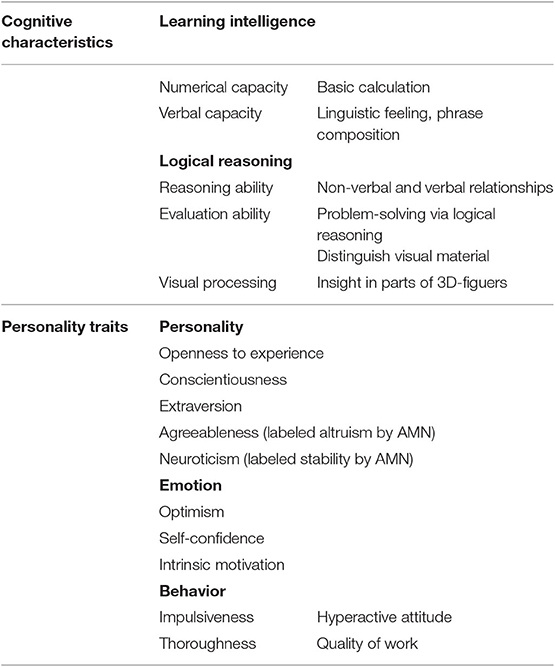
Nowadays, about 60% of all the Dutch vocational education schools use the AMN test to assess cognitive characteristics and personality traits of incoming students. Psycho-diagnostic instruments issued in the Netherlands, like the AMN test, are reviewed by the independent Dutch Committee on Tests and Testing (COTAN, part of the National Institute of Psychologists). COTAN audits the quality of psychological tests with the objective to raise standards in the use of such tests. The formative entry test of AMN was validated by COTAN. Table 1 shows that it measures various cognitive skills and the Big Five personality traits. The measurements are normed separately for the four levels of vocational education.
Based on the idea that different types of students respond best to different guidance styles (and inspired by the Life-Cycle Theory of Leadership), the AMN test assesses both cognitive characteristics and personality traits to generate a guidance style for each student. The style depends on the amount of “concern of people/relationship” and of “concern of production/task” (in the AMN test called personality and capacity). The AMN manual (AMN, 2014) mentions four guidance styles: coaching, supporting, delegating, and directing (shown in Figure 3). These styles are fixed and correspond with a score on capacity and personality, e.g., someone scores “4” on capacity and “3” on personality, the guidance style of this student is “delegating.” These guidance styles are proposed to guide students appropriately.
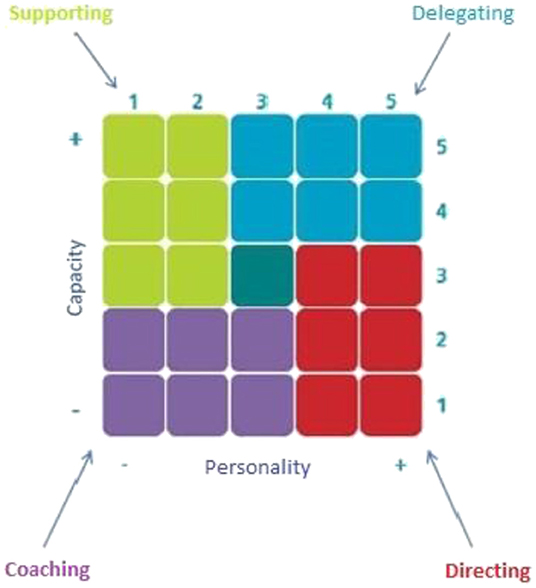
Figure 3. Optimal guidance styles as a function of personality and capacity scores, according to AMN (2014). Coaching: these participants should be guided on both the task as well as on the relationship. Supporting: these participants should be guided on mainly the relationship, less on the task. Delegating: these participants need little guidance on both the task and the relationship. Directing: these participants should be guided on mainly the task, less on the relationship.
Because of the large number of dropouts in vocational education, ROC TOP in 2012 introduced the AMN test in the intake procedure of students. First, for cohort 2012–2013, the incoming students took the test, but the results were not used to advise students. For cohort 2013–2014 the outcomes of the test were used during an intake interview to advise students on whether to pursue their chosen professional education. Students were then grouped with only equal gender distribution across classes as a criterion. Since cohort 2014–2015, ROC TOP Sportacademie Amsterdam uses the AMN test both to advise students during intake and to group students afterwards on the basis of the advised guidance style (Figure 3).
Here, we performed a student survey whether students identify with the guidance style suggested by AMN, and an observation study to see whether teachers adapt their guidance to the suggested guidance style.
Methods and Descriptive Statistics
Population
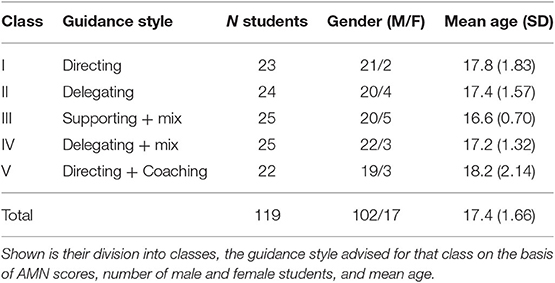
This study considered data of 119 students who enrolled in the educational program of ROC TOP Sportacademie Amsterdam in 2016. Of these students, 102 were male, while age varied from 15 to 24 (mean age: 17.4). Students were grouped into one of five classes according to the guidance style generated by the AMN test. Just the three most homogeneous classes were observed in the study, because they would yield a clear advised guidance style that could be compared to actual teacher behavior. Table 2 shows for each class which style was advised for it, and student body descriptives. Classes I, II, and III were observed.
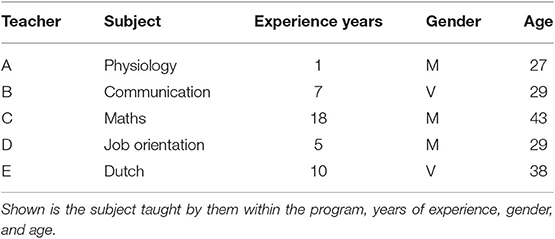
Five teachers, each teaching a different subject (Table 3), were observed six times (two lessons per class), leading to a total of 30 observed lessons. The observations were planned ahead in consultation with the teachers. Seven out of eight teachers that taught the observed classes also filled out a questionnaire about the guidance style of the class.
Materials
A questionnaire was developed to examine whether the students indeed prefer the guidance style advised for them from their AMN test profile. AMN's description of different student behaviors matching each guidance style (AMN, 2014) was taken as starting point. These descriptions varied in length from five to seven sentences, contained also six to eight keywords, and had a standardized setup in which different needs of students and the optimal behavior of teachers were described. The first author checked each sentence in the description, and those that identified characteristics of students needing the guidance style was reformulated into statements that students could rate as applying to them. These statements were then independently assessed by the third author and checked against the original AMN descriptions. The questionnaire was thus constructed to match the AMN descriptions as closely as possible; in the results, we report the outcomes of a principal component analysis that shows that the items belonging to the same profile did not lead onto the same factors, as would be predicted from AMN's theoretical foundation.
Students were asked if the different behavioral aspects of each guidance style were applicable to them on a scale from 1 = completely disagree to 4 = completely agree (Appendix I). Students spent on average 6.5 min on the 27 questions, ranging from 1.48 to 26.48 min. Statements belonging to each style were then taken together into a style score by averaging them. These style scores were then converted to z-scores to allow comparison.
To see if teachers follow the guidance style generated by the AMN test, we developed an observation scheme (Appendix II), inspired on the ICALT form used to assess Dutch secondary education teachers (van de Grift, 2007). We again took the AMN descriptions as starting point accompanied by a list containing 22–29 keywords of teacher behavior matching each guidance style. These behaviors were converted by the first author into observable items, which were then checked and refined by the third author. We deleted those that matched more than one style. The majority of the items focus on communication with the class and steering behavior. Items were scored with a one (=observed) or a zero (=not observed). Inter-rater reliability between two observers of the observation scheme was determined by calculating the Cohen Kappa (0.5384). The two observers agreed on 69.93% of the items, which is considered moderate and is substantially higher than chance level of 34.86%.
Seven out of eight teachers that taught the observed classes also filled out a questionnaire about the guidance style of the class (Appendix III). This questionnaire contains the statements of the student questionnaire reformulated into statements about the class. The teachers linked the different classes to the guidance style statements. It was possible to link more classes to one statement and the teacher could also choose “not applicable.”
Results
Do Students Have the Predicted Preference for Guidance Styles?
The questionnaire was filled out by 102 students who indicated their preferred guidance style. The questionnaire asked the students to rate how much they appreciated different aspects of each guidance style. Then, the style whose aspects received highest ratings was deemed the preferred style of the student. Table 4 shows the cross tabulation of preferred and advised guidance styles. Twenty-four of 102 students had the same preferred style as the one advised by AMN.
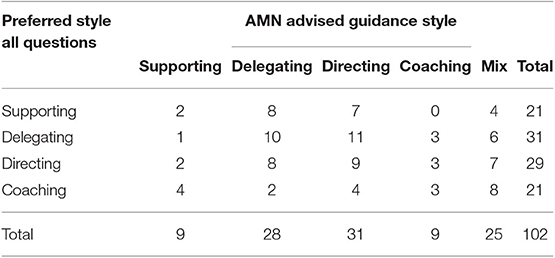
Table 4. Cross tabulation of the guidance style advised by the AMN, and the preferred guidance style as deduced from the student's answers to all questions about behavior aspects of the styles.
In the last question of the questionnaire, students were given descriptions of each style to read and were asked to choose which style best fitted their needs. This style will be referred to as the “chosen style.” Twenty-seven students had the same chosen style as advised by AMN (Table 6). Thirty-eight students had a same preferred style and chosen style (Table 7, comparing their responses to the whole questionnaire with that to the summarizing last question).
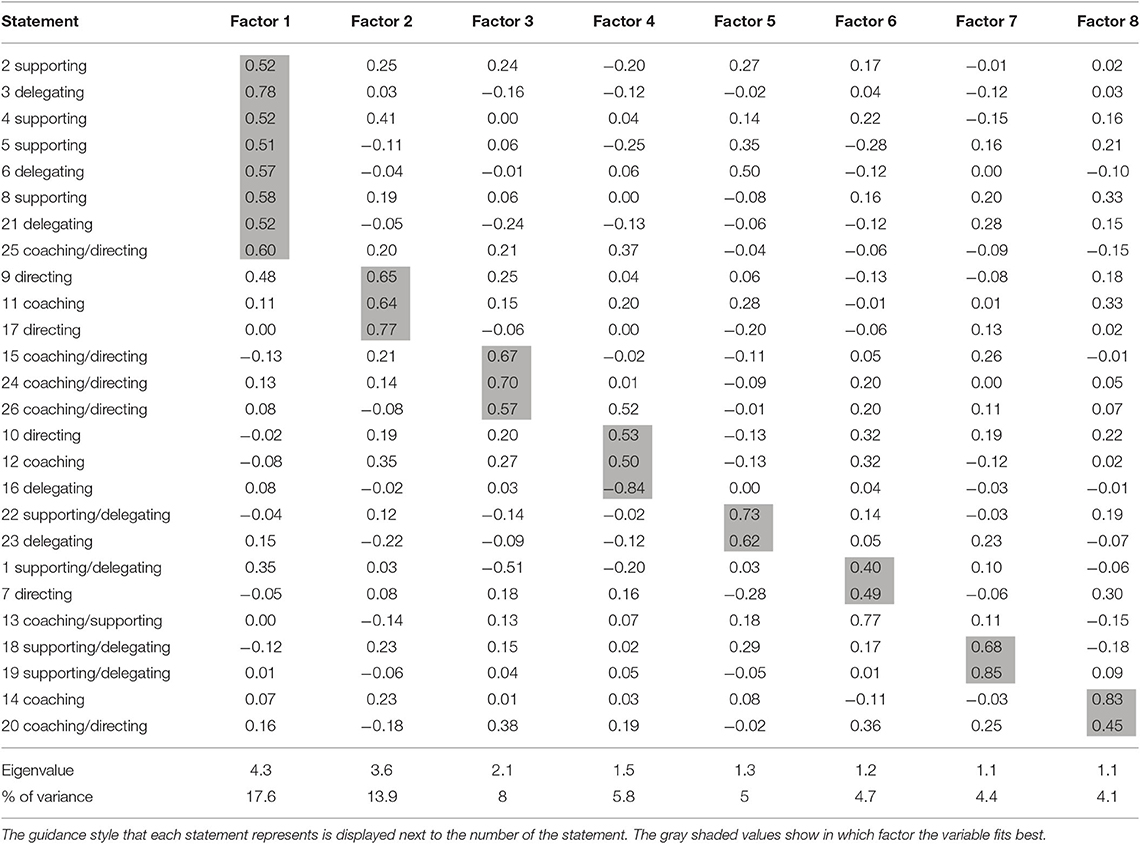
To see whether statements belonging to the same style correlated to the extent that they would form an independent factor, we performed a principal component analysis with varimax rotation. Table 5 shows the outcomes of the principal component analysis. Eight factors have an eigenvalue above the cutoff of 1.0 [χ2(325) = 772.7, p < 0.001], which together explained 63.5% of the observed variance. However, statements linked to different guidance styles seem randomly distributed over these factors, which suggest that there is little coherence between the statements belonging to each of the four styles. Given this result, we did not perform a further confirmatory factor analysis. Cronbach's alpha of the total questionnaire was 0.76.
To test whether the preferred and advised style were independent of one another, we performed χ2 test on the data in Tables 6, 7. AMN advises a mixed style when the capacity and personality scores are both at the middle value of “3.” Since “mixed” was not given as an option for the students, students with such a mixed style advice were excluded from the analyses. Chosen style and advised style were shown not to be independent, χ2 (12, N = 102) = 29.71, p = 0.003 (Table 6), nor were preferred and chosen style independent, χ2 (9, N = 102) = 22.62, p = 0.007 (Table 7).
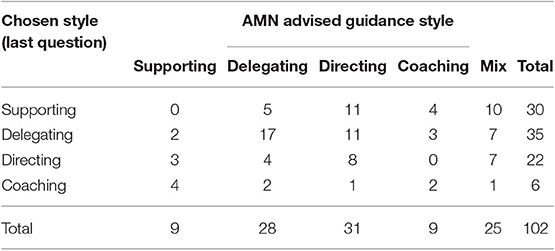
Table 6. Cross tabulation of the guidance style advised by the AMN, and the style chosen by students as best fitting their needs in the last question of the questionnaire.
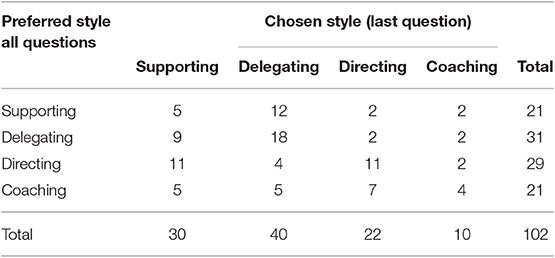
Table 7. Cross tabulation of the style chosen by students as best fitting their needs in the last question of the questionnaire, and the preferred guidance style as deduced from the student's answers to all questions about behavior aspects of the styles.
The test of independence shows that chosen and advised style were not independent. To determine whether this was so because the students chose the advised style at higher than chance level, a binominal test was done. Thirty-five percent of students chose the same guidance style as AMN advised for them, which was significantly higher than the expected 25% (N = 77, p = 0.03). A similar test comparing preferred to chosen style showed that the style chosen in the last question matched the preferred style deduced from the whole questionnaire more often than expected from chance (N = 102, p = 0.004).
Do Teachers Address Students' Different Guidance Styles?
The results of the teacher questionnaire (Figure 4) showed that teachers could only partly assess the advised guidance style of the classes. When answering the questions by average guessing, the chance level is 29.9%. On average, teachers matched in 47.9% (±14.7 SD) of the cases the appropriate behavior to a class, which is substantially higher than chance level.
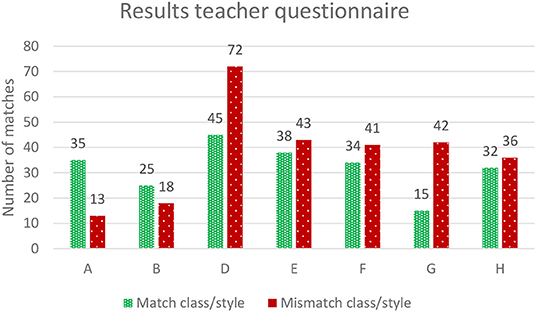
Figure 4. Results of the teacher questionnaire. Shown is the number of statements either correctly or incorrectly matched to the class. Teachers linked classes to guidance style statements. Teacher C did not fill out the questionnaire. Chance level is 29.9% correct, which most teachers transcend (correct matches A: 73%, B: 58%, D: 38%, E: 47%, F: 45%, G: 26%, H: 47%).
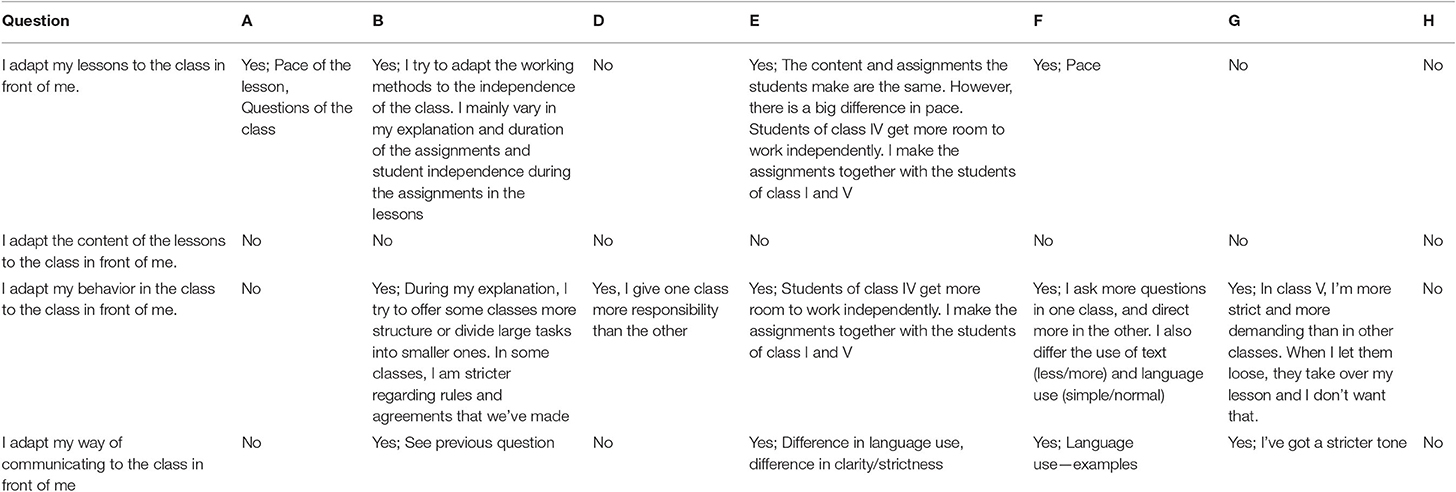
All teachers except teacher H stated that they adapted some aspect of their guidance to the class (Table 8). Teacher H was not one of the five teachers that were observed. Four of the seven teachers indicated that they adapt their lessons to the class in the sense that they increased or slowed down the pace of the lesson. Teacher E stated, for example: “The content and assignments the students make are the same. However, there is a big difference in pace. Students of class IV get more room to work independently. I make the assignments together with the students of class I and V.” None of teachers adapted the content of their lessons. When asked about teacher behavior, five of the seven teachers stated that they adapted that to the class. The teachers mentioned that they differentiated in the way they offer structure, independence, and responsibility to a class. Four teachers adapted their way of communication to the class. Regarding communication, some teachers suggested that their tone was stricter in some classes than in others. For example, teacher B stated: “… In some classes I am stricter regarding rules and agreements that we've made.”
Next, we investigated with lesson observations whether teachers show, in their behavior in class, the guidance style advised for each class. The observations were averaged over the two lessons observed in each class, and then analyzed in two ways. First, we coded guidance style relative to the advised style (i.e., giving the advised style code 1, the style for same-capacity different-personality students code 2, etc.). A lack of main effect, F(3, 45) = 1.133, p = 0.346, suggested that the teachers did not adopt the guidance style advised for the class, anymore than other styles. Figure 5 shows the behavior of the observed teachers in each of the three classes. No significant adaptation was seen.
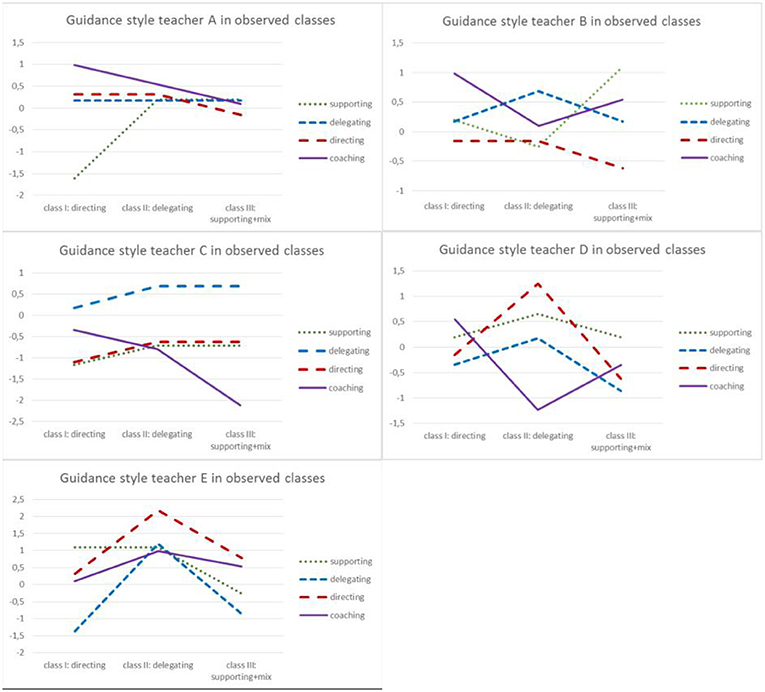
Figure 5. The guidance style of the observed teachers. This figure shows that, for example, teacher A uses a mix of styles in all classes (supporting is less used in class I) and that teacher C uses the delegating style most in all classes.
Finally, we investigated whether any style was shown more strongly by specific teachers through an ANOVA with the four guidance styles as dependent variables (i.e., not coded relative to the advised style of the class). An interaction between teacher and style showed that there were differences between teachers in the styles they exhibited, F(12, 45) = 2.422, p = 0.016 (see Figure 6). Some teachers consistently showed the same behavior in each class (such as teacher C), others less consistently so (such as teacher D), as shown by a three-way interaction between teacher, class, and style, F(4, 15) = 3.168, p = 0.045. Other interactions and main effects were not significant.
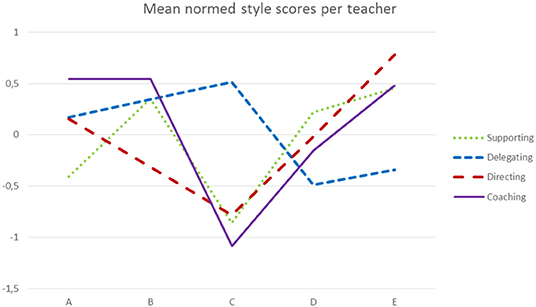
Figure 6. Mean normed style scores per teacher. This figure shows that there is a difference in the teaching style of teachers. C uses the delegating style most; in contrast, E used the other styles more, and other teachers used a mix of styles.
Conclusions and Discussion
In order to find out if ability grouping works because of better adapted guidance styles, we investigated whether students have the same preferred guidance style as the advised guidance style that the AMN test generates and whether teachers tailor their teaching style to the students' different guidance style. We therefore grouped students according to their AMN generated guidance style and developed two questionnaires: one student questionnaire and one teacher questionnaire. In addition to using the questionnaires, we also conducted 30 observations to see if teachers follow the guidance style generated by the AMN test.
Our student questionnaire showed that students' preferred guidance style matched the style AMN generated somewhat more often than chance, which is a low bar. This suggests the AMN test is somewhat useful to group classes according to their guidance style, but most students (65%) preferred a different guidance style than the one advised by the test. One explanation for this mismatch could be that students may lack the self-awareness to judge which style is best, or that they may give socially desirable answers. The advised style may still be optimal for them but they would not realize that or not report it. There are precedents for such a lack of self-understanding. For example, students seem unable to realize that underlining is not a good way to learn a text (Dunlosky et al., 2013).
A second possible explanation is that the AMN test is not the right instrument to assess guidance styles, for example, because it uses cutoffs to categorize students, which may cause the wrong attribution of a style to a person around the cutoff score. Noteworthy is that the same test has also been presented as a way to predict student dropout. However, the results of Eegdeman et al. (2018) showed that AMN results could not predict student dropout in vocational education. Still, the AMN test is used extensively in the Netherlands, so it is important to investigate the use of this test.
A third explanation is that perhaps students do not meaningfully differ in guidance style, or Hersey and Blanchard (1996)'s theory is not the right way to classify them. There is not that much evidence that this theory, developed for the interaction between superiors and their team members in the workplace, is applicable to education (though see Clark, 1981; Halima, 2006; Raza and Sikandar, 2018 for some preliminary evidence). In particular, AMN's description of the behaviors matching each guidance style does not seem to be based on data. A principal component analysis of our student questionnaire showed that statements pertaining to different guidance styles did not fall into factors that matched the four styles. To our knowledge, empirical evidence supporting the transition from a test to a guidance style is missing, both in education and more in general in the management literature. Further research is needed to differentiate between these three possible explanations.
The observation data showed that there are large differences between teachers in the styles they exhibited, but few or no adaptations of this style to the advised guidance style of the class. These results are consistent with an interpretation that teacher behavior is more a reflection of the teacher style than of the needs of the class. This is consistent with literature suggesting that teachers find differentiating very hard to do (van de Grift et al., 2011) and Slavin's (1990) finding that the degree to which teachers in ability-grouped schools actually differentiate instruction is questionable.
Slavin (1990) found little evidence that ability grouping is beneficial to student achievement and raised the argument that it is important to gain more insight in teacher behavior. Duflo et al. (2011) did find that students may benefit from tracking/ability grouping, and suggested this may be because grouping may allow teachers to better tailor their instruction and guidance to the students. Our data suggest that teachers indeed think they adapt their instruction to the learning needs of the class. However, these adaptations were not observed during observation. Our data show that teachers do not adapt their guidance style to the advised AMN guidance style or to the preferred guidance style of the students. If the effectiveness of ability grouping depends on applying the appropriate guidance styles, then our study suggests that teachers do not adapt their guidance styles to the learning needs of the class. This may thus hamper the effectiveness of ability grouping interventions and keeps the debate about the effectiveness of ability grouping alive. Our research thus does not support the idea that ability grouping works because teachers can tailor their guidance better. However, this conclusion is based on a small sample of only five teachers, all working within one program. Our results obviously need replication.
Taking our results at face value, however, why would teachers not adapt their guidance style to the class? Perhaps teachers did not know what types of behavior and communication should be applied in the specific classes. This is indeed shown in the results of the questionnaire; teachers were not very good at matching the advised behavior of a style to a class. Given the fact that teachers knew that classes were grouped according to advised guidance style, our results show either that teachers forgot about the style of the class or that experience with the class made them feel differently about a class than how the styles are described by AMN. However, although teachers were rather consistent in what words they used to describe the classes, they were not very consistent in the behaviors they ascribed to classes.
Some teachers in our sample showed that they were able to use all four guidance styles Hersey and Blanchard (1996) and AMN described others had one style they used in all the classes. It could be that the latter group would need training in using particular styles, while the first group would need training in how to apply styles in a tailored fashion. On the other hand, it could also be that teacher style is better seen as an expression of personality than a consciously adaptable style (Korthagen, 2004). This would suggest that schools, instead of trying to change the teacher, could concentrate on matching the class to the teachers with a matching style.
The literature suggests an explanation for the effectiveness of ability grouping caused by either peer effects or better adapted guidance styles (Duflo et al., 2011; Carrell et al., 2013). In this study, we did not investigate whether ability grouping works. We are currently running a large study in vocational education to do just that. If ability grouping works in vocational education, our current results show that teacher adaptation is not (yet) an explanation. This would leave peer effects as a potential explanation but this remains to be investigated in more detail.
Concluding, we here investigated whether an assessment of cognitive skills and personality traits could be used to identify a guidance style that would benefit students the most. We found that 65% of the students prefer a different style than advised, and also teachers were only able to identify characteristics of grouped students somewhat better than chance. This suggests that the assessment identifies guidance styles with an accuracy that is above chance, but barely so. Moreover, the advised style was not reflected in teachers' behavior. Teacher behavior seems to be more a reflection of the teacher style than of the needs of the class as diagnosed by the assessment.
Data Availability Statement
The datasets generated for this study are available on request to the corresponding author.
Ethics Statement
Ethical review and approval was not required for the study on human participants in accordance with the local legislation and institutional requirements. Written informed consent from the participants' legal guardian/next of kin was not required to participate in this study in accordance with the national legislation and the institutional requirements.
Author Contributions
IE, CK, and MM conceived of the presented idea and verified the analytical methods. IM developed the questionnaires and performed the observations (MM was also observer to determine inter-rater agreement). IE and MM developed the observational scheme together. CK and MM supervised the findings of this work. All authors discussed the results and contributed to the final manuscript.
Funding
This work was supported by The Netherlands Organization for Scientific Research (NWO) (Grant No: 023.008.023).
Conflict of Interest
IE works within the institution that was subject to the research.
The remaining authors declare that the research was conducted in the absence of any commercial or financial relationships that could be construed as a potential conflict of interest.
Supplementary Material
The Supplementary Material for this article can be found online at: https://www.frontiersin.org/articles/10.3389/feduc.2019.00155/full#supplementary-material
References
Bettinger, E. P., and Baker, R. B. (2014). The effects of student coaching: an evaluation of a randomized experiment in student advising. Educ. Eval. Policy Anal. 26, 3–19. doi: 10.3102/0162373713500523
Blanchard, K. H., Zigarmi, D., and Nelson, R. B. (1993). Situational leadership after 25 years: a retrospective. J. Leadersh. Organ. Stud. 1, 22–36. doi: 10.1177/107179199300100104
Booij, A. S., Leuven, E., and Oosterbeek, H. (2015). Ability Peer Effects in University: Evidence From a Randomized Experiment (No. 8769). Bonn: Institute for the Study of Labor (IZA).
Carrell, S. E., Sacerdote, B. I., and West, J. E. (2013). From natural variation to optimal policy? The importance of endogenous peer group formation. Econometrica 81, 855–882. doi: 10.3982/ECTA10168
Clark, N. A. (1981). Educational leadership: a field test of Hersey and Blanchard'S situational leadership theory (Doctoral dissertations), 1896–February 2014. University of Massachusetts Amherst, Amherst.
Cornelisz, I., and van Klaveren, C. (2018). Student engagement with computerized practising: ability, task value, and difficulty perceptions. J. Comput. Assist. Learn. 34, 828–842. doi: 10.1111/jcal.12292
Cote, R. (2017). A comparison of leadership theories in an organizational environment. Int. J. Bus. Admin. 8, 28–35. doi: 10.5430/ijba.v8n5p28
Duflo, B. E., Dupas, P., and Kremer, M. (2011). Peer effects, teacher incentives, and the impact of tracking: evidence from a randomized evaluation in Kenya. Am. Econ. Rev. 101, 1739–1774. doi: 10.1257/aer.101.5.1739
Dunlosky, J., Rawson, K. A., Marsh, E. J., Nathan, M. J., and Willingham, D. T. (2013). What works, what doesn't. Sci. Am. Mind 24, 46–53. doi: 10.1038/scientificamericanmind0913-46
Dutch Ministry of Education Culture and Science (2013). Kerncijfers 2009–2013. The Hague: Dutch Ministry of Education Culture and Science.
Eegdeman, I., Meeter, M., and Van Klaveren, C. (2018). Cognitive skills, personality traits and dropout in Dutch vocational education. Empir. Res. Vocat. Educ. Train. 10:18. doi: 10.1186/s40461-018-0072-9
Halima, E. G. (2006). “Situational teaching model,” in Preceding of 6th Global Conference on Business & Economics (Harvard, MA: Gutman Conference Center).
Hanushek, E. A., and Wößmann, L. (2006). Does early tracking affect educational inequality and performance? Differences-in-differences evidence across countries. Econ. J. 116, C63–C76. doi: 10.1111/j.1468-0297.2006.01076.x
Hersey, P., and Blanchard, K. (1996). Great ideas revisited: life-cycle theory of leadership. Train. Dev. J. 50, 42–48.
Ireson, J., Hallam, S., and Hurley, C. (2005). What are the effects of ability grouping on GCSE attainment? Br. Educ. Res. J. 31, 443–458. doi: 10.1080/01411920500148663
Korthagen, F. A. J. (2004). In search of the essence of a good teacher: towards a more holistic approach in teacher education. Teach. Teach. Educ. 20, 77–97. doi: 10.1016/j.tate.2003.10.002
Kulik, C. C., and Kulik, J. A. (1982). Effects of ability grouping on secondary school students: a meta-analysis of evaluation findings. Am. Educ. Res. J. 19, 415–428. doi: 10.3102/00028312019003415
Nevala, A.-M., and Hawley, J. (2011). Reducing Early School Leaving in the EU. Brussels: European Parliament.
Raza, S. A., and Sikandar, A. (2018). Impact of leadership style of teacher on the performance of students: an application of hersey and blanchard situational model. Bull. Educ. Res. 40, 73–94.
Slavin, R. E. (1990). Achievement effects of ability grouping in secondary schools: a best-evidence synthesis. Rev. Educ. Res. 60, 471–499. doi: 10.3102/00346543060003471
van de Grift, W. (2007). Quality of teaching in four European countries : a review of the literature and application of an assessment instrument. Educ. Res. 49, 127–152. doi: 10.1080/00131880701369651
van de Grift, W., van der Wal, M., and Torenbeek, M. (2011). Ontwikkeling in de pedagogisch didactische vaardigheid van leraren in het basisonderwijs. Pedagogische Studiën 88, 416–432.
Keywords: assessment of guidance styles, theory of leadership, tracking, ability grouping, vocational education
Citation: Eegdeman I, van Klaveren C and Meeter M (2020) Assessing Guidance Styles in Upper Secondary Vocational Education: Can Teachers Differentiate on the Basis of Assessed Style? Front. Educ. 4:155. doi: 10.3389/feduc.2019.00155
Received: 19 August 2019; Accepted: 16 December 2019;
Published: 11 February 2020.
Edited by:
Carmen Tomas, University of Nottingham, United KingdomReviewed by:
Diana Baas, Hogeschool de Kempel, NetherlandsPeter Nyström, University of Gothenburg, Sweden
Copyright © 2020 Eegdeman, van Klaveren and Meeter. This is an open-access article distributed under the terms of the Creative Commons Attribution License (CC BY). The use, distribution or reproduction in other forums is permitted, provided the original author(s) and the copyright owner(s) are credited and that the original publication in this journal is cited, in accordance with accepted academic practice. No use, distribution or reproduction is permitted which does not comply with these terms.
*Correspondence: Irene Eegdeman, aS5lZWdkZW1hbkB2dS5ubA==
 Irene Eegdeman
 Chris van Klaveren
 Martijn Meeter