- Graduate School of Education, University of Exeter, Exeter, United Kingdom
In this paper I aim to explore and present various statistics regarding special educational needs in England, to get an overview regarding schooling of pupils with Special Educational Needs (SEN) as it is at the time of writing, as well as historic patterns. I use publically available datasets to present answers to the following questions: What proportion of all children in schools in England have been identified as having special educational needs? How many children attend special schools? What proportion of children attend special schools? How have numbers of special schools changed? What is the balance of gender in i/ pupils identified with SEN, and ii/ in special schools? What are the proportions of children in different school types eligible for and receiving free school meals? The use of publically available national data is used to explore patterns, reporting these data give an overview of the number, profile and characteristics of the population in schools with SEN. They give indications on the progress of inclusion (or lack thereof), and highlight issues of disproportionality. Findings include the number of pupils identified with SEN in England decreases while the population of pupils in all schools rises. There is also a rise in the number of children attending special schools. Disproportionality with regards to gender; socio-economic status and age are also revealed.
Introduction
In this paper I aim to explore and present various statistics regarding special educational needs in England. These will include both trends (patterns over time) and snapshots (what the situation was in 2018). The purpose of this is to get an overview of schooling of pupils with Special Educational Needs (SEN) as it is at the time of writing, as well as historic patterns. The paper does not seek to explain the trends; rather it presents them, as a “where are we” picture of SEN in England. This is timely given that 2018 marked the passing of 40 years since the introduction of the term “special educational needs” into English education policy by the Warnock report (Department of Education and Science, 1978). It is important to have such an overview, in order to contextualize the English education system and view the implications of policy on practice with regards to SEN demonstrated through pupil numbers and studies of proportionality. Such an approach can demonstrate and highlight tensions between policy and practice, such as the policy stance for inclusive education but yet an increase of pupils attending special schools. In this paper I present data on the number of children with SEN overall, and in special schools, viewing these through demographic variables such as gender and age.
In England, the definition of if a person has special educational needs or not is enshrined in law. According to the (Children and Families Act, 2014):
1. A child or young person has special educational needs if he or she has a learning difficulty or disability which calls for special educational provision to be made for him or her.
2. A child of compulsory school age or a young person has a learning difficulty or disability if he or she—
(a) Has a significantly greater difficulty in learning than the majority of others of the same age, or
(b) Has a disability which prevents or hinders him or her from making use of facilities of a kind generally provided for others of the same age in mainstream schools.
There is a presumption in England toward inclusion of children with SEN in mainstream schools: “as part of its commitments under articles 7 and 24 of the United Nations Convention of the Rights of Persons with Disabilities, the UK Government is committed to inclusive education of disabled children and young people and the progressive removal of barriers to learning and participation in mainstream education” (Department for Education Department of Health, 2014, p. 25). The (Children and Families Act, 2014) sets out some exceptions to inclusion in mainstream schools—children with SEN should be educated in a mainstream school “unless that is incompatible with: the wishes of the child's parent or the young person; or the provision of efficient education for others.” By reporting the data on the placement of pupils with SEN in articles such as this one we can examine if the presumption to inclusion is being enacted in practice or not.
A word about context—it is sometimes assumed that writing about education policy and practice in England is synonymous with writing about the same in the United Kingdom. This is not so. As Booth remarked in Booth (1996), the legal basis of education differs considerably between Scotland, Northern Ireland, Wales and England. Responsibility for education has been devolved to a national parliament in Scotland, and national assemblies in Wales and Northern Ireland. One of the clearest examples of divergence in policy related to SEN has been in Scotland. SEN law and policy was broadly similar to legislation in other UK countries, until implementation of the Education Act 2004 which abolished the term SEN, replacing it with a much broader definition—“Additional Support Needs.” This includes any child or young person who would benefit from extra help, that is, “additional support” in order to overcome barriers to their learning (Hodkinson and Vickerman, 2009). Under this law, any child who needs more or different support to what is normally provided in schools or pre-schools is said to have “additional support needs.” These can include (but are not limited to): “bullying; being particularly gifted; a sensory impairment or communication problem; a physical disability; being a young carer or parent; moving home frequently” (Enquire, 2017, p. 5).
Another contextual point is that the government department responsible for educational policy in England has undergone a number of name changes and rebranding, some of which reflect the differences in role and responsibility. In the time since the Warnock report it has been known as:
• Department of Education and Science (DES), 1964–1992
• Department for Education (DfE), 1992–1995
• Department for Education and Employment (DfEE), 1995–2001
• Department for Education and Skills (DfES), 2001–2007
• Department for Children, Schools and Families (DCSF), 2007–2010
• Department for Education (DfE), 2010- to date (National Archives, no date).
Since its introduction by Warnock in 1978, the term “SEN” has been qualified as a characteristic that differs by degree, the one in five likely to require “special educational provision,” and the 2% requiring special educational provision beyond that normally available in the ordinary school (Warnock and Norwich, 2010). As Black et al. (2019) explain “from 2001 to 2014, there were three levels of SEN: School Action; School Action Plus (both of which were identified by school staff); and Statement, which involved a legally based record of provision identified by a multi-professional team that took into account parental views” (p. 3). In 2014, approximately 20% of pupils were identified as having SEN at one of these three levels. In the new SEN Code of Practice (Department for Education Department of Health, 2014), these three levels were reduced to two—SEN Support and Education, Health and Care Plans (EHC Plans). Schools now identify pupils with less severe difficulties as having SEN at the SEN Support level, while local authorities identify pupils with more severe difficulties with the EHC Plans, replacing Statements. These policy changes may have an effect on the number of pupils with SEN in schools, and thus an exploration of pupil numbers and trends is an important one.
To meet the aim of giving an overview of SEN in England and plotting trends over time in this article I present answers to the following questions:
- What proportion of all children in schools in England have been identified as having special educational needs?
- How many children attend special schools? What proportion of children attend special schools?
- How have numbers of special schools changed?
- What is the balance of gender in i/ pupils identified with SEN, and ii/ in special schools?
- What are the proportions of children in different school types eligible for and receiving free school meals?
A number of researchers have written similar articles since the publication of the Warnock report. One such article followed the publication of the Education Act that the Warnock report preceded. This was work by Will Swann, who asked in 1985 “Is the integration of children with special needs happening?” He found that between 1978 and 1982, “the total school population aged 5–15 fell from 8.17 million to 7.44 million, a drop of 8.9%. In the same period the total special school population aged 5–15 fell from 119,411 to 114,019, a drop of 4.5%. Thus, the total school population declined faster than the special school population, leading to an increase in the proportion of pupils in special schools from 1.46% to 1.53%” (Swann, 1985, p. 5,6).
Following Swann's exploration, there commenced a series of analysis published by the Center for Studies in Inclusive Education (CSIE), a national charity, founded in 1982 that works “to promote equality and eliminate discrimination in education” (Centre for Studies on Inclusive Education, 2018). Researchers (Norwich, 2002; Rustemier and Vaughan, 2005; Black and Norwich, 2014) were commissioned by CSIE to explore school placement trends (that is, the proportion of children placed in special schools or other separate settings). The most recent trends analysis report on data from 2013 to 2017 is at the time of writing, to be launched in June 2019.
My own journey in academia has also involved exploration of trends in government statistics relating to SEN. Both my Masters dissertation, then my doctoral thesis (Black, 2012) explored the over-representation of secondary school aged pupils in special schools, with a view that these patterns were demonstrations of disproportionality and as indications that inclusion in mainstream secondary schools was not being achieved.
Within special schools in England certain groups are over-represented. The (Department for Education Skills, 2004) noted that the population of special schools was boy-heavy, there was a larger than average number of pupils eligible for free school meals (a proxy for socio-economic status) in these schools, and that two-thirds of the pupils in special schools were of secondary age. Writing in 2008 Dyson & Gallannaugh stated there had been no comprehensive national study of ALL forms of disproportionality. These authors began to address this, collating work that has been carried out in England on disproportionality in the special needs education system (not necessarily within special schools). They discussed ethnicity, poverty, month of birth, gender and age. Work by Strand and Lindsay (2009), and Strand and Lindorff (2018), while focusing on disproportionally according to ethnicity, do explore other variables, such as age, gender and socio-economic status.
There is a wealth of research into the disproportionality of ethnic minority students in the special schools system, at both a national and international level, with considerable effort put in to try to understand and address this problem (Coutinho and Oswald, 2000; Artiles, 2003), including identifying predictor variables for the patterns (Oswald et al., 2002). Lindsay et al. (2006) carried out a national study of ethnic disproportionality within special education provision in the UK, finding this was a cause for concern. Strand and Lindsay (2009) used pupil level data to calculate the odds ratios of having identified SEN across a number of variables, including ethnicity, age, gender, and socioeconomic status. They found that “poverty and gender had stronger associations than ethnicity with the overall prevalence of SEN” (p. 174), but also that after adjusting for the influence the other variables, significant disproportionality of some minority ethnic groups remained.
Other authors have used the affordances of England's National Pupil Database (NPD) to explore pupil level trends, and relationships with other variables of interest (for example: Farrell et al., 2007, explore the relationship of inclusion with attainment; Strand and Lindorff, 2018, examine ethnic disproportionality in SEN in England, across categories of need, controlling for age, gender, and socio-economic status; Liu et al., 2019, look at the effect of changing levels of school autonomy on reclassification of children with SEN, and on them leaving school). The NPD contains administrative pupil-level data about all children of school age in England, comprised of cross-sectional files, each containing over 7 million records on individual children (with anonymized identification numbers) enrolled in English schools. Data in the NPD is classified into different tiers, depending on its sensitivity and rules on access vary in relation to different tiers of data. Users apply to access the data, a Data Sharing Approval Panel meet to approve or reject the application. If approved, users can to construct longitudinal pupil-level files for each school cohort and carry out pupil level analysis (Department for Education, 2019).
Publically available national data (aggregates of school and pupil level data) also helps to explore patterns, reporting these data provides an overview of the number, profile and characteristics of the population in schools. They give indications on the progress of inclusion (or lack thereof), and highlight issues of disproportionality. As described below the Department for Education (DfE) collects and collates data on pupils on a range of variables and measures from schools and local authorities. It also has historic data from its predecessors. Some of these data are analyzed and findings shared through documents entitled “Statistical First Release” (see for example Department for Education, 2018c). However, much of the data are held in files entitled “National Tables”—Excel spreadsheets—with no analysis or qualitative description. This article collates, analyses and describes patterns in the data of interest.
Methods
In this article I use publically accessible government data, published in 2018, to show trends and snapshots of factors related to SEN. These are publically accessible data made available on-line by the UK government. I use two sources:
(i) Schools, pupils and their characteristics 2018—National Tables (Department for Education, 2018d)
(ii) Special educational needs in England: January 2018—National Tables (Department for Education, 2018b)
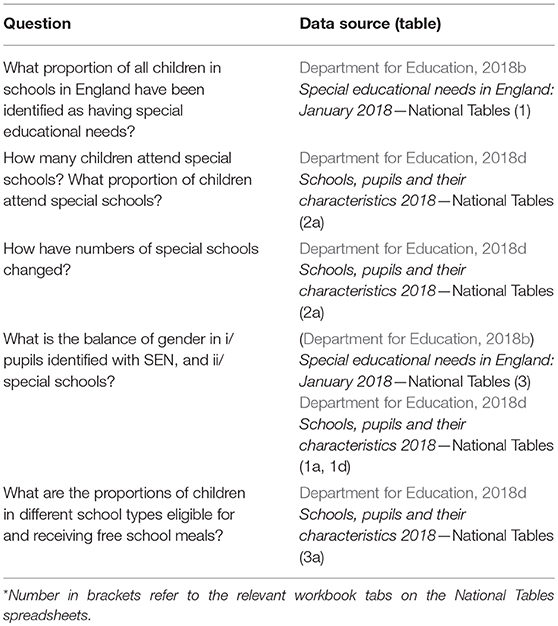
These two sources consist of Excel spreadsheets with a range of tabs leading to different collections of data aggregates. For the relationship between source, tabs and research question see Table 1.
The Department for Education (DfE) has legal powers to collect pupil, child and workforce data that schools and local authorities hold. This data is used by the DfE to: assess school performance; publish Statistical First Releases; evaluate and inform educational policy; and assess funding to local authorities and schools (Department for Education, 2018a). Schools, pupils and their characteristics is one such Statistical First Release, published annually and containing information on the number of schools and pupils in schools in England, using data from the January 2018 School Census. Breakdowns are given for school types (of which special schools are of particular interest) as well as for pupil characteristics including free school meal eligibility, English as an additional language and ethnicity. The 2018 data sets in some instances include data from previous years, hence why time series can be plotted.
Graphs and descriptive summaries have been produced to create a descriptive picture of what the SEN landscape in England is like in the year 2018. I have chosen not to use an odds index like Dyson and Gallannaugh (2008), nor prevalence rates as used by Swann (1985), but rather present the raw data to answer the research questions. The project is based on the secondary analysis of publically accessible data. BERA (2018) state that “When working with secondary or documentary data, the sensitivity of the data, who created it, the intended audience of its creators, its original purpose and its intended uses in the research are all important considerations” (p. 11). The collectors and publishers of the data—the DfE, recognize that researchers may use the data (Department for Education, 2018a), but that it is aggregate data, with no personal identifiers. In some places I reproduce figures used by the DfE in their reporting of the statistics. Where these are reproduced they are cited appropriately.
Results
In this section I set out the answers to the research questions, illustrated with figures where appropriate.
Number and Proportion of all Children in Schools in England Identified as Having SEN
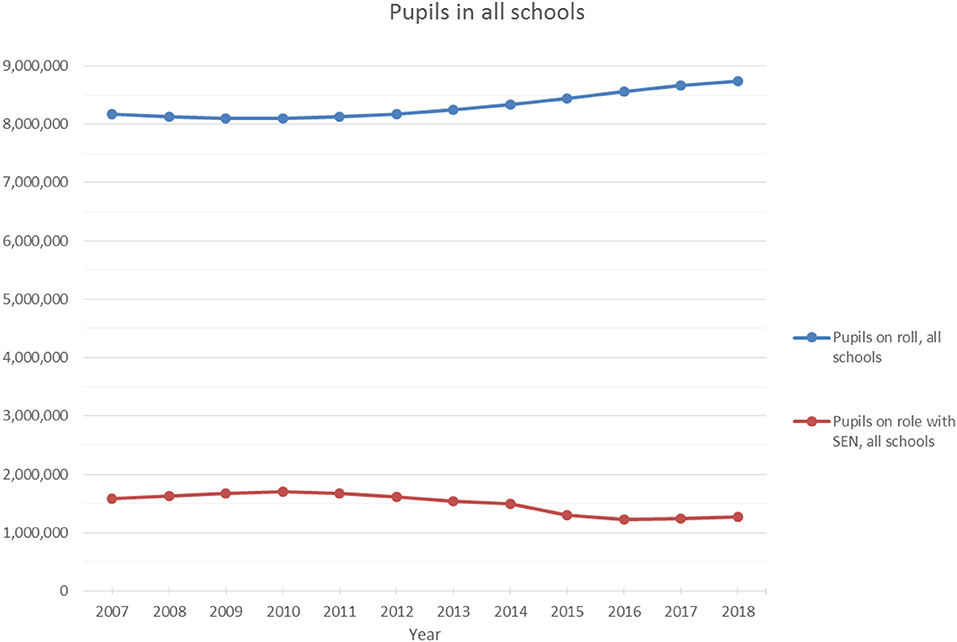
In 2018, over 1.25 million children in all schools in England were identified as having SEN (1,276,215). The total number of children in all schools was just under 8.75 million (8,735,100). This equates to 14.6% of all pupils being identified as having SEN. In 2007 this figure was 19.3%, rising to a high of 21.1% in 2010, then falling to a low of 14.4% in 2016 (see Figure 1). It is interesting to note that this decrease occurs while the population of pupils in all schools rises, from 8,098,360 in 2010 to 8,559,540 in 2016 (it might be expected that numbers of children with SEN might increase as the overall number of pupils attending schools does).
Just over one in five pupils−1,704,980 school-age children in England—were identified as having special educational needs in 2010, the peak of Figure 2 (a DfE produced graph, 2018c). In 2018 it is closer to 1 in 7 children (1,276,215). The proportion of children identified as having SEN has fallen, since 2010, with a drop off around the time of the launch of the new Code of Practice (Department for Education Department of Health, 2014). Here, a distinction should be made between the different levels of SEN: SEN Support and EHC plans, as discussed in the introduction. Figure 2 shows that those with the highest level of SEN (statements prior to 2015; EHC Plans from 2015) has remained fairly stable (2.8% in 2007–2017, increasing to 2.9% in 2018) whereas the number of children with SEN at a lower level of severity (School Action and School Action Plus prior to 2015; SEN Support from 2015) has reduced dramatically. The percentage of pupils with identified SEN but no Statement or EHC plan was 11.7% in January 2018. This follows a decline in each of the previous 6 years from 18.3% of pupils in January 2010.
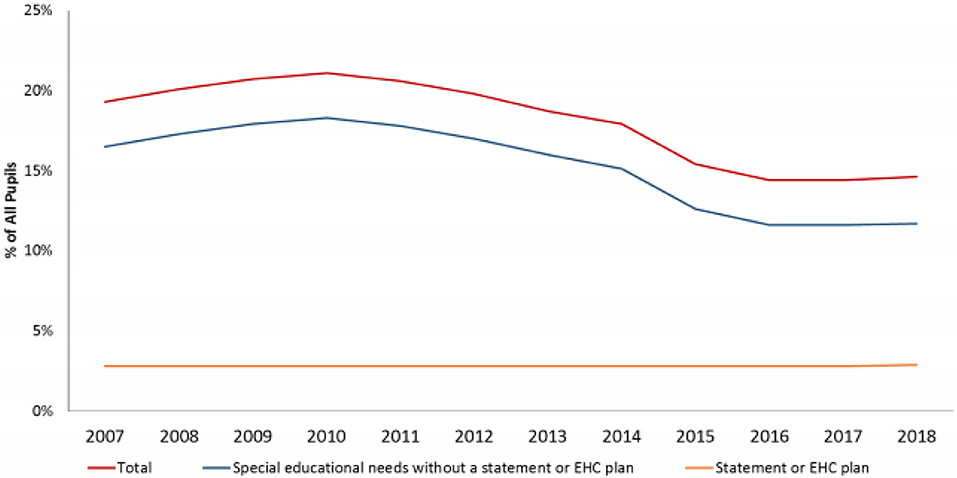
Figure 2. Time series showing the percentage of pupils with special educational needs. Source: Department for Education (2018c).
Numbers and Proportion of Children in Special Schools
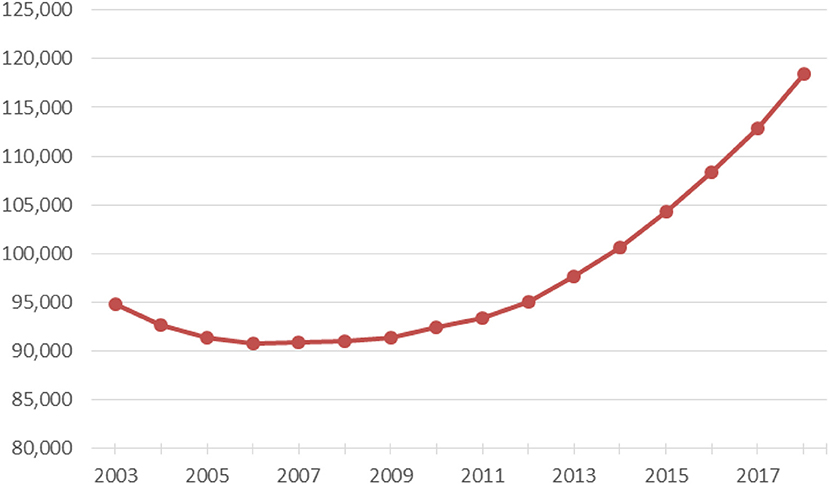
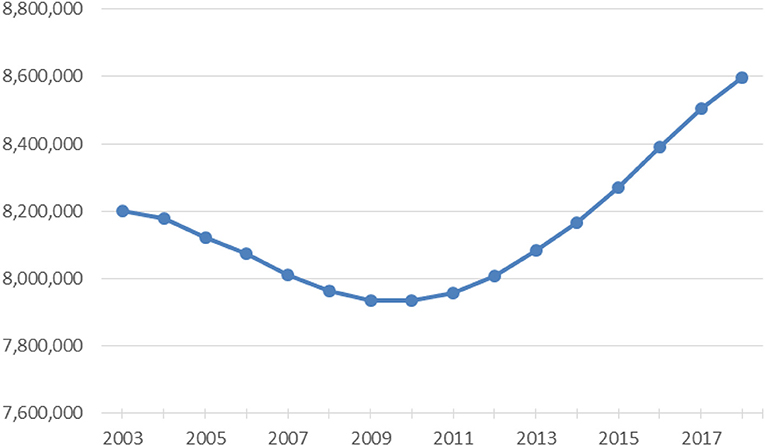
The number of children in special schools (Figure 3) can be compared with the number of pupils in all schools over time (Figure 4). In 2018 the number of children in special schools was just under 120,000 (118,390). Over time, the number of children in special schools dropped from 94,755 in 2003 to a low of 90,760 in 2006, but has been rising since then, passing 100,000 between 2013 and 2014. The number of children in all schools fell from around 8.2 million in 2003 to a low of 7.9 million in 2008 (Figure 4). In the years 2006 to 2008 pupil numbers in special schools rose despite the number of pupils in all schools falling.
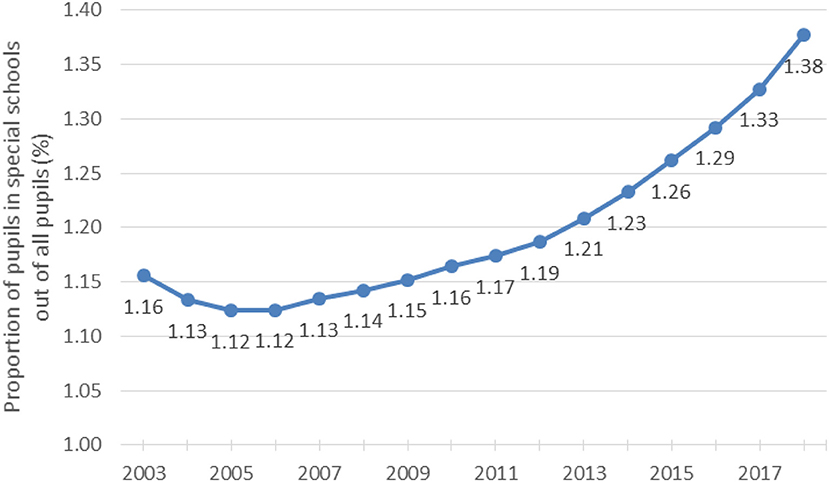
Moving from actual numbers, to proportions of children in special schools out of pupils in all schools (thus accounting for such changes in population), the proportion of children in special schools has been rising from 1.12% of all students in 2005, to a high of 1.38% in 2018 (Figure 5). This is against a backdrop of a reduction in number of special schools. In 2003 there were 1,160 special schools. This dropped to a low of 1,032 special schools in 2013, a figure which has risen slightly to 1,043 in 2018. There has been a drop of 10 percentage points in numbers of special schools in the period from 2003 to 2018.
Gender Balance
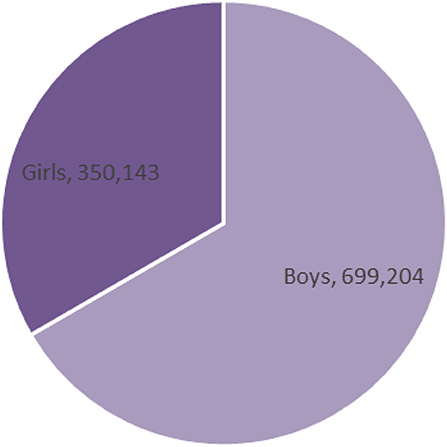
In this section I report the balance of gender in i/ pupils identified with SEN in all schools, and ii/ special schools. The DfE acknowledge “Special educational needs remain more prevalent in boys than girls” (Department for Education, 2018c, p. 7). Figure 6 shows that in 2018 a third of pupils with SEN aged 5–15 were girls, the majority (two thirds) were boys.
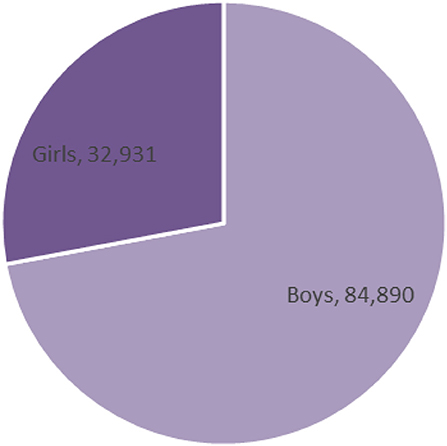
The gender imbalance is greater when special school populations are examined (Figure 7)—in 2018, of the 117,821 of full and part-time pupils attending state-funded and non-maintained special schools 84,890 (72%) were boys.
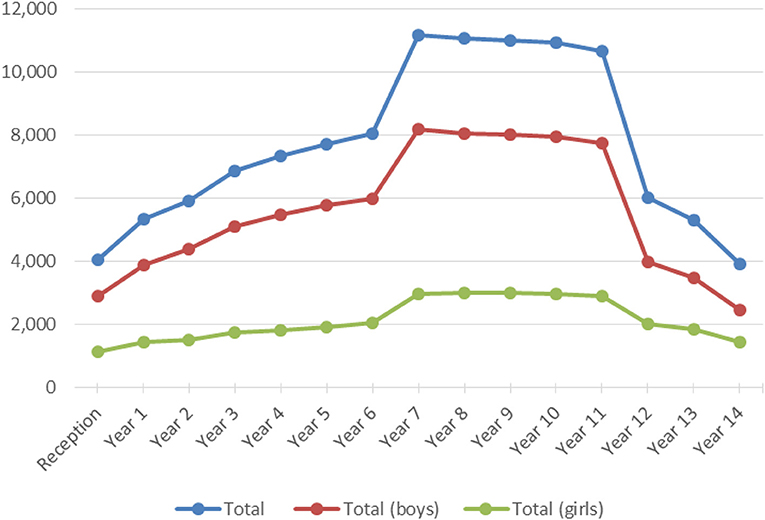
When the 115,326 of full and part-time pupils attending state-funded and non-maintained special schools in school year groups Reception to Year 14 are plotted (Figure 8), several interesting patterns emerge:
(i) A rise in pupil numbers from reception until year 7, with a large jump in numbers between those in year 6 and year 7 (this corresponds with the year of transfer from primary to secondary school in England).
(ii) There is a slight drop off of pupils from year 7 to year 11, from 3015 to 2912 for girls (a difference of just 13), and from 8031 to 7735 for boys (a difference of 296).
(iii) There is a larger drop off between Year 11 and year 12 (again, corresponding with another time of transition in England, from secondary education to 16+ education. In England pupils have to stay in education until age 18, but this is not limited to staying at school. After the age of 16, students can choose different education paths such as to go to college or to start a workplace apprenticeship).
(iv) The variation between years differs by gender. For boys it varies from a low of 2,931 in Reception to a peak of 8,191 in year 7, for girls the low is 1,157 in Reception, to 3,015 in year 8.
Proportions of Children Eligible for and Receiving Free School Meals
The Department for Education (2018c) state “Pupils with special educational needs remain more likely to be eligible for free school meals−25.8% compared to 11.5% of pupils without special educational needs” (p. 9). In 2018, 13.6% of the school population were known to be eligible for and claiming free school meals. In primary schools the proportion was 13.7%, in secondary schools, 12.4%. However, in special schools, 35.7% of the pupils in school were known to be eligible for and claiming frees school meals.
Discussion and Conclusion
The descriptive data presented above to answer the research questions illuminate some over-arching issues relating to policy and practice with regards to SEN in England, 40 years after the Warnock report. In the introduction I made reference to the Warnock reports nominal 20% of children who have SEN. The Warnock report states: “we estimate that up to one child in five is likely to require special educational provision at some point during their career” (Department of Education and Science, 1978, p. 40). This estimate formed the basis of a number of publications, notably Croll and Moses (1987) One in Five: The Assessment and Incidence of Special Educational Needs. It also was seen to be a figure that matched actuality. However, the results above show that there has been a gradual reduction, and in 2018 it was closer to one in seven children. Solity (1991) deemed the original suggestion of one in five to be a myth (an account of the world that has grown up without necessarily being supported by evidence), based on outmoded evidence (the use of IQ tests) and a lack of validity (is it a measure that reflects the proportion of children that teachers experience difficulties with; rather than a measure of children who may have difficulties). Equally, it is hard not to see the reduction in number of children identified as having SEN as result of the English school inspectorate's assertion that “the term ‘special educational needs' is used too widely” (OfSTED, 2010 p. 9), and the effect of the subsequent move from three levels of need (School Action; School Action Plus; and statements, Department for Education Skills, 2001) to two (SEN Support and EHC Plan, Department for Education Department of Health, 2014). McCoy, Banks and Shevlin writing in McCoy et al. (2016) outline how a three-step approach combining information from teachers and parents on a range of physical, learning and emotional / behavioral difficulties led to the calculation of a prevalence rate of SEN of 25% (in Ireland), and refer to other cohort studies with similar rates (the Netherlands, 26%, based on parent and teacher reports of SEN). This is closer to one in four children.
It is interesting to note that despite the number of special schools in England falling, the number of children attending those special schools is rising. This could be due an increase in the severity of needs (although the number of children with the highest level of needs as indicated by an EHC Plan has remained fairly uniform). It might be as a result of special schools being keen to keep to full capacity, to justify their existence, similar in some ways to how “Grammar Schools [in Norther Ireland] continue to fill to capacity with a wider ability range of pupils the impact of the population reduction falls on the non-selective controlled school” (North Eastern Education and Library Board, 2013). Additionally, it should be recognized that the numbers of children recorded as being in special schools do not give a complete account of the actual distribution of pupils who are included or excluded (Swann, 1985; Black and Norwich, 2014). “Special schools are only part of special provision. A large number of children are educated in a variety of special classes, units and groups which are integrated into ordinary schools” (Swann, 1985, p. 9).
The Warnock report (Department of Education and Science, 1978) gives no account of potential gender differences affecting SEN. The only mentions of gender are related to historic provision in the chapter about the historical background. In 2007 the DfES published a report exploring the impact of gender on a variety of aspects of education (such as attainment and subject choice). One of the areas explored was SEN, they reported that “boys are more likely than girls to be identified with special educational needs and more likely to attend special schools” (p. 89) 70% of pupils attending special schools were boys (thus the 72% reported in this article indicates a small increase in the proportion of those attending special schools being boys, and subsequently a decrease in girls). In contrast there has been some increase in the proportion of those identified as having SEN being girls– in 2006 it was 30% (Department for Education Skills, 2007) whereas in 2018 it was 33%. So while a slightly larger proportion of those identified as having SEN in 2018 compared to 2006 where girls, a slightly smaller proportion of those placed in special schools are girls. After carrying out a literature review exploring factors influencing the identification of SEN, Dockrell et al. (2003) concluded that a number of mechanisms may be at work related to gender bias in SEN. An interesting conclusion they reach is that girls are in fact disadvantaged as they may have SEN which have not been identified, and are thus under-represented.
Mention of socio-economic status is limited in the Warnock report (Department of Education and Science, 1978). The authors declare “care was taken to ensure that, so far as possible, different types of socioeconomic background were represented in the sample” (p. 388) when reporting on a survey they undertook as part of the studies of the committee. There is an acknowledgment that education in a residential special school may be needed where “poor social conditions […] either contribute to or exacerbate the child's educational difficulty” (p. 126). The fact that SEN are more prevalent among pupils with low socio-economic status than among their less disadvantaged peers was discussed by Shaw et al. (2016). They note that the relationship is a complex one, spanning from poverty and SEN being conflated by some practitioners; to the links between other factors related to poverty (such as low-birth weight; parental stress) and the likelihood of a child developing learning difficulties.
Although this article may raise the visibility of data published by the DfE there are limitations and cautions that need to be made with regards to the results presented in this article. The statistics are based on aggregates of data, schools are responsible for collating data on a range of variables, and human and/or administrative errors are possible at a range of levels. The DfE makes changes to the types and range of data which are collected, meaning they are not necessarily comparable year on year (Florian et al., 2004).
The figures presented in this article on proportion of children who attend special schools are not directly comparable to previous iterations of the CSIE Trends analysis. Figures 3–5 in this article are based on population of children in school, whereas in Black and Norwich's 2014 Trends analysis, and in the project that is currently underway, the numerator data provided by the DfE is for pupils aged 0–19 who go to special schools, and thus the denominator is population data for all people aged 0–19 in England. Another point to remember is Figure 8 shows a snapshot of placement in special school over 1 year. There is a possibility that this pattern may reflect some other factor, such as a change in the general population of children, thus, one cohort needs to be followed longitudinally over a number of years to see if similar patterns emerge before drawing any conclusions about the influence of age on placement in special schools.
This article highlights the potential of national statistics to illustrate trends and historic states, but their explanatory value is limited. There is value of collecting, analyzing and describing these data as broad measures of inclusion (or segregation), and indicators of the effect of policy on practice, but with the acknowledgment they cannot tell us about the mechanisms that cause the patterns. More sophisticated statistical analysis at a Local Authority, school and pupil level can be done, using resources such as the National Pupil Database, as illustrated by Liu et al. (2019), but there is also a need to go beyond statistics—“meaningful answers to questions about inclusion […] can be found but they require more than number crunching” (Florian et al., 2004, p. 120). Mixed methods studies should be used to explore reasons for the various patterns indicated in this article. For example, Black (2019) uses questionnaires of key stakeholders to explore reasons for the over-representation of secondary aged children in special schools, finding a range of explanations including school-level factors (e.g., Large size of secondary schools); within-child factors (e.g., the child's “ability” in a range of areas); resources; stakeholder choice; parental preference and an outcome of processes.
Warnock's (Department of Education and Science, 1978) estimates of the one in five likely to require “special educational provision,” and the 2% requiring special educational provision beyond that normally available in the ordinary school appear to be fluid, open to variance perhaps linked to policy imperatives rather than changes in children themselves. Some patterns appear to be less variable, this article shows similar patterns to those reported by the DfES in 2004—the population of special schools was still boy-heavy in 2018, there was still a larger than average number of pupils eligible for free school meals in these schools. This article is more than the repetition of data described by the DfE. While the DfE do hold the data they do not present it in a collection in response to specific research questions or in a way to describe patterns visually over time. This article provides such a descriptive overview.
Data Availability
Publicly available datasets were analyzed in this study. This data can be found here: https://www.gov.uk/government/statistics/schools-pupils-and-their-characteristicsjanuary-2018 and https://www.gov.uk/government/statistics/special-educational-needs-in-england-january-2018.
Author Contributions
The author confirms being the sole contributor of this work and has approved it for publication.
Conflict of Interest Statement
The author declares that the research was conducted in the absence of any commercial or financial relationships that could be construed as a potential conflict of interest.
References
Artiles, A. (2003). Special education's changing identity: paradoxes and dilemmas on views of culture and space. Harvard Educ. Rev. 73, 164–202. doi: 10.17763/haer.73.2.j78t573x377j7106
BERA (2018). Ethical Guidelines for Educational Research 4th ed. London: British Educational Research Association.
Black, A. (2012). Future secondary schools for diversity: where are we now, and where could we be? [Unpublished Ph.D. thesis]. Exeter, UK: University of Exeter.
Black, A. (2019). Future secondary schools for diversity: where are we now and where could we be? Rev. Educ. 7:36–87. doi: 10.1002/rev3.3124
Black, A., Bessudnov, A., Liu, Y., and Norwich, B. (2019). Academisation of schools in England and placements of pupils with special educational needs: an analysis of trends, 2011–2017. Front. Educ. 4:3. doi: 10.3389/feduc.2019.00003
Black, A., and Norwich, B. (2014). Contrasting Responses to Diversity: School Placement Trends 2007–13 for All Local Authorities in England. Bristol: Centre for Studies in Inclusive Education.
Booth, T. (1996). A perspective on inclusion from England. Cambridge J Educ. 26, 87–99. doi: 10.1080/0305764960260107
Centre for Studies on Inclusive Education (2018). About us - Centre for Studies on Inclusive Education. Available online at: http://www.csie.org.uk/about/
Children Families Act (2014). Available online at: https://www.legislation.gov.uk/ukpga/2014/6/contents
Coutinho, M., and Oswald, D. (2000). Disproportionate representation in special education: a synthesis and recommendations. J. Child Family Stud. 9, 135–156. doi: 10.1023/A:1009462820157
Croll, P., and Moses, D. (1987). One in Five: The Assessment and Incidence of Special Educational Needs. London: Routledge.
Department for Education (2018a) Data Protection: How We Share Pupil and Workforce Data. Available online at: https://www.gov.uk/guidance/data-protection-how-we-collect-and-share-research-data
Department for Education (2018b) National Statistics. Special educational needs in England: January 2018. Available online at: https://www.gov.uk/government/statistics/special-educational-needs-in-england-january-2018
Department for Education (2018c) Special Educational Needs in England: January 2018 Available online at: https://assets.publishing.service.gov.uk/government/uploads/system/uploads/attachment_data/file/729208/SEN_2018_Text.pdf
Department for Education (2018d) Statistics: School and Pupil Numbers- Schools, pupils and their characteristics. Available online at: https://www.gov.uk/government/collections/statistics-school-and-pupil-numbers.
Department for Education (2019) How to access Department for Education (DfE) data extracts. Available online at: https://www.gov.uk/guidance/how-to-access-department-for-education-dfe-data-extracts
Department for Education and Department of Health (2014). Special Educational Needs and Disability Code Of Practice: 0 to 25 Years: Statutory Guidance for Organisations Who Work with and Support Children and Young People with Special Educational Needs and Disabilities. London: Department for Education.
Department for Education and Skills (2001). Special Educational Needs Code of Practice. London: Department for Education and Skills.
Department for Education and Skills (2004). Removing Barriers to Achievement: The Government's Strategy for SEN. Annesley: Department for Education and Skills.
Department for Education and Skills (2007). Gender and Education: The Evidence on Pupils in England. London: Department for Education and Skills.
Department of Education and Science (1978). Special Educational Needs: the Warnock report. London: HMSO.
Dockrell, J., Peacey, N., and Lunt, I. (2003). Literature Review: Meeting the Needs of Children with Special Educational Needs, London: Audit Commission.
Dyson, A., and Gallannaugh, F. (2008). Disproportionality in special needs education in England. J. Special Educ. 42, 36–46. doi: 10.1177/0022466907313607
Farrell, P., Dyson, A., Polat, F., Hutcheson, G., and Gallannaugh, F. (2007). Inclusion and achievement in mainstream schools. Eur. J. Spec. Needs Educ. 22, 131–145. doi: 10.1080/08856250701267808
Florian, L., Rouse, M., Black-Hawkins, K., and Jull, S. (2004). What can national data sets tell us about inclusion and pupils' achievement? Br. J. Spec. Educ. 31, 115–120. doi: 10.1111/j.0952-3383.2004.00341.x
Hodkinson, A., and Vickerman, P. (2009). Key Issues in Special Educational Needs and Inclusion. London: Sage
Lindsay, G., Pather, S., and Strand, S. (2006). Special Educational Needs and Ethnicity: Issues of Over- and Under-Representations (Research report RR757). Nottingham: Department for Education and Skills.
Liu, Y., Bessudnov, A., Black, A., and Norwich, B. (2019). School Autonomy and Educational Inclusion of Children with Special Needs: Evidence from England. SocArXiv. doi: 10.31235/osf.io/y7z56
McCoy, S., Banks, J., and Shevlin, M. (2016). “Insights into the prevalence of special educational needs,” in Cherishing all the Children Equally? Ireland 100 Years on From the Rising Chapter 8, eds J. Williams, E. Nixon, E. Smyth and D. Watson (Cork: Oak Tree Press, 153–174
National Archives. (no date). Records Created or Inherited by the Department of Education and Science, and of Related Bodies Available online at: https://discovery.nationalarchives.gov.uk/details/r/C101.
North Eastern Education Library Board (2013) Post-Primary Area Plan. Available online at: https://raineyendowed.com/wp-content/uploads/2014/10/NEELB-Post-Primary-Area-P3-Revised-Aug-2014.pdf
OfSTED (2010). The Special Educational Needs and Disability Review: A Statement is Not Enough. London: OfSTED.
Oswald, D., Coutinho, M. J., and Best, A. M. (2002). “Community and school predictors of overrepresentation of minority children in special education,” in Racial Inequity in Special Education eds D. J. Losen and G. Orfield (Cambridge, MA: Harvard Civil Rights Project, 1–13.
Rustemier, S., and Vaughan, M. (2005). Segregation Trends - LEAs in England 2002-2004. Bristol: CSIE.
Shaw, B., Bernades, E., Trethewey, A., and Menzies, L. (2016). Special Educational Needs and their links to poverty. New York, NY: Joseph Rowntree Foundation.
Solity, J. E. (1991). Special Needs: A discriminatory concept?. Educ. Psychol. Prac. 7, 12–19. doi: 10.1080/0266736910070103
Strand, S., and Lindorff, A. (2018). Ethnic disproportionality in the identification of special educational needs (SEN) in England: Extent, causes and consequences. Available online at: http://www.education.ox.ac.uk/wp-content/uploads/2018/12/Combined-Report_2018-12-20.pdf
Strand, S., and Lindsay, G. (2009). Evidence of ethnic disproportionality in special education in an English population. J. Spec. Educ. 43, 174–190. doi: 10.1177/0022466908320461
Swann, W. (1985). Is the integration of children with special needs happening?: an analysis of recent statistics of pupils in special schools. Oxford Rev. Educ. 11, 3–18. doi: 10.1080/0305498850110101
Keywords: inclusion, disproportionality, special educational needs, special schools, national data
Citation: Black A (2019) A Picture of Special Educational Needs in England–An Overview. Front. Educ. 4:79. doi: 10.3389/feduc.2019.00079
Received: 15 February 2019; Accepted: 17 July 2019;
Published: 06 August 2019.
Edited by:
Geoff Anthony Lindsay, University of Warwick, United KingdomReviewed by:
Madeleine Sjöman, Jönköping University, SwedenLynne Sanford Koester, University of Montana, United States
Copyright © 2019 Black. This is an open-access article distributed under the terms of the Creative Commons Attribution License (CC BY). The use, distribution or reproduction in other forums is permitted, provided the original author(s) and the copyright owner(s) are credited and that the original publication in this journal is cited, in accordance with accepted academic practice. No use, distribution or reproduction is permitted which does not comply with these terms.
*Correspondence: Alison Black, YS5lLmJsYWNrQGV4ZXRlci5hYy51aw==
 Alison Black