 Jason C. Immekus
 Kate E. Snyder2†
- 1Department of Educational Leadership, Evaluation, and Organizational Development, University of Louisville, Louisville, KY, United States
- 2Department of Counseling and Human Development, University of Louisville, Louisville, KY, United States
- 3Department of Engineering Fundamentals, University of Louisville, Louisville, KY, United States
This study demonstrates the use of multidimensional item response theory (MIRT) to investigate an instrument's factor structure. For didactic purposes, MIRT was used to assess the factor structure of the 9-item Effort Beliefs Scale (Blackwell et al., 2007), based on data obtained from 1,127 undergraduate engineering students (20.9% female) across two academic years attending a large, metropolitan university in the east south-central region of the United States at the beginning and end of the first semester of freshman year. MIRT results supported the scale's multidimensional structure, which were compared to those based on confirmatory factor analysis. Specifically, comparisons of competing models supported the scale's bifactor structure in which the collective item set related to a primary dimension and each item related to one of two domain-specific factors: Positive Relationship, Inverse Relationship. Furthermore, the utility of item response theory for assessing effort beliefs changes across the first semester and the relationship of IRT and observed scores is provided. The paper concludes with an overview of MIRT for scale development and dimensionality assessment to advance the reader's awareness of its use as a psychometric tool.
Within educational psychology research, survey instruments play a prominent role in the operationalization of constructs (e.g., self-regulation, implicit beliefs) central to the advancement of theory, research, and practice. For example, researchers have refined our understanding of aspects of Expectancy-Value theory through validation efforts with cost-value (Flake et al., 2015), especially with a goal toward developing practice-relevant measures of achievement motivation (Kosovich et al., 2015). Attention to various versions of instruments is also important; implicit beliefs researchers have demonstrated that certain versions of implicit theories of intelligence measures are a better fit to the data with academically gifted students (Park et al., 2016). As such, the utility of obtained scores to yield meaningful information hinges directly on the quality of their psychometric properties, namely reliability and validity. Of central importance is test score validity, defined as “the degree to which evidence and theory support the interpretations of test scores for proposed uses of tests” (American Educational Research Association, American Psychological Association, and National Council on Measurement in Education, 2014, p. 11). Here, test is an inclusive term that covers a range of instruments, including surveys, designed to gather information on a target population.
Among sources of validity evidence (e.g., content validity), internal structure addresses the degree to which the relationship between items and latent dimensions align with theoretical expectations. There are various factor analytic models available to investigate an instrument's factor structure. For multidimensional instruments, confirmatory factor analysis (CFA) receives widespread use as a confirmatory, model-based approach to assess factor structure. Alternatively, item response theory (IRT) represents a broad class of statistical models applicable to item analysis, scale development, and scoring (Embretson and Reise, 2000; Yen and Fitzpatrick, 2008). Whereas, traditional IRT models have been restricted to unidimensional instruments (van der Linden and Hambleton, 1997), recent advancements in this area have resulted in the development of multidimensional IRT (MIRT; Reckase, 2009) models applicable to multidimensional instruments. The application of MIRT to assess factor structure in educational psychology research is, largely, an undeveloped area. In response, we seek in this study to demonstrate the utility of MIRT modeling to assess an instrument's factor structure, with results compared to CFA. Additionally, we show the utility of MIRT-based scores to assess changes in first year college students' effort beliefs and their relationship to observed scores.
A review of the educational psychology literature provides a basis to examine practices within the field to assess an instrument's factor structure. For this study, we conducted a systemic review of measurement-related studies in the following three journals from the past 5 years (2013–2017): Contemporary Educational Psychology, British Journal of Educational Psychology, and Frontiers in Psychology—Educational Psychology. We identified eligible studies using the following keywords: “confirmatory factor analysis,” “scale development,” “scale validation,” “construct validity,” “exploratory factor analysis,” “item response theory,” and “measurement invariance.” In total, 39 measurement-related studies met our eligibility criteria. The most commonly used methods to assess factor structure were CFA (90% of studies), followed by exploratory factor analysis (EFA; 59% of studies). In 53.85% (n = 21) of the studies, both EFA and CFA were used to assess factor structure. Comparatively, only 5% of the studies used IRT as a data analytic procedure. While an exhaustive literature search was beyond the study's scope, these findings nonetheless suggest the underutilization of IRT as a psychometric procedure. Notably, Unick and Stone (2010) found an underrepresentation of IRT in prominent social work journals. It can only be speculated why there is a noticeable absence of IRT in the published literature (e.g., graduate-level coursework, technical expertise). Nonetheless, taken together, these findings suggest that applied examples demonstrating the use of MIRT procedures may serve useful to advance the awareness and use of IRT as a methodological approach for examining an instrument's factor structure in educational psychology.
A more general inspection of educational psychology research shows the importance that researchers ascribe toward gathering empirical evidence on an instrument's internal structure to guide score-based decisions. As previously described, EFA and CFA procedures are the most visibly used procedures to gather factorial validity evidence in the three reviewed educational psychology journals. While speculative, their use in applied research is perhaps reinforced with available resources on their use (e.g., measurement invariance) and implementation in accessible statistical software packages (e.g., MPLUS, SPSS). Contrary, despite notable advancements in IRT over the past decade, it is a less visible psychometric procedure in published research. This is despite the availability of literature comparing IRT and CFA for examining the psychometric properties of obtained scores (e.g., Reise and Widaman, 1999); in particular, measurement invariance (e.g., Raju et al., 2002). When IRT is used, it may be to conduct an item analysis on a set of items that comprise a unidimensional subscale, based on an acceptable multidimensional CFA model (e.g., Pichardo et al., 2018).
As a latent variable modeling approach to dimensionality assessment, CFA seeks to explain the covariance among scale items based on a specified number of latent factors. The following factor analytic model expresses the linear relationship between a set of scale items (X) and latent variable (ξ) as:
where, X is a m x 1 vector of scale items, Λx is a m x n matrix of regression (or, pattern) coefficients representing the relationship between the observed, X, and latent, ξ, variable(s), and δ is the disturbance term, or error variance, associated with each item. With m items (e.g., m = 10) and n latent traits (e.g., n = 2) a set of matrices of the model parameters (i.e., factor loadings, factor variances-covariances, error variances) are used to produce an estimated covariance matrix (; see Bollen, 1989 and Kline, 2015). Thus, a well-fitting CFA model with the necessary constraints (e.g., identification) will produce an estimated covariance matrix that will closely approximate the actual, observed covariance matrix (S). Thus, the aim in CFA (and, structural equation modeling more broadly) is to produce a theoretically supported model that minimizes the difference between the observed (S) and estimated covariance matrices (i.e., explain covariance among variables). The extent to which this is achieved is judged using routinely used measures of model-data fit, including: likelihood ratio chi-square statistic, root mean square error of approximation, and comparative fit index, among others (e.g., Hu and Bentler, 1999; Kline, 2015).
On the other hand, IRT seeks to make statements about how respondents answer individual scale items, as opposed to reproducing the covariance among scale items. Thus, CFA and IRT are related in that they are both model-based approaches to characterizing the relationship between observed and latent variables. However, whereas CFA characterizes this relationship based on a linear model (see Equation 1 above), IRT models the probability of a particular item response (e.g., selecting a response of Agree instead of Disagree on a Likert-type scale) based on a nonlinear model.
As demonstrated in this paper, IRT provides a flexible model-based approach to examine the factor structure of instruments used in educational psychology research and offers an alternative approach to CFA for the dimensionality assessment of psychological instruments. To advance readers' understanding of IRT, and MIRT, specifically, both CFA and MIRT methods are used to test the dimensionality of the Efforts Belief Scale, an instrument designed to operationalize beliefs about the role that effort plays in academic success. The subsequent section provides an overview of the key tenets of IRT and details the unidimensional 2-parameter logistic (2-PL) IRT model for dichotomous data and Samejima's (1969, 1997, 2013) graded response model for ordered-categorical items (e.g., Likert scale). Additional aspects of IRT aligned with the use of MIRT models are examined, including: item parameter estimation, ability estimation, and goodness of fit. Subsequently, factor structure assessment using MIRT models is presented.
Item Response Theory
IRT embodies a broad class of statistical models that seek to express the probability that an individual will select a particular item response. Specifically, IRT posits that an individual's item response is based on specific item and individual characteristics. Item characteristics of typical interest include the item discrimination and threshold parameters. Item discrimination refers to the degree to which an item discriminates among individuals along the underlying trait continuum (e.g., motivation, self-regulation), such as between students with low or high levels of a given type of achievement motivation. The item threshold refers to the point on the underlying trait continuum in which an individual has a probability of 0.50 of selecting a particular response category. For a dichotomously scored item in which the response is either correct or incorrect, for example, the threshold is a measure of item difficulty indicating how easy, or difficult, the respondents found the item. On the other hand, psychological instruments are commonly comprised of ordered-categorical items (e.g., Likert scale) and, thus, the threshold is the point on the trait scale in which an individual would have a probability of 0.50 of selecting a particular response category. The person characteristic is their standing on the measured trait (e.g., self-regulation, motivation), commonly referred to as ability or theta (symbolized as θ; Crocker and Algina, 1986).
IRT possesses a number of attractive features for investigating the psychometric properties of psychological instruments (Hambleton and Swaminathan, 1985; Reise et al., 2013). First, the item parameter estimates are independent or invariant of the sample. That is, IRT item parameters are not dependent on the sample they were based, unlike the item discrimination and difficulty values obtained within the framework of classical test theory (CTT; Crocker and Algina, 1986). Thus, regardless of the study sample's distribution, a well-fitted IRT model will result in the same item parameter values (Embretson and Reise, 2000). The property of item parameter invariance is a key tenet of IRT and provides a basis to estimate an individual's probability of a correct response at any given ability or trait level. Correspondingly, an individual's estimate on the measured trait (e.g., motivation, implicit beliefs) is independent of the administered items. Thus, once a set of items have been estimated (or, calibrated), an individual's trait value can be estimated using any selected subset of items. Therefore, the same set of items do not need to be administered to estimate an individual's trait estimate. In this case, a sample of items can be selected from a bank of calibrated items and administered to individuals to determine their standing on the measured trait, which is the basis of computerized adaptive testing. Lastly, IRT yields a measure of the precision, or standard error, for each trait estimate. This is in contrast to the standard error of measurement within CTT which is the same for the entire score distribution (Crocker and Algina, 1986; Harvil, 1991). Collectively, these are three readily apparent advantages of IRT as an approach to item analysis and scoring. As with other statistical procedures (e.g., general linear model), such assumptions should be empirically tested to guide model selection decisions. Notably, these assumptions may not always be a factor to consider with all applications of IRT and, thus, researchers should be familiar with the data and available models.
While a comprehensive presentation of IRT and associated models is beyond the scope of this paper, we highlight two unidimensional IRT models as a precursor for MIRT models. For didactic purposes, we discuss the 2-parameter logistic (PL) model (Hambleton and Swaminathan, 1985) and the graded response model (GRM; Samejima, 1969, 1997, 2013). The 2-PL item response theory model is applicable to dichotomous data (0 = No, 1 = Yes), whereas the GRM is applicable to polytomously scored items (0 = Never, 1 = Sometimes, 2 = Always). Familiarity with unidimensional IRT models is a prerequisite for an appreciation of MIRT models.
The 2-PL model explicates the probability of an individual endorsing a response of 1 (Yes, True; or, in educational assessment, a correct) response as:
where, P(x = 1|θ) symbolizes the probability of selecting a response of 1 (e.g., Yes) given an individual's ability, or trait standing (e.g., motivation), ai is the discrimination parameter, θ represents the measured trait, bi is an item's threshold, and e is ~2.718. The subscript i indicates that each item has its own unique item discrimination and threshold parameters. The constant −1.7 is used to approximate the logistic model to the more computationally complex normal ogive model (Camilli, 1994). Thus, the 2-PL model is named as such because it describes an examinee's probability of a response of “1” based on two item parameters (i.e., item discrimination, difficulty).
Another notable feature of IRT is the ability to inspect an item's functioning graphically. Specifically, item characteristic curves (ICCs) model the probability of an item response for a given ability, or trait, level (Embretson and Reise, 2000; Yen and Fitzpatrick, 2008). As an example, Figure 1 displays the ICCs for two items using the 2-PL model with ability on the x-axis and the probability of answering “Yes” (i.e., response of 1) on the y-axis (Range: 0–1). The item discrimination parameters for Items 1 (solid line) and 2 (dashed line) are 1.25 and 0.63, whereas the difficulty values are 0.50 and −0.50, respectively. Notably, the item threshold parameter is reported on the same scale as ability, which typically ranges from −3 to +3. As shown, Item 1 has a steeper slope and, thus, more strongly discriminates among individuals along the trait continuum, particularly between the ability levels of 0 and 1.5. Contrary, Item 2 is less discriminating because the ICC is not as steep and, consequently, would be a less informative item for measuring the latent trait. Notably, both items have limited discriminatory power at the lower and upper end of the trait continuum, indicating that the items are most appropriate for measuring in the middle range of the trait continuum. Also, the threshold for Item 1 was 0.50, indicating that an individual had to have a higher standing on the measured trait to endorse a Yes response for Item 1 than Item 2. It should be evident that with enough items with difficult item discrimination and threshold values, one could develop a tailored instrument (i.e., computer adaptive test) that could be administered to a general, or heterogeneous, population or to specific populations (e.g., gifted) that may fall at the upper or lower ends of the trait continuum.
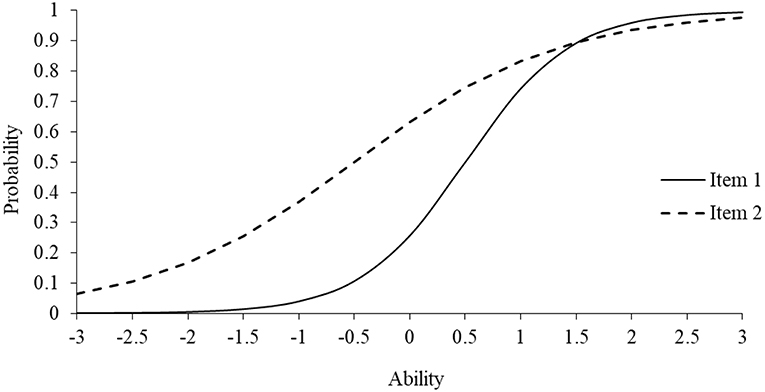
Figure 1. Item characteristic curve for 2-PL model.
There is also a wide class of IRT models for ordered categorical, or polytomously scored, items (van der Linden, 2016). Among others, these include: Samejima's (1969, 1997, 2013) GRM, Bock's (1972) nominal response model, and Masters's (1982) partial credit model. Thissen and Steinberg (1986) provide a taxonomy of the relationship among models appropriate for polytomous data. Collectively, these models are designed to predict an examinee's probability of selecting a particular response category (e.g., Strongly Disagree, Agree, Strongly Agree) for a given item. For example, a highly efficacious student would have a high probability of answering Very Like Me to the item, “I think that no matter who you are, you can significantly change your level of talent” (Gaumer Erickson et al., 2016).
Samejima's GRM is an applicable IRT model for polytomously scored items. Specifically, it estimates the probability that individual n reaches score category k (e.g., Agree, Strongly Agree) for item i:
where, Pkni*is the probability that person n will reach category k or higher on item i, ai is the item discrimination parameter for the item (and is the same across response categories), and bik is the threshold for reaching category k. For polytomous items, there are k−1 thresholds (one less than number of response categories) meaning that there are a total of 4 thresholds (5–1) for a 5-point Likert scale. The four thresholds would include the point on the scale in which an individual would select a rating of Disagree over Strongly Disagree, Neither Disagree nor Agree over Disagree, Agree over Neither Disagree nor Agree, and Strongly Agree over Agree. The probability of selecting the next highest response category over the lower category is:
Here, the right-hand equation is the probability of selecting the lower category (e.g., Disagree) and the left-hand equation is for the next highest category (e.g., Agree). As noted, the discrimination parameter ai indicates that the model assumes that each item category is equally discriminating. Figure 2 displays the ICC for a polytomous item with four threshold parameters. Specifically, it illustrates the probability of selecting one of five possible response categories based on a given trait level. For this item, the discrimination parameter is 2.5 and the four threshold parameters are −2.5, −1.75, −0.50, and 1.50, respectively. Inspection of the ICCs for each response category indicates that lower trait estimates correspond to higher probabilities of selecting lower response categories (e.g., 1, 2), whereas higher trait estimates correspond to choosing higher response categories (e.g., 3, 4). As specified in the model, the categorical trace lines have equal slopes and unique threshold parameters. The hypothetical trace lines in the figure could correspond to any type of polytomously scored item.
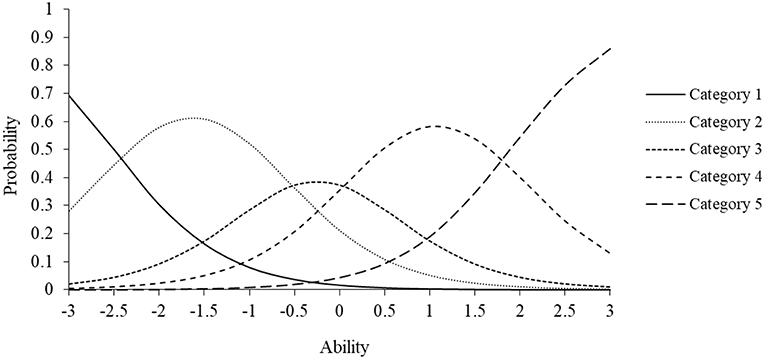
Figure 2. Item characteristic curve for polytomously scored item.
There are a number of approaches available to estimate IRT item parameters. Bock and Aitkin's (1981) full-information estimation approach uses maximum marginal likelihood with the expectation-maximization (MML-EM) based on individuals' full response patterns across an item set. MML-EM is an iterative procedure that uses initial item parameter values to estimate the number of individuals at a given ability, or trait, level that would be expected to provide a given item response (expectation) and then estimating the item parameters that would maximize the likelihood of obtaining the proportion of individuals with that response pattern. The procedure repeats itself until there is little change in the item parameters between successive iterations. However, due to the technicality of the MML-EM algorithm, it is limited to estimating the item parameters (e.g., item discrimination) for up to five factors, or latent dimensions (Bock et al., 1988). Among others, Markov chain Monte Carlo (MCMC) and adaptive quadrature (Rabe-Hesketh et al., 2002) represent emerging approaches to item parameter estimation. In large, the type of estimation approach that one uses to obtain item parameter estimates will largely depend on the statistical software package used for IRT analysis. For example, the IRT programs flexMIRT (Cai, 2017), IRTPRO (Cai et al., 2011), and TESTFACT (Wood et al., 2003) implement the MML-EM procedure, whereas MCMC is implemented in WINBUGS (Speigelhalter et al., 2000).
There are various approaches available to assign an individual an ability or trait estimate within IRT. These approaches fall into maximum likelihood (ML) or Bayesian procedures (Yen and Fitzpatrick, 2008). The first is maximum likelihood estimation (MLE), which is a ML method to ability estimation. MLE seeks to determine the estimated ability that maximizes the likelihood of an individual's response pattern across a set of items. Minimum and maximum MLE scores can range from −∞ to +∞ and so setting the score range is needed, typically −3 to +3. Bayesian approaches include maximum a posteriori (MAP) and expected a posteriori (EAP; Bock and Mislevy, 1982). These methods use a prior distribution of the ability distribution, based on known information of the group of individuals for which scores are being estimated. It is typically assumed that the scores come from a normal distribution, with a mean of 0 and standard deviation of 1. Bayesian methods generate a posterior distribution for each individual with the likelihood of the observed item response pattern estimated at each level of ability (θ). EAP scores are based on mean of the posterior distribution whereas MAP scores are based on the mode of this distribution, with the distribution of scores set to fall between −3 and +3. There are several noted features of Bayesian scores that make them more attractive than maximum likelihood estimation (e.g., lower standard errors, no extreme score). On the other hand, they are biased since individuals' scores are closer to the mean, or mode, of the prior distribution. All three scoring methods can be found used in research and practice, and rely on previously estimated item parameters. There are several accessible readings that provide an overview of IRT-based scores (e.g., Thissen and Wainer, 2001; Yen and Fitzpatrick, 2008).
As a model-based procedure, IRT generally requires large sample sizes to obtain stable parameter estimates. For example, sample sizes between 200 and 1,000 may be needed to obtain accurate parameter estimates for the class of dichotomous unidimensional IRT models (e.g., 1-PL, 2-PL) with test lengths between 20 and 30 items. For polytomously scored items, much larger sample sizes may be need. Yen and Fitzpatrick (2008) provide a summary of the recommended sample sizes and number of items needed to obtain stable parameter estimates for various IRT models.
Evaluation of goodness of fit of IRT models is an area that garnered increased attention in recent years. Perhaps the most familiar global measure of model-data fit for IRT models is the likelihood-ratio chi-square statistic. By multiplying −2 with the likelihood-ratio statistic (–2LL), it is distributed as chi-square and can used for statistical testing between competing IRT models. When comparing models, −2LL is the test statistic with degrees of freedom (dfs) equal to the difference between the number of parameters between the tested models. If the models do not differ statistically, the restrictive model (e.g., 2-PL) explains the data the same as the less restrictive model (e.g., 3-PL model). Here, the more restrictive model would be desired based on model parsimony. Contrary, a statistically significant –2LL would indicate that the least restrictive model provides better model-data fit. Additional global measures of model-data fit include the Akaike information criterion (AIC; Akaike, 1974), the Bayesian information criterion (BIC; Schwarz, 1978), as well as the root mean square error of approximation (RMSEA; Maydeu-Olivares, 2013). When comparing competing models of an instrument's factor structure, lower AIC and BIC values are used to identify the “best fitting” model. Within structural equation modeling (SEM), RMSEA values below 0.08 and 0.05 are used to identify models that provide adequate and close model-data fit (Browne and Cudeck, 1993). However, with the RMSEA, these criteria may not generalize directly to IRT, and thus offer a general framework to evaluating IRT model-data fit. Until recently, the absence of reliable measures of GOF have not been a factor of strong consideration in IRT (Maydeu-Olivares, 2013). Consequently, the development and evaluation of goodness of fit measures of IRT models is an area of ongoing research.
Multidimensional Item Response Theory
MIRT is an extension of the unidimensional IRT models that seeks to explain an item response according to an individual's standing across multiple latent dimensions (Reckase, 2009). Within applied research, a key limitation of unidimensional models is that they may not be appropriate to commonly used multidimensional instruments. Consequently, developments in MIRT and the increasingly availability of statistical software packages provide an opportunity for applied researchers to gain an appreciation and understanding of their use for examining the psychometric functioning of their scales. This is particularly relevant given the complexity of the constructs considered in educational psychology regarding how individuals approach their learning and, correspondingly, how it is influenced by personal and environmental factors. As with any statistical modeling approach (e.g., general linear model), MIRT serves to help develop an approximation of the factors that help explain how an individual responds to an item.
MIRT represents a broad class of probabilistic models designed to characterize an individual's likelihood of an item response based on item parameters and multiple latent traits. In particular, MIRT situates an individual's standing on the latent traits in a multidimensional space of the dimensions hypothesized to be associated with an item response: , where M is the number of unobserved latent dimensions required to model how an individual is likely to respond to an item. Broadly, there are two broad categories of MIRT models: compensatory and noncompensatory (Reckase, 2009). Compensatory models allow examinees' increased standing on one latent trait to overcome a low position on another dimension in the estimation of a probability of a correct item response; noncompensatory (or, partially compensatory) models restrict examinees' standings across the multidimensional space to not influence the probability of an item response. Within the literature, compensatory-based MIRT models are more commonly used.
For a dichotomous item, the probability of an item response of 1 (e.g., Yes) can be written as:
where, represents a vector of item discrimination (slope) parameters, indicating the probability of correct response associated with changes in an examinee's standing along the m-dimensions, and di corresponds to the item intercept, or scalar, parameter. Notably, the intercept di replaces the previous item threshold (b) parameter found in the unidimensional 2-PL model and is not interpreted as the threshold (or difficulty). Interested readers are referred to Reckase (2009) for detailed presentation of the parameters for the multidimensional 2-PL model (see pages 86–91). The exponent in Equation (4) can be expressed as:
in which ai1 is the slope, or discrimination, parameter for item i for examinee j's standing on the first latent dimension, θ1, and m is for the mth dimension, and di is the intercept. The mathematical form of the MIRT model results in its utility as a valuable psychometric tool for item parameter and ability estimation across the m dimensions.
The multidimensional GRM can be written as:
in which k is the response category selected by individual j for item i. As with unidimensional models, ability estimates can range from −∞ to +∞, but generally fall between −3 to +3. MIRT model parameters are estimates using same procedures for unidimensional models, and inspection of GOF based on the previously reported fit indices. Thus, the primary difference between unidimensional IRT and MIRT models is the number of dimensions included in the model to explain an item response.
There are many plausible models to describe an instrument's factor structure (e.g., Rindskopf and Rose, 1988). Figure 3 illustrates four plausible factor structures of a 9-item measure, including a unidimensional (or, single factor) model (Model A), correlated (two- or three-) factor model (Model B), higher-order model (Model C), and bifactor model (Model D). The unidimensional, or single factor, model is the simplest and most restrictive model because all items are posited to measure a unitary dimension. However, in most cases, the psychological constructs of theoretical interest are hypothesized as multidimensional. In effect, operationalization of multidimensional constructs thus requires scales developed with the idea that all items are associated with a primary latent dimension (e.g., effort beliefs) with item subsets grouped based on their measurement of a distinct subdomain (e.g., positive beliefs about effort). This type of theoretical structure would, consequently, propel the researcher to employ an unrestricted (e.g., EFA) or restrictive (e.g., CFA) factor analytic method to determine the distinctiveness of the subdomains for modeling and score reporting purposes. Distinct subdomains may lead to the consideration of subscale score reporting, whereas highly correlated factors lends to the use of a total score. The theoretical structure of psychologically relevant constructs and the construct validity of corresponding scores is an area of key importance in the advancement of theory, research, and practice.
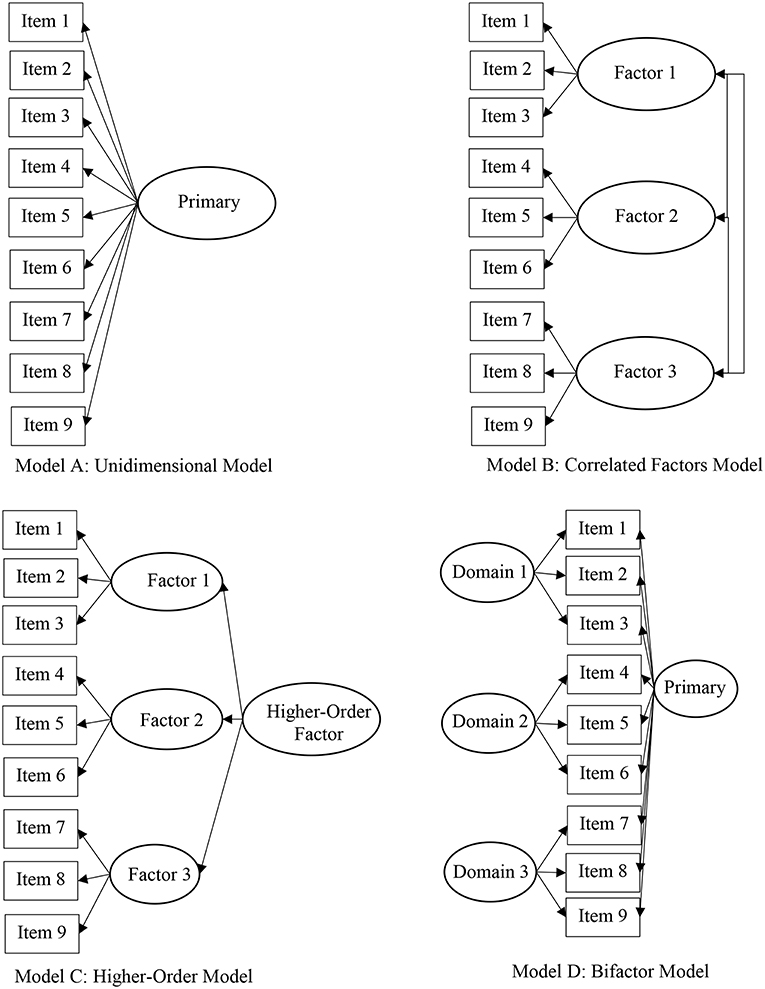
Figure 3. Alternative factor structures of 9-item measure.
Model selection is a key decision among researchers seeking to gather factorial validity evidence of a particular instrument. Substantive theory and available empirical evidence regarding the instrument's psychometric properties should guide decisions related to model selection. Further, competing factor structures should be tested to rule out alternative explanations of an instrument's factor structure, including, for example unidimensional, correlated factors, and bifactor models. Researchers should have an appreciation and understanding of the commonalities of the various statistical models. For example, a two- or three- correlated factors model (see Model B for correlated three factor model) is based on the premise that items measure distinct, yet related latent dimensions. If, for example, the factor correlations approach unity, a single-factor (unidimensional) model may provide more acceptable model-data fit, thus challenging the distinct nature of the latent dimensions. If, on the other hand, the interrelationship among the factors can be described by a hierarchical factor, then a higher-order model may be appropriate (see Model C). In recent years, within educational (Gibbons and Hedeker, 1992) and psychological (e.g., Gibbons et al., 2007) literature, the bifactor structure has garnered increased attention (see Model D; Reise, 2012). The bifactor structure posits that the interrelationship among all items are explained by a general, primary dimension with conceptually grouped item subsets also related to a particular subdomain. Gibbons et al. (2007) derived the full-information item bifactor model for graded response data. Key model assumptions include that all items relate to a primary dimension and one subdomain and that these dimensions are uncorrelated, or orthogonal. Cai (2010) derived the two-tier model which represents an expansion of the bifactor model and demonstrates its application to modeling complex and longitudinal data structures. Despite the apparent distinction among the models, the literature shows the similarity among the models. Rindskopf and Rose (1988) demonstrate the relationship among the unidimensional, correlated factors, and higher-order models, as well as the bifactor model. Within the IRT literature, Rijmen (2010) demonstrates how the second-order model is equivalent to the testlet model and that both are constrained bifactor models.
Study Purpose
The study demonstrates the use of MIRT to test an instrument's factor structure and compares results to those obtained with CFA. For study purposes, tested models included a unidimensional model, two-factor correlated model, and bifactor model. As research on MIRT continues to advance in concert with more readily available computer software, there is a need for accessible literature to promote its use as a psychometric tool in applied research. Data included the responses of two cohorts of first-year engineering students on the Efforts Belief Scale (Blackwell, 2002), designed to assess students' beliefs about the role of effort in their academic success, obtained at the onset and end of the first academic semester. The scale was developed by Blackwell (2002) within a motivational framework to examine factors associated with middle school transition. The instrument has also been used to test a motivational model of junior high school students' mathematics achievement (Blackwell et al., 2007). In this model, effort beliefs mediated the relationship between students' incremental theory and positive strategy use. Due to the absence of empirical evidence on the scale's internal structure, the instrument is a viable candidate for dimensionality assessment.
Method
Participants
Data were based on the item responses of 1,127 incoming undergraduate engineering students (20.9% female) from a large, metropolitan university in the east south-central region of the United States for the 2013 (n = 544; 48.3%) and 2014 (n = 582; 51.6%) academic years.
For each cohort, scale data was collected at the beginning (Week 1) and end (Week 13) of the first semester of the freshman year1. Participants Race/ethnicity included: 4.9% Asian, 3.5% African American, 2.8% Hispanic/Latino/a, 83.6% White, 3.9% Two or more races, and 1.30% Other. Informed consent was obtained by informing students that they were providing consent by completing the online surveys and that their participation was strictly voluntary.
Instrumentation
The Effort Beliefs Scale is a 9-item measure designed to assess students' beliefs about the role that effort plays in academic success (Blackwell, 2002; Blackwell et al., 2007). The scale was originally developed as a part of Lisa Blackwell's dissertation research (Blackwell, 2002) to understand the motivational factors associated with the middle school transition. Effort beliefs are proposed to be a part of the motivational framework (schema) that students use to guide interpretations of success and failure experiences (Blackwell et al., 2007).
The scale includes two subscales, including positive effort beliefs consisting of four items (Items 1, 2, 3, 4) and inverse relationship, consisting of five items. Responses are recorded on a 6-point scale (1 = Disagree Strongly; 2 = Disagree; 3 = Somewhat Disagree; 4 = Somewhat Agree; 5 = Agree; 6 = Agree Strongly). Positive items seek to measure the degree students believe that their efforts result in positive outcomes, such as: “If an assignment is hard, it means I'll probably learn a lot doing it.” Contrary, inverse relationship items seek to assess whether students believe that their effort has a negative relation to an outcome, such as: “To tell the truth, when I work hard at my schoolwork, it makes me feel like I'm not very smart.” For this study and consistent with Blackwell (2002) and Blackwell et al. (2007), inverse relationship items were reverse-scored to yield an overall measure of positive Effort Beliefs.
No formal instrument validation information was provided by Blackwell. However, Blackwell (2002) reported total score reliability of 0.79 in Sample 1 with seventh grade students (n = 373) and 0.60 in Sample 2 (low achieving seventh grade students, n = 99). Blackwell et al. (2007) also reported a 2-week test-retest reliability of 0.82 (n = 52) from Sample 1. Other researchers have reported similar total score reliability estimates; for example, a total score reliability estimate of 0.77 was reported from a sample of 163 ninth grade students in Algebra when the items were tailored to math (Jones et al., 2012).
Data Analysis
For didactic purposes, CFA and IRT procedures to assess an instrument's factor structure were used in this study. As a first step, descriptive statistics were used for data screening purposes. For comparative purposes, CFA was used to test a single factor (i.e., unidimensional) model, correlated two-factor model, and a bifactor model. Each model provides a basis to evaluate the extent to which the instrument's factor structure is unidimensional, comprised of distinct positive beliefs and inverse relationship dimensions, or complex with the items related to a primary dimension and domain-specific positive beliefs or inverse relationship factors.
Due to the ordinal nature of the data, robust weighted least squares (WLSMV; Muthén et al., unpublished manuscript) was used for parameter estimation using MPLUS 8.0 (Muthén and Muthén, 1998-2017). The following fit statistics were used to evaluate model-data fit: chi-square statistic, RMSEA, comparative fit index (CFI), and standardized root mean square residual (SRMR). Due to the absence of cutoff criteria for fit statistics with the WLSMV estimator, Hu and Bentler's (1999) empirically-based cutoffs for ML were used to inspect model-data fit: RMSEA values <0.05 were used to indicate good model fit and 0.08 suggested reasonable fit, with CFI values above 0.95 and SRMR values <0.08 deemed acceptable. Coefficient omega was used as a measure of internal consistency for the unidimensional and correlated factors model (Revelle and Zinbarg, 2009), whereas coefficient omega hierarchical was used to estimate internal consistency for the bifactor model (Rodriguez et al., 2016).
IRT analysis was based on fitting Samejima's GRM to the item-level data using MML for item parameter estimation. Similar to the CFA, tested models included the unidimensional (UIRT), correlated two-factor, and bifactor models. For the UIRT model, key model parameters included the item discrimination and threshold values. On the other hand, if one of the multidimensional models was identified as the preferred model, intercepts instead of thresholds are of focus (Reckase, 2009; Edwards et al., 2013). Model-data fit was examined using the –2LL statistic, AIC (Akaike, 1974), BIC (Schwarz, 1978), and RMSEA (<0.08). Between model comparisons were conducted by testing the statistical difference between the –2LLs between competing models, such as UIRT vs. bifactor. Specifically, the difference in –2LL between the two models is distributed as a chi-square and, thus, allows for statistical comparisons between models, based on dfs equal to difference in model parameters of the models. Thus, for the Effort Beliefs scale, the df difference (dfdifference) between UIRT and bifactor models is equal to number of scale items, or 9. This is because the bifactor model includes nine additional parameters to account for the relationship of each item to a secondary domain (e.g., inverse relationship). For the AIC and BIC statistics, model selection is based on identifying model with the lowest values. Notably, the RMSEA is not directly generalizable from SEM to IRT and, thus, provides additional information to evaluate model-data fit. IRT EAP scores were used to operationalize students' on the underlying latent dimension(s). All analyses were conducted using flexMIRT (Cai, 2017).
IRT was applied to students' Week 13 data to demonstrate its use to assess changes in college students' effort beliefs across the first academic semester (Week 1 to Week 13). For this analysis, item parameter values based on Week 1 data were used to score students' Week 13 data. Notably, this is one approach to modeling longitudinal data within IRT, which could also be achieved with a longitudinal IRT model (e.g., two-tiered model; Cai, 2010). This required using an item parameter file generated by flexMIRT to assign EAP scores. In effect, this puts students' Week 1 and Week 13 data on the same scale to assess changes in effort beliefs. Last, correlations among observed (raw) scores and IRT EAP scores were used to demonstrate their association and utility in applied contexts.
Results
Frequency distributions reported that the item response distributions were negatively skewed (Range: −0.32 [Item 7] to −1.53 [Item 1]). In particular, fewer than 1% of the respondents selected the lowest two response categories for Item 1, and fewer than 1% selected the first response option for Items 4–7. In response, for Item 1, the lowest two response categories were collapsed into category 3, and for Items 4–7 the lowest response category was collapsed into category 2. The consequence of collapsing categories was deemed negligible because fewer than 1% of respondents selected these lowest categories. In terms of statistical modeling, collapsing of categories was used to avoid issues pertaining to poorly estimated item parameters or fixing parameter estimates for model convergence. Implications of these steps related to scale revision are addressed in the Discussion section.
Table 1 reports the descriptive statistics for the scale items. Average responses fell between Agree Slightly to Agree across items. Inspection of Minimum and Maximum values indicated a range restriction for several items (e.g., Item 1). Item-total correlations ranged from 0.16 (Item 3) to 0.68 (Item 9) with a mean of 0.43 (SD = 0.13) for Week 1 data, and ranged from 0.17 (Item 3) to 0.49 (Item 2) with a mean of 0.40 (SD = 0.10) for Week 13 data. For Week 1 data, Cronbach's coefficient alpha for the total scale score was 0.73 (95% Confidence Intervals [CIs]: 0.70–0.75), and 0.58 (95% CIs: 0.53–0.62) for the positive effort subscale and 0.68 (95% CIs: 0.65–0.71) for the inverse relationship subscale. For Week 13 data, Cronbach's coefficient alpha for the total scale score was 0.71 (95% CIs: 0.69–0.74), and 0.61 (95% CIs: 0.57–0.65) and 0.68 (95% CIs: 0.65–0.71) for the positive and inverse relationships subscales, respectively (coefficient omega as measure of internal consistency reported in subsequent CFA analysis below). Results of the item analysis and Cronbach's coefficient alpha provided relevant information to guide the subsequent model-based approaches to the assessment of the scale's factor structure (e.g., relationship among item sets).
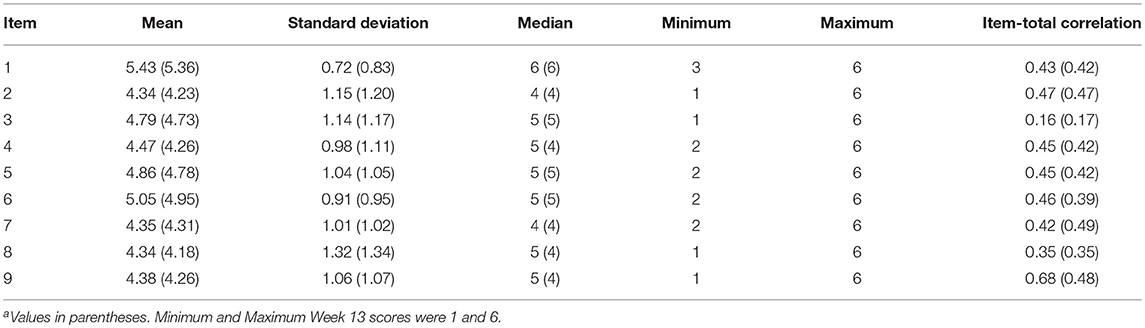
Table 1. Beginning and Enda of fall semester item descriptive statistics.
Table 2 reports the model-data fit statistics for the alternative CFA models. As reported, the unidimensional and correlated two-factor models did not report acceptable model-data fit, based on RMSEA and CFI values. Model-data fit for the bifactor model was acceptable across fit indexes (e.g., RMSEA), supporting the items multidimensional structure. Table 3 reports the item factor loadings and error variances. As shown, factor loadings on the primary dimension ranged from 0.14 (Item 3) to 0.76 (Item 9), indicating items were, in general, moderately to highly related to the primary, or effort, dimension. For the positive effort beliefs domain factor, items reported moderate factor loadings, ranging from 0.35 (Item 2) to 0.53 (Item 4). The magnitude and direction of the loadings indicated that, after accounting for the primary dimension, the positive effort beliefs domain factor accounted for the interrelationship among scale items. Contrary, item factor loadings for the inverse relationship domain factor were more varied and suggested that, controlling for the primary dimension, the items generally were more weakly associated with this domain factor, with the exception of Item 6. Error variance estimates indicated that, in general, over half of the item variances were unexplained, with the exception of Item 6.
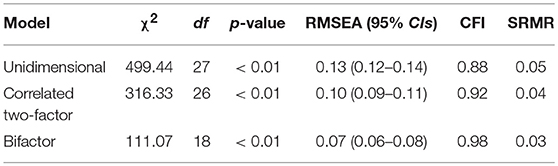
Table 2. Fit statistics of CFA models.
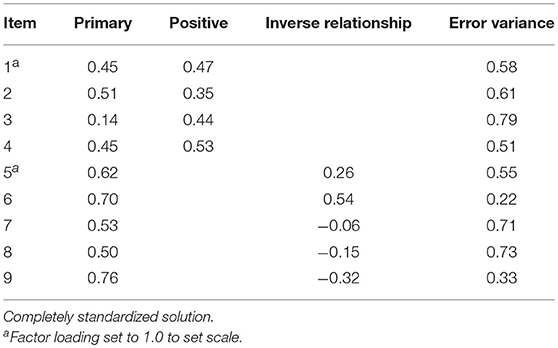
Table 3. CFA bifactor model parameters.
Table 4 reports the model-data fit across the IRT models. As provided, the global measures of model fit supported the bifactor model over the UIRT and correlated two-factor models. For example, AIC and BIC statistics were the lowest for the bifactor model. Furthermore, a comparison of the −2LL values between the bifactor and UIRT models was statistically significant with a −2LLDifference (dfDifference = 9) = 251.16, p < 0.01. As with the above CFA results, it can be concluded that the interrelationship among the items can be explained by a primary dimension (general beliefs about effort) and two domain-specific factors (positive effort beliefs and inverse effort beliefs).
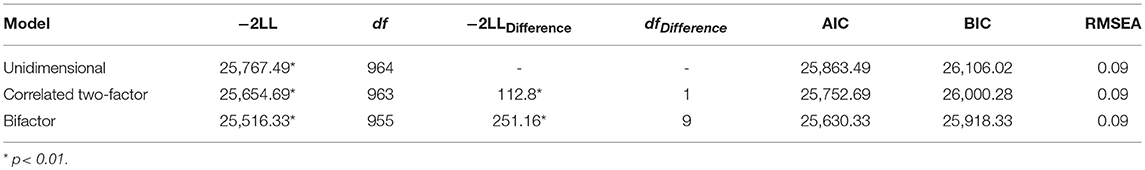
Table 4. Fit statistics of IRT models.
Table 5 reports factor loadings reporting the relationship between the items and latent dimensions. For comparative purposes, UIRT and bifactor model loadings are reported to demonstrate distortions that can occur when using a unidimensional model to characterize multidimensional data. As shown, UIRT estimates were slightly inflated when items reported non-negligible loadings on the bifactor secondary dimensions (e.g., Items 1–4). On the other hand, compared to the bifactor model, UIRT factor loadings were lower when items report non-negligible, negative loadings on the secondary dimension (e.g., Items 8 & 9). This comparison serves to highlight the cautions needed when interpreting model parameters without providing consideration to competing models that may help characterize a scale's factor structure. Nonetheless, given support for the scale's multidimensional factor structure, attention is turned to interpreting the bifactor model parameters. Notably, conversion of IRT slope estimates to factor loadings is approximately equal to those based on CFA (see Table 3). As previously reported, items generally reported moderate to strong loadings on the primary dimension. The exception was for Item 3, which was strongly related to the positive effort beliefs domain factor. Thus, for this item, after accounting for the primary dimension (general beliefs about effort), the item reported a non-negligible loading on the positive effort beliefs domain factor. In particular, for the positive effort beliefs domain factor, empirical results show that all items reported salient loadings (> 0.30) after accounting for variance explained by the primary dimension. Thus, these items demonstrate a multidimensional structure and suggest that they operationalize both primary and secondary dimensions. A different pattern of association was found between Items 5–9 and the inverse relationship domain factor. That is, after accounting for the primary dimension, items reported considerably varied loadings on the domain factor. Items 5 and 6 were the only two that reported a salient loading in the expected direction. On the other hand, Items 7 and 8 reported negligible loadings on the inverse relationship domain factor, whereas Item 9 had a weak negative loading. As a model-based approach to measure internal consistency, omega hierarchical (ωH) for the primary dimension was 0.62, whereas omegaHS values for the positive and inverse relationship domains were 0.09 and 0.00, respectively. Collectively, empirical findings suggest that the 9-item measure can be conceptualized as multidimensional with items demonstrating a complex factor structure (load on two latent dimensions). However, empirical results more directly point to subsequent research on the structure of students' effort beliefs due to the dominant primary (Effort) dimension. Consequently, for decision-making purposes, practitioners and researchers alike are encouraged to report a primary (effort) dimension score instead of subscale scores. Notably, these empirical findings complement the score reporting prior research (Blackwell et al., 2007).
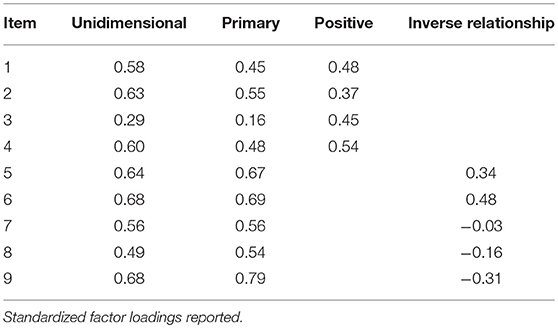
Table 5. Unidimensional and bifactor IRT model parameters.
Subsequently, Week 1 item parameters were used to assign IRT EAP scores to students' Week 13 data. Table 6 reports the descriptive statistics for IRT EAP and observed PEB scores for Week 1 and Week 13 data. As reported, IRT EAP scores report students' effort beliefs increased by 0.33 units, whereas remained relatively stable based on observed scores. Pearson Product Moment correlations among scores were high, with Week 1 IRT and observed scores highly correlated (0.91), as well as those based on end-of-semester data (0.92), respectively. For both IRT and observed scores, Week 1 and Week 13 scores reported high, positive correlations, with EAP scores being slightly higher compared to observed scores.
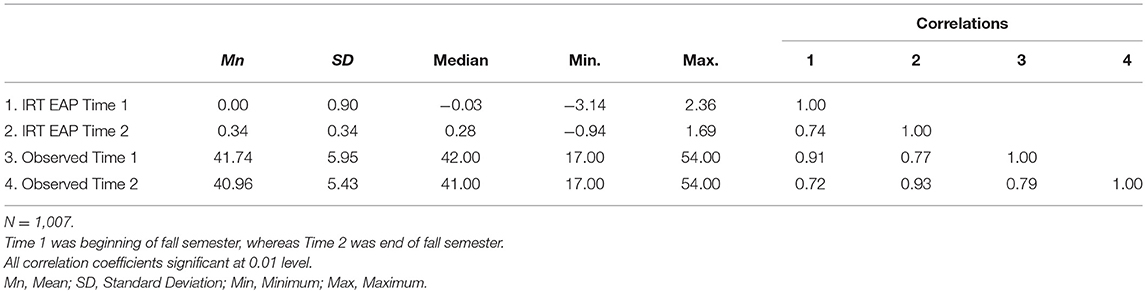
Table 6. Pearson product-moment correlations among IRT EAP and observed (Raw) scores.
Discussion
Within this study, MIRT was presented as a viable approach to assess the factor structure of instruments. Within the field of educational psychology, CFA procedures are predominantly used to gather empirical evidence on an instrument's internal structure. Despite the well-documented relationship between factor analysis and IRT (McDonald, 1999), factor analysis receives more frequent use in psychological research, whereas IRT is more prevalent in educational measurement contexts. Regardless of statistical modeling approach, model selection and evaluation should be guided by substantive theory and critical evaluation of alternative explanations of the data.
Toward this end, we used MIRT to empirically evaluate the factor structure of the Efforts Beliefs scale, based on data gathered within an engineering program seeking to identify motivational factors associated with undergraduate student success (e.g., retention). The scale was one of several instruments administered to assist with programmatic decision-making. Initial item analysis indicated that respondents did not use the lower response categories for several items, informing our decision to collapse categories for several of the items. Within latent variable modeling, collapsing of response categories for item-level data may be required to ensure stable item parameter estimation. In the absence of established criteria regarding the number of observations needed for each response option, ~10–15 observations per category may be desired. Indeed, this may depend on the number of response categories for a particular item and offers an area of research to offer practical suggestions to applied researchers. Subsequent scale refinement may consider reducing the number of response categories (e.g., 4 or 5) based on collection of additional data across diverse student populations. Furthermore, study data included first-year engineering students and, thus, we encourage further research based on other college samples.
A comparison of MIRT models supported conceptualizing the Effort Beliefs scale in terms of a bifactor model. Within this structure, items reported substantial loadings on the primary (Effort) dimension with varied loadings on the secondary positive and inverse relationship subdomains. That is, after accounting for the primary dimension, the subdomain factors captured additional item variance. In particular, the items corresponding to the positive subdomain reported higher loadings after accounting for the primary dimension, whereas only two items reported positive loadings (> 0.35) on the inverse relationship subdomain. The finding of substantial loadings on the primary dimension and varied loadings on the subdomain factors is consistent with previous factor analytic research of psychological data using the bifactor model (e.g., Chen et al., 2006; Immekus and Imbrie, 2008; Rodriguez et al., 2016). While results supported the scale's complex structure, loadings based on the unidimensional model only varied slightly from those reported for the bifactor primary dimension. It thus appears the scale is essentially unidimensional and that a unidimensional model may suffice with characterizing the scale's factor structure.
In recent years, the bifactor model has gained increased attention as a viable factor structure to investigate substantive issues regarding the measurement characteristics of instruments. As described above, a comparison of factor loadings on the bifactor primary dimension to those based on a unidimensional model provides a basis to judge the extent to which items demonstrate a complex structure or essentially unidimensional. Because the bifactor subdomains explain the interrelationship among scale items after accounting for the primary dimension, the model may assist with score reporting decisions (Chen et al., 2006; Reise et al., 2007). Specifically, subscale score reporting may be considered if model-data fit improves with the inclusion of a particular subdomain combined with substantial loadings. To-date, however, score reporting with the bifactor has largely focused on the primary dimension with the subdomains conceptualized as nuisance dimensions. Correspondingly, the use of bifactor subdomain scores to measure the narrowly defined sub-dimensions of a broader latent trait has been more speculative in nature. Consequently, there is little empirical evidence available to support the psychometric properties or construct validity (e.g., relationship to external variables) of bifactor subdomain scores. Rodriguez et al. (2016) recently provided a set of practically relevant statistical indices (e.g., internal consistency, factor determinacy) to guide decisions related to psychometric quality of bifactor scores. While such indices will serve useful to evaluating bifactor scores in applied research, the utility of bifactor scores is an area in need of more research. More generally, this includes the psychometric properties of scores based on different MIRT models. For the Efforts Beliefs scale, internal consistency estimates based on omega hierarchical were 0.62 for the primary dimension with subdomain values falling below 0.10, supporting the use of a total score. The use of a total score for decision-making purposes is aligned with previous recommendations (Blackwell et al., 2007).
Empirical findings provide a basis for subsequent research on the Efforts Beliefs scale. In particular, the scale was designed as a correlated two-factor model to yield a total score. In this study, based on first-year undergraduate engineering student data, the scale demonstrated a multidimensional structure with items predominantly related to a primary (general perceptions of effort) dimension with varied loadings on the secondary subdomains. After accounting for the primary dimension, all items specified to the secondary positive dimension reported substantial loadings, whereas only two items reported similar loadings on the inverse relationship subdomain factor. These results provide a basis for subsequent scale revision and development. For example, the positive items reported similar loadings across the primary and subdomain dimensions and, thus, continued research could be directed toward the ways in which positive beliefs may be differentiated from students' more general effort beliefs toward academic success. Conversely, three (out of five) of the inverse relationship items reported negative loadings to this subdomain. Specifically, Item 7 (“If you're not doing well at something, it's better to try something easier”) reported a near zero loading, whereas Item 8 (“To tell the truth, when I work hard at my schoolwork, it makes me feel like I'm not very smart”) reported a weak, negative loading. Both items reported a moderate, positive loading on the primary dimension and, thus, appear to operationalize the broad effort trait. Item 9 (“If an assignment is hard, it means I'll probably learn a lot doing it”) reported the strongest negative relationship with the inverse relationship subdomain, but the strongest, positive loading on the primary dimension. Collectively, these items do not appear to measure a distinct dimension of effort beliefs and, thus, could be candidate items for subsequent modification. A fruitful area of research is bringing together the areas of psychometrics and cognitive psychology to understand students' response processes when answering such items. This could be pursued within the context of a pilot study that seeks to gather both quantitative (e.g., item statistics) and qualitative (e.g., cognitive interviewing) data to understand how students approach and respond to psychological measures, such as what is recommended for cognitive pre-testing with instruments (Karabenick et al., 2007). There is much potential in the bridging together psychometric and cognitive psychology research.
A practical advantage of IRT is the ability to use previously estimated item parameters to assign ability (trait) scores to a subsequent sample. In this study, MIRT model parameters based on the instrument's initial administration at the beginning of the academic year were used to score the effort scale at the end of the first academic semester. Notably, research on longitudinal IRT models is an area of concentrated research and, thus, the method used in this study is a general approach to assessing latent mean score differences over time. Correlations between IRT and observed scores were very high (> 0.90) with beginning- to end-of-semester scores falling at the high range for both score types. Notably, IRT-based EAP scores suggested less variability of student effort beliefs at the end of the semester compared to the onset, with a slight increase in effort beliefs scores at the end of the semester. Contrary, observed scores remained relatively unchanged across the academic semester with slightly less variability. Notably, the EAP was the score of focus here, and other IRT-based approaches (e.g., MAP, ML) to scoring are available and implemented in statistical programs (e.g., flexMIRT).
Notwithstanding its flexibility to model multidimensional data, MIRT continues to evolve and is an area of active research (Reckase, 2009; Reise and Revicki, 2013). This includes, for example, the extent multidimensionality may impact unidimensional IRT model parameters and the utility of MIRT to produce substantively meaningful and psychometrically sound total and subscale scores. Efforts also continue to pursue the development and evaluation of statistical indices to evaluate the GOF of IRT models like those available for SEM (Maydeu-Olivares, 2013). Notably, in this study, the MPLUS and FlexMirt software packages were used and, as reported, provided similar and unique measures of model-data fit. For example, both software packages report the RMSEA as a measure of model-data fit, whereas FlexMirt report the AIC and BIC, whereas MPLUS does not provide these indices for categorical data (i.e., requires maximum likelihood estimation). Another consideration with MIRT models is the lack of readily available graphs that permit the inspection of item functioning across multiple latent dimensions. Whereas ICCs for unidimensional IRT models facilitate inspecting item function visually, inspection of MIRT models is typically reserved to inspecting key model parameters (i.e., discrimination). Within the present study, full-information MIRT was used for the assessment of factor structure and, thus, the extent to which other parametric and non-parametric IRT models may serve useful is an area of research as well. As reported, students' responses at Weeks 1 and 13 were negatively skewed and, thus, non-normal, which is not an uncommon finding with many scores on perception and motivation instruments. A consideration here and highlighted in the assessment of health outcomes literature (see Reise and Revicki, 2013) is the utility of IRT to model such data that confirm to diverse distributions found in the larger population. As such, there are many exciting directions with research in IRT and how they can be used to address key considerations in applied measurement settings.
Ongoing developments in IRT have opened the avenue for applied researchers to consider the applicability of MIRT models to examine the psychometric properties of instruments commonly used within the field of educational psychology. Use of traditional unidimensional IRT models have largely been restricted due to instruments designed with an intentional multidimensional structure. This is perhaps been exasperated by the lack of available computer software to conduct IRT analysis. However, combined with advancements in IRT and more readily accessible computer software provide an encouraging opportunity for MIRT to be considered by researchers to be a viable approach to examining the psychometric properties of their instruments. As demonstrated in the present study, MIRT provides comparable results to CFA and is similarly flexible for testing a range of competing models to more fully gauge an instrument's factor structure. By offering literature on the application of MIRT it is hoped that it will stimulate its increased use within the educational psychology literature.
Author Contributions
JI contributed to data analysis, writing, and editing of the manuscript. KS and PR contributed to data collection, writing, and editing of the manuscript.
Conflict of Interest Statement
The authors declare that the research was conducted in the absence of any commercial or financial relationships that could be construed as a potential conflict of interest.
Footnotes
1. ^The research questions and analyses in this manuscript are sufficiently distinct from two other publications which have drawn from the Effort Beliefs Scale from this dataset (Honken et al., 2014; Snyder et al., 2018).
References
Akaike, H. (1974). A new look at the statistical model identification. IEEE Transac. Autom. Control 19, 716–723. doi: 10.1109/TAC.1974.1100705
American Educational Research Association American Psychological Association, and National Council on Measurement in Education. (2014). Standards for Educational and Psychological Testing. Washington, DC: American Educational Research Association.
Blackwell, L. S. (2002). Psychological Mediators of Student Achievement during the Transition to Junior High School: The Role of Implicit Theories. Unpublished doctoral dissertation, Columbia University, New York.
Blackwell, L. S., Trzesniewski, K. H., and Dweck, C. S. (2007). Implicit theories of intelligence predict achievement across an adolescent transition: a longitudinal study and an intervention. Child Dev. 78, 246–263. doi: 10.1111/j.1467-8624.2007.00995.x
Bock, R. D. (1972). Estimating item parameters and latent ability when responses are scored in two or more nominal categories. Psychometrika 37, 29–51. doi: 10.1007/BF02291411
Bock, R. D., and Aitkin, M. (1981). Marginal maximum likelihood estimation of item parameters: an application of the EM algorithm. Psychometrika 46, 443–449.
Bock, R. D., Gibbons, R. D., and Muraki, E. (1988). Full-information item factor analysis. Appl. Psychol. Measure. 21, 261–280. doi: 10.1177/014662168801200305
Bock, R. D., and Mislevy, R. J. (1982). Adaptive EAP estimation of ability in a microcomputer environment. Appl. Psychol. Measure. 6, 431–444. doi: 10.1177/014662168200600405
Browne, M. W., and Cudeck, R. (1993). “Alternative ways of assessing model fit,” in Testing structural equation models, eds K. A. Bollen and J. S. Lond (Newbury Park, CA: Sage), 136–162.
Cai, L. (2010). A two-tiered full-information item factor analysis model with applications. Psychometrika 75, 581–612. doi: 10.1007/s11336-010-9178-0
Cai, L. (2017). flexMIRT® Version 3.5.1: Flexible Multilevel Multidimensional Item Analysis and Test Scores [Computer software]. Chapel Hill, NC: Vector Psychometric Group.
Cai, L., Du Toit, S. H. C., and Thissen, D. (2011). IRTPRO: Flexible, Multidimensional, Multiple Categorical IRT Modeling [Computer software]. Seattle, WA: Vector Psychometric Group, LLC.
Camilli, G. (1994). Origin of the Scaling Constant “d” = 1.7 in Item Response Theory. J. Educ. Behav. Stat. 19, 293–295. doi: 10.2307/1165298
Chen, F. F., West, S. G., and Sousa, K. H. (2006). A comparison of bifactor and second-order models of quality of life. Multivariate Behav. Res. 41, 189–225. doi: 10.1207/s15327906mbr4102_5
Crocker, L., and Algina, J. (1986). Introduction to Classical and Modern Test Theory. Orlando, FL: Harcourt.
Edwards, M., Wirth, R. J., Houts, C. R., and Bodine, A. J. (2013). “Three (or four) factors, four (or three) models,” in Handbook of Item Response Theory Modeling: Applications to Typical Performance Assessment, eds S. P. Reise and D. A. Revicki (New York, NY: Routledge), 159–182.
Embretson, S. E., and Reise, S. P. (2000). Item Response Theory for Psychologists. Mahwah, NJ: Erlbaum.
Flake, J. K., Barron, K. E., Hulleman, C., McCoach, B. D., and Welsh, M. E. (2015). Measuring cost: the forgotten component of expectancy-value theory. Contemp. Educ. Psychol. 41, 232–244. doi: 10.1016/j.cedpsych.2015.03.002
Gaumer Erickson, A. S., Soukup, J. H., Noonan, P. M., and McGurn, L. (2016). Self-Efficacy Questionnaire. Lawrence, KS: University of Kansas, Center for Research on Learning.
Gibbons, R. D., Bock, R. D., Hedeker, D., Weiss, D. J., Segawa, E., Bhaumik, D. K., et al. (2007). Full-information item bifactor analysis of graded response data. Appl. Psychol. Measure. 31, 4–19. doi: 10.1177/0146621606289485
Gibbons, R. D., and Hedeker, D. R. (1992). Full-information item bi-factor analysis. Psychometrika 57, 423–436. doi: 10.1007/BF02295430
Hambleton, R. K., and Swaminathan, H. (1985). Item Response Theory: Principles and Applications. Norwell, MA: Kluwer.
Harvil, L. M. (1991). Standard error of measurement. Educ. Measure. Issues Prac. 10, 181–189. doi: 10.1111/j.1745-3992.1991.tb00195.x
Honken, N. B., Snyder, K. E., and Ralston, P. A. (2014). “Exploring engineering students' beliefs on effort and intelligence,” in Proceedings of the 121st American Society for Engineering Education Annual Conference and Exhibition, (Indianapolis, IN) June 15–18, AC 2014–8649.
Hu, L., and Bentler, P. M. (1999). Cutoff criteria for fit indexes in covariance structure analysis: conventional criteria versus new alternatives. Struct. Equ. Model. 6, 1–55. doi: 10.1080/10705519909540118
Immekus, J. C., and Imbrie, P. K. (2008). Dimensionality assessment using the full-information item bifactor analysis for graded response data: an illustration with the State Metacognitive Inventory. Educ. Psychol. Measure. 68, 695–709. doi: 10.1177/0013164407313366
Jones, B. D., Wilkins, J. L., Long, M. H., and Wang, F. (2012). Testing a motivational model of achievement: how students' mathematical beliefs and interests are related to their achievement. Eur. J. Psychol. Educ. 27, 1–20. doi: 10.1007/s10212-011-0062-9
Karabenick, S. A., Woolley, M. E., Friedel, J. M., Ammon, B. V., Blazevski, J., Bonney, C. R., et al. (2007). Cognitive processing of self-report items in educational research: do they think what we mean? Educ. Psychol. 42, 139–151. doi: 10.1080/00461520701416231
Kline, R. (2015). Principles and Practice of Structural Equation Modeling (4th ed.). New York, NY: Guilford Press.
Kosovich, J. J., Hulleman, C. S., Barron, K. E., and Getty, S. (2015). A practical measure of student motivation: establishing validity evidence for the expectancy-value-cost scale in middle school. J. Early Adolesc. 35, 790–816. doi: 10.1177/0272431614556890
Masters, G. N. (1982). A Rasch model for partial credit scoring. Psychometrika 47, 149–174. doi: 10.1007/BF02296272
Maydeu-Olivares, A. (2013). Goodness-of-fit assessment of item response theory models. Measurement 11, 71–101. doi: 10.1080/15366367.2013.831680
Muthén, L. K., and Muthén, B. O. (1998-2017). MPLUS User's Guide, 8th Edition. Los Angeles, CA: Muthén Muthén.
Park, S., Callahan, C. M., and Ryoo, J. H. (2016). Assessing gifted students' beliefs about intelligence with a psychometrically defensible scale. J. Educ. Gifted 39, 288–314. doi: 10.1177/0162353216671835
Pichardo, M. C., Cano, F., Garzón-Umerenkova, A., de la Fuente, Peralta-Sánchez, F. J., and Amate-Romera, J. (2018). Self-Regulation Questionnaire (SRQ) in Spanish adolescents: factor structure and Rasch analysis. Front. Psychol. 9:1370. doi: 10.3389/fpsyg.2018.01370
Rabe-Hesketh, S., Skrondal, A., and Pickles, A. (2002). Reliable estimation of generalized linear mixed models using adaptive quadrature. Stat. J. 2, 1–21. doi: 10.1177/1536867X0200200101
Raju, N. S., Laffittee, L. J., and Byrne, B. M. (2002). Measurement equivalence: a comparison of methods based on confirmatory factor analysis and item response theory. J. Appl. Psychol. 87, 517–529. doi: 10.1037//0021-9010.87.3.517
Reise, S. P. (2012). The rediscovery of the bifactor measurement models. Multivar. Behav. Res. 47, 667–696. doi: 10.1080/00273171.2012.715555
Reise, S. P., Moore, T. M., and Haviland, M. G. (2013). “Applying unidimensional item response theory models to psychological data,” in APA Handbook of Testing and Assessment in Psychology, Vol. 1. Test Theory and Testing and Assessment in Industrial and Organizational Psychologhy, ed K. F. Geirsinger (Washington, DC: American Psychological Association),101–119.
Reise, S. P., Morizot, J., and Hays, R. D. (2007). The role of the bifactor model in resolving dimensionality issues in health outcomes measure. Qual. Life Res. 16, 19–31. doi: 10.1007/s11136-007-9183-7
S. P. Reise and D. A. Revicki (eds.). (2013). Handbook of Item Response Theory Modeling: Applications to Typical Performance Assessment. New York, NY: Routledge.
Reise, S. P., and Widaman, K. F. (1999). Assessing the fit of measurement models at the individual level: a comparison of item response theory and covariance structure approaches. Psychol. Methods 4, 3–21. doi: 10.1037/1082-989X.4.1.3
Revelle, W., and Zinbarg, R. E. (2009). Coefficients alpha, beta, omega, and the glb: comments on Sijtsma. Psychometrika 74, 145–154. doi: 10.1007/s11336-008-9102-z
Rijmen, F. (2010). Formal relations and an empirical comparison among the bi-factor, the testlet, and a second-order multidimensional IRT model. J. Educ. Measure. 47, 361–372. doi: 10.1111/j.1745-3984.2010.00118.x
Rindskopf, D., and Rose, T. (1988). Some theory and applications of confirmatory second-order factor analysis. Multivar. Behav. Res. 23, 51–67. doi: 10.1207/s15327906mbr2301_3
Rodriguez, A., Reise, S. P., and Haviland, M. G. (2016). Evaluating bifactor models: calculating and interpreting statistical indices. Psychol. Methods 21, 137–150. doi: 10.1037/met0000045
Samejima, F. (1969). Estimation of latent ability using a response pattern of graded scores. Psychometr. Monogr. Suppl. 17, 1–68. doi: 10.1007/BF03372160
Samejima, F. (1997). “Graded response model,” in Handbook of Modern Item Response Theory, eds W. J. Van der Linden and R. K. Hambleton (New York, NY: Springer), 85–100.
Samejima, F. (2013). “Graded response models,” in Handbook of Item Response Theory, Vol. 1, ed W. J. van der Linden (Boca Raton, FL: Taylor and Francis), 95–108.
Schwarz, G. E. (1978). Estimating the dimension of a model. Ann. Stat. 6, 461–464. doi: 10.1214/aos/1176344136
Snyder, K. E., Barr, S. M., Honken, N. B., Pittard, C. M., and Ralston, P. A. (2018). Navigating the first semester: an exploration of short-term changes in motivational beliefs among engineering undergraduates. J. Eng. Educ. 107, 11–29. doi: 10.1002/jee.20187
Speigelhalter, D., Thomas, A., and Best, N. (2000). WINGUBS Version 1.3 [Computer software]. Cambridge, UK: MRC Biostatics Unit, Institute of Public Health.
Thissen, D., and Steinberg, L. (1986). A taxonomy of item response models. Psychometrika 51, 567–577. doi: 10.1007/BF02295596
Unick, G. J., and Stone, S. (2010). State of modern measurement approaches in social work research literature. Social Work Res. 34, 94–101. doi: 10.1093/swr/34.2.94
van der Linden, W. J. (2016). Handbook of Item Response Theory Volume 1: Models. Boca Raton, FL: Taylor and Francis Group.
van der Linden, W. J., and Hambleton, R. K. (1997). Handbook of Modern Test Theory. New York, NY: Springer.
Wood, R., Wilson, D. T., Gibbons, R., Scilling, S., Muraki, E., and Bock, R. D. (2003). TESTFACT 4: Classical Item and Item Factor Analysis [Computer software]. Chicago, IL: Scientific Software.
Keywords: multidimensional item response theory, confirmatory factor analysis, dimensionality assessment, score reporting, test score validity
Citation: Immekus JC, Snyder KE and Ralston PA (2019) Multidimensional Item Response Theory for Factor Structure Assessment in Educational Psychology Research. Front. Educ. 4:45. doi: 10.3389/feduc.2019.00045
Received: 07 December 2018; Accepted: 09 May 2019;
Published: 28 May 2019.
Edited by:
Gavin T. L. Brown, The University of Auckland, New ZealandReviewed by:
Vanessa Scherman, University of South Africa, South AfricaJason Fan, The University of Melbourne, Australia
Copyright © 2019 Immekus, Snyder and Ralston. This is an open-access article distributed under the terms of the Creative Commons Attribution License (CC BY). The use, distribution or reproduction in other forums is permitted, provided the original author(s) and the copyright owner(s) are credited and that the original publication in this journal is cited, in accordance with accepted academic practice. No use, distribution or reproduction is permitted which does not comply with these terms.
*Correspondence: Jason C. Immekus, amNpbW1lMDEmI3gwMDA0MDtsb3Vpc3ZpbGxlLmVkdQ==
†Present Address: Kate E. Snyder, Psychology Department, Hanover College, Hanover, IN, United States