- 1Faculty of Psychology and Education Sciences, University of Porto, Porto, Portugal
- 2Department of Media and Communications, London School of Economics and Political Science, London, United Kingdom
- 3Institute of Social Studies, University of Tartu, Tartu, Estonia
- 4Department of Psychology, University of Bologna, Bologna, Italy
Civic and political participation (CPP) is often routinely operationalized through the same questions, as can be found in many related studies. While questions can be adapted in accordance with the research purposes, their psychometric properties are rarely addressed. This study examines the potential methodological problems in the measurement of CPP, such as the conflict between construct validity and measurement invariance, as well as unequal item functioning between some groups of people. We use the Rasch model to test 18 CPP questions for their relevance for the European youth population and to study differential item functioning between groups based on (1) age, (2) gender, (3) economic satisfaction, and (4) country of living. We discovered that CPP questions are strongly connected with the cultural and social context and can discriminate against some groups of people. The results demonstrate the need to develop more culturally responsive methods to study CPP and the paper offers suggestions on how to do so.
Introduction
Youth civic and political participation (hereinafter referred to as CPP) has been a focus of academic interest for a long time and most studies emphasize its fundamental role in healthy democracies (Turner, 1997; Torney-Purta et al., 2001; Mascherini et al., 2009; Amnå, 2012; Ekman and Amnå, 2012; Ferreira et al., 2012; Flanagan et al., 2012; Barrett and Zani, 2015; Ribeiro et al., 2017). In some cases, CPP is studied as a part of a more complex construct—Active Citizenship (Hoskins and Mascherini, 2009; Mascherini et al., 2009; Bee and Guerrina, 2014; Šerek and Jugert, 2018)—where it represents the behavioral part of citizenship. The importance of youth CPP is often discussed in schools and school educational programs can include components to support and promote CPP among students. For this reason, a big number of CPP studies are focused on the younger population.
There is a growing number of international comparative studies of CPP, here is a non-complete list of such projects: Processes Influencing Democratic Ownership and Participation (PIDOP) (Barrett and Zani, 2015); The Education, Audiovisual and Culture Executive Agency 2010/03: Youth Participation in Democratic Life (EACEA) (Cammaerts et al., 2013); International Civics and Citizenship Education Study (ICCS) (Schulz et al., 2016); European Social Survey (Jowell et al., 2007); World Value Survey (Inglehart et al., 2004); Eurobarometer (Saris and Kaase, 1997); The Active Citizenship Composite Indicator (ACCI) (Hoskins and Mascherini, 2009). These projects play a significant role in the CPP studies, bringing together many scholars from different countries, collecting a big amount of data and testing complex statistical models. Nevertheless, there is a discussion about the uncertainty of CPP definitions (Adler and Goggin, 2005), their dependence on the cultural and political context (Nissen, 2014), and the problem of measurement invariance (Elff, 2009; Elkins and Sides, unpublished manuscript).
The debate about measurement invariance has been intensely elaborated in the context of educational assessment and standardized tests (Hambleton and Patsula, 1998; Engelhard, 2008), such as national school exams, proficiency tests, and large-scale assessment studies (e.g., PISA, TIMMS). For the measurement to be invariant, questions need to have the same parameters for all the respondents regardless of their group affiliation. Differential Item Functioning (DIF) occurs when item parameters vary for people based on their gender, social class, cultural background or another characteristic. DIF is considered a major threat to scale validity (Dorans and Holland, 1992; Ercikan et al., 2014) and such items must be replaced or deleted from the scale. In cognitive tests, it is fairly easy to replace the items since the operationalization of the construct is not strongly connected with the questions. In psychological tests, the situation is more complicated, since some questions can be crucial for the operationalization of the construct and therefore can't be replaced or deleted. This is also the case for CPP, where the concept is often defined by examples of different activities. Moreover, these activities are often strongly connected with personal or cultural characteristics and can, therefore, display DIF naturally. Thus, there is a choice to be made between measurement equality (delete all DIF items) and construct validity (preserve all the items important for construct operationalization). In this study, we try to find a compromise between the two approaches and treat DIF as a source of information about cultural differences between the studied groups. We can use this information to investigate why these questions function differently, what they tell us about these groups and how far these groups are comparable.
Method
Participants
This paper is based on survey data from the CATCH-EyoU project (Constructing AcTive CitizensHip with European Youth: Policies, Practices, Challenges, and Solutions). This international study is funded by the European Commission under the H2020 Programme. The data was collected in 8 European countries: Italy, Sweden, Germany, Greece, Portugal, Czech Republic, Estonia, and the United Kingdom. The sample includes two age groups: the younger ones, from 14 to 18 years old, and the older ones, from 19 to 30. Adolescents and young adults were contacted through schools, universities and youth organizations and invited to answer the survey online or in pen-and-paper format. Respondents' participation was voluntary, and they provided informed consent to share their data for research purposes. The data collection started in Autumn 2016 and ended in Spring 2017.
The focus of this study is not on the participants per se, but on the CPP scale, questions and their parameters. Respondents with the maximum and minimum extreme scores (those who gave a positive answer to all the questions or to none) do not contribute to parameter estimation and were therefore excluded from the analysis. From the initial dataset of 9,785 people, 171 persons were removed due to the maximum extreme score, and 872 were removed due to the minimum extreme score, leaving 8,742 valid cases. Table 1 presents the number of the participants, as well as their distribution by countries, age, sex, and income satisfaction. All the groups have a sufficient number of observations for Rasch modeling and DIF analysis.
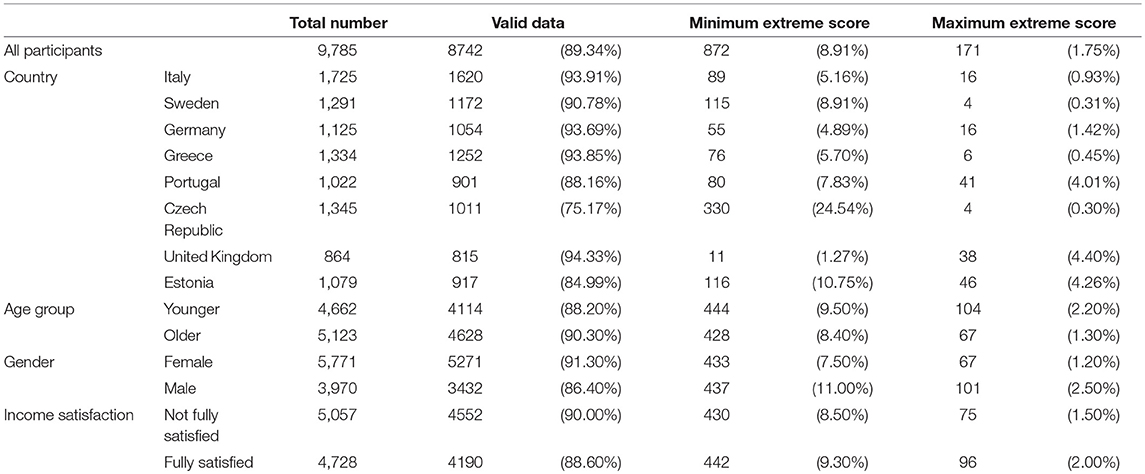
Table 1. Total number of participants and valid cases by countries, age groups, sex and income satisfaction.
Questions in the Analysis
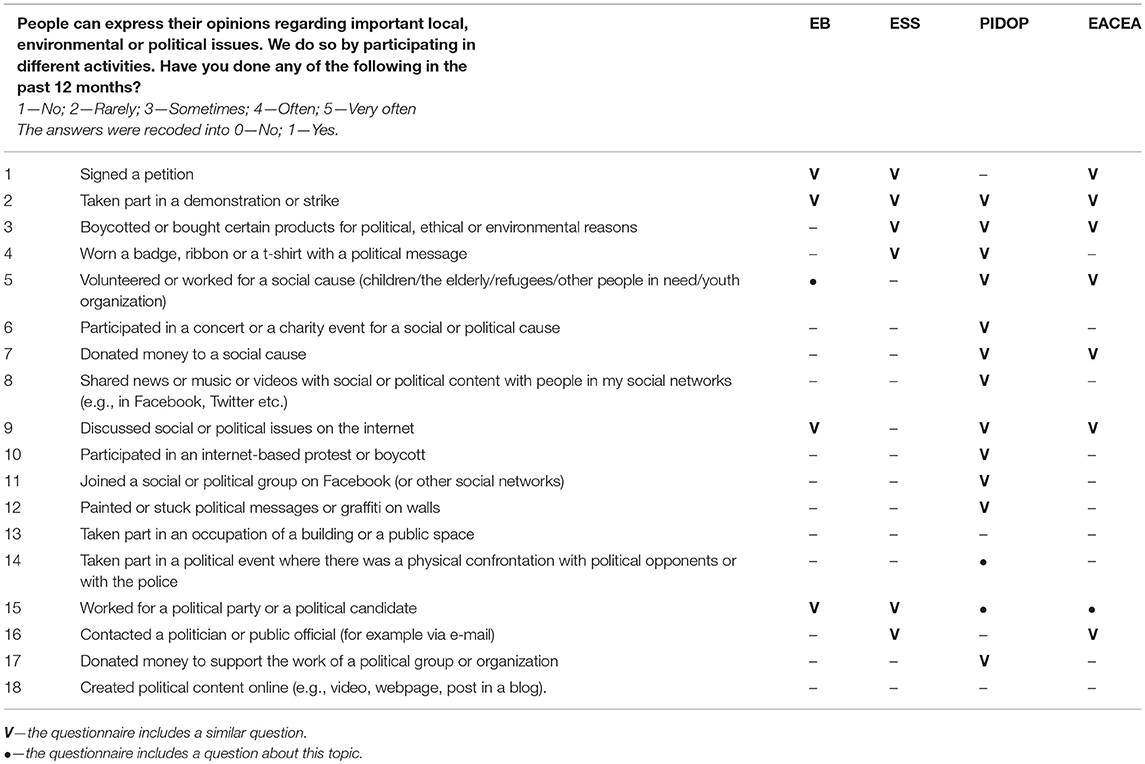
Though the Catch-Eyou questionnaire includes a wide range of topics related to youth active citizenship, in this paper we will focus specifically on the questions related to CPP. These questions were selected and created by the CATCH-EyoU team based in an overview of previous studies of CPP. The majority of the questions were adapted from the PIDOP study (Barrett and Zani, 2015). However, similar questions can be found in the European Social Survey, Eurobarometer, and EACEA: Youth Participation in Democratic Life. There are 18 questions that cover the main types of CPP, both conventional and non-conventional, such as personal protest activities (participation in demonstrations and signing petitions), economic actions (boycotting a certain product or donating money), civic volunteering, expression of personal opinion offline and online, political actions (work for a party or contacting a politician), as well as illegal activities (political graffiti, confrontation with the police). Questions about these topics often migrate from one CPP study to another and are used to assess the average level of CPP and to compare some groups of people based on this characteristic. These questions are very typical and, therefore, it is especially important to study their performance for different groups of people. The full list of questions and their origins is presented in Table 2.
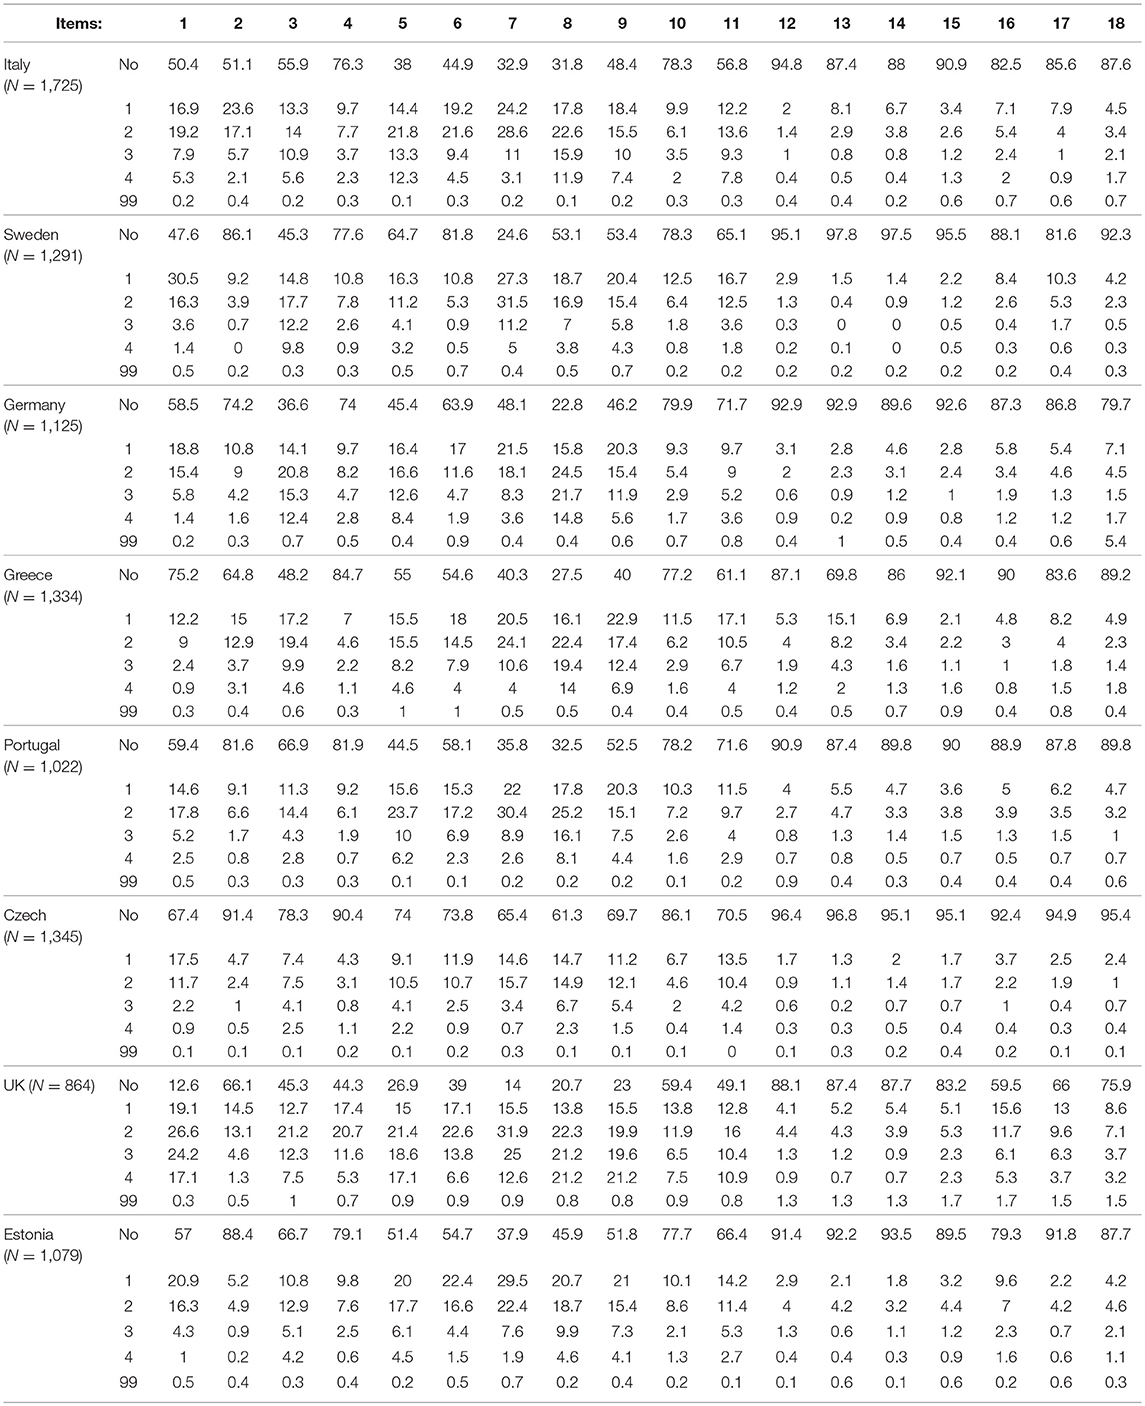
Initially, the questions included five response categories: 0—No; 1—Rarely; 2—Sometimes; 3—Often; 4—Very often. The distribution of all answer categories is given in Table 3. There are many cases (marked in gray), where the categories “often” and “very often” represent <2% of the answers. The category “Sometimes” also includes a small number of observations; in many cases it is below 5%. Therefore, we deemed it adequate to collapse the categories into a dichotomous format to proceed with the analysis. Although it was possible to keep more categories in some questions, we decided to unify the items and to use the same “yes/no” categories for all 18 questions. Another reason to dichotomize the items was the fact that the categories themselves can be a source of DIF since the concepts of “rarely” and “sometimes” can vary in different countries. Thus, the detected DIF could have had an ambiguous meaning—the difference in the interpretation of the question or in the interpretation of the category. Converting the data to “yes/no” categories helped to solve this problem, so the answers were re-coded into 0—No and 1—Yes (all other options).
Table 3 also presents information about the percentage of missing data (code 99), which is very low for all the questions in all the countries. The percentage of missing data grows a bit toward the end of the questionnaire since the order of the questions was not randomized. Due to the low percentage of missing data and the Rasch's analysis tolerance to it, we did not use specific methods to treat the missing cases. The missing items were ignored, and the model was calculated based on the present data.
Data Analysis
As stated above, this study examines the potential methodological problems in the measurement of CPP, such as the conflict between construct validity and measurement invariance, as well as unequal item functioning between some groups of people. We will address these questions using Item Response Theory (IRT), one-parameter Rasch model (Andrich, 2010; Boone et al., 2013). This model suggests that respondents with higher levels of CPP have a higher probability of agreeing with the statements about personal involvement in these activities. Item difficulty is the only parameter in this model, it indicates that some types of CPP are rather common and easy to engage in, while others are rare or laborious. IRT models are based on logistic regressions, which means that the respondent's latent trait levels (θ) and item difficulties (b) are calculated as log odds (or logits) and located on the same continuous scale (van der Linden and Hambleton, 1997). Rasch analysis was conducted using Winsteps software, version 3.73 (Linacre, 2011).
To evaluate the goodness of fit, we use mean-square residual summary statistics (MNSQ), which are traditional and convenient quantitative measures of fit discrepancy (Linacre, 2003). This statistic can vary from 0 to infinity and has an expectation value of 1.0. An MNSQ value smaller than 1.0 means the data overfit the model, making it redundant; on the other hand, an MNSQ value >1.0 indicates unmodeled noise and unpredictability. However, in practice, the fit is never expected to be perfect and values between 0.5 and 1.5 are deemed productive for measurement (Wright, 1994). Winsteps software provides two fit statistics: infit and outfit. The first is weighted by model variance and works on the middle part of the distribution, and the second is an outlier-sensitive fit statistic. In other words, the infit statistic indicates if the general pattern of data fits the model, and the outfit statistic indicates if the data contain a large number of outliers (Linacre, 2002).
The scale of civic and political participation includes questions that describe rare and specific behavior. Therefore, the scale can be tilted toward the most active groups, while its relevance to the younger population is still a subject of investigation. We can address this problem using the item-person map, where item difficulties are juxtaposed to the respondents' abilities (Stelmack et al., 2004). If the question is too much above or below the respondents' level, it isn't useful for the evaluation and brings extra noise to the data. This analysis assesses the relevance of questions for the younger population.
Differential Item Functioning (DIF) is the core concept of this study. It emerges when two people with the same level of a given underlying ability (in our case, active citizenship) have a different probability of giving a positive response to a specific question based on their group affiliation (Dorans and Holland, 1992; Walker, 2011). In this study, we follow the ETS recommendations to detect and classify DIF (Zwick, 2012) based on the magnitude and the statistical significance of differences using Mantel-Haenszel (MH) chi-square statistic. These recommendations distinguish A, B, and C types of DIF. Type A is negligible DIF, which size is smaller than 0.43 logits and/or the Mantel-Haenszel (MH) chi-square statistic is not statistically significant. Type C is large DIF, which must be statistically significant and have an absolute value of 0.64 logits or more. All the items that do not meet the criteria for A or C items are considered to be B items (moderate DIF). This approach helps to distinguish severe DIF from the moderate DIF and focus more on the first one.
We test 18 CPP questions for differential item functioning between groups based on (1) age, (2) gender, (3) economic satisfaction, and (4) country of living. The detailed statistics on these groups are given in Table 1. Gender identity is ascertained based on the direct question included in the questionnaire, where respondents were asked to identify themselves as women or men. The question was not compulsory, and 44 respondents preferred not to answer it (or selected the option “other”); these cases were excluded from this part of the analysis. The age groups are defined by the self-reported age: the younger group includes people from 14 to 18 years old, and the older group includes people from 19 to 30 years. Economic satisfaction was identified based on the question “Does the money your family earns cover everything your family needs?,” which had four answer options: not at all; partially; mostly; fully. However, the first two categories contained only a small number of observations and therefore were merged with the third category. As a result, we compare a fully satisfied group with a not fully satisfied group. Finally, we study DIF in 8 groups based on the country of respondents.
The results section starts with a general overview of the model parameters and the model fit. Next, we address the problem of specific targeting and the items' relevance to the general population. Finally, we discuss DIF and measurement equality in groups based on (1) age, (2) gender, (3) economic satisfaction, and (4) country of living. This will allow identifying the degree of measurement invariance between these groups and the severity of threats to construct validity.
Results
Rasch Model
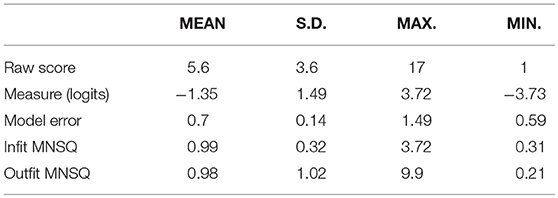
The summary of model parameters is given in Table 4. The mean raw score is equal to 5.6, the standard deviation is 3.6, the distribution is shifted to the left side. The scale has good reliability, Cronbach Alpha (KR-20) is equal to 0.86. The measure in logits is also shifted to the “low” side and equal to −1.35 on average, with a standard deviation of 1.49. The fit statistics are within the acceptable range; however, high numbers in maximums indicate the presence of outliers. The model error is relatively high (0.7) and it relates to the balance of the questions' difficulty—many questions do not match the ability level of the participants and therefore provide little information.
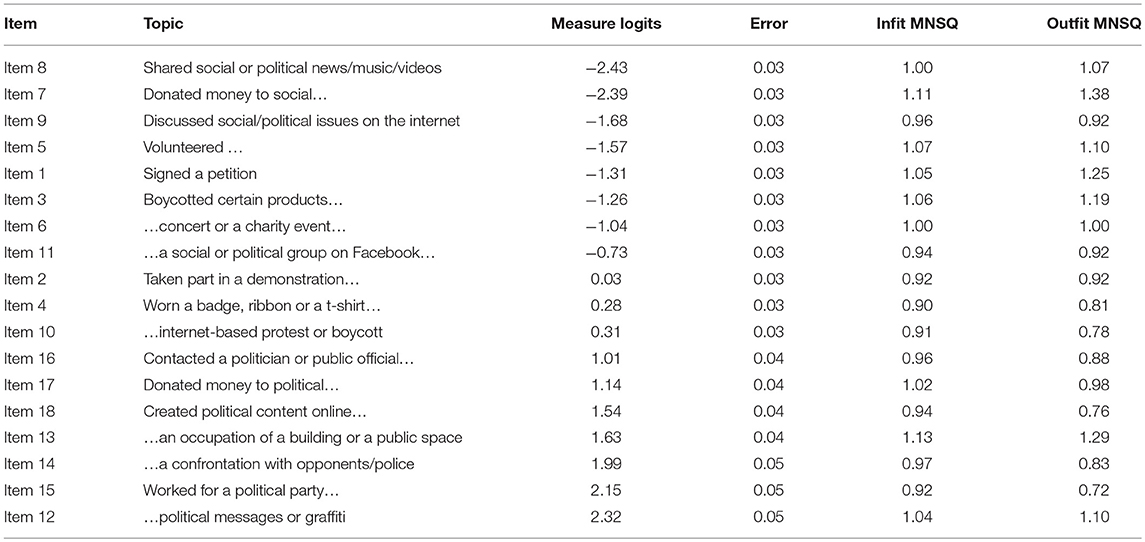
Table 5 provides information about item difficulties, errors of measurement, infit and outfit mean-square residual statistics. The items are organized by their difficulty, starting with the low difficulty on the top and finishing with the most difficult items. Based on this order, we can differentiate regular and common activities, such as sharing social or political content on the internet, money donation, internet discussions, volunteering, signing petitions and social activism; as well as rare and difficult activities, such as painting graffiti, confrontation with the police, occupation of a public space or work for a party. Difficulty can be explained by the cost of participation—the amount of time, energy, and commitment that is required to participate in the activity, as well as the legal consequences of the action. Some activities can be supported by social and cultural norms while others are restrained and therefore more difficult. To be sure, explanation of specific cases includes a combination of different reasons. To avoid speculation, in this study we don't go deep into interpretations and limit our discussion to the declaration of existing differences. Item errors of measurement are very low because of the big sample size, but errors grow slightly for the most difficult items since the sample includes fewer people with high level of CPP. All fit statistics are within the appropriate range, which means that all items are productive for measurement and can be included in the participation scale.
The Analysis of Item Difficulties and Their Relevance to the Respondents
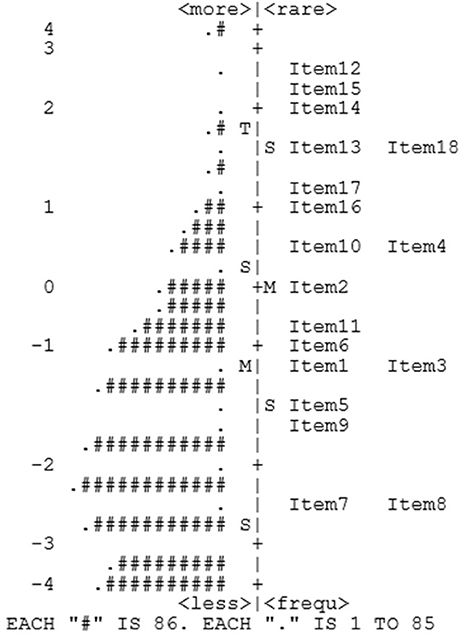
In Rasch models, the optimal level of item difficulty should match the respondents' abilities. Figure 1 presents the items' locations and the number of participants that match them (variable map). The distribution of the participants is shifted to the bottom, which means that the majority of respondents have low levels of civic and political participation. Questions that match the majority of the participants are of an appropriate difficulty for this sample: (8) Shared news/music/videos with social or political content…; (7) Donated money to a social cause; (9) Discussed social/political issues on the internet; (5) Volunteered/worked for a social cause; (1) Signed a petition; (3) Boycotted/bought certain products…; (6) Participated in a concert/charity event…; (11) Joined a social/political group on Facebook. The next questions have higher difficulty but are still relevant for a considerable number of respondents: (2) Taken part in a demonstration…; (4) Worn a badge/ribbon/t-shirt with a political message; (10) Participated in an internet-based protest. And finally, the questions on the top are very difficult and only relevant to a small part of the our sample: (16) Contacted a politician…; (17) Donated money to a political group…; (18) Created political content online…; (13) Taken part in an occupation of a public space; (14) Taken part in a political event where was a physical confrontation with political opponents or police; (15) Worked for a political party or a candidate; (12) Painted political messages/graffiti on walls. These questions describe very specific behavior, typical only of the most active respondents. The scale composition can be adjusted considering the target population. If the sample is to include respondents with very high levels of CPP (activists, for example), these questions will be important to evaluate them correctly. However, in the case of average respondents, these questions do not provide relevant information and become a source of noise. For future research, it is recommended to adjust the composition of the scale and use only the relevant questions, as it will improve measurement reliability.
Differential Item Functioning
To analyze differential item functioning, we compare item difficulties between groups and look at the absolute size of the differences and their statistical significance. The results are presented in Tables 6–9. DIF type is defined in accordance with ETS classification, where type A is negligible, type B moderate and type C large. The direction of the DIF is further distinguished by the signs: negative (-) for the items favoring the first group and positive (+) for the items favoring the second group.
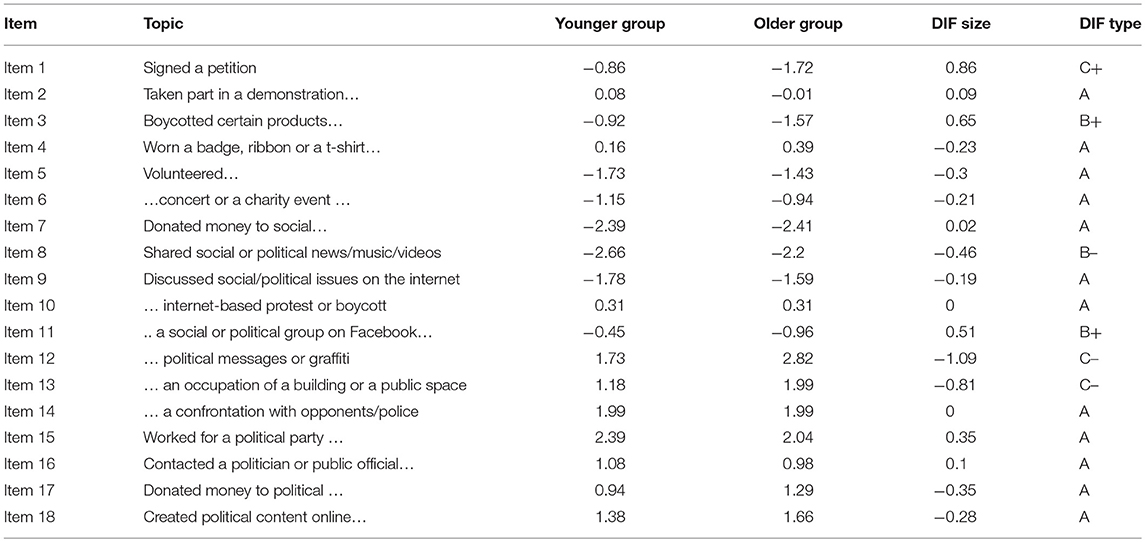
Table 6 presents DIF analysis for the younger and older age groups. Most items do not demonstrate significant DIF and can be used to evaluate and compare two groups. However, there are six items with significant DIF. Three of them favor the older group: (1) Signed a petition, (3) Boycotted/bought certain products, and (11) Joined a social/political group on Facebook. And three items favor the younger group: (8) Shared news/music/videos with social or political content, (12) Painted political messages/graffiti, (13) Taken part in an occupation of a public space. This means that people from one group are more likely to agree with these questions when compared to the people with the same level of CPP engagement from the other group. These differences can be explained by social, cultural or legal differences between the two groups: for example, older people may suffer worse consequences for illegal actions while signing a petition may have minimum age requirements. Thus, with the same level of CPP engagement, some actions can be easier for younger people, and other actions can be easier for older people. However, DIF interpretation should always consider the general difficulty of the question and its prevalence for the groups. For example, the question about a physical confrontation with the police is very difficult for both groups and functions equally, in contrast to the question about graffiti, which seems to be more typical for younger people. Another interesting example is the case of questions number 8 and 11, where the item “Joined a social or political group on Facebook” favors the older group and the item “Shared news or music or videos with social or political content” favors the younger group. Probably, these are behavioral patterns more typical of each group.
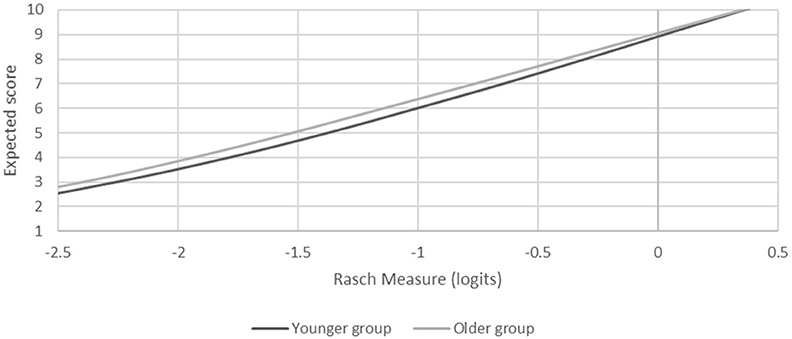
The scale is balanced by the number of DIF questions that work in each direction, which means that the questions that discriminate against one group are compensated by the questions that discriminate against another. However, the balance of the scale depends not only on the number of questions but also on their contribution to the final score. To estimate the total effect of DIF questions on the final score, we built test characteristic curves for each group and compared them (Figure 2). The two curves are very close to each other, and the difference in the central part of the distribution is insignificant.
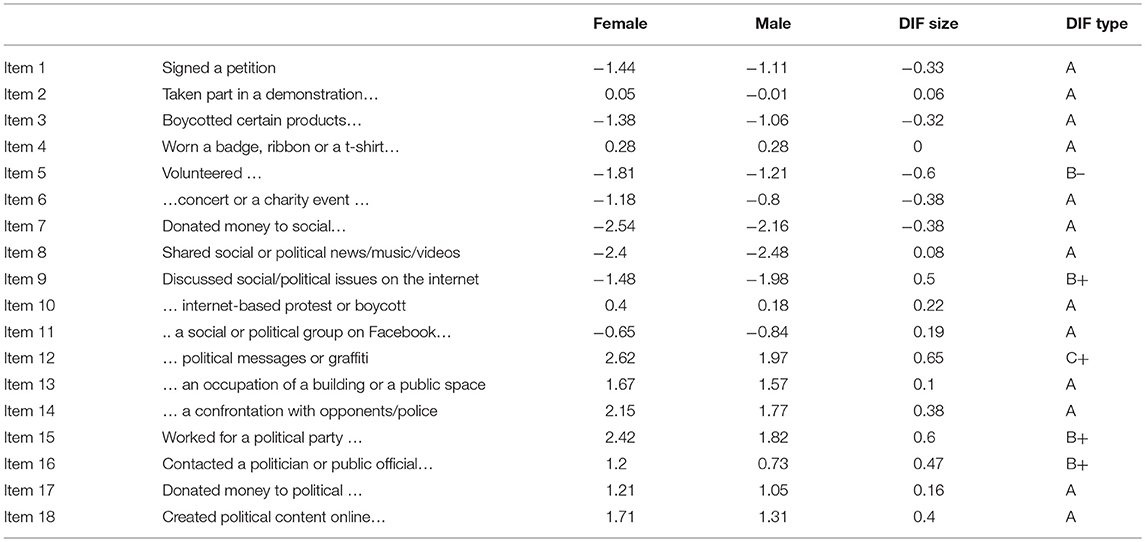
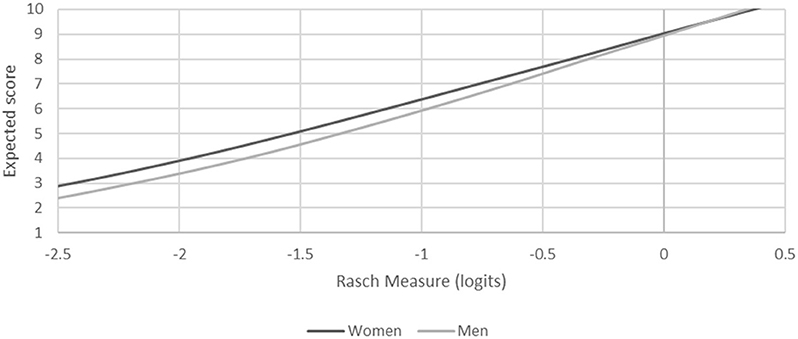
The results of DIF analysis for male and female groups are presented in Table 7. Most items don't have a significant DIF and are defined as type A. However, five items are problematic. Only one item demonstrates DIF in favor of the female group: (5) Volunteered/worked for a social cause. Two more items can potentially benefit the female group: (6) Participated in a concert or a charity event for a social/political cause, (7) Donated money to a social cause. However, the DIF size of these items is below 0.43 logits. In contrast, there are four items in favor of the male group: (9) Discussed social/political issues on the internet, (12) Painted political messages or graffiti, (15) Worked for a political party or a candidate, (16) Contacted a politician. Though the scale includes a bigger number of questions favoring the male group; three of these questions are relevant only for the respondents with a high level of CPP.
There is a noticeable gap between test characteristic curves (Figure 3). For the people with lower level of civic and political participation, women have a small advantage compared to men, and for the group of people with higher level of civic and political participation, men have an advantage. Nevertheless, these differences should be discussed considering that the majority of the respondents has lower levels of participation; thus, for our sample, the scale composition gives a minor advantage to women (~0.2–0.3 logits), because the relevant DIF items have lower difficulty for the female group. On the other side, if we address this scale to the participants with the higher levels of participation, the situation will reverse. The situation can be fixed by deleting all DIF questions from the scale; however, this will meddle with construct validity and the reliability of the scale. Another option is to try to balance the DIF questions in accordance with the target population.
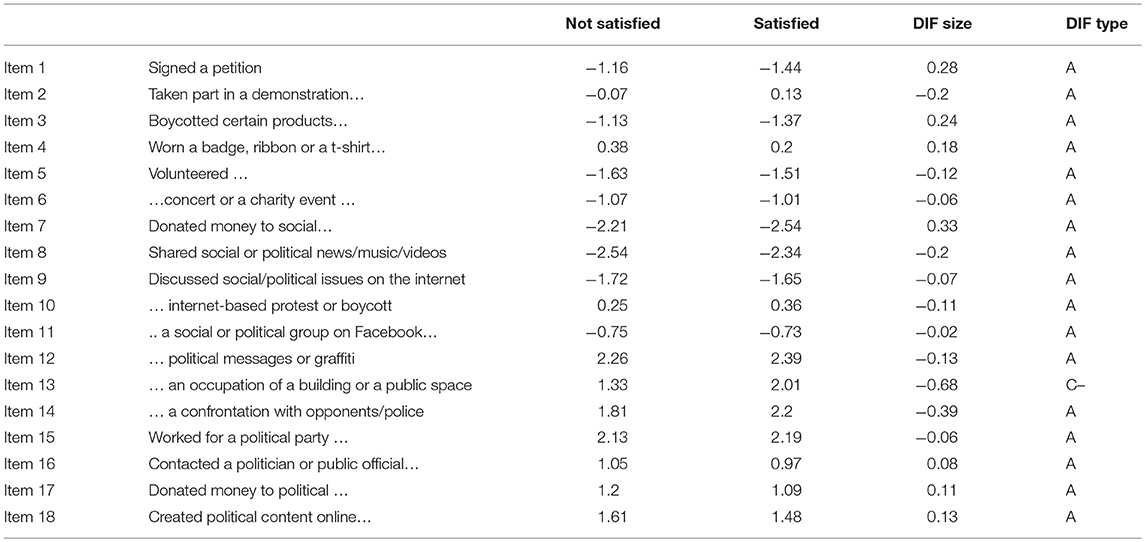
Next, we investigate DIF between people who are fully satisfied with their income comparing to people who are not fully satisfied with their economic situation (Table 8). Almost all the questions function similarly for these two groups. Even though some questions have a difference in difficulty, a DIF size below 0.43 logits indicates they type A negligible DIF. For example, questions (7) Donated money to a social cause (favoring satisfied group), and (14) Taken part in a political event where there was a physical confrontation with political opponents or with the police (favoring the not satisfied group) have an absolute DIF size below 0.43. There is only one case of severe DIF: (13) Taken part in an occupation of a building or a public space. This question strongly discriminates against the satisfied group. However, this item is relevant only for the participants with a high level of civic and political participation. The comparison of test characteristic curves demonstrates that there is almost no difference between the two curves and, therefore, the overall estimation is not biased by the income satisfaction of respondents (Figure 4).
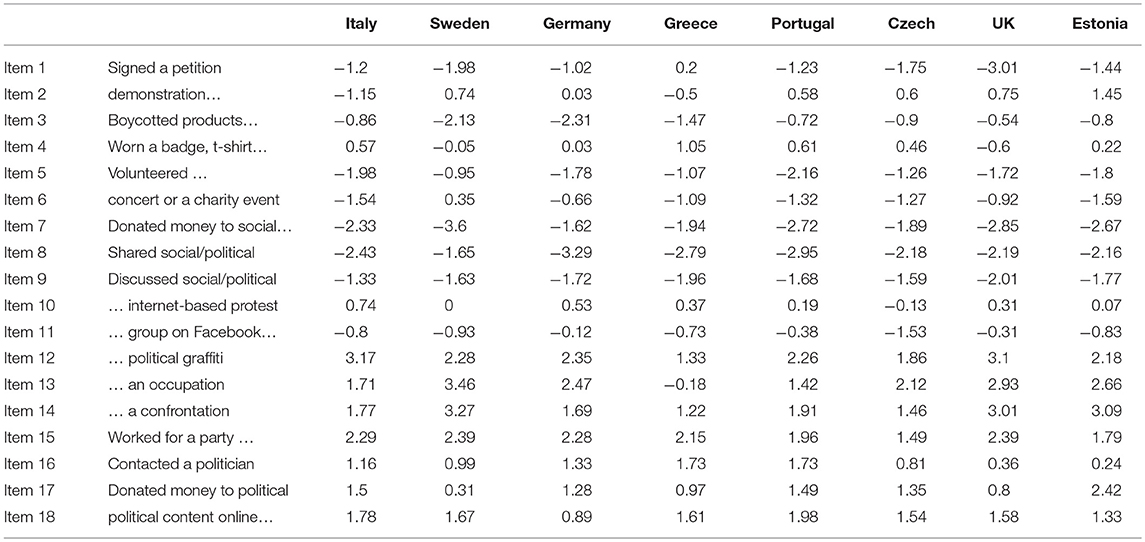
Next, we compare the item functioning in 8 European countries: Italy, Sweden, Germany, Greece, Portugal, Czech Republic, Estonia, and The United Kingdom. The item difficulties are presented in Table 9. The whole picture is very fragmented, as many countries present significant DIF. The variation of difficulties for some items is more than 3 logits, the same item can be of an average difficulty in one country and extremely difficult in another. This can happen due to cultural, political or economic differences, as well as due to methodological problems, such as sampling procedures or translation. These questions function in a completely different way, which means that respondents understand them differently or these questions have different value to the respondents. Therefore, these questions cannot be used to compare the level of CPP across countries.
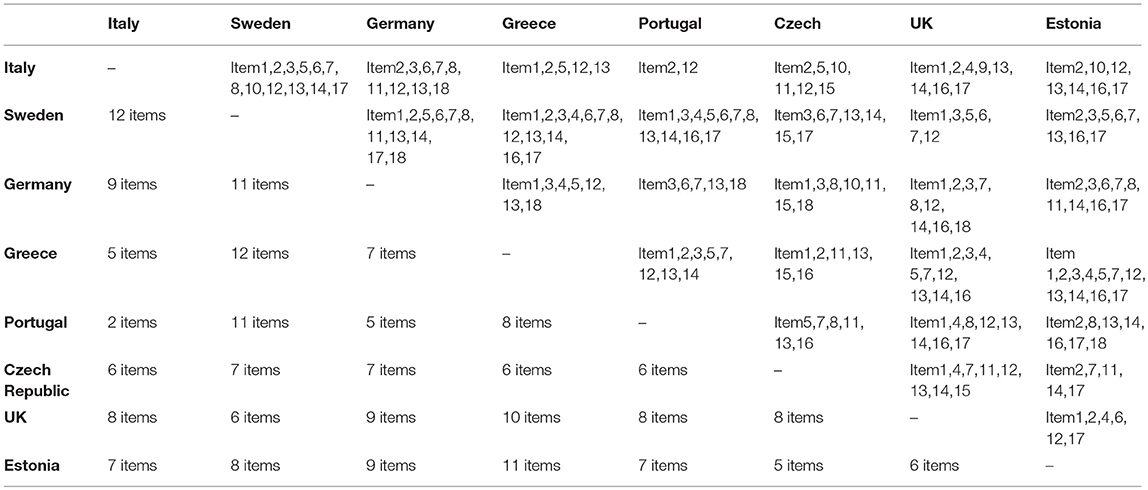
However, some countries are more similar in terms of item functioning. Table 10 presents type C DIF items and the number of these items for each pair of countries. There is no single pair of countries with no DIF items. This means that none of these countries can be compared directly to another. However, while some pairs have a high number of DIF items, the situation is much better in other pairs. The small number of DIF items in the same pairs demonstrates that these countries are more comparable to each other in terms of item functioning and there are more cultural and contextual similarities between them.
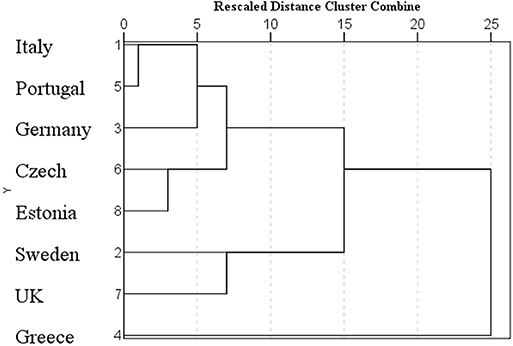
To find which countries are more comparable to each other, we organized countries in groups based on their profiles using cluster analysis and between-group average linkage (using IBM SPSS Statistics 25). The results are presented in Figure 5. The results based on the average distances demonstrate that the profile of Greece is very different from all the other countries, Sweden is close to the UK, the Czech Republic is close to Estonia, and Germany can be comparable to Italy and Portugal. The dendrogram demonstrates the proximity of countries and, as a result, their potential comparability. Since it is impossible to compare all the countries at the same time, it is recommended to focus on the comparisons between more similar countries.
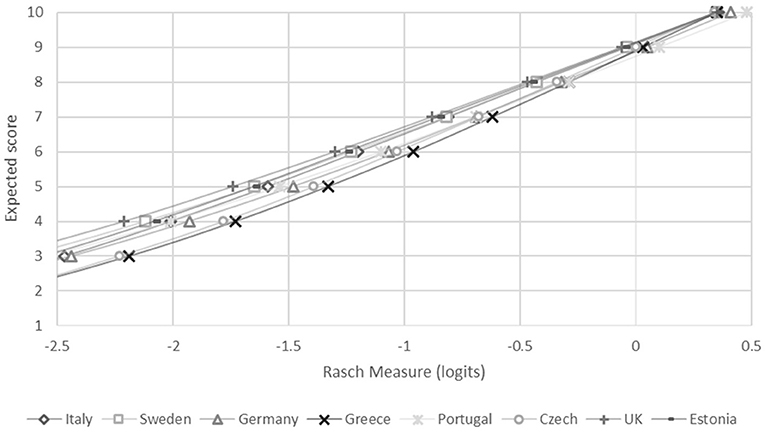
Test characteristic curves for each country are presented in Figure 6. There is a significant gap between the lines, and therefore a comparison between all eight countries is not fair. Since most respondents have a low level of CPP and are located on the left side of the scale, in this particular case the test discriminates mostly against the people from Greece and the Czech Republic. At the same time, this test gives an unfair advantage to the people from the UK and Sweden, since the majority of the most relevant questions (such as signed a petition, worn a badge, volunteered or donated money) are more typical for the people from these countries. This analysis demonstrates that cultural context plays a significant role in the way people respond to the same questions. Therefore, we should pay more attention to the problems of translation, adaptation, interpretation of questions used in international studies.
Discussion
This paper examined the construct of CPP and its measurement equivalence across various groups. Using the Rasch model, we tested the relevance of 18 questions about CPP for young people and the differential item functioning for people of different age, gender, income satisfaction and countries. Even though all the items fit the model and can be used to measure civic and political participation, 7 items out of 18 have high difficulty and are only relevant for the most active respondents. This means that the scale is oriented toward the most active participants, even though they are the minority in this sample. For the future, it is recommended to balance the scale according to the sample level and include only the most relevant items in the scale, such as volunteering, internet discussions, sharing information in social media, participating in concerts or charity events, money donation and other items of average and low difficulties. Questions about these activities were the most relevant to our respondents and provided the most reliable information.
Establishing measurement invariance can be achieved by deleting all the DIF items, but it can compromise construct validity. We managed to identify the cases where measurement invariance can be achieved by minor changes to the scale. The smallest differences in item functioning were observed between people who are fully satisfied with their family income and those who are not fully satisfied. For them, only one question presents a severe DIF—in favor of the less satisfied group (Item13). However, this question does not contribute much to the overall scale invariance, and the scale functions equally for people regardless of their income satisfaction. More differences in item functioning were observed between younger and older groups. Three questions favor the older group (Item1, Item3, Item11) and three questions favor the younger group (Item8, Item12, Item13). These questions balance each other; the test characteristic curves are very similar for both groups, and therefore the final score is not biased by the presence of these DIF items. Though in our case the scales are not biased by these items, there is still a potential threat of disrupting the balance if the questions are altered.
There are problems with measurement invariance between the male and female groups, test characteristic curves have a noticeable gap. There is only one question in favor of the female group (Item5) and there are four items in favor of the male group (Item9, Item12, Item15, Item16). All questions favoring the male group have high difficulty and are relevant only for a very small part of the sample. In contrast, the question favoring the female group has a lower difficulty and is relevant for a larger number of respondents. This question refers to volunteering and social work. Statistically, women are more engaged in volunteering then men (Taniguchi, 2006). However, DIF indicates that women not only volunteer more often but, for the same level of CPP, have a higher probability of volunteering. This can be backed by opportunities, traditions, cultural norms, gender roles and even the labor market. Therefore, the female group has a small advantage on the question about volunteering, but this item cannot be deleted because it is an important part of CPP. This is a case where construct validity confronts measurement invariance. For future research, we recommend keeping this question but to control the scale balance.
Finally, we studied item functioning in eight European countries and found incomparability between them. The differences between countries are much bigger and severe than differences between groups based on age, sex or income satisfaction. Some countries are incomparable due to severe differential item functioning. This means that even though we ask the same questions, we cannot compare the results because these questions have different social, political or economic value. However, some countries are more similar than others and we can find similar profiles that allow identifying groups of countries that are potentially more comparable. Using cluster analysis and between-group average linkage, we investigated the proximity between profiles and organized countries into groups. In terms of item functioning, Sweden is close to the UK, the Czech Republic is close to Estonia, Italy is close to Portugal and Germany and Greece are each different from all the other countries. In other words, there are groups of countries, that are more similar to each other in terms of item functioning, and there are countries that are not comparable. For example, it is invalid to compare Greece and Sweden because there are too many differences in item functioning. However, the nature and the source of these differences require further discussion and investigation. To summarize, studies of CPP often use the same questions about civic and political activities but pay little attention to the problems of their relevance and measurement invariance. These questions are strongly connected with the cultural and social context and can have a different meaning for people of different backgrounds. In this study, we discovered the differential item functioning in groups based on age, gender, income satisfaction, and country of living. In some cases, the differences were small, but even minor differences should be controlled to verify the validity of the research. In the case of countries, the differences in item functioning are severe and render impossible a direct comparison between countries. However, some countries are more comparable than others. It seems extremely challenging to achieve measurement invariance for all the countries while keeping the sufficient number of items to maintain construct validity. In this situation, it makes more sense to divide countries into groups and to compare only the countries with similar profiles. Some changes may be required in every case, but the fewer countries we want to compare, the easier it will be to preserve construct validity.
This study highlights the need to sophisticate the discussion around the methods typically used to measure CPP, especially in cross-cultural comparisons. Currently, the problem of measurement invariance is often overlooked or ignored. Some researchers argue that it is unproductive to apply latent trait models to measure CPP and suggest using classical test theory methods, such as summarizing items to create an indicator of the diversity of CPP activities. However, this is not an effective solution because in this case the problem of measurement invariance still exists, albeit in a hidden form. We must acknowledge that latent trait estimates correlate with the sum of raw scores and, technically, using the sum merely conceals the problem of measurement invariance, rather than solving it. More refined approaches, then, have to be developed to deal with measurement invariance in CPP studies.
In this regard, a few alternatives can be considered. In some studies, structural equation modeling is used to confirm configural, metric, or scalar invariance. In this approach, the questions that contribute to invariance should be deleted. As discussed above, however, some items are crucial for construct validity and therefore cannot be deleted. For these cases, more complex models can be elaborated, in which questions with DIF are treated separately for each country (as if they were different questions). This approach allows keeping the important items and preserving the measurement invariance. An alternative way is to conduct comparisons of the level of single items. This approach can help looking into cultural differences, identifying what types of CPP are more typical in every country. Unfortunately, in this case, information on the average levels of participation will be lost. However, some can reply that, considering cross-cultural differences in CPP, it doesn't make sense to compare the average level of CPP between countries anyway, because in every country this construct will have a different meaning. Therefore, the discussion will shift from the average levels of CPP to the patterns of CPP and how these patterns are based on the country's history, political situation, economic development or other factors. This approach can bring new interesting, insights to the studies of CPP. For future research, we recommend paying more attention to the problem of measurement invariance and to develop more culturally responsive measurement practices.
Data Availability
The datasets analyzed in this study can be found in the Zenodo repository https://doi.org/10.5281/zenodo.2557710.
Author Contributions
EE performed the statistical analysis and wrote the first draft of the manuscript. TN and PF contributed conception and design of the study. SM, VK, and EC organized the data collection. All authors contributed to manuscript revision, read, and approved the submitted version.
Funding
EE is supported by the Portuguese national funding agency for science, research and technology (Fundação para a Ciência e a Tecnologia—FCT) under the grant (PD/BD/114286/2016). VK is supported by the Estonian Ministry of Education and Research under the grant IUT 20–38. The research uses the data collected under CATCH-EyoU project funded by European Union, Horizon 2020 Programme, Constructing AcTiveCitizensHip with European Youth: Policies, Practices, Challenges, and Solutions (www.catcheyou.eu) [Grant Agreement No 649538].
Conflict of Interest Statement
The authors declare that the research was conducted in the absence of any commercial or financial relationships that could be construed as a potential conflict of interest.
References
Adler, R. P., and Goggin, J. (2005). What do we mean by “civic engagement”? J. Trans. Edu. 3, 236–253. doi: 10.1177/1541344605276792
Amnå, E. (2012). How is civic engagement developed over time? emerging answers from a multidisciplinary field. J. Adolesc. 35, 611–627. doi: 10.1016/j.adolescence.2012.04.011
Andrich, D. (2010). “Rasch models,” in International Encyclopedia of Education (Pergamon), 111–122. doi: 10.1016/B978-0-08-044894-7.00258-X
Barrett, M., and Zani, B. (Eds.). (2015). Political and Civic Engagement: Multidisciplinary Perspectives. New York, NY: Routledge/Taylor & Francis Group.
Bee, C., and Guerrina, R. (2014). Framing civic engagement, political participation and active citizenship in europe. J. Civ. Soc. 10, 1–4. doi: 10.1080/17448689.2014.897021
Boone, W. J., Staver, J. R., and Yale, M. S. (2013). Rasch Analysis in the Human Sciences. Springer Science & Business Media. doi: 10.1007/978-94-007-6857-4
Cammaerts, B., Bruter, M., Banaji, S., Harrison, S., and Anstead, N. (2013). EACEA 2010/03: Youth Participation in Democratic Life, Final Report. London: LSE Enterprise.
Dorans, N. J., and Holland, P. W. (1992). Dif detection and description: mantel-haenszel and standardization, ETS Res. Report Series 1992: i–40. doi: 10.1002/j.2333-8504.1992.tb01440.x
Ekman, J., and Amnå, E. (2012). Political participation and civic engagement: towards a new typology. Hum. Affairs 22, 283–300. doi: 10.2478/s13374-012-0024-1
Elff, M. (2009). “Political knowledge in comparative perspective: the problem of cross-national equivalence of measurement,” in Paper Prepared for the MPSA 2009 Annual National Conference (Chicago, IL), 1–27.
Engelhard, G. (2008). Historical perspectives on invariant measurement: guttman, rasch, and mokken. Meas. Int. Res. Perspect. 6, 155–189. doi: 10.1080/15366360802197792
Ercikan, K., Roth, W. M., Simon, M., Sandilands, D., and Lyons-Thomas, J. (2014). Inconsistencies in DIF detection for sub-groups in heterogeneous language groups. Appl. Meas. Educ. 27, 273–285. doi: 10.1080/08957347.2014.944306
Ferreira, P. D., Azevedo, C. N., and Menezes, I. (2012). The developmental quality of participation experiences: beyond the rhetoric that “participation is always good!” J. Adolesc. 35, 599–610. doi: 10.1016/j.adolescence.2011.09.004
Flanagan, C., Beyers, W., and Žukauskiene, R. (2012). Political and civic engagement development in adolescence. J. Adolesc. 35, 471–473. doi: 10.1016/j.adolescence.2012.04.010
Hambleton, R. K., and Patsula, L. (1998). Adapting tests for use in multiple languages and cultures. Soc. Indic. Res. 45, 153–171. doi: 10.1023/A:1006941729637
Hoskins, B. L., and Mascherini, M. (2009). Measuring active citizenship through the development of a composite indicator. Soc. Indic. Res. 90, 459–488. doi: 10.1007/s11205-008-9271-2
Inglehart, R., Basanez, M., Jaime, D.-M., Halman, L., and Luijkx, R. (2004). Human Beliefs and Values: A Cross-Cultural Sourcebook Based on the 1999-2002 Values Surveys. Mexico: Siglo XXI.
Jowell, R., Roberts, C., Fitzgerald, R., and Eva, G. (2007). Measuring Attitudes Cross-Nationally. London, SAGE Publications Ltd.
Linacre, J. M. (2002). What do infit and outfit, mean-square and standardized mean? Rasch Measure. Trans. 16:878.
Linacre, J. M. (2003). Rasch power analysis: size vs. significance: infit and outfit mean-square and standardized chi-square fit statistic. Rasch Meas. Trans. 17:918.
Mascherini, M., Manca, A. R., and Hoskins, B. (2009). The Characterization of Active Citizenship in Europe. Joint Research Centre Scientific and Technical Reports. European Commission. doi: 10.2788/35605
Nissen, S. (2014). The Eurobarometer and the process of european integration: methodological foundations and weaknesses of the largest european survey. Qual. Qual. 48, 713–727. doi: 10.1007/s11135-012-9797-x
Ribeiro, N., Neves, T., and Menezes, I. (2017). An organization of the theoretical perspectives in the field of civic and political participation: contributions to citizenship education. J. Polit. Sci. Edu. 13, 426–446. doi: 10.1080/15512169.2017.1354765
Saris, W. E., and Kaase, M. (eds.). (1997). Eurobarometer: Measurement Instruments for Opinions in Europe (ZUMANachrichten Spezial, 2). Mannheim: Zentrum für Umfragen, Methoden und Analysen-ZUMA. Available online at: https://nbn-resolving.org/urn:nbn:de:0168-ssoar-49742-1
Schulz, W., Ainley, J., Fraillon, J., Losito, B., and Agrusti, G. (2016). IEA International Civic and Citizenship Education Study 2016 Assessment Framework. Amsterdam: International Association for the Evaluation of Educational Achievement (IEA). doi: 10.1007/978-3-319-39357-5
Šerek, J., and Jugert, P. (2018). Young European citizens: an individual by context perspective on adolescent European citizenship. Euro. J. Dev. Psychol. 15, 302–323. doi: 10.1080/17405629.2017.1366308
Stelmack, J., Szlyk, J. P., Stelmack, T., Babcock-Parziale, J., Demers-Turco, P., Williams, R. T., et al. (2004). Use of rasch person-item map in exploratory data analysis: a clinical perspective. J. Rehabil. Res. Dev. 41, 233–41.
Taniguchi, H. (2006). Men's and women's volunteering: gender differences in the effects of employment and family characteristics. Non Profit Volunt. Sect. Q. 35, 83–101. doi: 10.1177/0899764005282481
Torney-Purta, J., Lehmann, R., Oswald, H., and Schulz, W. (2001). Citizenship and education in twenty-eight countries: civic knowledge and engagement at age fourteen. Int. Association for the Evaluation of Educational Achievement (IEA), 23, 583–587.
Turner, B. S. (1997). Citizenship studies: a general theory. Citizensh. Stud. 1, 5–18. doi: 10.1080/13621029708420644
van der Linden, W. J., and Hambleton, R. K. (eds.). (1997). “Item response theory: brief history, common models, and extensions,” Handbook of Modern Item Response Theory (New York, NY: Springer), 1–28. doi: 10.1007/978-1-4757-2691-6_1
Walker, C. M. (2011). What's the DIF? Why differential item functioning analyses are an important part of instrument development and validation. J. Psychoeduc. Assess. 29, 364–376.
Wright, and Linacre, J. M. (1994). Reasonable mean-square fit values. Rasch Measurement Transactions (Vol. 8).
Keywords: civic participation, political participation, measurement invariance, Rasch, DIF
Citation: Enchikova E, Neves T, Mejias S, Kalmus V, Cicognani E and Ferreira PD (2019) Civic and Political Participation of European Youth: Fair Measurement in Different Cultural and Social Contexts. Front. Educ. 4:10. doi: 10.3389/feduc.2019.00010
Received: 29 September 2018; Accepted: 29 January 2019;
Published: 19 February 2019.
Edited by:
Mustafa Asil, University of Otago, New ZealandReviewed by:
Rosemary Hipkins, New Zealand Council for Educational Research, New ZealandZi Yan, The Education University of Hong Kong, Hong Kong
Copyright © 2019 Enchikova, Neves, Mejias, Kalmus, Cicognani and Ferreira. This is an open-access article distributed under the terms of the Creative Commons Attribution License (CC BY). The use, distribution or reproduction in other forums is permitted, provided the original author(s) and the copyright owner(s) are credited and that the original publication in this journal is cited, in accordance with accepted academic practice. No use, distribution or reproduction is permitted which does not comply with these terms.
*Correspondence: Pedro D. Ferreira, cGZlcnJlaXJhQGZwY2UudXAucHQ=
 Ekaterina Enchikova
 Tiago Neves
 Sam Mejias2
 Veronika Kalmus
 Elvira Cicognani
 Pedro D. Ferreira