- Graduate School of Education, University of Exeter, Exeter, United Kingdom
This paper aims to examine the changes in school composition in England from 2011 to 2017 by school type and school phase; the speed of academisation by region; and the changes in the proportions of pupils with special educational needs (SEN) at SEN Support and EHC Plan levels overall. We analyse publicly available school level data from the National Pupil Database (NPD) to document two simultaneous trends in English education between 2011 and 2017. First, we observe an increasing percentage of the schools that have become Academies, especially in the secondary mainstream sector, but also among primary schools, special schools and pupil referral units. Second, we document a decreasing percentage of pupils who were classified as having SEN. While the decrease happened across all types of schools, it was particularly steep in Sponsored Academies. This evidence does not necessarily imply that the academisation of English schools has had a negative effect on the inclusion of pupils with SEN. However, the findings have significance to provide the basis for a more in-depth analysis of these trends and the causal effects of academisation involving individual and school level analyses. They can also inform national and local policy review of how pupils are identified as having SEN and in the context of international moves toward greater inclusive education.
Introduction
A dominant English school policy initiative over the last 30 years has been to raise academic standards through the introduction of more provision diversity and user choice, what has been called a market-oriented model of schooling (Adnett and Davies, 2005; Louis and van Velzen, 2012). Since the Education Reform Act 1988, schools in England became more autonomous from local authorities while they have been subject to a National Curriculum and its associated national assessment arrangements (Barker, 2008; Louis and van Velzen, 2012). More recently, the diversity of the school system has increased considerably with the establishment of Academies and Free schools (Machin and Vernoit, 2011; Walford, 2014).
Alongside these moves has been a lesser though nevertheless important trend to develop higher quality provision for pupils with special educational needs (SEN) and for more provision for them in ordinary rather than special schools, what has been called the inclusive education movement (Tomlinson, 2015). Since the early 1980s the proportion of all pupils with significant SEN in English special schools decreased to the early 2000s, reflecting these inclusive policy initiatives (Norwich, 2002). Since the 2000s the proportion going to special schools remained more or less unchanged (Rustemier and Vaughan, 2005). However, since 2006 this has started to increase, for the first time in 30 years (Black and Norwich, 2014; Ofsted, 2016).
The general aim of this paper is to document the recent trends in academisation and SEN provision in England. The analysis in this study uses publicly available school level data from the National Pupil Database (NPD) about pupils identified as SEN at the more significant level (Statements before 2014; Educational, Health, Care (EHC) Plans after) and at the less severe level (School Action and School Action plus before 2014: SEN support after). This study will be the first to document changes in the organization of all primary and secondary English schools, from maintained to Academies or Free Schools and the proportion of pupils with an identified SEN in these schools. In this analysis, we have used publicly available official data, but presented them in a new way to demonstrate the covariation between the academisation of English schools (and in particular, sponsored academisation) and the reduction in the proportion of children with SEN Support. In a separate study, we have conducted a more complex statistical analysis of the pupil-level data from the NPD to establish whether this covariation reflects the underlying causal effect of the academisation on educational inclusion. We will report these results in a separate paper, but we see the descriptive results presented in this paper as an important precursor of this further analysis. While the Department for Education in England do publish data on percentage of pupils with a statement or EHC plan attending various types of school (e.g., DfE, 2017c) they do not compare the rate of academisation with the rate of SEN, as we do in this paper.
Our primary research objective in this study is to document the overall trends in academisation and the inclusion of pupils with special educational needs, and any potential differences in aggregated characteristics that are present in a group of schools. We produce extensive descriptive statistics on the academisation of schools and the inclusion of pupils with SEN by region, local authority, phase of education and school type. The results from this descriptive approach provide a clear and comprehensive overview on the trends of academisation and educational inclusion. The findings have significance for national and local policy review in the context of international moves toward greater inclusive education UNESCO, 1994, 2014; United Nations, 2006.
Policy and Research Context
Choice and Diversity Initiatives
School education policy has assumed greater significance in the UK government's general social and economic policies in the last 30-40 years. In England the landmark legislation, the Education Reform Act 1988 (legislated by a Conservative Government), introduced an assessment-led National Curriculum with national testing of attainments as part of a push to raise attainment standards. This was introduced as part of a wider development of a broad public service policy move from state regulation to more user choice and provision diversity (Machin and Vignoles, 2005). This diversity of provision included more autonomy of public sector bodies, such as schools. In England schools became more autonomous from local authority control, and this was echoed in countries like the US and Australia (Keddie, 2017). Parents were encouraged to exercise more choice about their children's school placements. This market-oriented model of schooling was continued by the Labor Government (1997–2010). In its early years the Labor Government focused on function (raising standards, with policies such as school attainment targets) rather than on structures (school governance and whether schools were independent of local authorities or not) (Lupton and Obolenskaya, 2013). But, the Labor Government then responded to the issue of persistently “failing schools” in disadvantaged areas by requiring on a small scale the change of these schools into Sponsored Academies, which became independent of local authority governance (West and Bailey, 2013).
By the end of the Labor period of UK government in 2010 there was a small proportion of secondary schools which had changed into Sponsored Academies (6% of secondary schools in England were Academies in 2010, West, 2014). The Coalition Government (2010–2015) built on this type of non-local authority school to introduce Academies and Free Schools on a much larger scale.
These choice and diversity initiatives have extended to special educational needs policy and practice. Diversity of provision and parental choice were maintained alongside a commitment to social inclusion by New Labor when in government. The term “inclusive education” was written into Government education policy (Norwich, 2014). This was consistent with international policy trends toward greater inclusive education as expressed by the Salamanca Declaration (UNESCO, 1994). Labor also introduced disability discrimination legislation into the education sector through its Special Educational Needs and Disability Act (2001), meaning schools now had duties as regards students with disabilities alongside their responsibilities under the Code of Practice for Special Educational Needs (DfES, 2001). From 2010 the Coalition Government reviewed SEN and inclusion policy and introduced changes based on a move away from what was initially described as the previous “bias to inclusion” (DfE, 2011). The coalition government proposed policy to “strengthen parental choice by improving the range and diversity of schools from which parents can choose, making sure they are aware of the options available to them” (DfE, 2011, p. 5). This was achieved by legislative changes that established greater parental choice in placement for their children with SEN (DfE/DoH, 2014).
School Types
Academies are existing schools which were encouraged to convert to self-governing Academies (converter type of Academies), or were required because of poor performance to become an Academy under the control of a sponsor (sponsored type of Academies, the type originally set up by the Labor Government).
Free schools are new schools set up under the initiative of parents, voluntary organizations or religious groups, some of which may be special schools for specific groups of pupils with SEN / disabilities. All operate like Academies in having more autonomy than maintained schools in terms of their organization, curriculum and staffing, though they are not permitted to formally select pupils by attainment / abilities. However, all pupils with a Statement of SEN or EHC Plan have to be admitted to an Academy if the school is named in the Statement or Plan (DfE, 2014, 2017c).
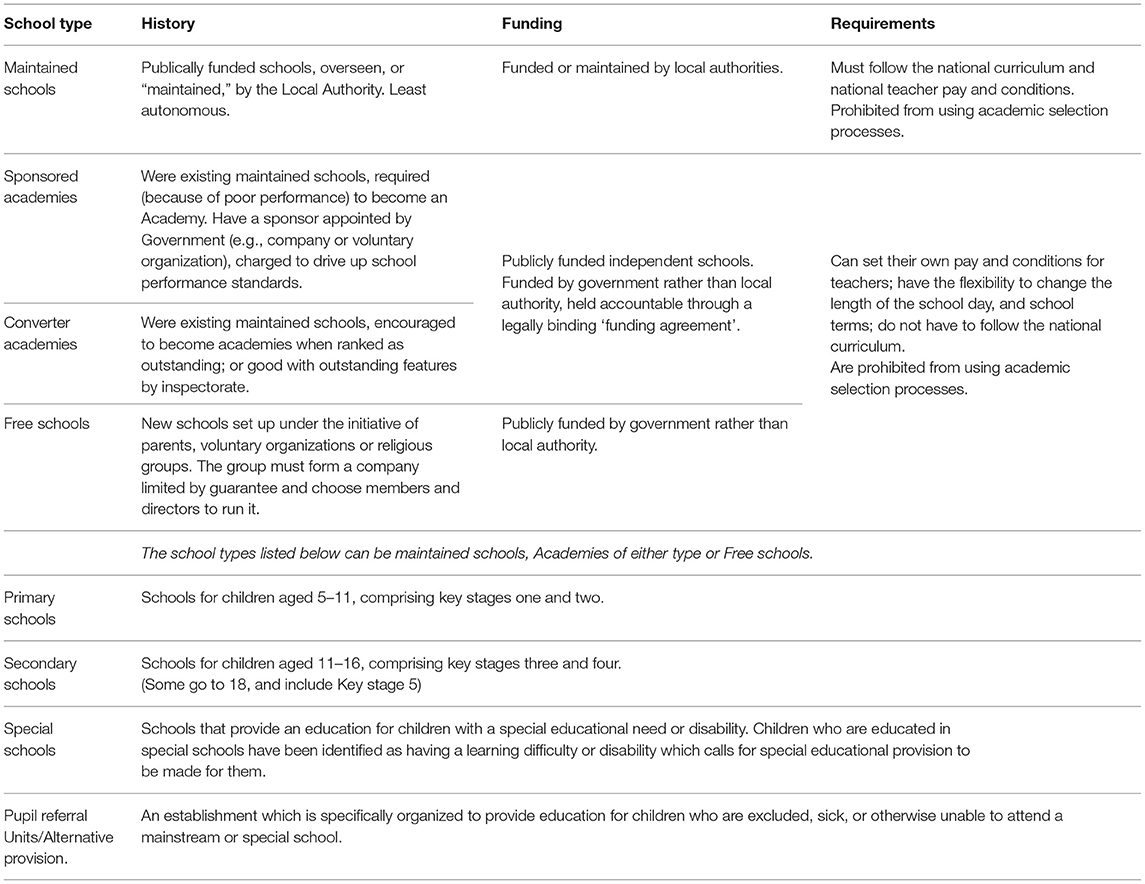
Pupil Referral Units (PRUs) were established by local authorities to provide education for children who are excluded, sick, or otherwise unable to attend a mainstream or special maintained school, but pupils did not require a Statement or EHC Plan to attend a PRU. Some PRUs have converted to Academy status and then are called Alternative Provision (AP) as part of an Academy chain or with a sponsor. The different school types we considered in our analysis are defined in Table 1.
SEN Type
The Children and Families Act (2014) defines pupils with special educational needs (SEN) as those pupils who have learning difficulties or disabilities which require additional or different provision from what is typically provided. This covers a wide range of difficulties in the areas of cognitive, language, motor, sensory, emotional behavioral to communication functioning. Since its introduction in 1981, the term “SEN” has been qualified as a characteristic that differs by degree. From 2001 to 2014, there were three levels of SEN: School Action; School Action Plus (both which were identified by school staff); and Statement, which involved a legally based record of provision following a statutory assessment process involving a multi-professional team and took into account parental views (DfES, 2001). By 2014 about 20% of pupils were identified as having SEN at these three levels. With the 2014 legislation, and subsequent new SEN Code of Practice (DfE/DoH, 2014), these three levels were reduced to two, with some pupils identified at School Action no longer identified as having SEN, while others with School Action and School Action Plus became identified as “SEN Support”. Statements were replaced by Education, Health and Care Plans (EHC Plans), though the broad assessment procedures and legal status of these Plans were not different from Statements of SEN. Following the introduction of the legislation the overall proportion of pupils identified as having SEN reduced to about 15% (DfE, 2015).
Recent Research
Recent developments in academisation reflect the most indicative move thusfar to implementing a parental choice/school diversity model, one which Walford (2014) describes as an attempt to stimulate the supply side of a quasi-market in schooling. It also reflects the discourse in global policy that asserts that pupils' academic performance will be positively affected by greater school autonomy, the quasi-market imperatives of choice/diversity, competition and public accountability (OECD, 2011; Keddie, 2017). This rapid rise in academies started in 2010, when Converter Academies and Free Schools were introduced in addition to Sponsored Academies and the organization of academies from that date into Multi-Academy Trusts (MATs). By 2017 45% of secondary schools were Converter Academies, 18% Sponsored Academies and 33% maintained schools. Academisation was at a lower rate in primary schools; 15, 6, and 78% of primary schools were Converter Academies, Sponsored Academies and maintained schools respectively (DfE, 2017a).
This was a policy that justified these systemic changes in terms of giving schools more freedoms, addressing disadvantages and spreading excellence (DfE, 2016). Though there have been few studies about change in governance, a recent one by Gibson (2016) identified the relationship between head teachers and sponsors as varying from laissez-faire to autocratic. He identified that in some Sponsored Academies the relationship was very constrained and even more so than in maintained schools, seemingly undermining the principle that Academies gave schools more autonomy from Local Authorities. Another approach has been to question critically the academisation principles for framing education as a commodity in a school market place (Heilbronn, 2016). Part of this argument is that the freedoms associated with academisation can come to threaten wider aims associated with inclusion and equity. Heilbronn argues that one of the freedoms of Academies is to control student intake, as academies have powers to decide their own admission policy. She uses DFE exclusion data to suggest that Academy schools are more likely to exclude students permanently (p. 313) and explains this in terms of these students requiring more costly support than other students which detracts from schools' examination performance results.
There has been some anecdotal evidence of Academies being more unwilling to offer places to pupils with significant SENs by deploying covert selection (Institute for Public Policy Research IPPR., 2014; Galton and MacBeath, 2015) in an in-depth study of a range of contemporary English schools reported the increased pressure on school leaders to avoid “reputational damage” (p.21) and maintain their competitive status by not taking in pupils who may harm their academic credibility through poor academic results. They also reported anecdotal evidence from head teachers that neighboring Academies seemed to be “cherry picking wealthier pupils” and “excluding the neediest” (p.49). The Academies Commission (Pearson/ RSA, 2013) also concluded that they did receive evidence of many Academies having a social inclusion commitment. However, as they recognized, this did not apply to all Academies, with “some academies willing to take a ‘low road' approach to school improvement by manipulating admissions rather than by exercising strong leadership” (p.7). This commission recommended that such practices be eradicated through school-to-school collaboration as the way to improve achievement for all.
Norwich and Black (2015) show that some authors argue that the development of a variety of school types reduces diversity in the student population within each school type and heralding the arrival of a two-tier system based on socio-economic boundaries (Taylor et al., 2005; Exley, 2009). Wilson (2011) compared 33 schools which became Academies after 2003 over an 11 year period with non-Academy schools between 1997 and 2007 (before the more recent acceleration of academisation). The results demonstrated that Academy conversion was associated with a change in pupil profiles. Academies where shown to accept students with higher attainment levels at the end of primary school than previously, relating this to reduced numbers of students at the lower end of the attainment distribution and fewer students from disadvantaged backgrounds. Wilson concluded that the Labor sponsored academy programme led to a rise in school stratification compared to what was before. She also raised questions about if the pursuit of academic excellence in the Coalition Academies and Free School programme would encourage such schools to adapt their admissions to an intake of more homogenous and advantaged pupils. Gorard (2016) examined the extent of between-school segregation in different school types, finding that the clustering of disadvantaged students in English schools varied depending on what indicator was of interest. The trend over time for segregation by student poverty was different from those for SEN or ethnicity.
Research has also shown that despite the adoption of inclusive educational principles and practices during the Labor period of Government (1997–2010), the percentage of pupils in special schools began to increase slightly from 2006. This trend continued into the Coalition period of Government 2010–2015 (Black and Norwich, 2014). This reversal of a 30 year decreasing trend in special school placement raised questions about whether this rising trend will continue and what has driven this change? Is it related to the academisation policy?
There have been no studies which have provided evidence directly relevant to these questions. For example, in a more recent study of the growth of Academies and Free schools since 2010, it was shown that there were different percentages of pupils with significant SEN (with Statements) between academies and maintained English secondary schools (Norwich and Black, 2015). Converter Academies (the most autonomous of the types) had the lowest percentage of pupils with Statements of SEN, the sponsored Academies (required to convert and governed by outside sponsor) had the highest percentage with Statements, while maintained schools (remaining as local authority schools) had percentages between these levels.
Charter schools in the USA that have a similar governance status to academies in England have been in operation for 18 years (Storey, 2018). These operate in a different educational policy context, particularly in reference to SEN, and we recognize the limitations to any comparison given the “complex significance of context, the ‘embeddedness' of aspects of educational approaches and provision in the locally prevailing cultural and other conditions” (Phillips and Ochs, 2003, p. 457). However, some of the reflections on these types of schools might be applicable to the English academisation context. US studies have focused more on the impact of this structural change on student achievement than on pupil admission. As Wolf (2011) notes, there have however been concerns in the USA that charter schools would attract the higher attaining pupils away from the traditional public schools, leaving those with academic and/or behavioral challenges in these public schools. There have also been concerns that charter schools might erect barriers to admission for pupils with SEN. US data does show a special education gap, e.g. district schools in New York had 4.8% more special education pupils overall than charter schools. But, as Winters (2015) argued this gap arises at kindergarten, when pupils classified at here as having a speech or language disorder are less likely than others to apply to charter schools. Winters also claims that the gap is not due to students with disabilities exiting charter schools more than district ones; rather students with disabilities are less likely than students without disabilities to enter charters in non-gateway grades. Additionally, it grows as pupils enrolled in district elementary schools are more likely to be classified as having a Specific Learning Disability than those enrolled in charter elementary schools.
The only English study of the impact of the structural reforms has been an in-depth case study of a church school became a voluntary aided school (Rayner, 2017), which was not the same as an Academy, but involved greater control of buildings, staff contracts and admissions in an area where many school were already Academies. Rayner illustrates how a school in a context of accountability pressures and market positioning attempts to control admissions (student input) as a way of improving examination results (outputs). As one senior teacher noted: “we are an inclusive school…but with very few LA schools left, I wouldn't want our school to become a dumping ground…” (p.31).
Aims, Research Questions, and Methods
This paper documents the recent trend to academisation in England and the proportion of pupils with SEN in types and phases of schooling. It has the following aims:
a) To document the changes in school composition in England from 2011 to 2017 by school type (Sponsored and Converter Academies vs. maintained schools) and school phase (primary vs. secondary).
b) To document the rate of academisation by Local Authority in this period, comparing Local Authority differences.
c) To look at the changes in the proportions of pupils with SEN at SEN Support and EHC Plan levels overall from 2011 to 2017.
d) To examine these changes by the type of school and phase.
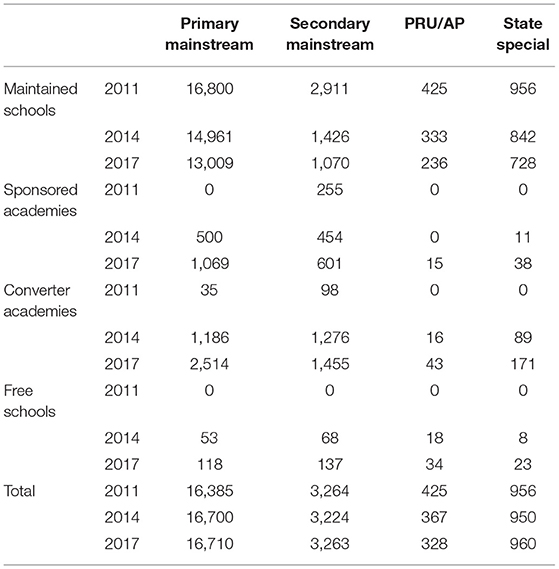
The dataset of this study was constructed from two sources. The UK government's statistics collection “Statistics: special educational needs (SEN)” (DfE, 2017a) lists data since 2010. For each year there is a cross-sectional data set that includes school-level characteristics of English schools, including their location (region and local authority), type, and the number of pupils with SEN (see, for example, DfE, 2017a). We linked these to construct a longitudinal file where schools are identified by their Unique Reference Numbers (URNs) and secondary geographical information. When a school becomes an Academy, the new entity gains a new URN. In order to reconstruct the full academisation history of English schools in our data we use the Open Academies data (DfE, 2018) to link the post-conversion Academy back to its predecessor(s). Using this longitudinal dataset of school-level characteristics on special educational needs and academisation, we were able to study the trends in academisation and educational inclusion of pupils with SEN in England from 2011 to 2017 (see Table 2).
The project is based on the secondary analysis of publically accessible data [UK government's statistics collection “Statistics: special educational needs (SEN),” (DfE, 2017a); the Open Academies data, (DfE, 2018)]. The study was approved by the Ethics committee of the College of Social Sciences and International Studies of the University of Exeter.
Results
a) Changes in school composition in England
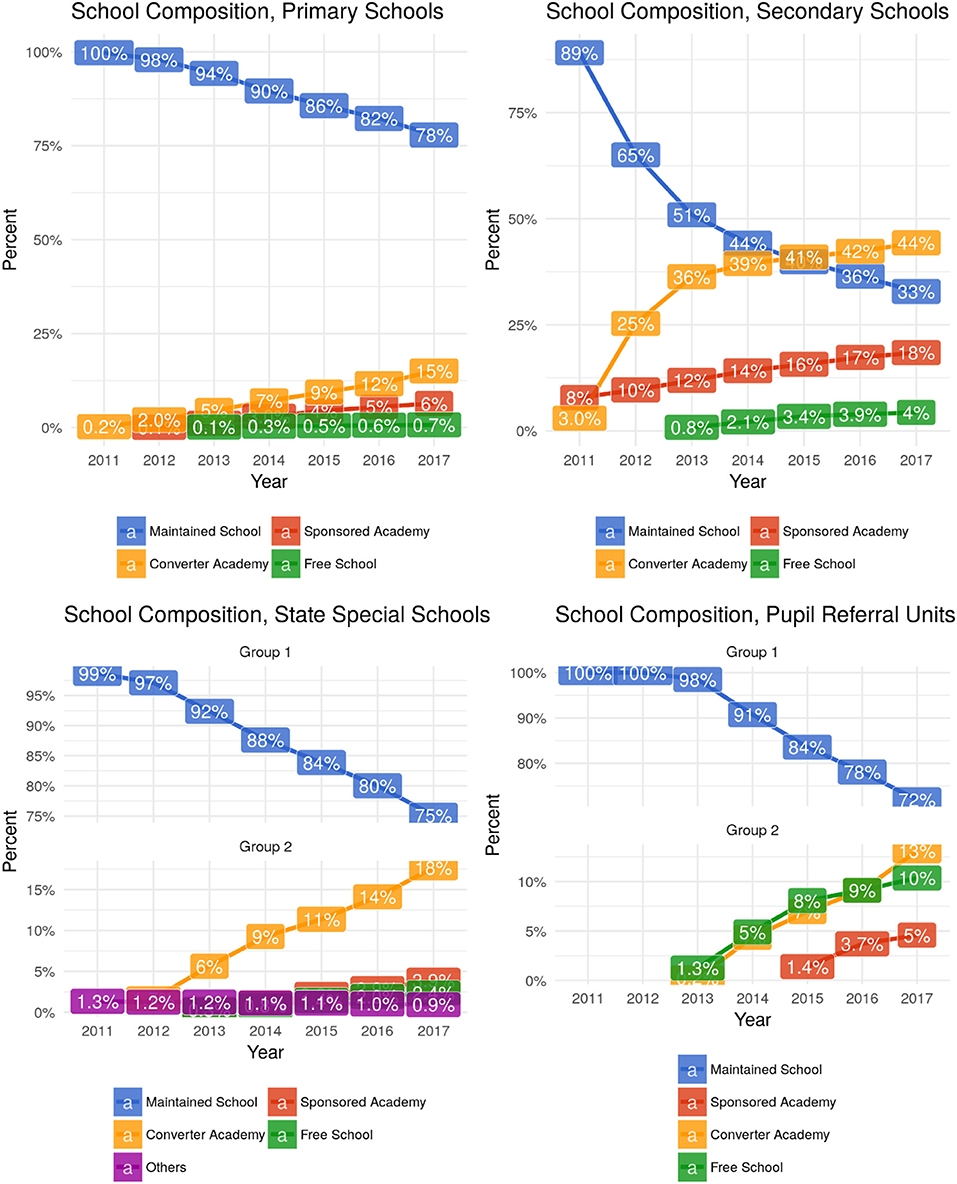
Our first aim is to document the changes in school composition in England. Figure 1 reports the composition of schools by type (maintained, Sponsored or Converter Academies, Free Schools and others), separately for primary schools, secondary schools, special schools and pupils referral units in England in 2011–2017.
Figure 1 reflects the rate of academisation in England. The top two panels in Figure 1 show that academisation was particularly rapid for secondary rather than primary schools. In 2017, 78% of primary schools still remained as maintained schools, with 15% being Converter Academies and 6% Sponsored Academies. In contrast to this, in 2017 only 33% of secondary schools were maintained by Local Authorities, while 44% were Converter Academies and 18% Sponsored Academies. The rate of the academisation of the secondary schools was particularly high between 2011 and 2013.
The lower two panels in Figure 1 show a similar pattern of change for special schools and PRUs as for primary schools. Most special schools and PRUs still remain in the maintained sector, although there is a growing number of Converter Academies there as well. There is a notable percentage rise in the number of Alternative Provision which are Free Schools (from 1.3% to 10% over the period).
b) Rates of academisation by Local Authority
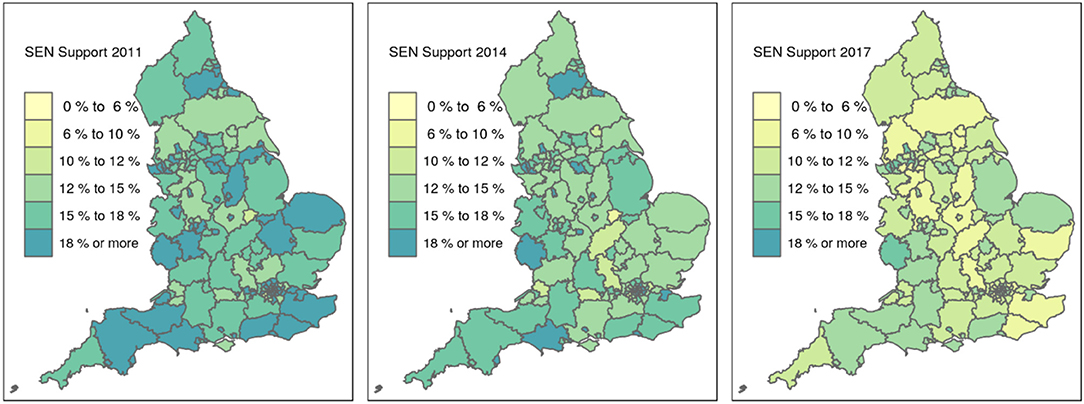
Next, we examine regional differences in academisation. Figures 2, 3 show the maps for the proportions of Academies by Local Authority for primary and secondary schools for 2011, 2014, and 2017.
As the Local Authority areas become more academised they are represented in darker colors. The proportion of academies among primary schools remains relatively low, but it is higher in some Local Authorities (the 5 most academised local authorities in 2017 are Poole, North East Lincolnshire, Bromley, Bournemouth and Darlington, see Table A2). For secondary schools, the increase in academies is much higher overall with most of the increase being between 2011 and 2013.
Sometimes the proportions of academies can be very different within metropolitan conurbations. Figure 4 shows the percentage of academies (both primary and secondary) by Local Authority in London, the West Midlands and Manchester-Liverpool conurbations in 2017. In London the proportion of academies is high in the South-East (Bromley, Bexley, Croydon), with higher proportions in the outer boroughs than the central ones. The percentage of academies is higher in Wolverhampton than in Dudley and in Manchester compared to Liverpool. (Local Authority codes and names are provided in the Table A1).
c) Changes in the proportions of pupils with SEN
We next explore the changes in the provisions for pupils with special educational needs in the same period from 2011 to 2017. This analysis is done separately for pupils at the SEN Support level and then those with EHC Plan level. As explained above, from 2014 the SEN at School Action and School Action plus (SA and SAP) became SEN Support and there was a general decrease in the number of pupils identified at this level. From this year SEN at the Statement level became the EHC Plan level, with little change in the overall rate of identification. For these analyses, we will refer to School Action/SEN Support to refer to the less significant level of SEN over this period and to Statement/EHC Plan for the more significant level of SEN.
Figure 5 shows the change in the percentage of pupils with (1) School Action/SEN support and (2) Statement/EHC Plan in 2011 to 2017. The percentage of pupils with the EHC Plans remained stable and has not changed. In contrast to this, the proportion of children with SEN support has been steadily declining, in particular between 2014 and 2015. As Figure 6 demonstrates, this decline has been across the country, but at differing rates.
d) Academisation and proportions of pupils with SEN
Finally, we explore the change in proportions of pupils with SEN by the type of school. The purpose of this analysis is to explore whether the pattern of decrease in the proportion of children with SEN at SEN Support and EHC Plan levels was different in the academies compared to maintained schools.
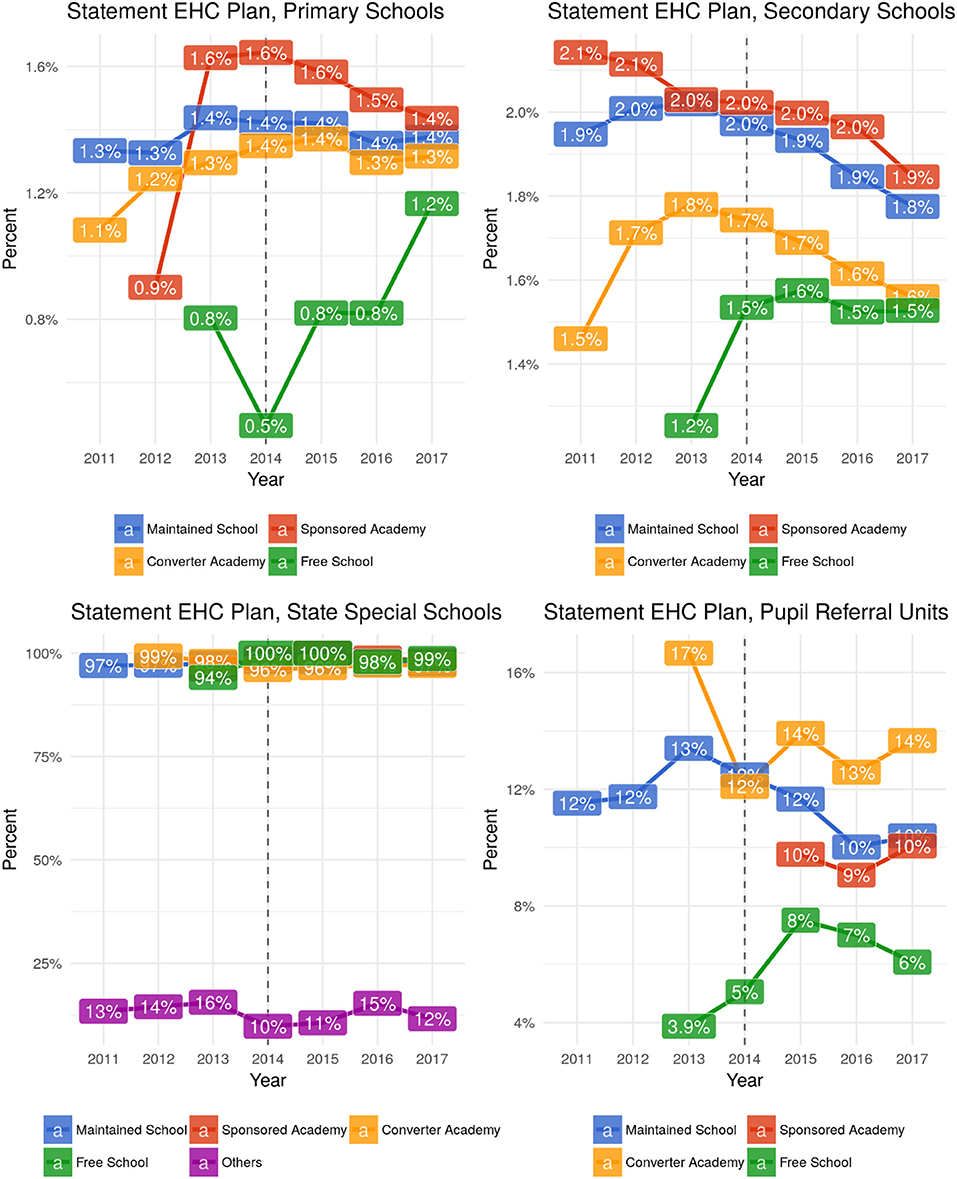
First, we look at the changes in the proportions of pupils with Statements/EHC Plans. Figure 7 reports these results. The percentage of pupils with Statement/EHC Plan in primary schools is more similar across all types of schools than for the secondary schools. For both phases, the proportion with Statements/EHC Plans is higher in Sponsored Academies than other school types. However, for primary Sponsored Academies there is a low percentage in 2012 which rises to 1.6% in 2013 and then declines slightly in the following years. The percentages of Statements/ EHC Plans for maintained primary and secondary schools is slightly lower than for Sponsored Academies, and is fairly stable over this period. The percentage for Converter Academies is lower in secondary than primary schools. But in primary schools the rise is in the first years and then stabilizes in the last few years. By contrast in the secondary Converter Academies the percentage rises slightly and then falls later in the period. The percentage in Free Schools are the lowest of all school types, with more variability in primary than secondary Free Schools; secondary Free Schools stabilize at a level similar to secondary Converter Academies.
Generally, in mainstream primary and secondary schools of all types the percentage of pupils with EHC plan is between 1 and 2%. This figure is different in special schools where as would be expected virtually every pupil has a Statement/EHC plan (irrespective of school type). In pupil referral units the percentage of pupils with EHC plan is more variable over time and between 10 and 15%.
Overall, we do not observe significant differences in how the proportion of pupils with Statements/EHC plans has been changing in 2011–2017 between maintained schools and academies.
Next, we present these data for pupils with School Action/SEN support (see Figure 8). Here the picture is clearer and different to pupils identified as having Statements EHC Plans. The percentage of children with School Action/SEN support has been falling across all types of schools, but the change was particularly steep for the Sponsored Academies.
In primary schools, the percentage of pupils at the School Action level in maintained schools in 2011 was 18%, compared to 12% of children who had SEN support in 2017. For converter academies and Free schools, the decrease was the same (6 percentage points). But, in Sponsored Academies the proportion of pupils at School Action/SEN Support was the highest of all school types (in 2012 at 24%), which decreased to 14% in 2017 at SEN Support.
For secondary schools, the pattern is the same. In maintained schools, the change in the percentage of pupils with SEN support between 2011 and 2017 was from 19% to 11%. For Converter Academies it was from 15 to 9%. For Free Schools and Sponsored Academies, however, the decrease was larger, from 22% to 11% and from 26% to 13% respectively.
As would be expected the decrease was greater at the 2014–2015 period for both phase and across all school types with the removal of the School Action category of SEN and only some of these pupils were categorized as SEN Support with the legislative change in SEN levels in 2014. However, while the decrease in 2014–2015 for primary school was more for Sponsored Academies than the other school types (5pp v. 4, 4 and 3pp), the decrease for secondary Sponsored Academies was much greater than for the other school types (4pp v. 1, 2 and 2 pp)
Overall, the data show that the decrease in the proportion of children with SEN Support was more pronounced and primary and secondary Sponsored Academies compared to other school types.
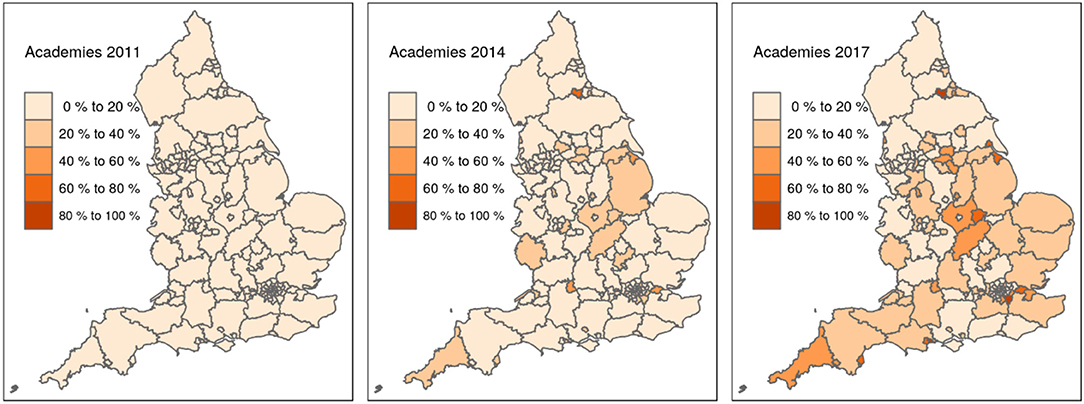
Figure 2. Percentage of academies among English primary schools by local authority in 2011, 2014, and 2017.
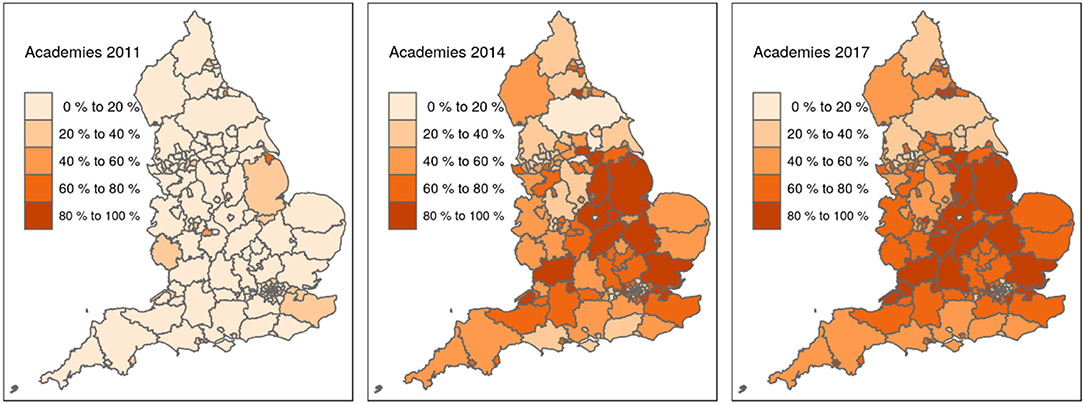
Figure 3. Percentage of academies among English secondary schools by local authority in 2011, 2014, and 2017.
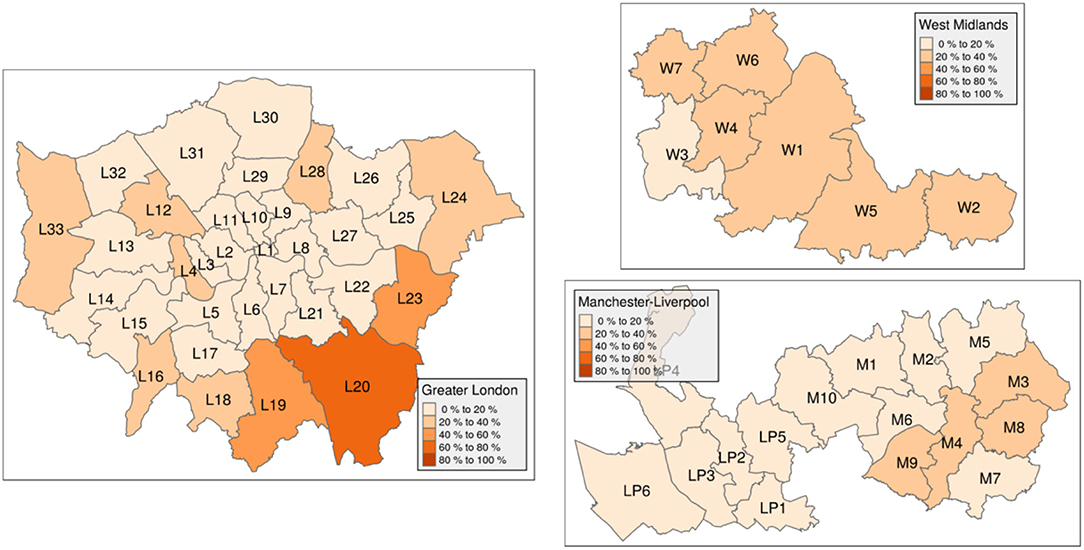
Figure 4. Percentage of academies in 2017 in London, West Midlands and Manchester-Liverpool conurbations (see codes for local authorities in Table A1).
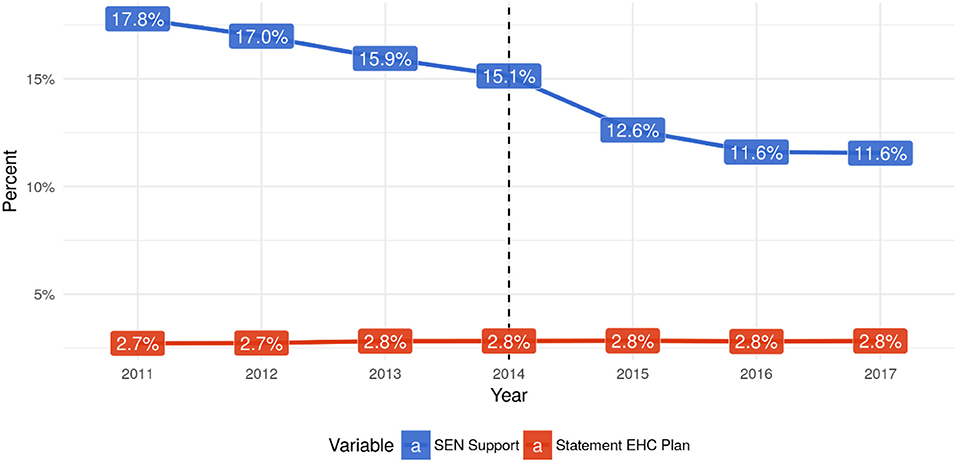
Figure 5. The proportion of school children with SEN support and EHCP/Statement in England, 2011–2017.
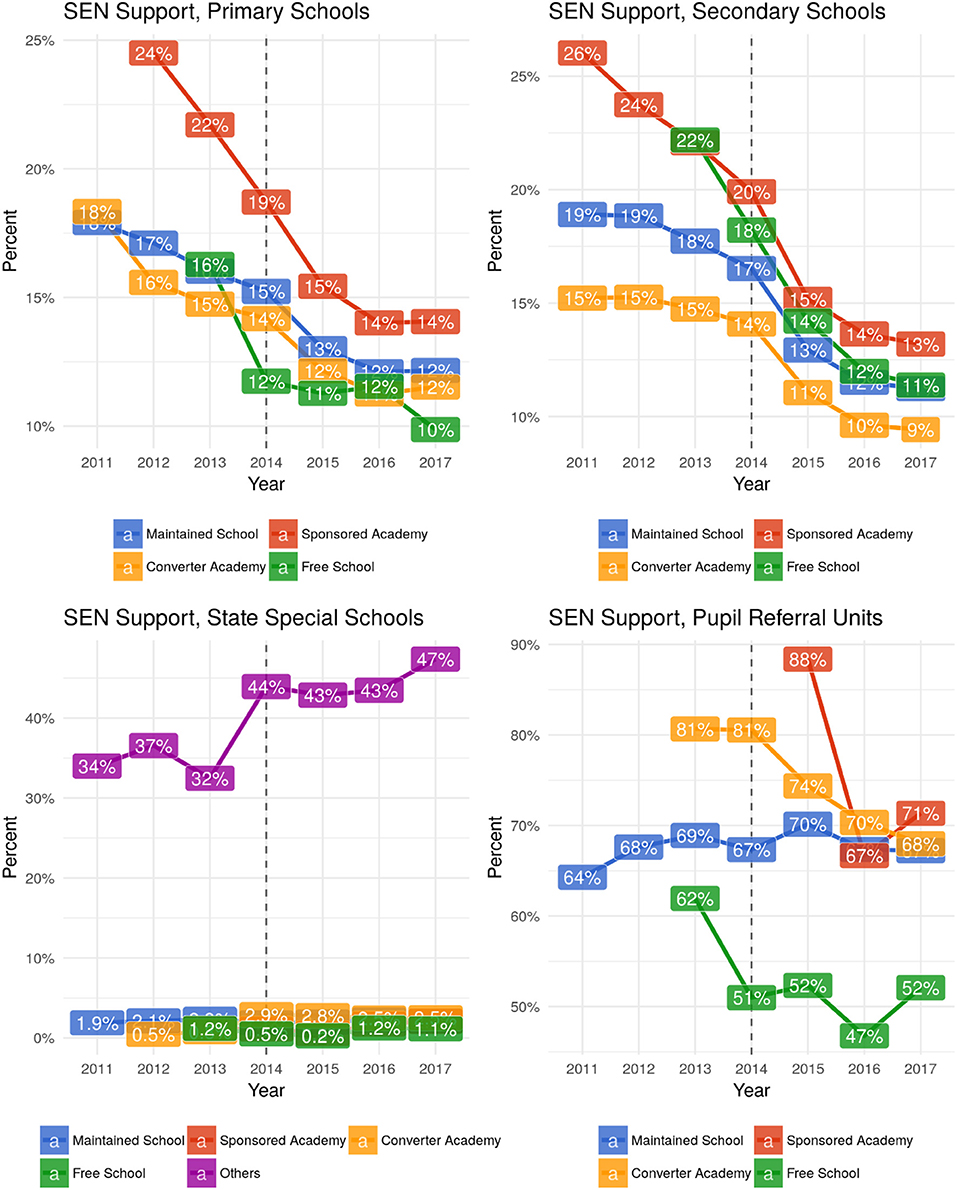
Figure 8. The percentage of pupils with School Action/SEN support by type of school, England, 2011–2017.
Discussion
The English education landscape has experienced some radical developments in the last 15 years. One of the most notable changes in terms of school structures has been the establishment of academies (Eyles et al., 2018), another, the increase in the proportion of pupils attending special schools (Black and Norwich, 2014; Black, 2018). In this paper we have analyzed longitudinal data for all English schools over the period 2011–2017 based on combining publicly available annual school data to address questions regarding these changes. Our findings contribute to a small but growing literature on the nature and effects of academisation (cf. Machin and Vernoit, 2011; Wilson, 2011; Gibson, 2016; Gorard, 2016; Heilbronn, 2016.
The analysis showed academisation was particularly rapid for secondary rather than primary schools. The speed of the academisation of the secondary schools was also higher between 2011 and 2013 just after the system and funding was established. The local authority level analysis of academisation showed a lower level and rate of change over time for primary schools compared to secondary schools. Simkins et al. (2018) suggest this is due to differences in distinctive educational and institutional practices. These differences may make academisation, and the kind of autonomy it offers, less attractive to many primary schools, leading them to have a stronger identification with, and commitment to, their LA than is usual with secondary schools (Keddie, 2017). The pattern may also relate to the smaller size of primary than secondary schools. Secondary schools enable economies of scale that primaries cannot achieve (Falch et al., 2008), though with Multi-academy trusts primary schools can join these trusts to form economies of scale (Rayner et al., 2018).
Another finding has been a similar pattern of academisation of special schools and PRUs as for primary schools. Most special schools and PRUs still remain in the maintained sector, although there is a growing number of Converter Academies there as well. There has also been a notable percentage rise in the number of Alternative Provision which are Free Schools. The academisation of these school types have not received the same research or national and education media attention as the pace of academisation in secondary schools.
Rates of academisation vary between local authorities. Patterns of academisation differ between large LAs and small sub-areas. Academisation within metropolitan conurbations for both primary and secondary schools showed higher proportions in South-East London and some other outer London boroughs than the central ones and higher levels in Manchester than Liverpool authorities. Simkins (2015), when comparing academisation in three LAs, suggested that a major explanation for variation in rates of academisation could be related to the type of governance of schools Local Authority staff employ. He distinguished between a LA that was traditionally low-interventionist and had attempted to minimize the activity of the local state by giving as much autonomy as possible to schools; and one that had been a relatively interventionist administration which had a strong emphasis on nurturing groups of schools. A second explanation Simkins suggested was related to school performance in the LAs: two of the LAs he studied had a higher proportion of “outstanding” schools than did the third, perhaps providing greater opportunities for early conversion on the Converter academy pathway.
The percentage of pupils with Statement/EHC Plan in primary schools is more similar across all types of schools than for the secondary schools. For both phases, the proportion with Statements/EHC Plans was also higher in Sponsored Academies than the other school types. This may reflect that Sponsored Academies were schools which were not performing well in Inspection terms and thus are likely to have had more disadvantaged student intakes (Bolton, 2014; Norwich and Black, 2015). Another aspect to consider is that any reduction of LA services, particularly in relation to Special Educational Needs support had left such schools more vulnerable to slipping in performance than they would otherwise have been with this support from the LA (Keddie, 2017). As we stated in the review of the literature there has been little exploration of the effects of academisation on pupils with SEN. Webster and Blatchford (2017) tentatively suggest that “Implementing the Code of Practice [for SEN] at the school-level is frustrated by practices relating to higher profile, more pressing policy trends [of choice and diversity/the standards agenda]” (p. 19).
Though this study has used data for all state-funded schools in England, the analysis explores covariance and does not necessarily imply causality. This means that the findings in relation to School Action/SEN Support level of SEN does not necessarily mean that Sponsored Academies were particularly unwilling to admit these pupils, keen on reclassifying pupils with SEN as not having SEN or moving them to other schools. There can be several explanations of the trends we observed:
1. Changing school composition. The group of Sponsored Academies in 2011–2012 is not the same as in 2016–2017. Perhaps the academisation in this group of schools started with schools with a particularly high proportions of pupils with SEN support (disadvantaged schools), and later continued with schools with a lower proportion of pupils with SEN support. As a result, we may observe a decreasing SEN Support trend due to changing school composition rather than an effect of the type of school on the proportion of SEN pupils in these schools.
2. Re-classification of pupils with SEN Support to not identified as having SEN. The statistical evidence in this paper is consistent with Sponsored Academies being particularly keen on re-classifying children with SEN support and removing their SEN Support status. This might be interpreted as reflecting Sponsored academies wishing to report lower proportions of pupils with SEN as part of initiatives to improve the school's reputation and attract higher attaining pupils to their school.
3. Non-admission and exclusion. Sponsored Academies could use various formal and informal mechanisms to not admit, exclude or move on pupils at SEN Support level of SEN.
These trends also need to be set within the context of the national picture as discussed above of an increasing proportion of all English pupils being placed in special schools over the period of this study (Black and Norwich, 2014). More recent analysis based on publicly accessible data (from DfE, 2017b; ONS, 2018) over the period of this study from 2011 to 2017 shows a continued rising percentage in special schools (0.75 to 0.88%) (Black, 2018). Whether there is a link between this national level special school trend and the school level trends we have examined in this paper is a matter that requires further study and analysis.
The findings in this paper raise a series of important questions: To what extent are ordinary schools becoming less willing to accommodate pupils with significant SEN because of external pressures to raise academic standards and the resulting internal school changes, the academisation of ordinary schools? To what extent were parents of pupils with significant SEN preferring and opting more for separate specialized provision because of their own choice or did they have no local ordinary school alternatives to special schools? To what extent was the increasing survival of infants with complex disabilities going to special schools?
We acknowledge the kind of evidence which we have presented and discussed does not provide a comprehensive picture of what is going on. As Simkins (2015, p. 5) argues “knowing the proportions of academies in each LA says little about the diversity of forms of leadership and governance that underpin those surface structures. Nevertheless, basic data on the schooling landscape may still be instructive: mapping emerging surface patterns is a first step in understanding how the local landscape is being reconfigured.” The results from this descriptive approach provide a clear and comprehensive overview on the trends of academisation and educational inclusion. However, the kind of analysis did not make it possible to tease out whether these SEN percentage differences reflected prior school differences in how schools came to be one or other type of Academy or the effects of becoming an Academy and becoming a specific type of Academy. Thus, it is clear that further research is needed using more advanced statistical methods and data at pupil level also to distinguish between these three different explanations. An investigation on the causal impact of academisation of schools on the inclusion of pupils with SEN and its underlying mechanisms, using multi-cohort pupil level data, is the focus of a separate forthcoming study. Nevertheless, the descriptive results of this study provide a general guideline for building a research framework using pupil and school level data.
Author Contributions
ABl and BN developed the introduction, review and discussion. YL and ABe wrote the methodology and presented the results. YL, ABe, and ABl carried out the analysis.
Funding
This work was supported by the Economic and Social Research Council [grant number ES/P001009/1].
Conflict of Interest Statement
The authors declare that the research was conducted in the absence of any commercial or financial relationships that could be construed as a potential conflict of interest.
Supplementary Material
The Supplementary Material for this article can be found online at: https://www.frontiersin.org/articles/10.3389/feduc.2019.00003/full#supplementary-material
References
Adnett, N., and Davies, P. (2005). Competition between or within schools? re-assessing school choice. Edu. Econom. 13, 109–121. doi: 10.1080/0964529042000325234
Barker, B. (2008). School reform policy in England since 1988: relentless pursuit of the unattainable. J. Edu. Policy 23, 669–683. doi: 10.1080/02680930802212887
Black, A. (2018). “Summary of recent trends research – rising special school placement, an academisation effect?” in Changes in SEN/Disability Provision, Pressures on Ordinary Schools and Parental Choice: A Review of Inclusive Education and Its Prospects. SEN Policy Research Forum Policy Paper. Available online at: http://blogs.exeter.ac.uk/sen-policyforum/files/2018/05/Prov.-change-policy-paper-May-18.pdf (Accessed May 29, 2018).
Black, A., and Norwich, B. (2014). Contrasting Responses to Diversity: School Placement Trends 2007–2013for All Local Authorities in England. Bristol: CSIE.
Bolton, P. (2014). Converter Academy Statistics. Briefing paper Number 6233. London: House of Commons.
DfE (2011). Support and Aspiration: A New Approach to Special Educational Needs and Disability–A Consultation. London: The Stationery Office.
DfE (2014). School Admissions Code: Statutory Guidance for Admission Authorities, Governing Bodies, Local Authorities, Schools Adjudicators and Admission Appeals Panels. London: DFE.
DfE (2016). Press Release: Turbocharged Academies Programme Gives Better Education for 350,000 Children. Available online at: https://www.gov.uk/government/news/turbocharged-academies-programme-gives-better-education-for-350000-children
DfE (2017a). Statistics: Special Educational Needs (SEN). Available online at: https://www.gov.uk/government/collections/statistics-special-educational-needs-sen (Accessed April 23, 2018).
DfE (2017b). Statistics: School and Pupil Numbers - Schools, Pupils and Their Characteristics. Available online at: https://www.gov.uk/government/collections/statistics-school-and-pupil-numbers (Accessed April 23, 2018).
DfE (2017c). Special Educational Needs in England: January 2017 SFR 37/2017 [Online]. Available online at: https://assets.publishing.service.gov.uk/government/uploads/system/uploads/attachment_data/file/633031/SFR37_2017_Main_Text.pdf (Accessed Nov 1, 2018).
DfE (2018). Open Academies and Academy Projects in Development. Available online at: https://www.gov.uk/government/publications/open-academies-and-academy-projects-in-development (Accessed April 23, 2018).
DfE/DoH (2014). Special Educational Needs and Disability Code Of Practice: 0 To 25 Years:Statutory Guidance for Organisations Who Work With and Support Children and Young People With Special Educational Needs and Disabilities. London: DFE.
Exley, S. (2009). Exploring pupil segregation between specialist and non-specialist schools. Oxford Rev. Edu. 35, 451–470. doi: 10.1080/03054980902989948
Eyles, A., Machin, S., and Silva, O. (2018). Academies 2–the new batch: the changing nature of academy schools in england. Fiscal Stud. 39, 121–158. doi: 10.1111/j.1475-5890.2017.12146
Falch, T., Rønning, M., and Strøm, B. (2008). “A cost model of schools: School size, school structure and student composition,” in. Governance and performance of education systems, eds. N. Soguel, and P. Jaccard (Dordrecht: Springer), 247–265.
Galton, M., and MacBeath, J. (2015). Inclusion: Statements of intent A Report to the National Union of Teachers on the Current State of Special Educational Needs and Disability Provision. (Cambridge: NUT/Cambridge University).
Gibson, M.T. (2016). Sponsored academy school principals in england: autonomous leaders or sponsor conduits? Int. Stud. Edu. Administ. 44, 39–54.
Gorard, S. (2016). The complex determinants of school intake characteristics and segregation, England 1989 to 2014. Camb. J. Edu. 46, 131–146. doi: 10.1080/0305764X.2015.1045446
Heilbronn, R. (2016). Freedom and perils: academy schools in England. J. Philos. Edu. 50, 307–318. doi: 10.1111/1467-9752.12188
Institute for Public Policy Research IPPR. (2014). Whole System Reform: England's Schools and the Middle Tier. London: IPPR.
Keddie, A. (2017). Context matters: primary schools and academies reform in England. J. Edu. Policy 34, 6–21. doi: 10.1080/02680939.2017.1402959
Louis, K., and van Velzen, B. (2012). “Political cultures in England and the Netherlands,” in Educational Policy in an International Context: Political Culture and Its Effects, eds K. Louis, and B. van Velzen (New York, NY: Palgrave MacMillan), 139–154.
Lupton, R., and Obolenskaya, P. (2013). Labour's Record on Education: Policy, Spending and Outcomes 1997–2010. London: CASE Working Paper; LSE.
Machin, S., and Vernoit, J. (2011). Changing School Autonomy: Academy Schools and Their Introduction to England's Education, Working Paper No. 123. London Centre for the Economics of Education. Available online at: https://www.econstor.eu/bitstream/10419/114147/1/dp9276.pdf (Accessed April 24, 2018).
Machin, S., and Vignoles, A. (2005). Education Policy in the UK. London: Centre for the Economics of Education.
Norwich, B. (2014). Changing policy and legislation and its effects on inclusive and special education: a perspective from England. Br. J. Spe. Edu. 41, 403–425. doi: 10.1111/1467-8578.12079
Norwich, B., and Black, A. (2015). The placement of secondary school students with statements of special educational needs in the more diversified system of english secondary schooling. Br. J. Special Edu. 42, 128–151. doi: 10.1111/1467-8578.12097
OECD (2011). School Autonomy and Accountability: Are They Related to Student Performance?, PISA in Focus, No. 9. Paris: OECDPublishing. doi: 10.1787/5k9h362kcx9w-en
ONS (2018). Population Estimates for UK, England and Wales, Scotland and Northern Ireland. Available online at: https://www.ons.gov.uk/peoplepopulationandcommunity/populationandmigration/populationestimates/datasets/populationestimatesforukenglandandwalesscotlandandnorthernireland (Accessed April 24, 2018).
Pearson/ RSA (2013). Unleashing Greatness – Getting the Best From an Academised System. The Report of the Academies Commission. London: Pearson/RSA.
Phillips, D., and Ochs, K. (2003). Processes of policy borrowing in education: some explanatory and analytical devices. Compar. Edu. 39, 451–461. doi: 10.1080/0305006032000162020
Rayner, S. M. (2017). Admissions policies and risks to equity and educational inclusion in the context of school reform in England. Manage. Educ. 31, 27–32. doi: 10.1177/0892020616687699
Rayner, S. M., Courtney, S. J., and Gunter, H. M. (2018). Theorising systemic change: learning from the academisation project in England. J. Edu. Policy 33, 143–162. doi: 10.1080/02680939.2017.1327084
Rustemier, S., and Vaughan, M. (2005). Segregation Trends–LEAs in England 2002–2004. Bristol: Centre for Studies in Inclusive Education.
Simkins, T. (2015). School restructuring in England: new school configurations and new challenges. Manage. Edu. 29, 4–8. doi: 10.1177/0892020614559235
Simkins, T., Coldron, J., Crawford, M., and Maxwell, B. (2018). Emerging schooling landscapes in England: how primary system leaders are responding to new school groupings. Edu. Manage. Administ. Leader. doi: 10.1177/1741143217751079
Storey, V. A. (2018). A comparative analysis of the education policy shift to school type diversification and corporatization in england and the united states of america: implications for educational leader preparation programs. Int. J. Edu. Leader. Prepar. 13, 1–23.
Taylor, C., Fitz, J., and Gorard, S. (2005). Diversity, specialisation and equity in education. Oxford Rev. Edu. 31, 47–69. doi: 10.1080/0305498042000337183
Tomlinson, S. (2015). Is a sociology of special and inclusive education possible? Edu. Rev. 67, 273–281. doi: 10.1080/00131911.2015.1021764
UNESCO (1994). The Salamanca Statement and Framework for Action on Special Needs Education. Paris: UNESCO.
United Nations (2006). Convention on the Rights of Persons with Disabilities. Available online at: http://www.un.org/disabilities/convention/convention.shtml (Accessed May 5, 2018).
Walford, G. (2014). From city technology college to free schools: sponsoring new schools in England. Res. Papers Edu. 29, 315–329. doi: 10.1080/02671522.2014.885731
Webster, R., and Blatchford, P. (2017). The Special Educational Needs in Secondary Education (SENSE). Study–Final Report. Available online at http://www.nuffieldfoundation.org/sites/default/files/files/SENSE%20FINAL%20REPORT.pdf (Accessed Nov 13, 2018).
West, A. (2014). Academies in England and independent schools (friståendeskolor). in Sweden: policy, privatisation, access and segregation. Res. Papers Edu. 29, 330–350. doi: 10.1080/02671522.2014.885732
West, A., and Bailey, E. (2013). The development of the academies programme: “privatising” school-based education in England 1986–2013. Br. J. Edu. Stud. 61, 137–159. doi: 10.1080/00071005.2013.789480
Wilson, J. (2011). Are England's Academies More Inclusive or More Exclusive? The Impact of Institutional Change on The Student Profile of Schools. London: Centre for the Economics of Education, London School of Economics.
Keywords: special educational needs, academisation, school-level trends, inclusion, academies
Citation: Black A, Bessudnov A, Liu Y and Norwich B (2019) Academisation of Schools in England and Placements of Pupils With Special Educational Needs: An Analysis of Trends, 2011–2017. Front. Educ. 4:3. doi: 10.3389/feduc.2019.00003
Received: 05 October 2018; Accepted: 15 January 2019;
Published: 04 February 2019.
Edited by:
Mats Granlund, Jönköping University, SwedenReviewed by:
Lena Almqvist, Mälardalen University College, SwedenLani Florian, University of Edinburgh, United Kingdom
Copyright © 2019 Black, Bessudnov, Liu and Norwich. This is an open-access article distributed under the terms of the Creative Commons Attribution License (CC BY). The use, distribution or reproduction in other forums is permitted, provided the original author(s) and the copyright owner(s) are credited and that the original publication in this journal is cited, in accordance with accepted academic practice. No use, distribution or reproduction is permitted which does not comply with these terms.
*Correspondence: Alison Black, YS5lLmJsYWNrQGV4ZXRlci5hYy51aw==
 Alison Black
 Alexey Bessudnov
 Yi Liu
 Brahm Norwich