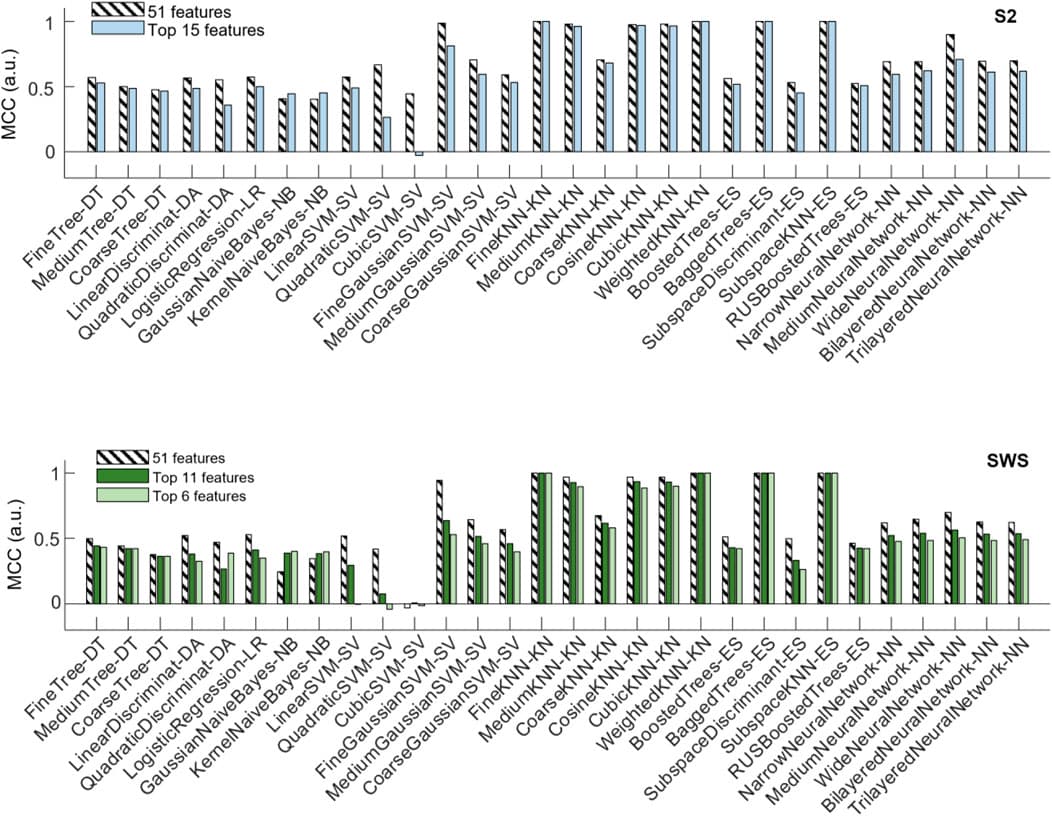
Sleep slow oscillations (SOs, 0.5–1.5 Hz) are thought to organize activity across cortical and subcortical structures, leading to selective synaptic changes that mediate consolidation of recent memories. Currently, the specific mechanism that allows for this selectively coherent activation across brain regions is not understood. Our previous research has shown that SOs can be classified on the scalp as Global, Local or Frontal, where Global SOs are found in most electrodes within a short time delay and gate long-range information flow during NREM sleep. The functional significance of space-time profiles of SOs hinges on testing if these differential SOs scalp profiles are mirrored by differential depth structure of SOs in the brain. In this study, we built an analytical framework to allow for the characterization of SO depth profiles in space-time across cortical and sub-cortical regions. To test if the two SO types could be differentiated in their cortical-subcortical activity, we trained 30 machine learning classification algorithms to distinguish Global and non-Global SOs within each individual, and repeated this analysis for light (Stage 2, S2) and deep (slow wave sleep, SWS) NREM stages separately. Multiple algorithms reached high performance across all participants, in particular algorithms based on k-nearest neighbors classification principles. Univariate feature ranking and selection showed that the most differentiating features for Global vs. non-Global SOs appeared around the trough of the SO, and in regions including cortex, thalamus, caudate nucleus, and brainstem. Results also indicated that differentiation during S2 required an extended network of current from cortical-subcortical regions, including all regions found in SWS and other basal ganglia regions, and amygdala and hippocampus, suggesting a potential functional differentiation in the role of Global SOs in S2 vs. SWS. We interpret our results as supporting the potential functional difference of Global and non-Global SOs in sleep dynamics.
During normal childhood development, functional brain networks evolve over time in parallel with changes in neuronal oscillations. Previous studies have demonstrated differences in network topology with age, particularly in neonates and in cohorts spanning from birth to early adulthood. Here, we evaluate the developmental changes in EEG functional connectivity with a specific focus on the first 2 years of life. Functional connectivity networks (FCNs) were calculated from the EEGs of 240 healthy infants aged 0–2 years during wakefulness and sleep using a cross-correlation-based measure and the weighted phase lag index. Topological features were assessed via network strength, global clustering coefficient, characteristic path length, and small world measures. We found that cross-correlation FCNs maintained a consistent small-world structure, and the connection strengths increased after the first 3 months of infancy. The strongest connections in these networks were consistently located in the frontal and occipital regions across age groups. In the delta and theta bands, weighted phase lag index networks decreased in strength after the first 3 months in both wakefulness and sleep, and a similar result was found in the alpha and beta bands during wakefulness. However, in the alpha band during sleep, FCNs exhibited a significant increase in strength with age, particularly in the 21–24 months age group. During this period, a majority of the strongest connections in the networks were located in frontocentral regions, and a qualitatively similar distribution was seen in the beta band during sleep for subjects older than 3 months. Graph theory analysis suggested a small world structure for weighted phase lag index networks, but to a lesser degree than those calculated using cross-correlation. In general, graph theory metrics showed little change over time, with no significant differences between age groups for the clustering coefficient (wakefulness and sleep), characteristics path length (sleep), and small world measure (sleep). These results suggest that infant FCNs evolve during the first 2 years with more significant changes to network strength than features of the network structure. This study quantifies normal brain networks during infant development and can serve as a baseline for future investigations in health and neurological disease.