
95% of researchers rate our articles as excellent or good
Learn more about the work of our research integrity team to safeguard the quality of each article we publish.
Find out more
ORIGINAL RESEARCH article
Front. Water, 10 April 2025
Sec. Water and Climate
Volume 7 - 2025 | https://doi.org/10.3389/frwa.2025.1569267
This article is part of the Research TopicOur Changing Cryosphere: Understanding its Dynamics, Hazards, and Implications for Water SecurityView all 3 articles
 Miaja Coombs1
 Gregory T. Carling1*
 Lee Ann Munk2
 Jordan Jenckes3
 Barry R. Bickmore1
 Kevin A. Rey1
 Alyssa N. Thompson1
 Diego P. Fernandez4
 Anna Bergstrom5
 Teresa Gomez6
Glacial meltwater contributions to streams depend on watershed characteristics that impact water quantity and quality, with potential changes as glaciers continue to recede. The purpose of our study was to investigate the influence of glacier and bedrock controls on water chemistry in glacial streams, focusing on a range of small to large watersheds in Alaska. Southcentral Alaska provides an ideal study area due to diverse geologic characteristics and varying amounts of glacial coverage across watersheds. To investigate spatial and temporal variability due to glacial coverage and bedrock type, we analyzed water samples (n = 343) from seven watersheds over 2 years for major and trace element concentrations and water stable isotopes. We found variable water chemistry across the glacial rivers related to glacial coverage and the relative amount of metamorphic, sedimentary, and igneous bedrock. Some sites had elevated concentrations of harmful trace elements like As and U from glacier melt or groundwater. Longitudinal (upstream to downstream) variability was apparent within each river, with increasing inputs from tributaries, and groundwater altering the water chemistry relative to glacier meltwater contributions. The water chemistry and isotopic composition of river samples compared with endmember sources suggested a range from glacier-dominated to groundwater-dominated sites along stream transects. For example, water chemistry in the Knik and Matanuska rivers (with large contributing glaciers) was more influenced by glacier meltwater, while water chemistry in the Little Susitna River (with small glaciers) was more influenced by groundwater. Across all rivers, stream chemistry was controlled by glacier inputs near the headwaters and groundwater inputs downstream, with the water chemistry reflecting bedrock type. Our study provides a greater understanding of geochemical and hydrological processes controlling water resources in rapidly changing glacial watersheds.
Glaciers are rapidly receding in Southcentral Alaska with downstream impacts on water quantity and quality. Between 2000 and 2019, Alaska contributed 25% of the global glacier mass lost outside ice sheets, despite accounting for only 12% of the total glacier area (Hugonnet et al., 2021). Meltwater discharge from shrinking glaciers increases until peak water is reached, after which runoff declines with shorter periods of high flow and greater seasonal variability in water chemistry (Sorg et al., 2014; Huss and Hock, 2018; Rowan, 2018). Globally, runoff in glacial watersheds is expected to peak by 2040 (Immerzeel et al., 2013), with rivers fed by smaller glaciers passing peak water before rivers fed by larger glaciers (Huss and Hock, 2018). The Gulf of Alaska region (including Southcentral Alaska) stands out with a projected increase in glacier runoff contributions of over 5% by 2100, while all other major glacial watersheds are expected to have either a decrease or no change in glacier runoff contributions over the same period (Huss and Hock, 2018). The changing water chemistry and rising temperatures of meltwater-fed streams may be a stressor for threatened salmon species (Evenson, 2024) that spawn in these rivers (Chaloner et al., 2007; Hood and Scott, 2008; Bryant, 2009; Fellman et al., 2015; Shanley et al., 2015; Milner et al., 2017; Pitman et al., 2021).
As glaciers retreat, contaminants are released from melting ice and from newly exposed rocks that are subjected to enhanced weathering. Both melting ice and weathering rocks release solutes into the meltwater, increasing dissolved major ions, trace elements, organic carbon, and nutrients (Fortner et al., 2005; Brennan et al., 2014; Staniszewska et al., 2021; Pappala et al., 2023; Jenckes et al., 2024; Muñoz et al., 2024). For example, weathered bedrock exposed by retreating glaciers may be enriched in harmful trace metals released through sulfide oxidation (Fortner et al., 2011). Glacial meltwater may be enriched in contaminants stored in the ice from wet and dry atmospheric deposition (Carling et al., 2017; Barkdull et al., 2021; Staniszewska et al., 2021; Wu et al., 2022; Staniszewska et al., 2023; Liu et al., 2024; Muñoz et al., 2024). Once contaminants enter the river system, they can bioaccumulate, posing a significant risk to the food web (Streit et al., 1998; Morrissey et al., 2005; Maurya et al., 2019; Miner et al., 2019; Pawlak et al., 2021). The seasonal dynamics of glacial meltwater inputs and weathering processes result in temporal variations in meltwater chemistry that can impact carbon cycling and downstream ecosystems (Fortner et al., 2011; Pappala et al., 2023).
Glacial streams receive water inputs from multiple sources, including glacier melt, snowmelt, precipitation, and groundwater. Water sources may be quantified through endmember mixing analyses (He et al., 2020) or water stable isotope mixing models (Olson et al., 2024). Studies in glaciated watersheds often ignore groundwater input, assuming it is negligible compared to snowmelt, glacial melt, and precipitation. For example, a study of glacial watersheds in the Gulf of Alaska neglected groundwater, claiming that snowmelt dominated river flow from December to July, and precipitation dominated from September to November (Beamer et al., 2016). As glacial watersheds pass peak water, the relative contributions from different water sources will likely change. Water sources are also expected to change as Southcentral Alaska experiences a widespread snow-to-rain transition in mid-elevation regions (Littell et al., 2018; Sergeant et al., 2020). Decreasing glacial melt and snowmelt across the Gulf of Alaska (Huss and Hock, 2018) may make groundwater contributions relatively more important over time.
Although glaciers are expected to recede disproportionately across Southcentral Alaska, potentially affecting salmon populations, these watersheds have not been thoroughly studied, and a baseline is needed for long-term monitoring. The area is large enough that we can use our baseline snapshot of the regional water chemistry to investigate how stream chemistry changes as a function of glacial coverage and bedrock variations in the local watersheds. The purpose of our study was to provide such a baseline snapshot and investigate the influence of these controls on water chemistry in several glacial watersheds in Southcentral Alaska. Specific objectives were to: (1) compare water chemistry across watersheds with different glacial coverage and bedrock types; (2) evaluate the release and transport of trace elements/major ions with distance from contributing glaciers; and (3) investigate potential water sources through comparison with endmember water chemistry and water stable isotopes in each watershed.
We investigated seven glacial rivers in the Southcentral Alaska region, including Little Susitna, Moose Creek, Matanuska, and Knik watersheds in the Chugach/Talkeetna Mountains and the Gulkana, Canwell, and Castner watersheds in the Eastern Alaska (Delta) Range (Figure 1). There are five established U.S. Geological Survey (USGS) stream gauge stations in our study watersheds, located on the Knik, Matanuska, Little Susitna, Moose Creek, and Gulkana rivers. Sampling locations chosen for this study included the five stream gauge sites 16 other sites (shown in Figure 1). These watersheds collectively cover 9,799 km2 ranging from the 32 km2 Gulkana watershed to the 5,423 km2 Matanuska watershed. Maps of watershed elevation and bedrock are provided in the Supplementary Figures S1–S8. Watershed characteristics and sample sites in each watershed are provided in Table 1.
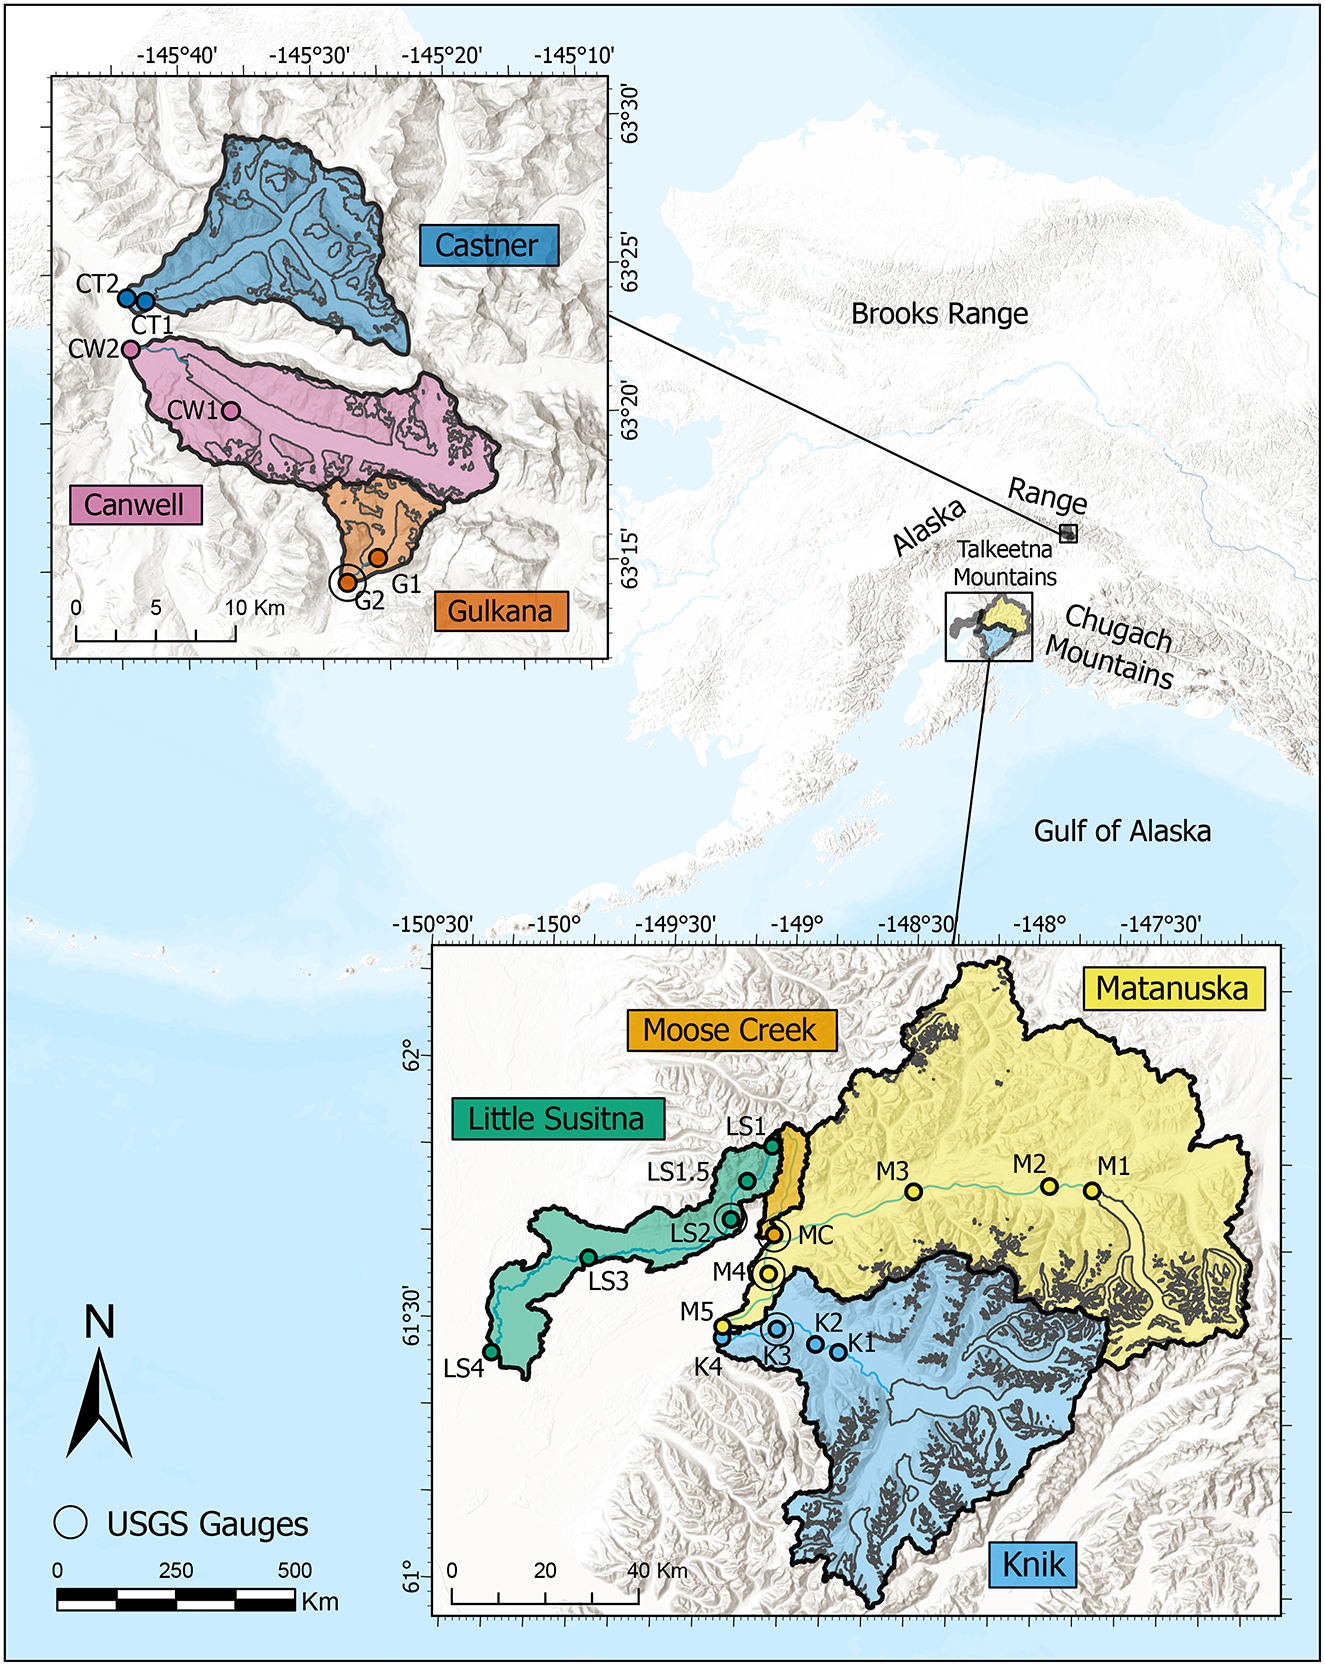
Figure 1. Map of 21 mainstem river sites sampled across Southcentral Alaska during the 2022 and 2023 melt seasons. Glaciers in the watersheds are outlined in gray. Sites are located within seven glacial watersheds across the Talkeetna, Chugach, and Alaska (Delta) Ranges.
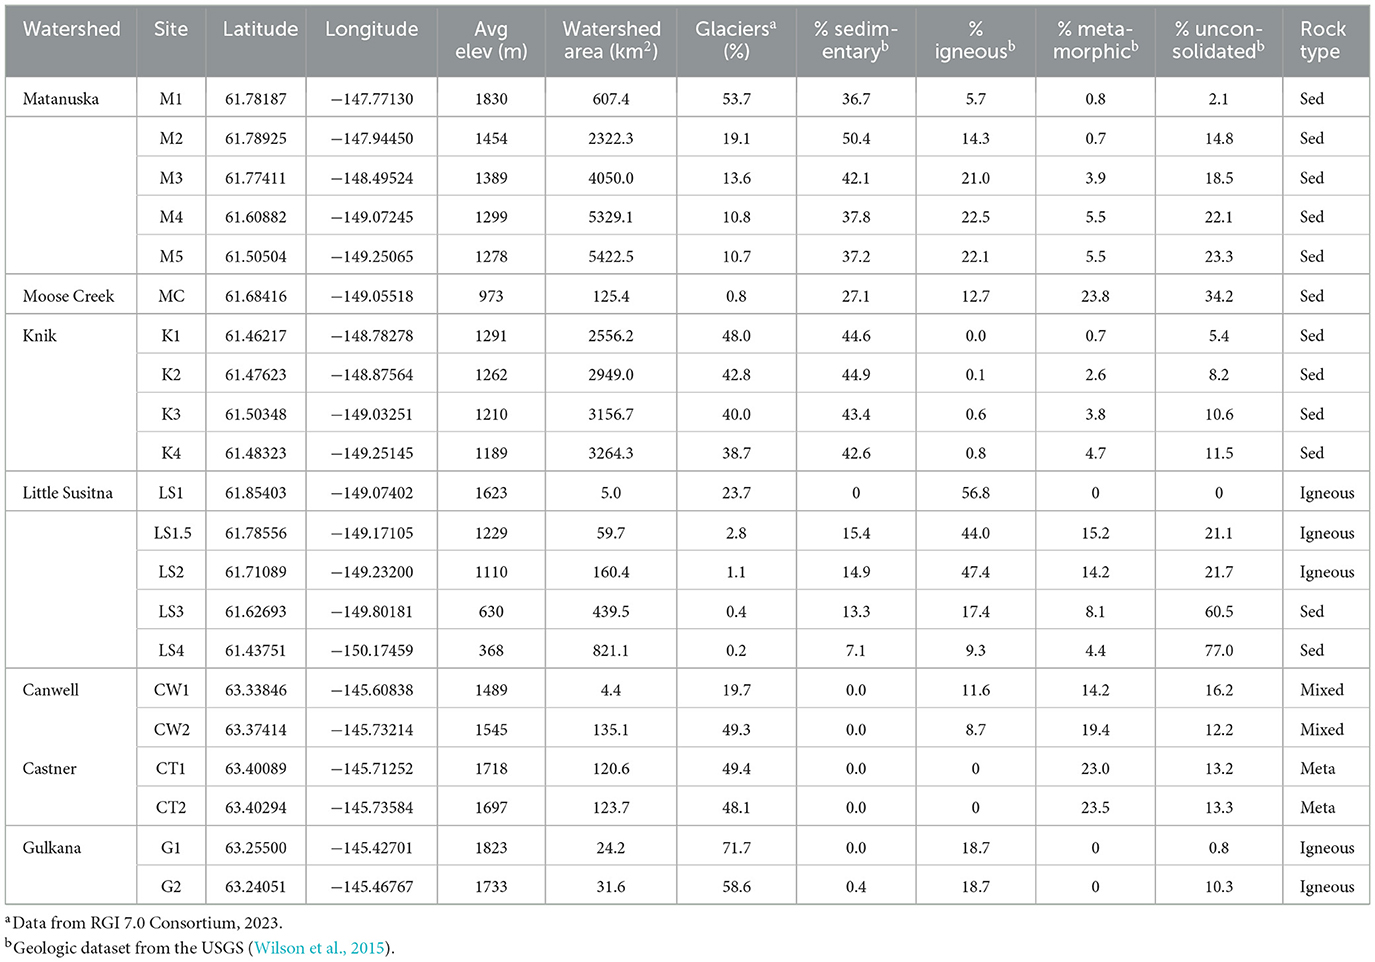
Table 1. Geospatial data of subwatersheds for all 21 mainstem river sample sites.
To identify spatial and temporal trends in water chemistry across the seven glaciated watersheds, we collected 345 water samples during late spring through early fall of 2022 and 2023. The sample sites included Knik (K1 through K4), Matanuska (M1 through M5), Moose Creek (MC), Little Susitna (L1 through L4), Gulkana (G1 and G2), Canwell (CW1 and CW2), and Castner (CT1 and CT2). The upstream sample site in each river was located as close as possible below the main glacier with the other samples extending to the end of the watershed. Given difficult access to the Moose Creek watershed, samples were only collected at the catchment mouth. We collected monthly samples at most of the 21 sites from May through September 2022 and 2023. The sample collection also included weekly samples at four USGS stream gauge sites (K3, M4, MC, and LS2).
To compare river water chemistry with potential endmember water sources, we collected samples from supraglacial, subglacial, and periglacial streams, a proglacial lake, springs, and tributaries in the Knik, Matanuska, Little Susitna, and Delta Range watersheds during July–August 2023. Maps showing locations of the endmember samples are provided in the Supplementary material with catchment elevation (Supplementary Figures S1–S4) and underlying bedrock (Supplementary Figures S5–S8).
Both years (2022 and 2023) had above average accumulated precipitation, with 2022 receiving slightly more precipitation in the summer and fall months and 2023 receiving more winter snow (ACRC, 2022, 2023). Southcentral Alaska had a historically snowy winter of 2022–2023 and a delayed snowmelt season in 2023 due to persistent winter conditions. Air temperatures across Southcentral Alaska were above average in 2022 and slightly below average in 2023. Generally, the watersheds in the Alaska (Delta) Range are much colder and receive less precipitation than the watersheds in the Talkeetna and Chugach Ranges (Figure 1).
Each sample included multiple subsamples for different analyses. For trace element, major cation, and major anion analysis, water was filtered through a 0.45 μm PES syringe filter using an acid-washed syringe, acidified to 2.4% v/v trace metal grade HNO3, and stored in acid-washed 30 ml LDPE bottles. The major anion samples were filtered and stored in 15 ml HDPE bottles. Samples for water stable isotopes were collected in amber glass vials with Polyseal caps, leaving no headspace to prevent evaporation. All samples were refrigerated until analysis. Alkalinity, assumed to be in the circumneutral samples, was measured on unfiltered samples using a Hach 2444301 Alkalinity Test Kit. Field parameters (pH, dissolved oxygen, conductivity, and oxidation-reduction potential) were measured in situ using a YSI Quatro multiparameter probe, calibrated regularly. Field blanks (n = 28) were collected weekly by filtering Milli-Q water into an acid-washed 30 ml LDPE bottle and a 15 ml HDPE bottle. These field blank samples were then analyzed the same way as other samples.
Water samples were analyzed for trace elements, major cations, major anions, silicon, and water stable isotopes (δ18O and δ2H). Trace element/major cations were analyzed using an Agilent 7500ce quadrupole inductively coupled plasma mass spectrometer (ICP-MS) for concentrations of Al, As, B, Ba, Be, Ca, Cd, Ce, Co, Cr, Cs, Cu, Dy, Er, Eu, Fe, Gd, Ho, K, La, Li, Lu, Mg, Mn, Mo, Na, Nd, Ni, Pb, Pr, Rb, Sb, Sc, Se, Sm, Sr, Tb, Th, Tl, U, V, Y, Yb, and Zn, following U.S. Environmental Protection Agency (EPA) Method 1640 (EPA, 1997). The detection limit was determined as the standard deviation of each element measured on all blanks for each run. A calibration curve was developed from Inorganic Ventures single element standards. A National Institute of Standards and Technology (NIST) standard reference material (SRM 1643f) was repeatedly analyzed alongside water samples to serve as a continuing calibration verification. Major anions concentrations (F −, Cl−, , and ) were measured using a Dionex ICS-90 ion chromatograph (IC) with an AS40 autosampler (for 2022 samples) and a Thermo Easion IC with an AS-DV autosampler (for 2023 samples). Water stable isotopes (δ18O and δ2H) were measured using a Los Gatos Research Liquid Water Isotope Analyzer (model LWIA-24d). Values were reported relative to the Vienna Standard Mean Ocean Water (VSMOW) standard, with a precision of 0.2 and 1‰ for δ18O and δ2H, respectively. Silicon was measured using a Thermo iCAP 7400 duo inductively coupled plasma—optical emissions spectrometer (ICP-OES), following the EPA 200.7 method (EPA, 1994). All raw data can be found Coombs and Carling (2025).
We checked field blank data for background contamination in our field sampling and analysis. In most field blanks, concentrations were below the detection limit for nearly all elements. Some field blank samples had detectable values of specific elements, but the concentrations were typically lower than those measured in samples. For example, in one of the field blanks Fe was detected at 1.25 μg/L, which was on the lower end of the range of sample concentrations. Some elements in our dataset were below the detection limit for at least half of the samples, including F−, Be, and Th. These elements were removed from further analysis. For elements with a small number of samples with concentrations below the detection limit, we substituted one-half the detection limit to use the data in statistical analyses.
To check for accuracy in our laboratory analyses, we calculated major ion charge balances using major cation (Ca2+, Mg2+, Na+, and K+), major anion (, Cl−, and ), and concentrations. Of the 315 river samples analyzed, 223 had an acceptable change balance error between ±10%. Given low solute concentrations, a relatively high charge balance error was acceptable for these samples. The charge balance errors for the remaining 92 samples were between ±10%−20% for 70 samples and larger than ±20% for 22 samples. The charge balance was adjusted for these samples by changing the concentrations.
To identify geochemical differences and similarities across watersheds, we applied two multivariate reduction models, principal component analysis (PCA) and linear discriminant analysis (LDA), to the dataset using the sklearn and NumPy packages in Python and the Statistics and Machine Learning Toolbox in MATLAB. PCA is an unsupervised technique in which the multi-dimensional axes of normalized data space are rotated to incorporate the most possible data variance in the fewest possible axis direction (Davis, 2002). LDA is similar to PCA in that it provides a set of rotated axes (linear discriminants) in normalized data space, ordered by variance explained. However, because LDA is a supervised technique, the directions of the linear discriminants are specifically chosen for their usefulness in separating the target categories (Davis, 2002). In all cases, the dataset was z-scored to ensure that each water chemistry parameter contributed equally to the analysis.
A PCA and LDA were performed for the full mainstem river chemistry dataset. The water chemistry parameters used for the full dataset included water stable isotopes, major ions, trace elements, and conductivity. This amounted to 51 water chemistry parameters for 251 samples. A small number of samples (n = 16) were not included because they were missing major anion, isotope, silicon, or conductivity data.
To compare water chemistry in rivers with potential endmember sources, a PCA was also performed on data from individual watersheds using major ion (Cl−, , , Ca2+, Mg2+, Na+, and K+) concentrations, which are assumed to behave conservatively within the watersheds. Watershed-specific mainstem, tributary, and spring samples were used in each PCA, along with a common set of glacial meltwater and precipitation samples for all watersheds. Precipitation chemistry data was obtained from two National Atmospheric Deposition Program (NADP) sites, AK03 and AK97. Two samples collected during the summer of 2023 were used to represent precipitation chemistry in the watersheds. We only used mainstem river samples collected between July 4th, 2023 and August 15th, 2023, to overlap with the timing of the endmember sampling. Due to fewer samples collected within the Delta Range, all samples from Canwell, Castner, and Gulkana watersheds were combined into a single PCA.
Geospatial metrics for the subwatersheds above each sampling point were calculated using 5m × 5m digital elevation models (DEMs) (U.S.G.S., 2019) and glacier, hydrology, and geology datasets in ArcGIS Pro 3.2. Watersheds were delineated based on upstream drainage areas, using the watershed tool and a DEM, with the fill tool to eliminate sinks. For each subwatershed, we extracted data the 2018 National Hydrography Dataset (U.S.G.S., 2019), the USGS Geologic Map of Alaska (Wilson et al., 2015), and the Randolph Glacier Inventory (RGI) v7.0 (RGI, 2023). We used the NHD to extract flowlines for each watershed and subwatershed. Calculations were performed on the DEMs to estimate the mean watershed elevation for each subwatershed and site elevation. The geologic units in each watershed were classified by rock type (igneous, metamorphic, sedimentary, or mixed), and watersheds were characterized by the primary rock type. RGI v7.0 was used for calculating glacier areas because it considers debris coverage and is regularly updated with global standardization to ensure consistent methodology across regions. The glacier extents in RGI v7.0 are primarily based on satellite imagery and datasets from around the year 2000, but it was mostly recently updated in 2023 (RGI, 2023). Calculated GIS information for each subwatershed is provided in Table 1.
The LDA clearly separated mainstem river samples based on water chemistry using watersheds as the target categories. The first two linear discriminants (LDs) explained 72% of the variability in the z-scored dataset, with 54% from LD1 and 18% from LD2. LD1 was most dependent on Dy, Er, and Pr and LD2 was most dependent on Dy, Mg2+, and Nd. The plot of LD2 vs. LD1 scores separated most watersheds, although some overlap existed between samples from the Matanuska, Knik, and Canwell rivers (Figure 2). The Little Susitna samples were clearly distinguished by high LD1 scores and Castner samples were distinguished by low LD2 scores. The Gulkana and Moose Creek samples were clearly separated from other sites in the LDA plot, with a spread along LD1 and relatively high LD2 scores. Many of the Knik and Matanuska samples overlapped in the LDA plot, but the Matanuska samples generally had lower LD1 and LD2 scores. The coefficients of LD1 and LD2 were not easily interpretable due to the large number of variables analyzed. However, sites with high percentage of igneous rocks (Moose Creek and Little Susitna) plotted highest on LD1, suggesting a relationship with elements supplied by weathered granite. Additional LDs described more variability in the dataset (14% for LD3), though plotting LD3 vs. LD1 or LD2 did not provide additional separation beyond what was observed in Figure 2.
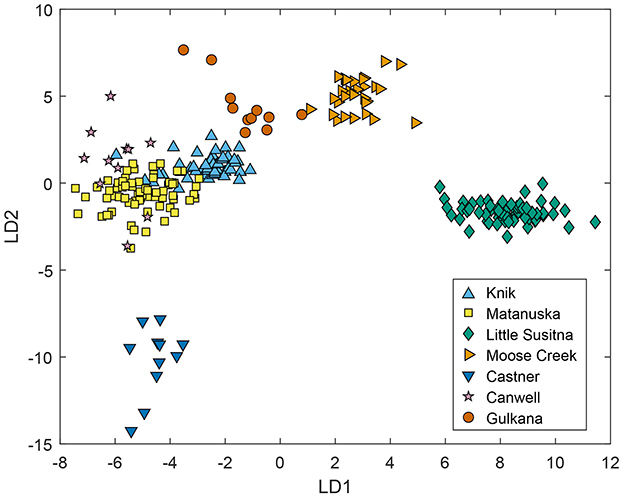
Figure 2. Plot of linear discriminant (LD) 2 vs. LD1 scores for linear discriminant analysis (LDA) of all mainstem river samples using major and trace element concentrations, conductivity, and water stable isotopes. The first two LDs explained 70.6% of the variability in the dataset, with 50.6% from LD1 and 20.0% from LD2.
The PCA explained only 47.1% of variability in the z-scored dataset with the first two principal components (PCs), with limited separation of samples across many of the sites. The PCA was less successful at separating samples from each river relative to the LDA. The plot of PC2 vs. PC1 scores is provided in the Supplementary Figure S9.
Bivariate plots of mainstem river samples were used to identify distinguishing characteristics in trace and major element across watersheds. Four plots that best separated individual watersheds are shown in Figure 3. The Rb vs. Ca2+ plot shows the lowest Ca2+ concentrations in the Little Susitna River, followed by Moose Creek and Gulkana. The Knik, Canwell, Castner, and Matanuska rivers had a large range of Ca2+ concentrations. Castner and Little Susitna had relatively high Rb concentrations compared with the other sites. The Se vs. U plot clearly separates Castner based on relatively low Se and high U concentrations Castner shows a wide range in U concentrations, with values up to three times higher than those of any other watershed. The vs. Cr plot shows low concentrations in the Little Susitna, Moose, and Gulkana rivers. Castner had the lowest Cr concentrations, while the other rivers had a wide range of Cr concentrations. The Little Susitna had relatively high Cs concentrations and Castner had high U concentrations in most samples, clearly distinguishing these rivers from the others.
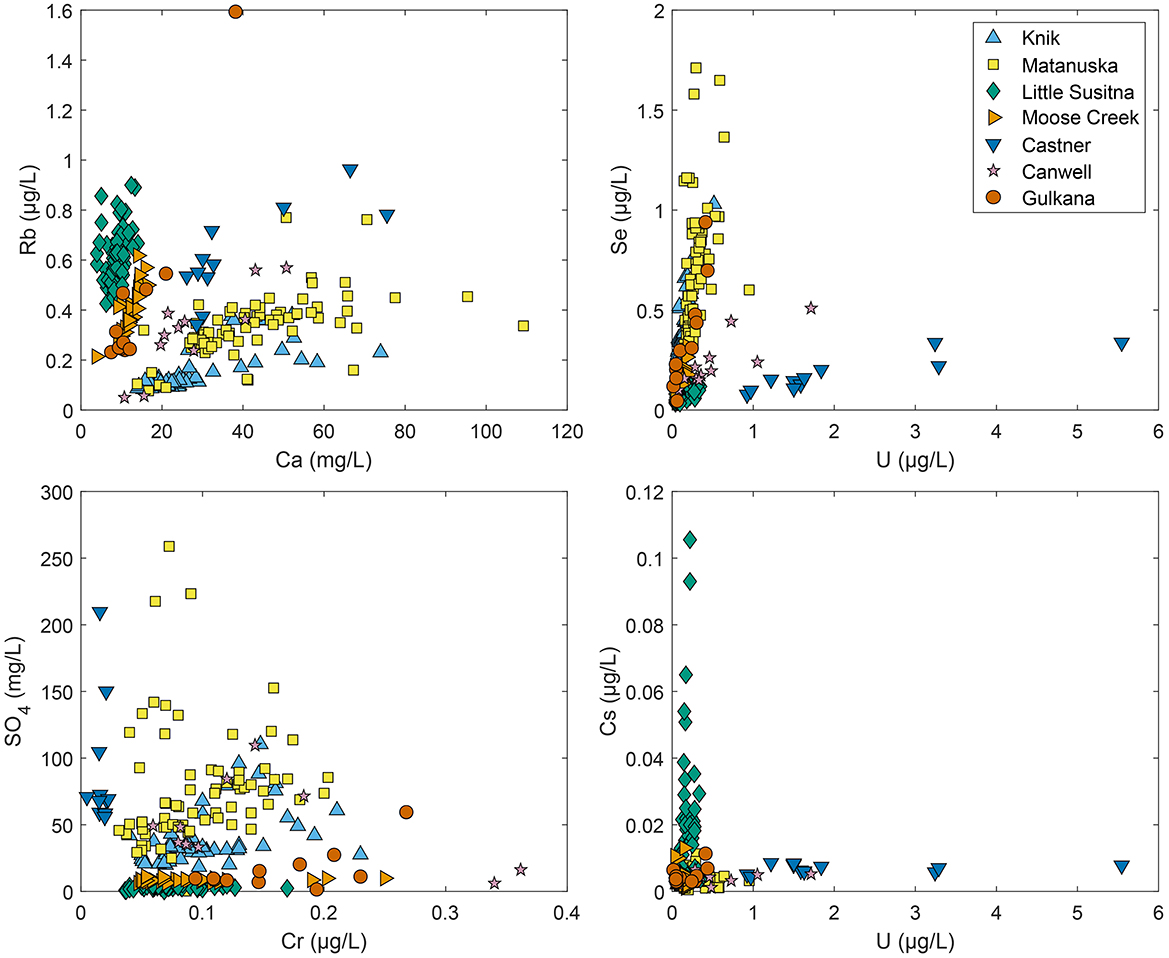
Figure 3. Bivariate plots of trace and major element concentrations in all mainstem river samples.
For the Matanuska, Knik, and Little Susitna rivers, we had enough mainstem sample sites to investigate longitudinal (upstream to downstream) and temporal changes (Figures 4–6). For these rivers, we selected As to represent trace elements, Ca2+ to represent major cations, to represent major anions, and Yb to represent rare earth elements and Y (REE+Y).
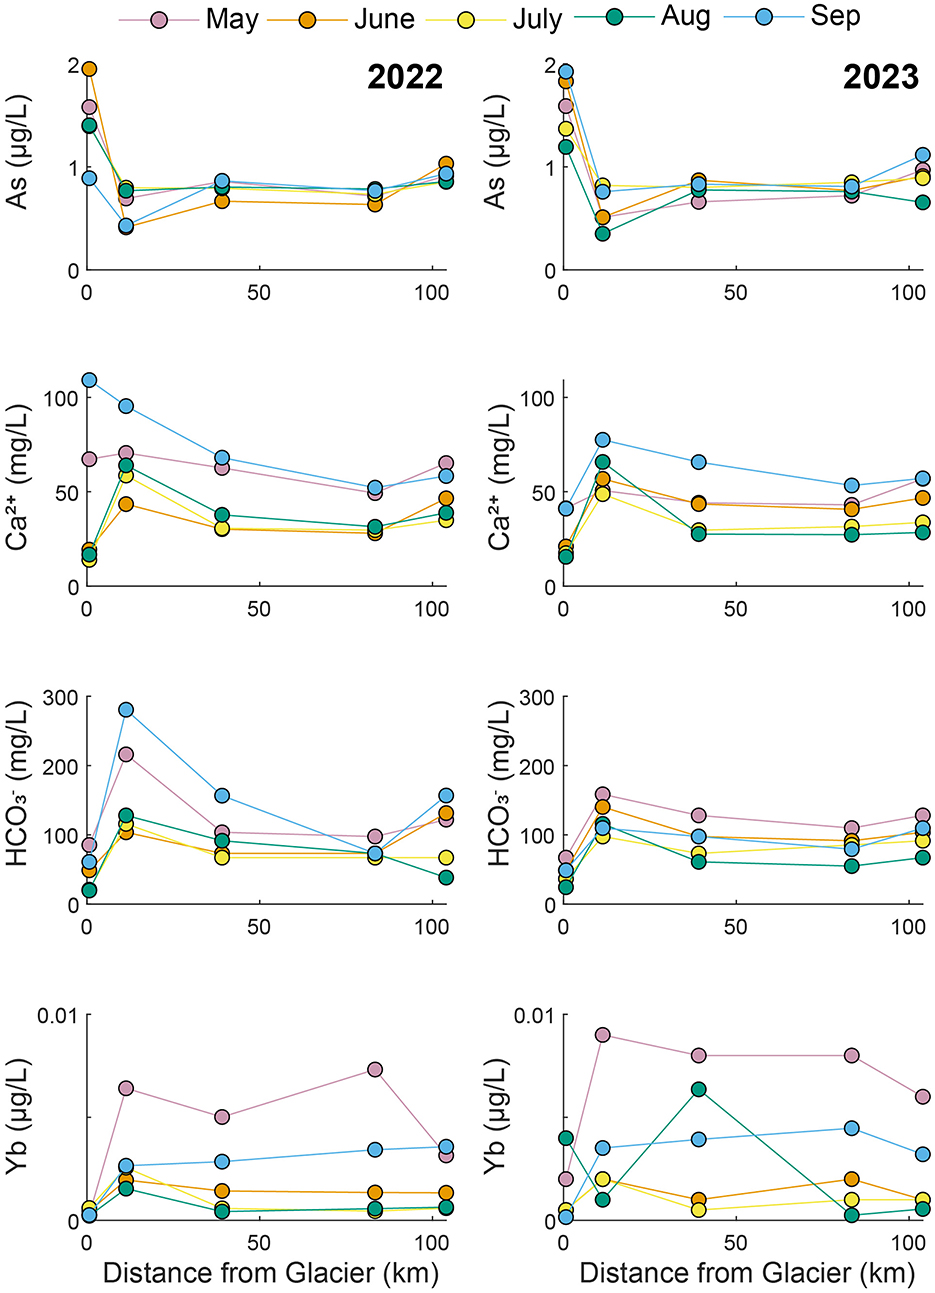
Figure 4. Longitudinal changes in concentrations along the mainstem Matanuska River during 2022 and 2023.
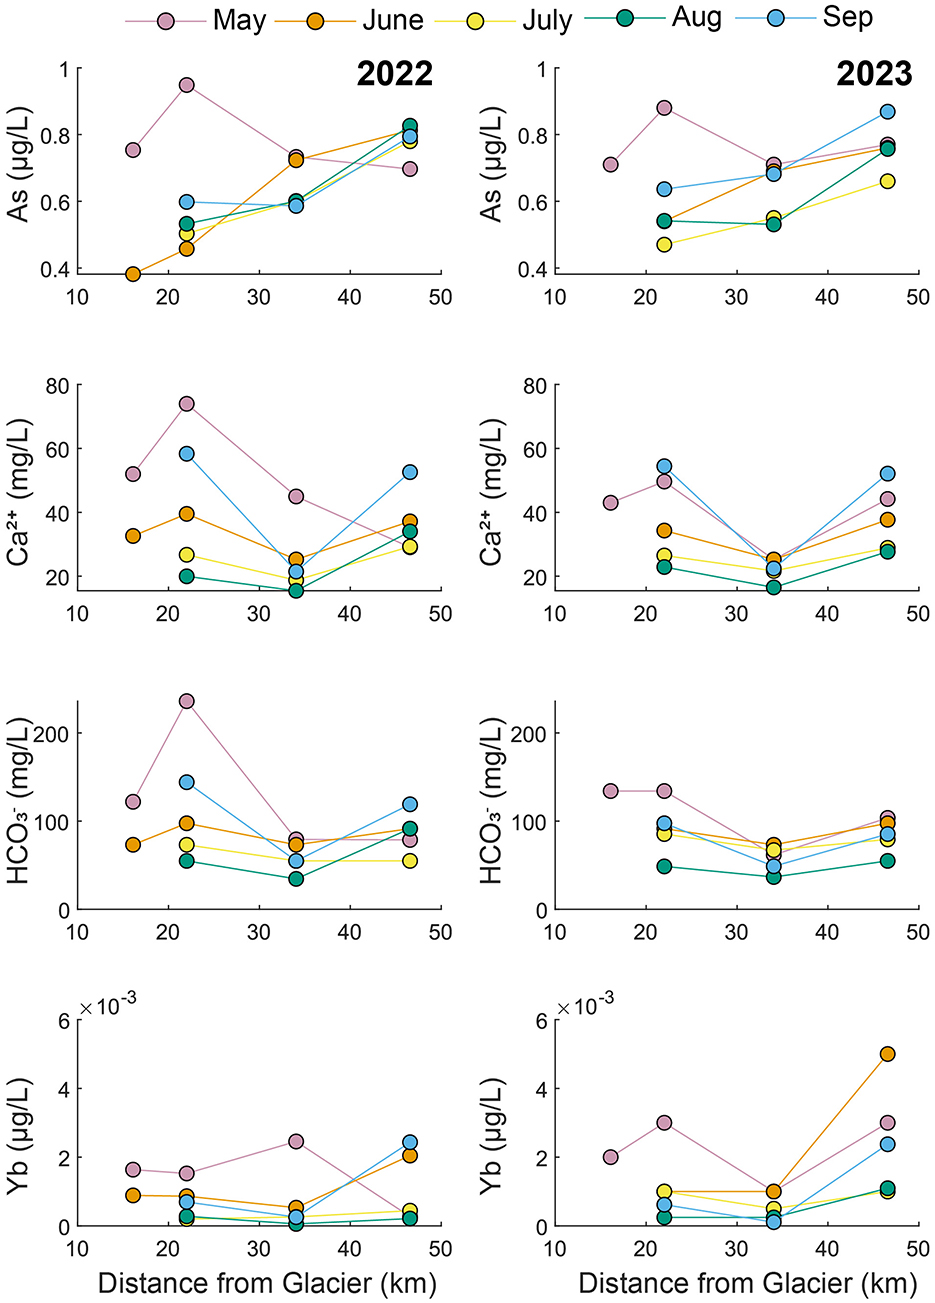
Figure 5. Longitudinal changes in concentrations along the mainstem Knik River during 2022 and 2023.
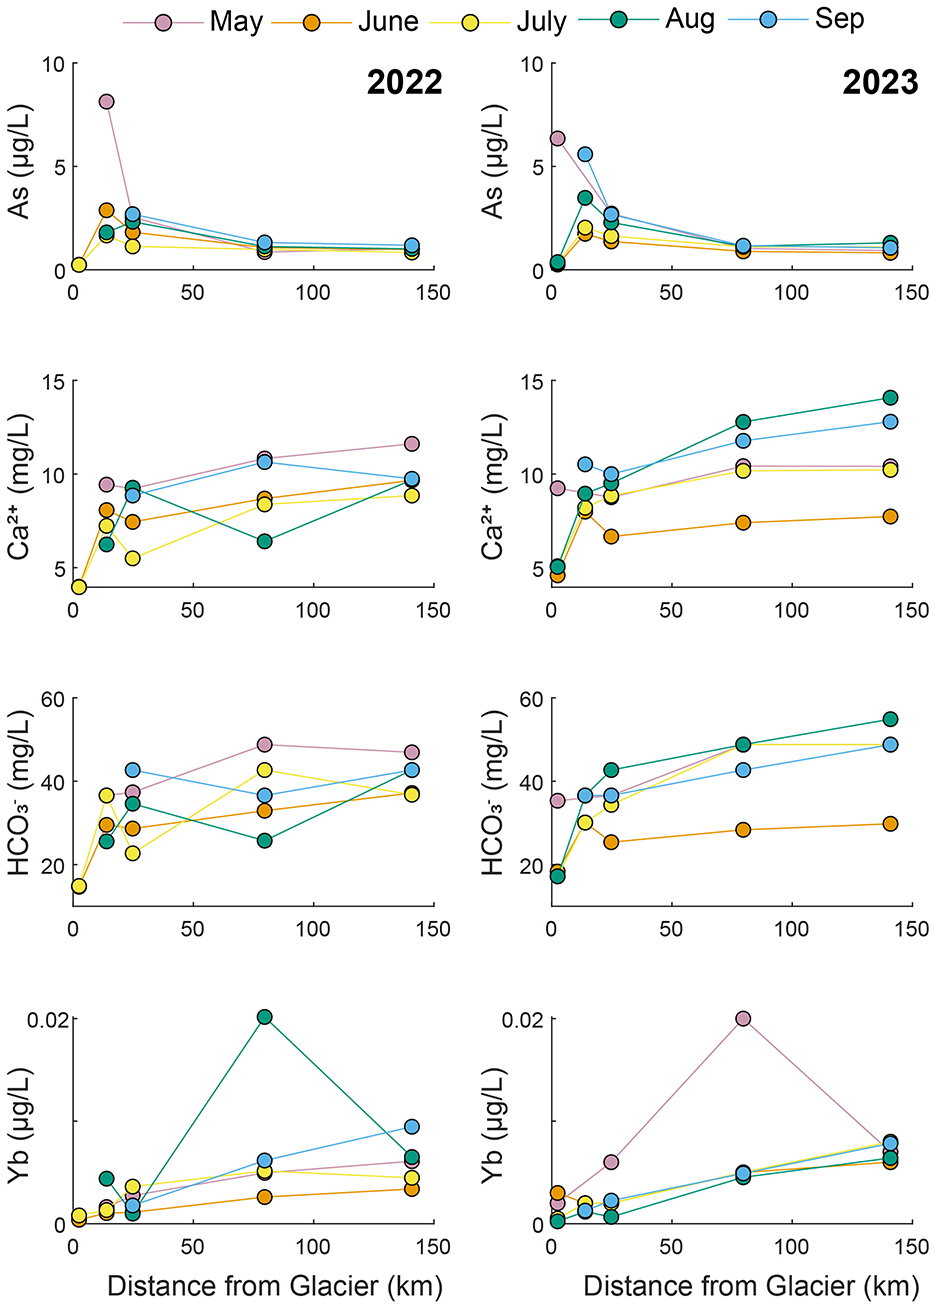
Figure 6. Longitudinal changes in concentrations along the mainstem Little Susitna River during 2022 and 2023.
In the Matanuska River (Figure 4), As concentrations were highest at the upstream site (M1) and decreased substantially between M1 and M2, before showing a slight increase between M2 and M5. Remarkably, As concentrations were similar at each site across all months during both years of sampling, with some variability at M1 during 2022. Ca2+ and concentrations were generally lowest at M1, highest at M2, and intermediate at M3 through M5. An exception to this trend was the May and September 2022 samples that show high Ca2+ concentrations at M1. Yb concentrations were variable, with no clear longitudinal trends from month-to-month. At site M1, Yb concentrations were consistently low in 2022 but were variable in 2023. Notably, the highest Yb concentrations were observed during May 2022 and May 2023, likely reflecting inputs during snowmelt runoff.
In the Knik River (Figure 5), As concentrations generally increased from upstream to downstream. May samples from both years deviated from this trend, with the highest As concentrations at K2. Ca2+ and concentrations were generally highest upstream (K1 and K2), lowest at K3, and intermediate at K4. Yb concentrations were typically highest at K4, especially during 2023.
In the Little Susitna River (Figure 6), As concentrations increased from LS1 to LS1.5 and then decreased from LS1.5 to LS4. The highest As concentrations were found at LS1.5 in May both years. Ca2+ and concentrations varied, but they tended to increase along the transect (from LS1 to LS4). For both Ca2+ and , longitudinal trends did not vary consistently between seasons. Yb concentrations generally increased from LS1 to LS4, though the largest Yb concentrations were found at LS3 in August 2022 and May 2023 when they were ~2–4 times higher than the other samples.
Water stable isotope (δ2H and δ18O) composition varied widely across watersheds, with the lowest (most negative) values in the Matanuska River and the highest (least negative) values in the Little Susitna River (Figure 7). The plot shows the water stable isotope values for all mainstem river samples collected as part of our study. Many of the Canwell and Castner samples overlapped with the Matanuska samples in isotopic space, while the Knik samples overlapped with the Little Susitna samples. The Gulkana samples plotted in intermediate space, overlapping with samples from many other rivers. Given the scatter among river samples from each watershed, average values are also shown (Figure 7, inset). Based on average values, the stable water isotopic composition of the rivers ranked from lowest to highest was Matanuska (δ2H = −175‰ and δ18O = −23‰), Castner, Canwell, Gulkana, Knik, Moose, and Little Susitna (δ2H = −145‰ and δ18O = −19‰). Average isotopic values from all rivers plotted along the global meteoric water line (GMWL), suggesting limited evaporation in the watersheds. The strongly negative isotopic values at Matanuska are surprising given proximity to the Pacific Ocean, but may be related to the relatively high average elevation of the subwatersheds at each of our sampling sites (Table 1) or predominance of meltwater contributing to streamflow. The isotopic values in the Knik River were much less negative than the Matanuska, which was unexpected because the two watersheds are located adjacent to each other in the Chugach Range. The relatively negative isotopic values at Castner, Canwell, and Gulkana are likely related to these sites being the furthest north and most inland of all our sample sites. The less negative δ2H and δ18O values at Little Susitna were expected due to the watershed's low elevation and proximity to the ocean.
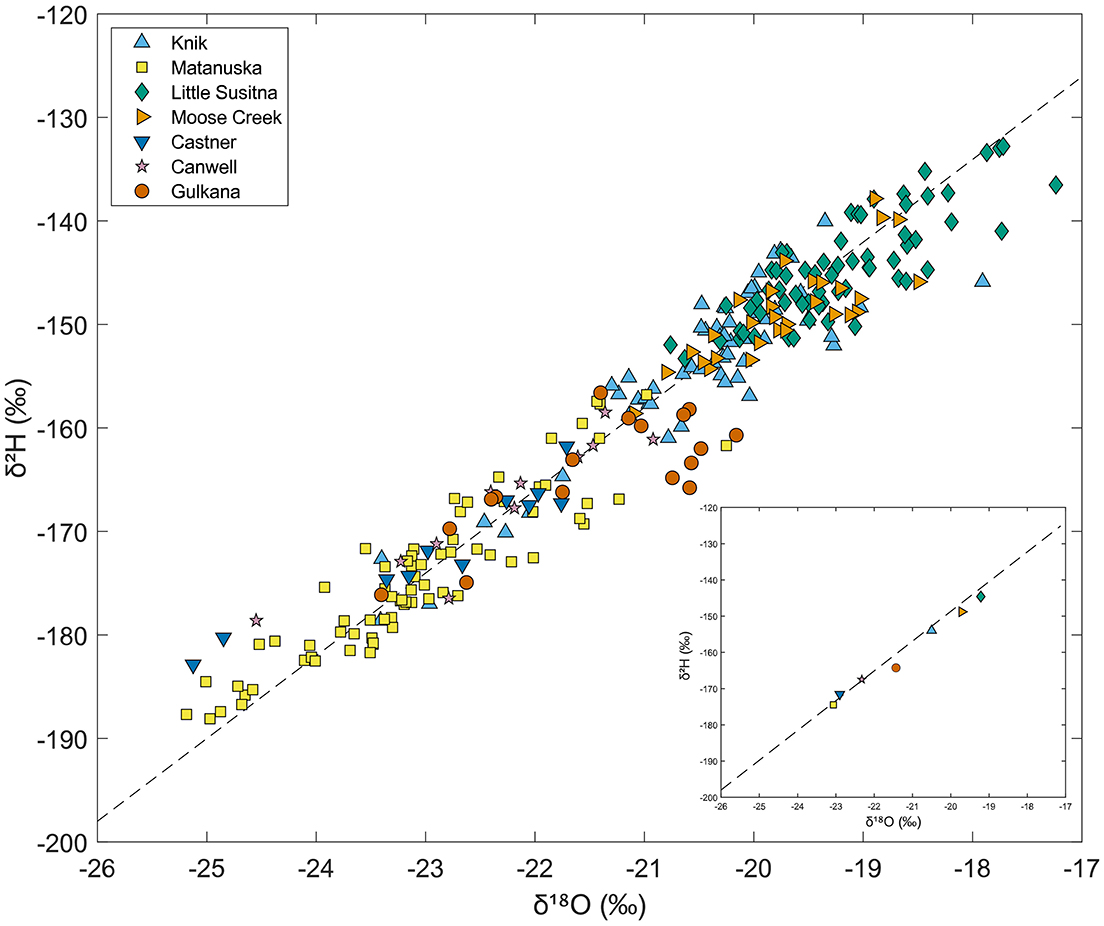
Figure 7. Plot of water stable isotope (δ2H vs. δ18O) measurements for all mainstem river samples. The dashed line is the global meteoric water line (GMWL). The inset plot shows average δ2H vs. δ18O for each river.
We compared major ion water chemistry of mainstem river samples with springs, precipitation, glacier meltwater, and precipitation to identify water sources within each watershed using a site-specific PCA (Figure 8). In each plot, precipitation chemistry from NADP and glacier meltwater samples from Little Susitna and the Delta Range were used to represent a dilute endmember, since these samples were not collected from each watershed. We made the endmember comparisons qualitatively, without performing mixing calculations, due to limited number of endmember samples in each watershed. A quantitative endmember mixing analysis would require more detailed sampling across these large and remote watersheds, which was beyond the scope of our study.
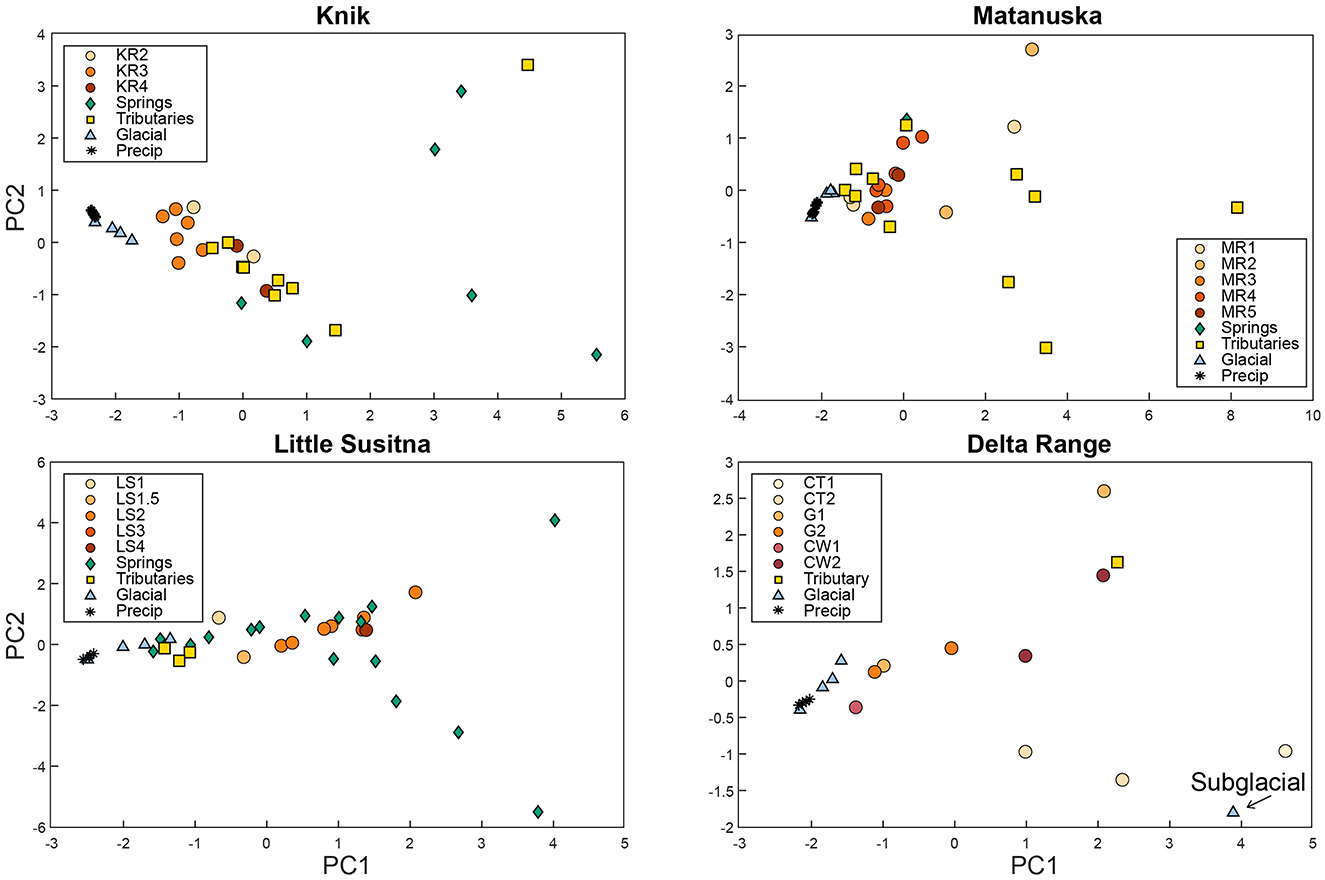
Figure 8. Site-specific PCA plots for the Knik, Matanuska, Little Susitna, and Delta Range (Castner, Gulkana, and Canwell) watersheds comparing samples collected during July–August 2023 from mainstem river sites with tributaries, glacial meltwater, precipitation, and springs.
For the Knik watershed (Figure 8, upper left), the first two principal components (PCs) explained 79% of the variability in the water chemistry dataset, with 60% of the variance from PC1 and 19% of the variance from PC2. PC1 was most influenced by , while PC2 was most influenced by Mg2+ and Cl−. The glacier and precipitation samples plotted together on the left side of the PC2 vs. PC1 plot and the spring samples plotted toward the right side. The mainstem river samples and most of the tributary samples plotted in between the glacial meltwater/precipitation and spring endmembers, suggesting that they contain a mixture of dilute meltwater, precipitation, and groundwater.
For the Matanuska watershed (Figure 8, upper right), the first two PCs explained 82% of the total variability, with 70% from PC1 and 12% from PC2. PC1 was most influenced by , , Mg2+, and Cl−, and PC2 was most influenced by and Cl−. The glacial meltwater and precipitation samples plotted on the negative end of both the PC1 and PC2 axes, with some of the tributary samples (mainly from non-glacial watersheds) plotting toward the positive end of both PC1 and PC2. The mainstem river samples and the remainder of the tributary samples plotted between the glacier samples and non-glacial tributaries.
For the Little Susitna watershed (Figure 8, lower left), the first two PCs explained 73% of the total variability, with 45% from PC1 and 28% from PC2. PC1 was most influenced by K+, Cl−, , and PC2 was most influenced by Na+, , and Cl−. The precipitation and glacial meltwater samples plotted on the left side of PC1, while some of the spring samples plotted toward the right side. The mainstem samples plotted along a trend from LS1 near the glacial samples to LS3 and LS4 on the positive end of PC1. This trend suggests increasing groundwater inputs from upstream to downstream along the Little Susitna River.
For the Delta watershed (Figure 8, lower right), the first two PCs explained 85% of the variance, with 70% of the variance from PC1 and 15% of the variance from PC2. PC1 was most influenced by and Cl−, and PC2 was most influenced by Na+ and . Generally, the mainstem river samples plotted between the glacial and precipitation cluster on the left and tributary and subglacial samples on the right. The subglacial sample collected at the toe of the Castner Glacier plotted on the positive end of PC1 and negative end of PC2, far from the supraglacial and periglacial water samples. The distinct chemistry in the subglacial sample highlights the importance of meltwater interactions with underlying bedrock and glacial till. The Castner stream samples (CT1, CT2) plotted lower on PC2 and slightly higher on PC1 than other samples from the watershed. Generally, the Canwell and Gulkana samples plotted near each other, closer to the glacial and precipitation cluster and further from the subglacial endmember relative to the Castner samples.
To further investigate endmember contributions, we used water stable isotope (δ2H vs. δ18O) values of mainstem river sites and endmembers for each watershed (Knik, Matanuska, Little Susitna, and Delta Range; Figure 9). Glacier, tributary, and spring endmembers were included in this figure. For the Matanuska subplot, glacier endmember samples were obtained from a Matanuska glacier water stable isotope dataset (Ensminger et al., 2001).
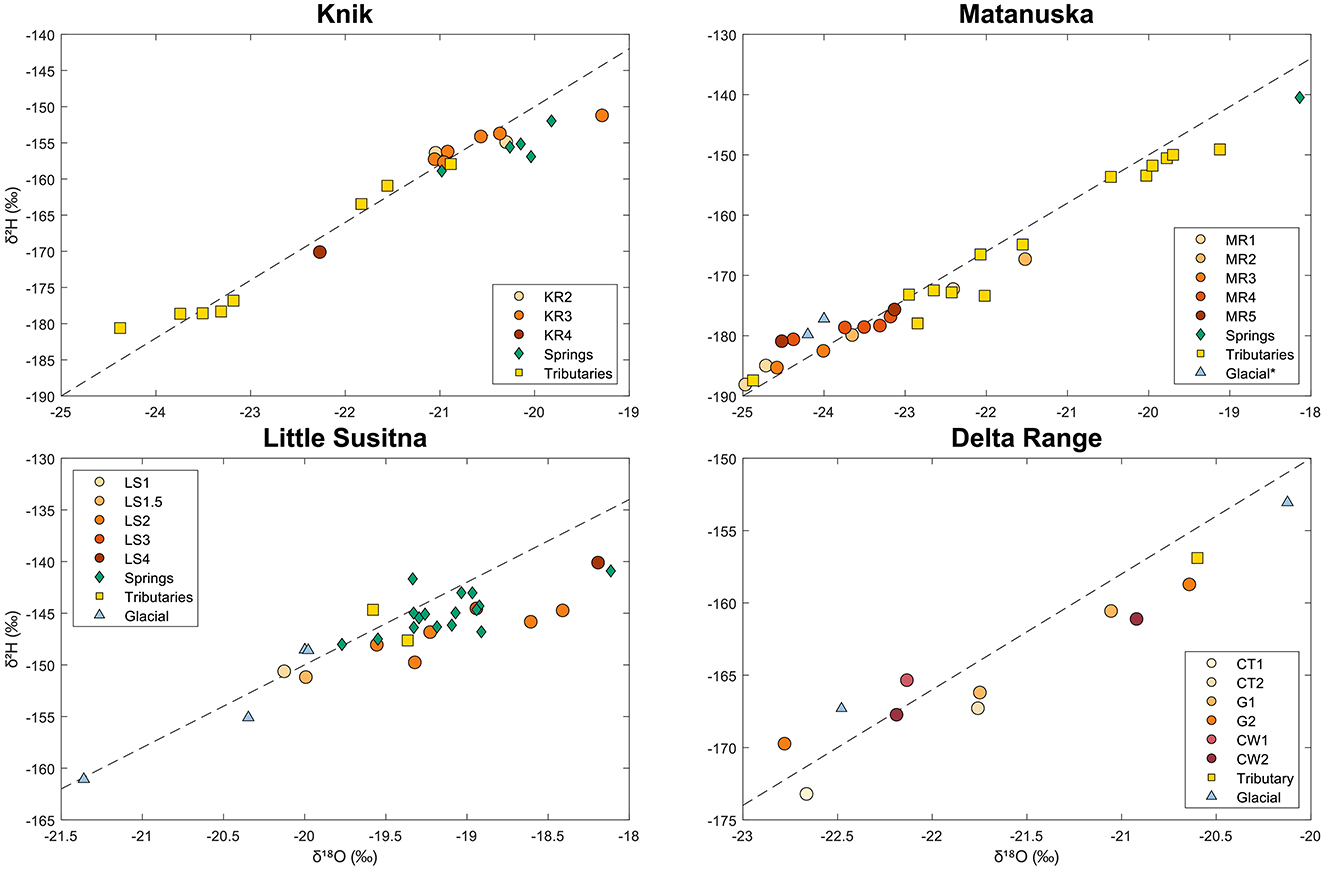
Figure 9. Plots of δ2H vs. δ18O values for all mainstem river and endmember samples collected during July–August 2023 from the Knik, Matanuska, Little Susitna, and Delta watersheds. Glacial data for the Matanuska watershed was obtained from the Matanuska Glacier englacial and subglacial water stable isotope dataset (Ensminger et al., 2001).
The Knik watershed subplot (Figure 9, upper left) shows that isotopic composition of mainstem river samples (except at site K4) overlapped with spring samples. Site K4 receives inputs from the Matanuska River due to groundwater mixing in the floodplain, indicated by more negative δ2H and δ18O values. The Matanuska subplot (Figure 9, upper right) shows the isotopic composition of mainstem river samples overlapping with glacial samples, with more negative isotopic values relative to most of the tributary and spring samples. The Little Susitna subplot (Figure 9, lower left) shows LS1 and LS1.5 plotting near the glacial endmember samples and the rest of the sites (LS2, LS3, LS4) plotting with the spring samples. The Delta Range subplot (Figure 9, lower right) shows the isotopic composition of most mainstem river samples falling between the subglacial and supraglacial endmembers.
Variability in bedrock type and glacier coverage (Table 1) likely influenced water chemistry in each of the seven glacial rivers we sampled in Southcentral Alaska. River samples were distinguished by their overall water chemistry in the LDA (Figure 2) and by specific elements in the bivariate plots (Figure 3). In the plot of LD2 vs. LD1 scores, the Castner and Little Susitna samples plotted separately from the other sites, possibly reflecting distinct underlying bedrock (metamorphic rocks at Castner) or glacial coverage (small glaciers at Little Susitna) in these watersheds. In contrast, the Matanuska and Knik samples overlapped in the plot of LD2 vs. LD1, likely due to similar watershed lithology and glacial coverage. The bivariate plots also tended to separate the Little Susitna and Castner samples, while the Matanuska and Knik samples generally clustered together. Longitudinal changes in water chemistry in the Matanuska, Knik, and Little Susitna rivers illustrate a transition from dominant glacial meltwater inputs upstream to increasing groundwater contributions downstream. Additional information about glacier inputs may be gained from water stable isotopes in each river (Figures 7, 9). Below, we describe water chemistry in each stream in relation to bedrock type and glacier coverage.
Castner Creek water chemistry was distinct from that of other streams, likely because it is in the only watershed dominated by metamorphic rocks (Table 1). In the plot of LD2 vs. LD1, the Castner samples were clearly distinguished along the negative end of LD2 (Figure 2). The distinct lithology of the Castner watershed may explain the relatively high U concentrations and low Cr concentrations (Figure 3). The Castner samples were toward the negative end of the isotope plot compared to samples from other watersheds (Figure 7). This may reflect the high fraction of glacier coverage (~50%) and relatively high latitude of this watershed (Table 1).
The Little Susitna had distinct water chemistry, which may be explained by granitic bedrock at the headwaters and relatively low glacial coverage (ranging from 24% at the headwaters to 0.2% at the mouth). In the plot of LD2 vs. LD1, the Little Susitna samples were at the positive end of LD1, clearly separated from the other watersheds (Figure 2). In the bivariate plots, Little Susitna samples were distinct with relatively high Cs and low U, Ca2+, and concentrations (Figure 3). Most elements showed increasing concentrations from upstream to downstream along the Little Susitna transect with increasing inputs from groundwater or tributaries draining granitic bedrock (Figure 6). For example, Ca2+, , and REE concentrations increased steadily along the transect, suggesting weathering and groundwater inputs are increasingly important at the downstream sections of the river. Trace element concentrations, including As, were high at LS1.5 during May and September, suggesting snowmelt- and precipitation-driven flushing during these months. The Little Susitna samples had the least negative δ2H and δ18O values (Figure 7), possibly reflecting the low glacier coverage, relatively low elevation, and proximity to the Pacific Ocean. Due to the similarity in bedrock in the adjacent Moose Creek watershed, the Moose Creek samples were nearest to the Little Susitna samples in the LDA plot (Figure 2) and bivariate plots (Figure 3). Generally, the Little Susitna and Moose Creek streams had relatively low major ion concentrations and high trace element concentrations due to the igneous bedrock.
The Matanuska and Knik rivers had similar water chemistry because the watersheds both contain predominantly sedimentary rocks. Samples from the two rivers overlapped in LD2 vs. LD1 space (Figure 2) and in the bivariate plots (Figure 3). Yet there were some notable differences in water chemistry between the two rivers, likely because the Matanuska watershed also contains some igneous and metamorphic rocks. For example, the Matanuska River had higher Rb, , and Se concentrations relative to the Knik River (Figure 3). The rivers were also separated in the plot of δ2H and δ18O (Figure 7), which shows the Matanuska samples plotting more negatively than the Knik samples. Notably, As concentrations in the Matanuska River were consistently highest near the glacier and lower downstream, indicating that high-elevation sources such as atmospheric deposition to glaciers and snowpack may be the primary source of As (Figure 4). In contrast, the Knik River showed increasing As concentrations with distance from the glacier, suggesting that downstream sources contribute to metal enrichment (Figure 5).
Water chemistry in the watersheds was not perfectly explained by bedrock type or glacier coverage. The Canwell watershed contains mixed igneous and metamorphic rocks, for example, but the Canwell samples overlapped in LDA space with samples from the sedimentary-dominated Matanuska and Knik watersheds (Figure 2). The Gulkana watershed contains mainly igneous rocks, with a high fraction of glacier coverage, yet the Gulkana samples plotted between Canwell (mixed bedrock with moderate glacier coverage) and Moose Creek (sedimentary bedrock with low glacier coverage) watersheds. Multiple complex factors affect the geochemical signature of a stream, highlighting the need to consider additional processes beyond bedrock type, and glacier coverage when interpreting water chemistry in glaciated watersheds.
Groundwater inputs regulate the geochemical composition of glacial rivers, shaping water chemistry across these watersheds. Studies of glacial watersheds often consider glaciers as the primary water source and determinant of water chemistry (Beamer et al., 2016). However, our dataset demonstrates that groundwater may have an equal or greater impact on water chemistry in glacial rivers, especially as glaciers continue to recede. This observation is supported by the influence of bedrock type on water chemistry (described in Section 4.1) and by comparison with groundwater endmember chemistry (described below). Subglacial water, defined as meltwater that interacts with underlying bedrock and groundwater beneath the glacier, also impacts water chemistry near the glaciers.
The influence of groundwater on stream geochemistry varied across watersheds. Although we did not conduct a quantitative mixing analysis, comparisons with glacier and groundwater endmember samples in PC space (Figure 8), and with water stable isotope values (Figure 9) suggest the Knik and Matanuska Rivers were the least influenced by groundwater, while the Little Susitna River exhibited the strongest influence from groundwater. In the Knik watershed, mainstem river samples (K2, K3, and K4) plotted near the glacial/precipitation endmembers in the PCA plot, implying dominant glacier inputs. However, the stable isotopes indicate that groundwater still played a significant role as K2 and K3 plotted near the spring endmembers (Figure 9). In the PCA plot, the Little Susitna river samples plotted along a gradient with upstream samples (LS1, LS1.5) near the glacier endmember samples and the downstream samples (LS2, LS3, and LS4) further to the right with groundwater (Figure 8). The isotope data (Figure 9) also highlight this trend, with Little Susitna river samples clustering near spring endmembers. In contrast, the Matanuska River, with the lowest δ2H and δ18O values (Figure 7), showed the strongest glacial influence. The Castner, Gulkana, and Canwell samples generally plotted between the glacial and spring endmembers in PC space (Figure 8), with Castner samples closer to the subglacial endmember and Gulkana and Canwell samples closer to the glacial/precipitation endmembers, suggesting that the streams contain a mixture of meltwater and groundwater. Similarly, in the isotope plot (Figure 9), most of the Gulkana and Canwell samples plotted along a gradient between the supraglacial and subglacial endmembers. Notably, none of the mainstem river samples in any of the watersheds plotted directly over the glacial/precipitation endmembers in the PCA or isotope plots, suggesting that groundwater is a key contributor to water chemistry and quantity, even in highly glaciated watersheds.
Trace elements and major ions are mobilized through the interaction of groundwater with moraine, sediment, soil, and bedrock, influencing the geochemical composition of glacial streams. These changes in water chemistry may have ecological and water management implications (Cooper et al., 2002; Kilchmann et al., 2004; Hood et al., 2009). Elevated U concentrations in Castner Creek are likely sourced from subsurface bedrock weathering via subglacial channels, while relatively high Rb concentrations in the Little Susitna, Moose Creek, and Castner watersheds are likely sourced from igneous and metamorphic bedrock, as suggested in other watersheds with similar bedrock type (Morales-Arredondo et al., 2022). Similarly, Cs concentrations were particularly elevated in Little Susitna, likely due to interactions between groundwater and granite bedrock. These trace element patterns underscore how bedrock variability, subsurface processes, and water sources collectively shape the geochemical signatures of Southcentral Alaskan Rivers. As glaciers recede, groundwater-fed streams may be less diluted by glacial meltwater during summer, leading to elevated trace element concentrations that pose risks to aquatic ecosystems and drinking water supplies (Li et al., 2024). Understanding the spatial and temporal variability of groundwater inputs is crucial for managing water quality in this region as it undergoes rapid glacial retreat.
As watersheds transition from glacial- to groundwater-dominated, they may also shift from acting as carbon sources to carbon sinks, depending on the dominant weathering and hydrological processes. However, the groundwater and meltwater contributions to CO2 fluxes remain poorly quantified (Zhang and Planavsky, 2019). Whereas, subglacial chemical weathering may generate significant CO2 sources or sinks, the interaction of groundwater with these processes and its downstream impact on CO2 fluxes is still unclear (Zhang and Planavsky, 2019; Christiansen et al., 2021). Additionally, carbon fluxes may shift along a transect depending on lithology and hydrological inputs. For example, in the Matanuska River watershed, the system transitions from a source to a sink of CO2 as the underlying bedrock changes from carbonate- to silicate-dominated rocks, with net sequestration of CO2, and the potential for this to change to a CO2 source as the Matanuska and other glaciers recede (Pappala et al., 2023). Understanding the subglacial processes combined with the impact of groundwater would lead to more accurate estimates of CO2 contributions along river transects. For example, the Little Susitna shifts from being predominantly glacially sourced to groundwater sourced along the river transect (Figures 8, 9). This shift in water source likely creates a transition in carbon fluxes, influenced by differences in weathering reactions between glacial meltwater and groundwater. While bedrock composition plays a major role in determining whether a watershed acts as a CO2 source or sink, the proportional contributions of different endmembers (glacier meltwater, precipitation, and groundwater) likely modulate this effect over time and space. The extent to which these shifts in endmember sourcing impact carbon fluxes remains uncertain, highlighting the need for future studies to quantify the evolving contributions of different water sources to CO2 fluxes in glacial watersheds. Our dataset provides a foundation for identifying how these processes interact and their role in regional carbon cycling. Although our study provides only a snapshot of groundwater and glacial inputs, these findings underscore the need for future work to quantify their contributions to regional carbon cycling and hydrology, particularly with ongoing glacier retreat and evolving hydrological regimes in Southcentral Alaska.
Trace and major element concentrations were relatively consistent over the two sampling seasons (2022 and 2023) despite differences in snowpack, precipitation, and air temperature. While having 2 years of data allowed us to verify trends in chemistry, the relatively short time frame limits our ability to observe how these trends may change over longer periods as glacier coverage decreases (Hugonnet et al., 2021). Establishing long-term monitoring programs would provide valuable insights into the seasonal and annual changes in water chemistry and how factors such as glacial retreat, changing precipitation patterns, and groundwater contributions influence the evolving geochemical and hydrological dynamics of these systems. These programs would also allow for the collection of load and area-adjusted load data, which would enhance our ability to characterize weathering processes in this region.
Our study highlights important but unresolved processes that warrant further investigation to understand watershed dynamics. For instance, further study is needed to determine why the Matanuska watershed shows limited groundwater contributions and relatively low δ2H and δ18O values, a pattern distinct from other watersheds in the region, which seem to exhibit larger contributions from groundwater (Figures 7, 9). Combining detailed isotopic analyses with hydrogeological studies could better quantify contributions from glacial meltwater, groundwater, and surface water in the watershed. Additionally, As concentrations were elevated in the upper reaches of the Matanuska and Little Susitna watersheds, especially during the beginning and end of the sampling period (May and September) both years (Figures 4, 6). Investigating the sources and mechanisms driving these elevated values would help clarify the geochemical processes operating in these watersheds.
Quantifying the role of groundwater in glaciated watersheds is essential for understanding how watersheds will evolve as glacial melt diminishes. Incorporating isotopic tracing methods, such as δ18O and δ2H analyses, age dating from radon (Adyasari et al., 2023) or tritium (Telloli et al., 2022), and carbon flux estimates over river transects, would improve our ability to quantify groundwater contributions and understand how alpine watersheds change over time. These approaches, integrated with long-term monitoring, would allow for a better understanding of seasonal and annual variations in groundwater influence, and the broader implications for water resources, weathering processes, carbon cycling, and water quality.
The original contributions presented in the study are publicly available. This data can be found here: HydroShare repository, https://doi.org/10.4211/hs.68cfd9f523794370bf1b750d48f05a90.
MC: Conceptualization, Data curation, Formal analysis, Investigation, Methodology, Validation, Visualization, Writing – original draft, Writing – review & editing. GC: Conceptualization, Data curation, Formal analysis, Funding acquisition, Investigation, Methodology, Project administration, Resources, Supervision, Validation, Visualization, Writing – original draft, Writing – review & editing. LM: Conceptualization, Methodology, Supervision, Writing – review & editing. JJ: Conceptualization, Methodology, Visualization, Writing – review & editing. BB: Visualization, Writing – review & editing. KR: Methodology, Writing – review & editing. AT: Investigation, Methodology, Visualization, Writing – review & editing. DF: Methodology, Writing – review & editing. AB: Investigation, Writing – review & editing. TG: Visualization, Writing – review & editing.
The author(s) declare that financial support was received for the research and/or publication of this article. Funding for this work was provided by the U.S. National Science Foundation Critical Zone Network (CZNet) grant EAR-2012093. Any opinions, findings and conclusions or recommendations expressed are those of the authors and do not necessarily reflect the views of the National Science Foundation.
The authors declare that the research was conducted in the absence of any commercial or financial relationships that could be construed as a potential conflict of interest.
The author(s) declare that no Gen AI was used in the creation of this manuscript.
All claims expressed in this article are solely those of the authors and do not necessarily represent those of their affiliated organizations, or those of the publisher, the editors and the reviewers. Any product that may be evaluated in this article, or claim that may be made by its manufacturer, is not guaranteed or endorsed by the publisher.
The Supplementary Material for this article can be found online at: https://www.frontiersin.org/articles/10.3389/frwa.2025.1569267/full#supplementary-material
ACRC (2022). Alaska Climate Research Center Annual Report 2022. Fairbanks: Alaska Climate Research Center, The Alaska State Climate Center.
ACRC (2023). Alaska Climate Research Center Annual Report 2023. Fairbanks: Alaska Climate Research Center, The Alaska State Climate Center.
Adyasari, D., Dimova, N. T., Dulai, H., Gilfedder, B. S., Cartwright, I., Mckenzie, T., et al. (2023). Radon-222 as a groundwater discharge tracer to surface waters. Earth Sci. Rev. 238:104321. doi: 10.1016/j.earscirev.2023.104321
Barkdull, N. S., Carling, G. T., Fernandez, D. P., Nelson, S. T., Bickmore, B. R., Tingey, D. G., et al. (2021). Glaciers control the hydrogeochemistry of proglacial streams during late summer in the wind river range, Wyoming, United States. Front. Earth Sci. 9:727575. doi: 10.3389/feart.2021.727575
Beamer, J. P., Hill, D. F., Arendt, A., and Liston, G. E. (2016). High-resolution modeling of coastal freshwater discharge and glacier mass balance in the gulf of Alaska watershed. Water Resour. Res. 52, 3888–3909. doi: 10.1002/2015WR018457
Brennan, S. R., Fernandez, D. P., Mackey, G., Cerling, T. E., Bataille, C. P., Bowen, G. J., et al. (2014). Strontium isotope variation and carbonate versus silicate weathering in rivers from across Alaska: implications for provenance studies. Chem. Geol. 389, 167–181. doi: 10.1016/j.chemgeo.2014.08.018
Bryant, M. D. (2009). Global climate change and potential effects on Pacific salmonids in freshwater ecosystems of southeast Alaska. Clim. Change 95, 169–193. doi: 10.1007/s10584-008-9530-x
Carling, G. T., Rupper, S. B., Fernandez, D. P., Tingey, D. G., and Harrison, C. B. (2017). Effect of atmospheric deposition and weathering on trace element concentrations in glacial meltwater at grand teton national park, Wyoming, U.S.A. Arct. Antarct. Alp. Res. 49, 427–440. doi: 10.1657/AAAR0016.071
Chaloner, D. T., Lamberti, G. A., Cak, A. D., Blair, N. L., and Edwards, R. T. (2007). Inter-annual variation in responses of water chemistry and epilithon to Pacific salmon spawners in an Alaskan stream. Freshw. Biol. 52, 478–490. doi: 10.1111/j.1365-2427.2006.01715.x
Christiansen, J. R., Röckmann, T., Popa, M. E., Sapart, C. J., and Jørgensen, C. J. (2021). Carbon emissions from the edge of the greenland ice sheet reveal subglacial processes of methane and carbon dioxide turnover. J. Geophys. Res. Biogeosci. 126:e2021JG006308. doi: 10.1029/2021JG006308
Coombs, M., and Carling, G. T. (2025). Water Chemistry from Southcentral Alaska Glacial Watersheds. Arlington: Hydroshare. doi: 10.4211/hs.68cfd9f523794370bf1b750d48f05a90
Cooper, R. J., Wadham, J. L., Tranter, M., Hodgkins, R., and Peters, N. E. (2002). Groundwater hydrochemistry in the active layer of the proglacial zone, Finsterwalderbreen, Svalbard. J. Hydrol. 269, 208–223. doi: 10.1016/S0022-1694(02)00279-2
Ensminger, S. L., Alley, R. B., Evenson, E. B., Lawson, D. E., and Larson, G. J. (2001). Basal-crevasse-fill origin of laminated debris bands at Matanuska Glacier, Alaska, U.S.A. J. Glaciol. 47, 412–422. doi: 10.3189/172756501781832007
EPA (1994). Method 200.7, Revision 4.4: Determination of Metals and Trace Elements in Water and Wastes by Inductively Coupled Plasma-Atomic Emission Spectrometry. Cincinnati, OH: U.S. Environmental Protection Agency Office of Water.
EPA (1997). Method 1640: Determination of Trace Elements in Water by Preconcentration and Inductively Coupled Plasma-Mass Spectrometry. Washington, DC: U.S. Environmental Protection Agency Office of Water.
Evenson, D. (2024). Gulf of Alaska Chinook Salmon: Endangered Species Act Status Review Key Points. Juneau: Alaska Department of Fish and Game.
Fellman, J. B., Hood, E., Dryer, W., and Pyare, S. (2015). Stream physical characteristics impact habitat quality for pacific salmon in two temperate coastal watersheds. PLoS ONE 10:e0132652. doi: 10.1371/journal.pone.0132652
Fortner, S. K., Mark, B. G., Mckenzie, J. M., Bury, J., Trierweiler, A., Baraer, M., et al. (2011). Elevated stream trace and minor element concentrations in the foreland of receding tropical glaciers. Appl. Geochem. 26, 1792–1801. doi: 10.1016/j.apgeochem.2011.06.003
Fortner, S. K., Tranter, M., Fountain, A., Lyons, W. B., and Welch, K. A. (2005). The Geochemistry of supraglacial streams of Canada glacier, Taylor Valley (Antarctica), and their evolution into proglacial waters. Aquat. Geochem. 11, 391–412. doi: 10.1007/s10498-004-7373-2
He, Z., Unger-Shayesteh, K., Vorogushyn, S., Weise, S. M., Duethmann, D., Kalashnikova, O., et al. (2020). Comparing Bayesian and traditional end-member mixing approaches for hydrograph separation in a glacierized basin. Hydrol. Earth Syst. Sci. 24, 3289–3309. doi: 10.5194/hess-24-3289-2020
Hood, E., Fellman, J., Spencer, R. G. M., Hernes, P. J., Edwards, R., D'amore, D., et al. (2009). Glaciers as a source of ancient and labile organic matter to the marine environment. Nature 462, 1044–1047. doi: 10.1038/nature08580
Hood, E., and Scott, D. (2008). Riverine organic matter and nutrients in southeast Alaska affected by glacial coverage. Nat. Geosci. 1, 583–587. doi: 10.1038/ngeo280
Hugonnet, R., Mcnabb, R., Berthier, E., and Al, E. (2021). Accelerated global glacier mass loss in the early twenty-first century. Nature 592, 726–731. doi: 10.1038/s41586-021-03436-z
Huss, M., and Hock, R. (2018). Global-scale hydrological response to future glacier mass loss. Nature Clim. Change 8, 135–140. doi: 10.1038/s41558-017-0049-x
Immerzeel, W. W., Pellicciotti, F., and Bierkens, M. F. P. (2013). Rising river flows throughout the twenty-first century in two Himalayan glacierized watersheds. Nat. Geosci. 6, 742–745. doi: 10.1038/ngeo1896
Jenckes, J., Muñoz, S., Ibarra, D. E., Boutt, D. F., and Munk, L. A. (2024). Geochemical weathering variability in high latitude watersheds of the gulf of Alaska. J. Geophys. Res. Earth Surf. 129:e2023JF007284. doi: 10.1029/2023JF007284
Kilchmann, S., Waber, H. N., Parriaux, A., and Bensimon, M. (2004). Natural tracers in recent groundwaters from different Alpine aquifers. Hydrogeol. J. 12, 643–661. doi: 10.1007/s10040-004-0366-9
Li, Z., Sun, P., Zhang, C., Zhu, N., Xu, N., Li, D., et al. (2024). Translocation and transformation of uranium along the aquatic food chain: new insights into uranium risks to the environment. J. Hazard. Mater. 478:135499. doi: 10.1016/j.jhazmat.2024.135499
Littell, J. S., Mcafee, S. A., and Hayward, G. D. (2018). Alaska snowpack response to climate change: statewide snowfall equivalent and snowpack water scenarios. Water 10:668. doi: 10.3390/w10050668
Liu, X., Dong, Z., Wei, T., Wang, L., Gao, W., Jiao, X., et al. (2024). Composition, distribution, and risk assessment of heavy metals in large-scale river water on the Tibetan plateau. J. Hazard. Mater. 476:135094. doi: 10.1016/j.jhazmat.2024.135094
Maurya, P. K., Malik, D. S., Yadav, K. K., Kumar, A., Kumar, S., and Kamyab, H. (2019). Bioaccumulation and potential sources of heavy metal contamination in fish species in river Ganga basin: possible human health risks evaluation. Toxicol. Rep. 6, 472–481. doi: 10.1016/j.toxrep.2019.05.012
Milner, A. M., Khamis, K., Battin, T. J., Brittain, J. E., Barrand, N. E., Füreder, L., et al. (2017). Glacier shrinkage driving global changes in downstream systems. Proc. Nat. Acad. Sci. 114, 9770–9778. doi: 10.1073/pnas.1619807114
Miner, K. R., Kreutz, K. J., Jain, S., Campbell, S., and Liljedahl, A. (2019). A screening-level approach to quantifying risk from glacial release of organochlorine pollutants in the Alaskan Arctic. J. Expo. Sci. Environ. Epidemiol. 29, 293–301. doi: 10.1038/s41370-018-0100-7
Morales-Arredondo, J. I., Armienta Hernández, M. A., Cuellar-Ramírez, E., Morton-Bermea, O., and Ortega-Gutiérrez, J. E. (2022). Hydrogeochemical behavior of Ba, B, Rb, and Sr in an urban aquifer located in central Mexico and its environmental implications. J. South Am. Earth Sci. 116:103870. doi: 10.1016/j.jsames.2022.103870
Morrissey, C. A., Bendell-Young, L. I., and Elliott, J. E. (2005). Identifying Sources and Biomagnification of persistent organic contaminants in biota from mountain streams of southwestern British Columbia, Canada. Environ. Sci. Technol. 39, 8090–8098. doi: 10.1021/es050431n
Muñoz, S., Jenckes, J., Ramos, E. J., Munk, L. A., and Ibarra, D. E. (2024). Hydrologic and Landscape controls on rock weathering along a glacial gradient in south central Alaska, USA. J. Geophys. Res. Earth Surf. 129:e2023JF007255. doi: 10.1029/2023JF007255
Olson, E. J., Welp, L. R., Frisbee, M. D., Zúñiga Medina, S. A., Alvarez-Campos, O., Roque Quispe, W. R., et al. (2024). Spatially heterogeneous discharge of glacial meltwater to drainages surrounding the ablating Coropuna ice cap, Peruvian Andes. Hydrol. Sci. J. 69, 1113–1129. doi: 10.1080/02626667.2024.2352522
Pappala, V. S., Arendt, C. A., and Harmon, R. S. (2023). Spatial characterization of chemical weathering in a proglacial river system, southcentral Alaska. Chem. Geol. 629, 121462. doi: 10.1016/j.chemgeo.2023.121462
Pawlak, F., Koziol, K., and Polkowska, Z. (2021). Chemical hazard in glacial melt? The glacial system as a secondary source of POPs (in the northern Hemisphere). A systematic review. Sci. Total Environ. 778:145244. doi: 10.1016/j.scitotenv.2021.145244
Pitman, K. J., Moore, J. W., Huss, M., Sloat, M. R., Whited, D. C., Beechie, T. J., et al. (2021). Glacier retreat creating new Pacific salmon habitat in western north America. Nat. Commun. 12:6816. doi: 10.1038/s41467-021-26897-2
RGI (2023). Randolph Glacier Inventory - A Dataset of Global Glacier Outlines (NSIDC-0770, Version 7.0). RGIConsortium. Boulder, CO: National Snow and Ice Data Center. Available online at: https://nsidc.org/data/nsidc-0770/versions/7
Rowan, A. V. (2018). Mountain glaciers under a changing climate. Geol. Today 34, 134–139. doi: 10.1111/gto.12233
Sergeant, C. J., Falke, J. A., Bellmore, R. A., Bellmore, J. R., and Crumley, R. L. (2020). A classification of streamflow patterns across the coastal gulf of Alaska. Water Res. Res. 56:e2019WR026127. doi: 10.1029/2019WR026127
Shanley, C. S., Pyare, S., Goldstein, M. I., Alaback, P. B., Albert, D. M., Beier, C. M., et al. (2015). Climate change implications in the northern coastal temperate rainforest of north America. Clim. Change 130, 155–170. doi: 10.1007/s10584-015-1355-9
Sorg, A., Huss, M., Rohrer, M., and Stoffel, M. (2014). The days of plenty might soon be over in glacierized central Asian catchments. Environ. Res. Lett. 9:104018. doi: 10.1088/1748-9326/9/10/104018
Staniszewska, K. J., Cooke, C. A., and Reyes, A. V. (2021). Quantifying meltwater sources and contaminant fluxes from the Athabasca Glacier, Canada. ACS Earth Space Chem. 5, 23–32. doi: 10.1021/acsearthspacechem.0c00256
Staniszewska, K. J., Reyes, A. V., and Cooke, C. A. (2023). Glacial erosion drives high summer mercury exports from the Yukon river, Canada. Environ. Sci. Technol. Lett. 10, 1117–1124. doi: 10.1021/acs.estlett.3c00427
Streit, B., Braunbeck, T., Hinton, D. E., and Streit, B. (1998). Bioaccumulation of contaminants in fish. Fish Ecotoxicol. 86, 353–387. doi: 10.1007/978-3-0348-8853-0_12
Telloli, C., Rizzo, A., Salvi, S., Pozzobon, A., Marrocchino, E., and Vaccaro, C. (2022). Characterization of groundwater recharge through tritium measurements. Adv. Geosci. 57, 21–36. doi: 10.5194/adgeo-57-21-2022
U.S.G.S. (2019). U.S. Geological Survey National Hydrography Dataset (ver. USGS National Hydrography Dataset Best resolution (NHD) for Hydrologic Unit (HU). Reston.
Wilson, F. H., Hults, C., Mull, C. G., and Karl, S. M. (2015). Geologic Map of Alaska: U.S. Geological Survey Scientific Investigations Map 3340. Reston, VA: U.S. Geological Survey.
Wu, R., Dong, Z., Cheng, X., Brahney, J., Jiao, X., and Wu, L. (2022). Heavy metal levels and sources in suspended particulate matters of the glacier watersheds in northeast Tibetan plateau. Front. Environ. Sci. 10:918514. doi: 10.3389/fenvs.2022.918514
Keywords: glacial rivers, trace element chemistry, water isotopes, bedrock type, glacier coverage, groundwater, Alaska
Citation: Coombs M, Carling GT, Munk LA, Jenckes J, Bickmore BR, Rey KA, Thompson AN, Fernandez DP, Bergstrom A and Gomez T (2025) Water chemistry of Alaskan glacial rivers is affected by glacier coverage, bedrock type, and groundwater inputs. Front. Water 7:1569267. doi: 10.3389/frwa.2025.1569267
Received: 31 January 2025; Accepted: 14 March 2025;
Published: 10 April 2025.
Edited by:
Rayees Ahmed, Indian Institute of Science (IISc), IndiaReviewed by:
Ayaz Mohmood Dar, Indian Institute of Science (IISc), IndiaCopyright © 2025 Coombs, Carling, Munk, Jenckes, Bickmore, Rey, Thompson, Fernandez, Bergstrom and Gomez. This is an open-access article distributed under the terms of the Creative Commons Attribution License (CC BY). The use, distribution or reproduction in other forums is permitted, provided the original author(s) and the copyright owner(s) are credited and that the original publication in this journal is cited, in accordance with accepted academic practice. No use, distribution or reproduction is permitted which does not comply with these terms.
*Correspondence: Gregory T. Carling, Z3JlZy5jYXJsaW5nQGJ5dS5lZHU=
Disclaimer: All claims expressed in this article are solely those of the authors and do not necessarily represent those of their affiliated organizations, or those of the publisher, the editors and the reviewers. Any product that may be evaluated in this article or claim that may be made by its manufacturer is not guaranteed or endorsed by the publisher.
Research integrity at Frontiers
Learn more about the work of our research integrity team to safeguard the quality of each article we publish.