
94% of researchers rate our articles as excellent or good
Learn more about the work of our research integrity team to safeguard the quality of each article we publish.
Find out more
BRIEF RESEARCH REPORT article
Front. Water, 14 April 2025
Sec. Water Resource Management
Volume 7 - 2025 | https://doi.org/10.3389/frwa.2025.1567826
This article is part of the Research TopicAdvancements and Challenges in Sustainable Water Desalination TechnologiesView all 3 articles
 Amr Mohamed Mahmoud1*
 Sultan Ahmed1
 Aleksejs Zolotarjovs2
 Ahmed S. Alghamdi1Girts Ozolins2Gatis Tunens2
Membrane biofouling is one of the most persistent challenges faced by desalination plants, particularly those utilizing reverse osmosis (RO) technology. Addressing this issue is crucial to reduce maintenance costs, improve efficiency, and extend the lifespan of membranes. This study introduces SpectroMarine, an advanced optical water quality sensor that provides real-time data on organic content and biomass levels, enabling desalination operators to take proactive measures for key water quality parameters such as chlorophyll, total organic carbon and oxidization agent to prevent biofouling. The sensor combines fluorescence and absorption spectroscopy with Internet of Things (IoT) integration, offering immediate analytics and actionable insights. Field tests demonstrated significant potential for reducing operational costs, reducing energy consumption, and optimizing chemical use according to the water quality, ultimately enhancing plant performance. This paper discusses the sensor’s design, application, and outcomes, providing a roadmap for revolutionizing water quality monitoring in desalination plants.
Desalination is crucial in mitigating global water scarcity, with over 300 million people worldwide relying on desalinated water for daily use. As of 2023, more than 22,000 desalination plants produce approximately 110 million cubic meters of fresh water daily, significantly bolstering water supplies in arid regions. Notably, the Middle East depends on desalination for over 50% of its total water consumption (Mahmoud et al., 2017; Mohamed et al., 2013).
However, membrane biofouling—caused by the accumulation of microorganisms and organic materials—poses a persistent operational challenge, leading to increased energy consumption, frequent chemical cleaning, and reduced membrane lifespan. Traditional monitoring methods, such as heterotrophic plate counts (HPC) and flow cytometry, are limited by delayed results, labor-intensive processes, and inconsistent accuracy due to factors like bacterial clumping (Bruijs, 2019; Zhang and Fu, 2019). These limitations necessitate innovative solutions for real-time monitoring and efficient intervention.
Membrane biofouling presents significant economic and environmental challenges, particularly in industries reliant on membrane technologies such as desalination and wastewater treatment. Economically, biofouling leads to increased operational costs due to heightened energy consumption, maintenance, and membrane replacement. Environmentally, it contributes to elevated greenhouse gas emissions and necessitates the use of chemical cleaning agents, which can have adverse ecological effects.
The accumulation of biofouling on membrane surfaces escalates energy demands. For instance, in seawater reverse osmosis (SWRO) desalination plants, biofouling can cause a decline in permeate flux, leading to increased operational pressures and, consequently, higher energy consumption. This not only raises operational costs but also shortens membrane lifespan, necessitating more frequent replacements and increasing capital expenditures (Shin et al., 2018).
A study focusing on the U.S. Navy’s Arleigh Burke-class destroyers (DDG-51) highlighted that hull fouling, a form of biofouling, resulted in an estimated additional fuel cost of $56 million annually for the entire class, totaling approximately $1 billion over 15 years. This underscores the substantial financial burden biofouling imposes due to increased fuel consumption and maintenance requirements (Schultz et al., 2011).
The environmental repercussions of biofouling are equally concerning. Increased energy consumption directly correlates with higher greenhouse gas emissions. For example, biofouling in heat exchangers can lead to a 10% increase in fuel usage, corresponding to approximately 88 million tons of CO₂ emissions annually in oil refinery operations alone (Andersson et al., 2021).
Moreover, the prevalent use of chemical agents for biofouling mitigation poses environmental hazards. These chemicals can lead to seawater pollution, adversely affecting marine ecosystems. The disposal of biofouling residues, which may contain harmful bacteria and other microbial particles, further exacerbates environmental pollution and health risks (Andersson et al., 2021).
Given these substantial economic and environmental impacts, there is a pressing need for advanced monitoring solutions to detect and control biofouling effectively. Implementing real-time monitoring can facilitate timely interventions, thereby reducing energy consumption, operational costs, and environmental footprints associated with biofouling.
SpectroMarine represents a novel advancement in water quality monitoring. Unlike existing technologies, such as flow cytometry and online turbidity sensors, which often require regular calibration and frequent maintenance, SpectroMarine demands minimal upkeep. Field tests have shown that the sensor operates effectively for over 5 months without requiring cleaning. When necessary, simple wipe cleaning of the sensor window is sufficient to restore full functionality, making it highly cost-effective and user-friendly. This durability and low-maintenance design sets it apart from other monitoring solutions and contributes to its operational reliability (Baker and Dudley, 1998).
The sensor combines fluorescence excitation-emission matrix (EEM) spectroscopy with IoT integration to deliver continuous, real-time data on critical water quality parameters, such as dissolved organic matter (DOM), total organic carbon (TOC), chlorophyll, hydrocarbons and other parameters. Its modular design opens avenues for future enhancements, including monitoring additional parameters like pH, CO2 levels, and other chemical compositions (Flemming, 1997).
Furthermore, integrating artificial intelligence (AI) into its software platform can enable predictive analytics and automated system control, optimizing desalination processes holistically. These features highlight the sensor’s scalability and potential for revolutionizing water quality management.
This paper explores the design and functionality of SpectroMarine, its integration into desalination plant operations, and the outcomes of preliminary field tests. By addressing the limitations of existing technologies and introducing AI-driven adaptability, SpectroMarine offers a transformative approach to water quality monitoring, reducing biofouling and enhancing the efficiency and sustainability of desalination plants.
The SpectroMarine sensor utilizes fluorescence and absorption spectroscopy to measure critical water quality parameters, including dissolved organic matter (DOM), total organic carbon (TOC), humic substances, algae, and particulate matter. The system is designed with two primary components:
1. Hardware: a portable device designed for full-spectrum optical measurements at multiple excitation wavelengths. Its compact structure offers versatility for various applications beyond desalination, enabling seamless integration across multiple platforms, including ships, floating structures, and desalination facilities of different scales.
2. Automated data analysis: a data collection and automated analysis server performing mathematical operations and comparative analysis to convert the raw readings to usable values.
3. Software Interface: an IoT-enabled dashboard that provides operators with real-time data visualization and actionable insights. The software supports remote monitoring and control via any desktop or mobile platforms with access to the internet or within a network.
The device is created with ease of deployment and user-friendliness in mind—a solid water-proof aluminum case prevents corrosion damage from harsh operation environments. Flat-window design prevents the device from algae growth, with the possibility of an automated cleaning solution with a mechanical brush. The device does not require any consumables or regular replacement components. Easily accessible mounting holes can be used to attach the device to the floating platforms, buoys and solid constructions. The device uses a single Cat.5e wire (up to 100 m) with a standard RJ45 Ethernet connector, and a standard POE+ infrastructure for power delivery commonly available in industrial network systems. The device is connected directly to the network, eliminating the need for any data loggers, additional power systems or manual data collection.
Figure 1 shows the sensor with the main components marked and the dashboard available in various platforms (desktop/tablet/mobile).
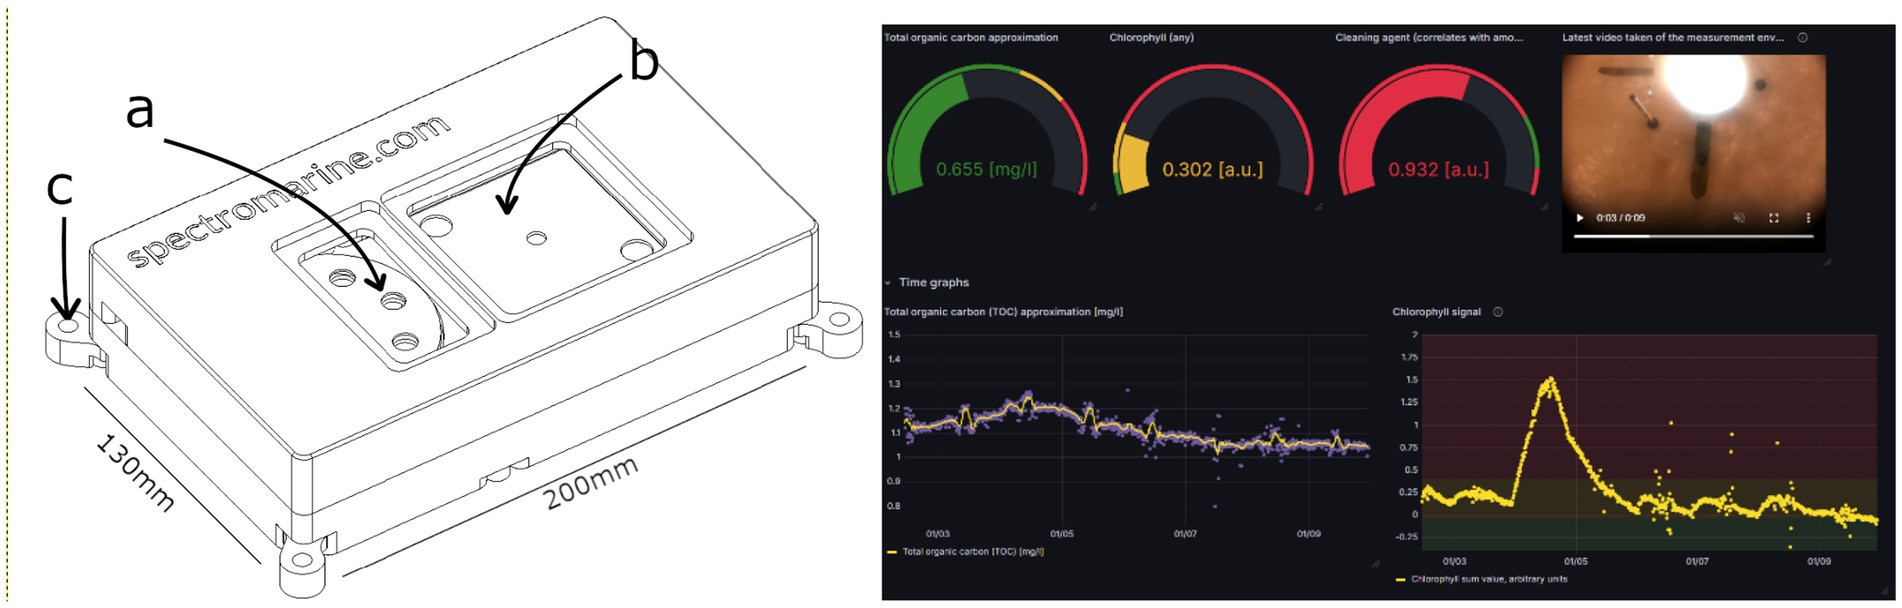
Figure 1. Left—SpectroMarine sensor schematic, a—detection window with spectrometers and CMOS camera, b—window with LEDs for fluorescence excitation, c—mounting holes. Right—part of user-accessible dashboard with live data from the sensor (or many sensors).
The sensor uses fluorescence as a main measurement method and is capable of providing data with a frequency of up to 10 s, enabling immediate detection of biofouling precursors. The device utilizes a range of LEDs with different wavelengths to excite the substances in the environment measuring the resulting fluorescence across the full visible light spectrum, rather than relying on some specific detection diodes. This full-spectrum measurement approach significantly enhances sensitivity and selectivity by capturing the complete emission profile of each substance, enabling more precise differentiation and quantification of waterborne compounds. For example, dissolved organic matter (DOM) exhibits fluorescence when excited at 240–280 nm (protein-like) or 300–350 nm (humic-like), emitting in the ranges of 350–450 nm and 400–500 nm, respectively. Similarly, chlorophyll-a, a key pigment in algae, exhibits fluorescence with excitation around 455 nm and emission near 680 nm. By capturing these excitation-emission profiles, the device offers superior accuracy in water quality analysis, detecting even trace amounts of contaminants. This enhanced sensitivity comes mainly from being able to analyze the full visible light spectral signal, which allows for peak analysis algorithms to process and distinguish multiple overlapping peaks as different signals. Commonly employed fluorescence-based devices like fluorometers rely on one or more photodiodes measuring signal (light) strength at a specific wavelength range characteristic to the photodiode, outputting a single calibrated number that is dependent on how much light the sensor absorbed within this wavelength range. This does not allow for qualitatively distinguishing overlapping signals due to the absence of spectral distribution profiles, and can create scenarios where external lighting or these other overlapping fluorescence emission peak profiles create false measurement results. Additionally, commonly measured emission signals in water (i.e., chlorophyll or phycobiliproteins) consist of an emission profile with multiple peaks at different wavelengths, forming a clear and characteristic signal distribution within a spectral measurement. Identifying these specific emission profiles allows reliable detection of the signal without false positives, as opposed to fluorometer type devices.
The optical sensor operates without the need for reagents, consumables, or regular maintenance, making it a cost-effective, low-maintenance solution for continuous water quality monitoring. Spectromarine technology leverages automatic spectral analysis, combining advanced algorithms for peak fitting, noise reduction, and background subtraction to ensure accurate detection and quantification of target substances. It integrates historical data analysis and comparison with extensive spectral databases, enabling robust identification of compounds and long-term monitoring trends with minimal user input. The entire process is fully automated, seamlessly performing data acquisition, processing, and analysis to provide the user with calibrated, real-time results without the need for manual adjustments or calibration. This streamlined approach ensures high accuracy, and reliability of readings—a crucial factor to ensure usability in process automation.
An example of such analysis for chlorophyll detection is shown in Figure 2—a spectrum measured with the Spectromarine device in the measurement chamber. Excited at 455 nm [Figure 2 (a)] the device utilizes a 600 nm high-pass filter to remove unwanted signal before 600 nm (e.g., fDOM) [edge of filter is seen in Figure 2 (b)]. The chlorophyll fluorescence is thus detected at 680 nm [Figure 2 (c)]. The reading is then automatically uploaded to the cloud and automated data analysis algorithms perform fitting procedures—first, the signal is isolated and background fitting is performed (Figure 2 insert red line), then background is subtracted from the signal and a peak fitting is performed to isolate chlorophyll signal (Figure 2 insert green line). An area sum (Figure 2 green area), is then presented to the user as a chlorophyll signal with possible calibration to convert from arbitrary units (a.u.) to the usable values (e.g., mg/L).
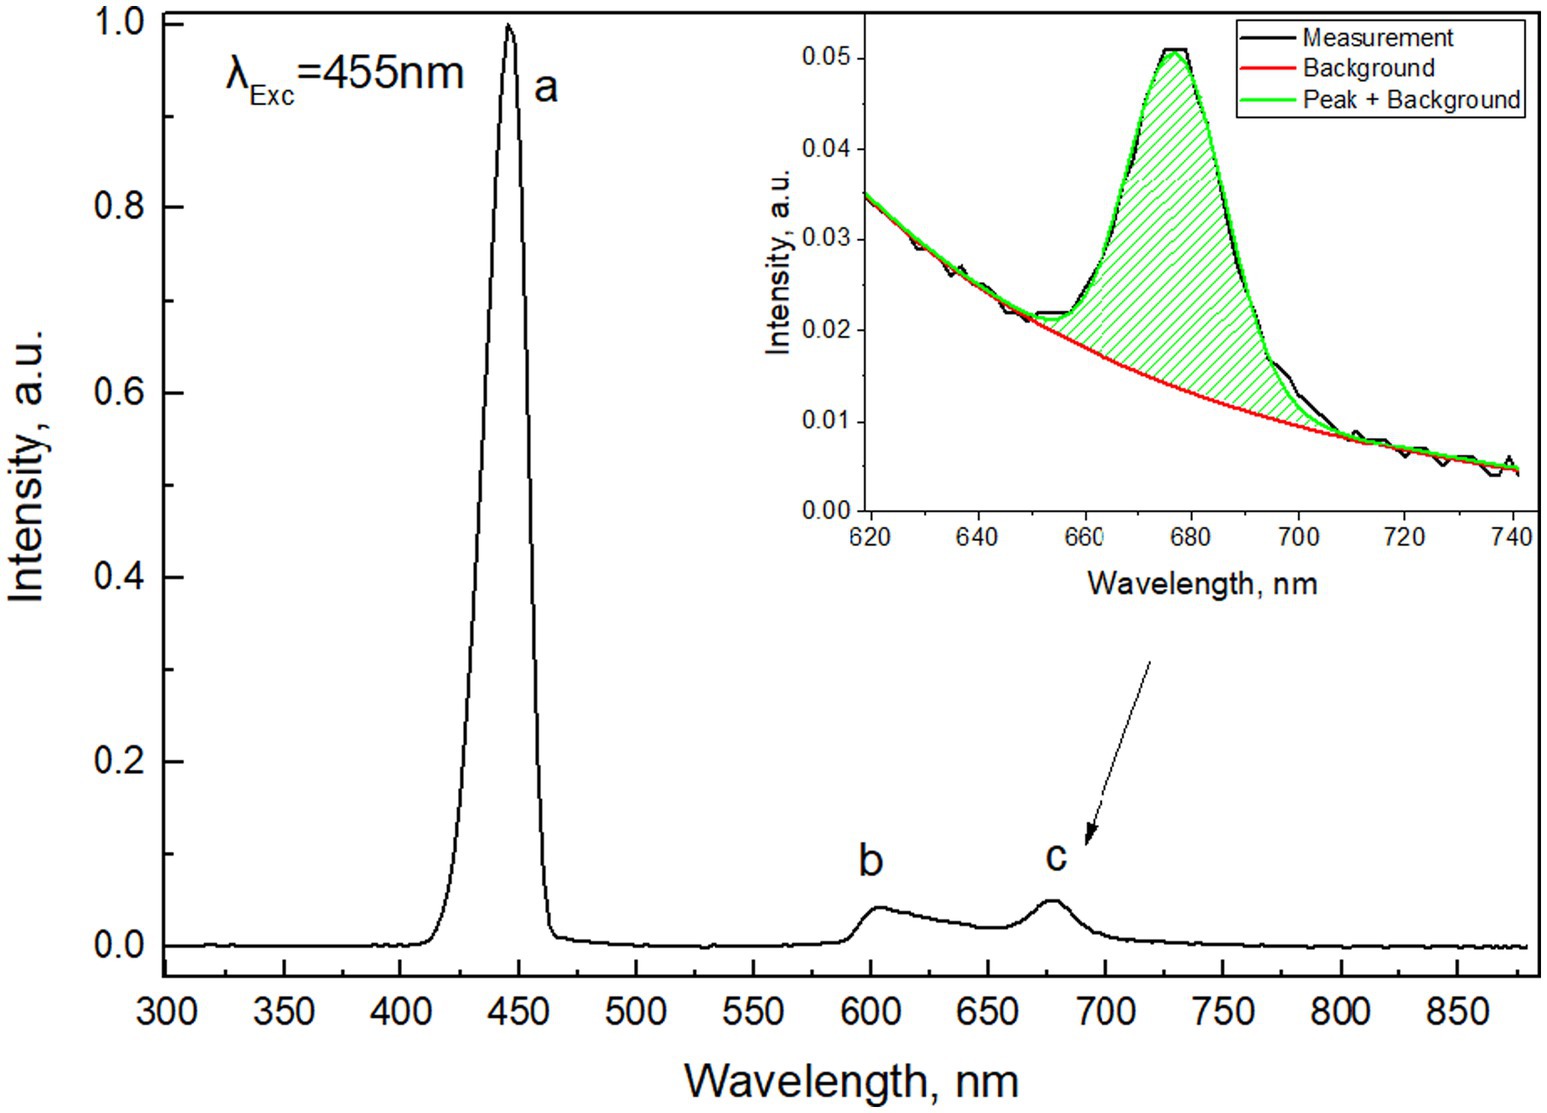
Figure 2. An example of SpectroMarine measurement in filtered water chamber. a—excitation peak, b—edge of 600 nm high-pass filter, c—chlorophyll fluorescence signal. Insert shows fitting and area calculation procedure for the data.
The sensor is strategically integrated into critical points of the desalination process, primarily during the pre-treatment stage. Key functionalities include real-time biofoulant detection, automatic alerts for water quality deterioration, and advanced data analytics to optimize chemical dosing and operational adjustments (Matin et al., 2011; Al-Ahmad et al., 2000).
Preliminary field tests were conducted at the Water Technologies Innovation Institute and Research Advancement (WTIIRA) in Jubail, Saudi Arabia. The sensor was installed at a pilot desalination facility (Figure 3) and monitored for 6 months. The seawater flows from the intake where NaOCl is dosed to control biofouling to a storage tank, then to pressurized media filters, storage tanks and then to the SWRO pilot units. The sensor was placed in the storage tanks before the SWRO pilot units. Tests were conducted for 6 months and the sensor was then retrieved from the tanks in a clean condition showing no signs of corrosion damage or biofouling damage (see Figure 4). Key findings include robust performance with minimal maintenance requirements, accurate detection of TOC and chlorophyll signals validated against laboratory measurements, and clear differentiation in chlorophyll levels during scenarios with and without NaOCl dosing (Vrouwenvelder et al., 2009). Figures 5, 6 illustrate the chlorophyll signal fluctuations and TOC measurements over the testing period.
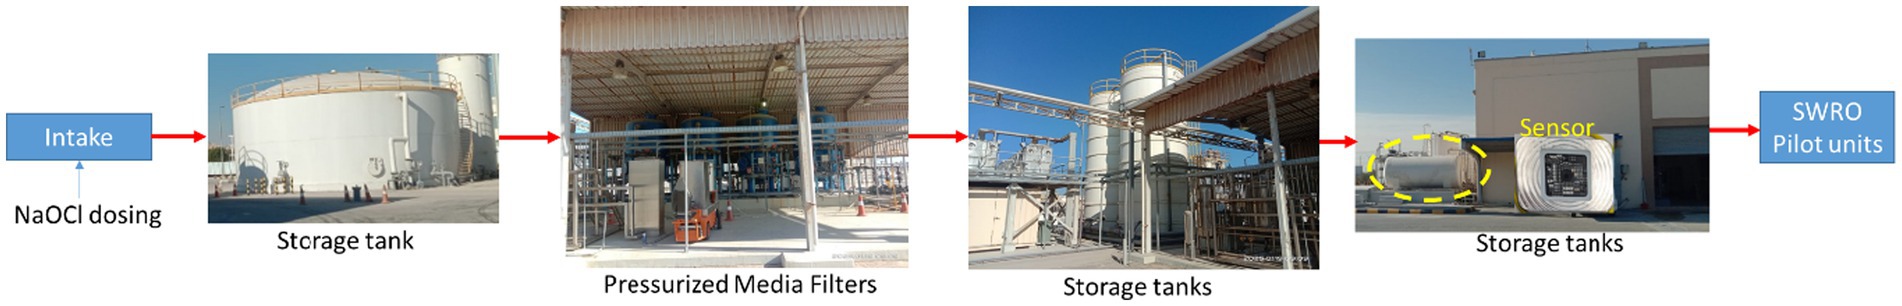
Figure 3. The flow path of seawater from the intake to the SWRO pilot units and the location where the SpectroMarine sensor was placed.
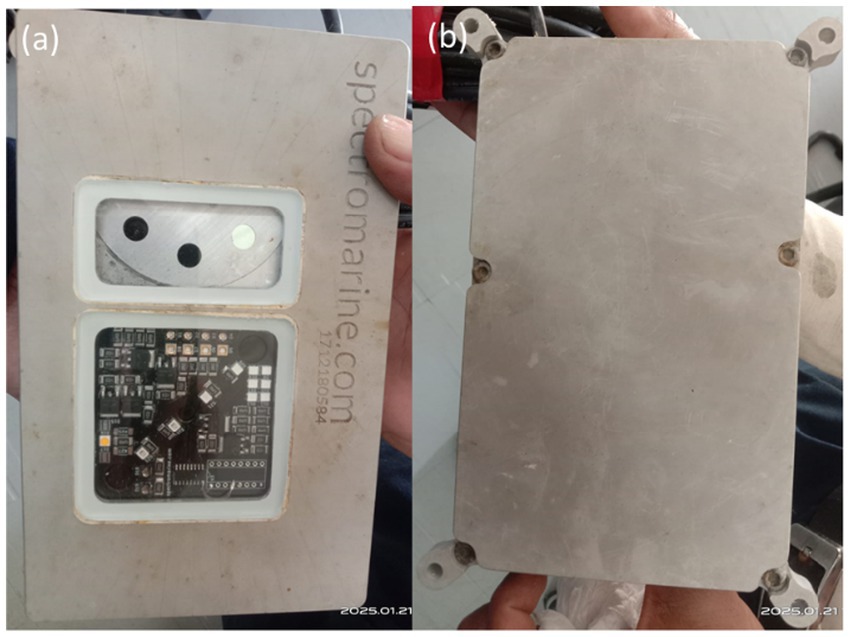
Figure 4. (a) SpectroMarine sensor top side which faces upwards in the water column; (b) the bottom side of the sensor assembly after 6 months in harsh pre-treated seawater conditions.
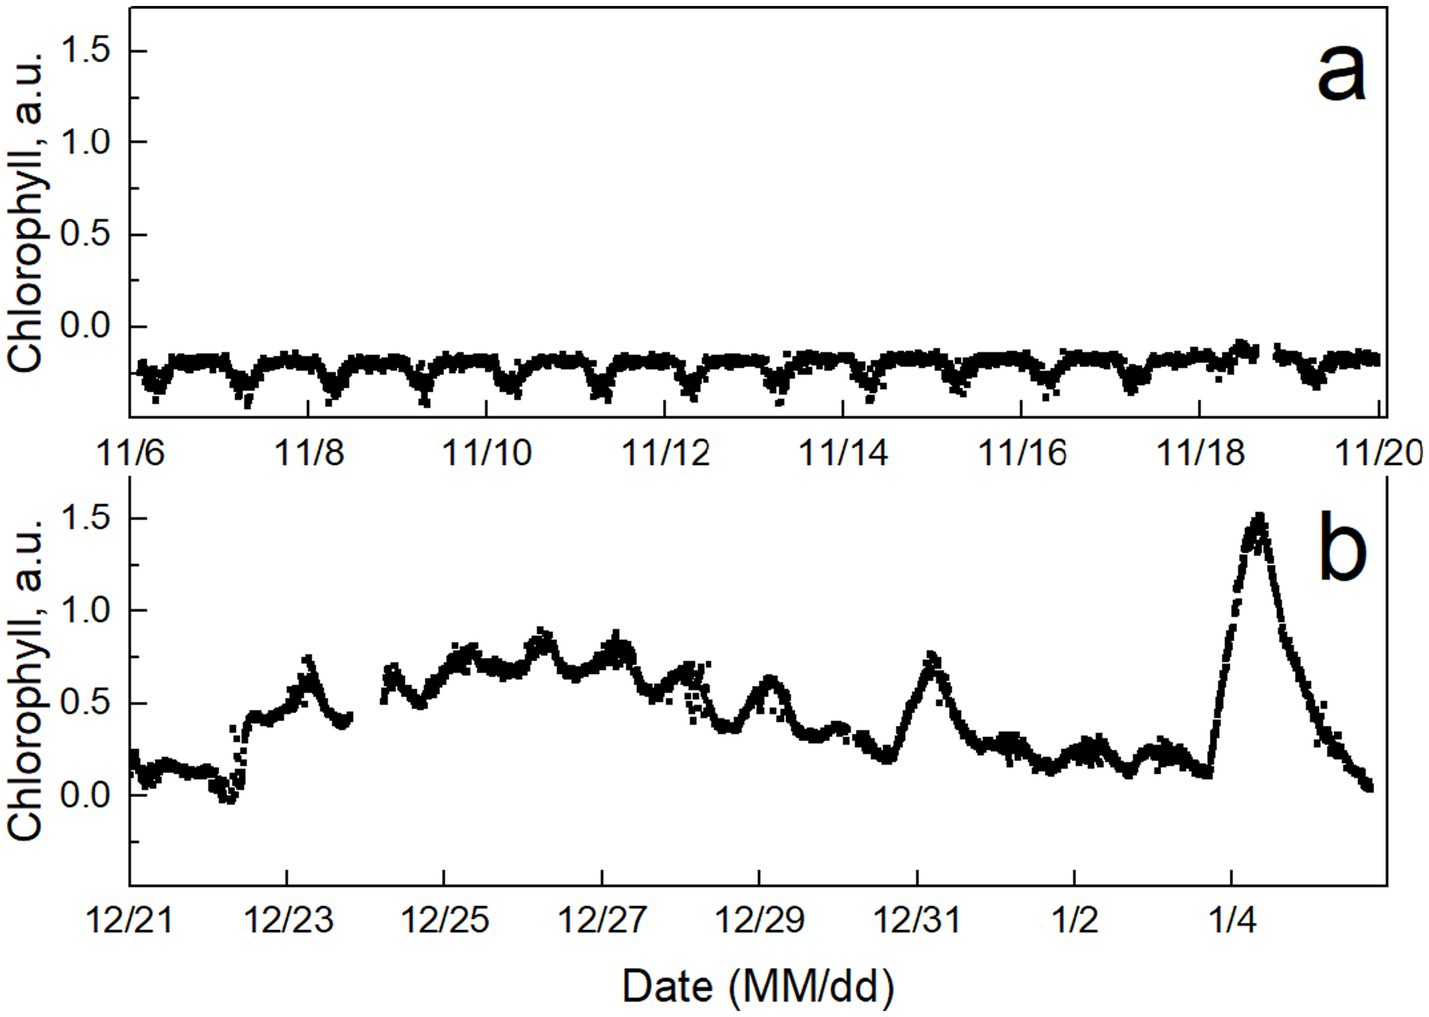
Figure 5. Data from SpectroMarine dashboard for chlorophyll-sum values for intervals with (a) NaOCl dosing and (b) without NaOCl dosing at the intake.
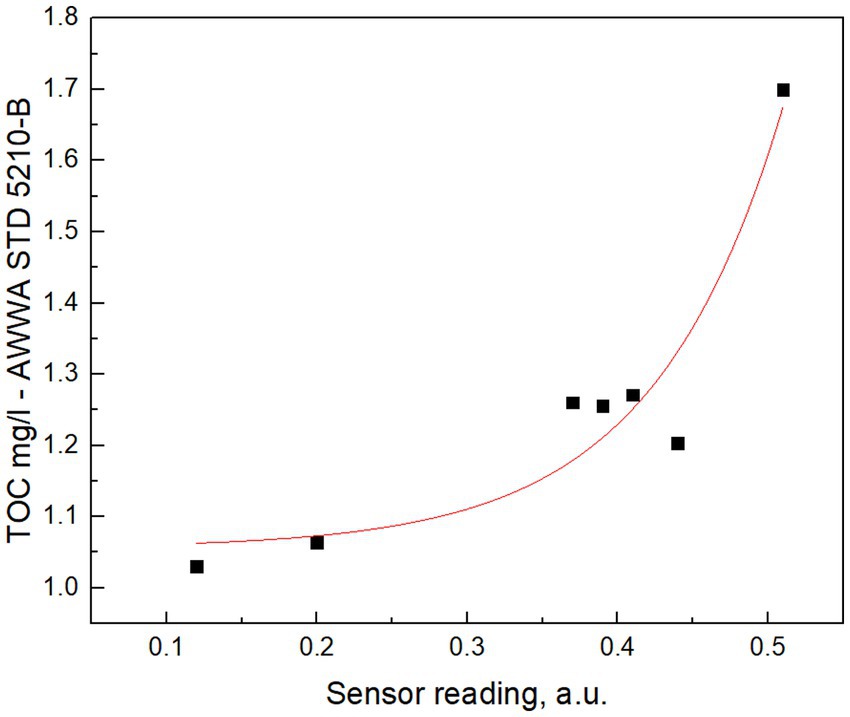
Figure 6. Sensor raw values against TOC calibrated measurements in the chamber, with red line representing calibration curve for sensor readings.
That biofilm formation increases cleaning frequency and membrane stress, leading to higher costs (Herzberg and Elimelech, 2007).
Khan et al. (2015), discussed how biofouling increases energy consumption by elevating pressure needs in RO systems. It supports the correlation between biofouling reduction and energy period.
Accurate water quality data enabled more efficient chemical dosing, reducing chemical use and hence its cost (Cuevas et al. 2020).
By minimizing biofouling and reducing chemical cleaning cycles as well as reduction in pressure drop, the SpectroMarine sensor extended membrane lifespan (Shannon et al., 2008).
SpectroMarine represents a significant advancement in desalination technology, providing operators with real-time data to optimize water treatment processes. Its low-maintenance design, requiring only occasional wipe cleaning after prolonged periods of operation, reduces operational interruptions and costs. Additionally, the modularity of the system allows for future integration of sensors for parameters such as pH and CO2 levels, as well as AI-driven analytics for predictive maintenance and automated control (Uçar et al., 2024; Liu et al., 2020). These features position SpectroMarine as a scalable solution with applications beyond desalination, including aquaculture and environmental monitoring.
During the course of 6 months over 500,000 spectral measurements were taken and analyzed, which resulted in a comprehensive historic dataset for the measurement chamber.
Sensor is configured to measure fluorescent Dissolved Organic Matter (fDOM) (correlated with TOC using laboratory measurements at different time points) as well as chlorophyll signal.
Figure 5 shows the signal level of total chlorophyll (in arbitrary units) when (a) NaOCl was dosed at the intake and (b) when NaOCl dosing was stopped. It is clear that when NaOCl dosing is stopped, an increase is seen in the chlorophyll with the diurnal variations being captured by the sensor. The sample from the measurement chamber was also validated in the laboratory for chlorophyll, and the laboratory reading with a conventional spectrophotometer was below detection limit, thus proving the increase in sensitivity of SpectroMarine technology. This is also the reason for the current lack of calibration of chlorophyll absolute values, as laboratory sample tests were not performed regularly enough to calibrate the device for now.
The TOC was measured periodically in the AWWA STD 5210-B standard certified laboratory and the readings from the SpectroMarine sensor were calibrated against the data. Figure 6 shows the sensor reading of fDOM and laboratory reading of TOC in mg/l. A calibration fit is then used to correlate sensor reading to TOC values, which are presented in Figure 7.
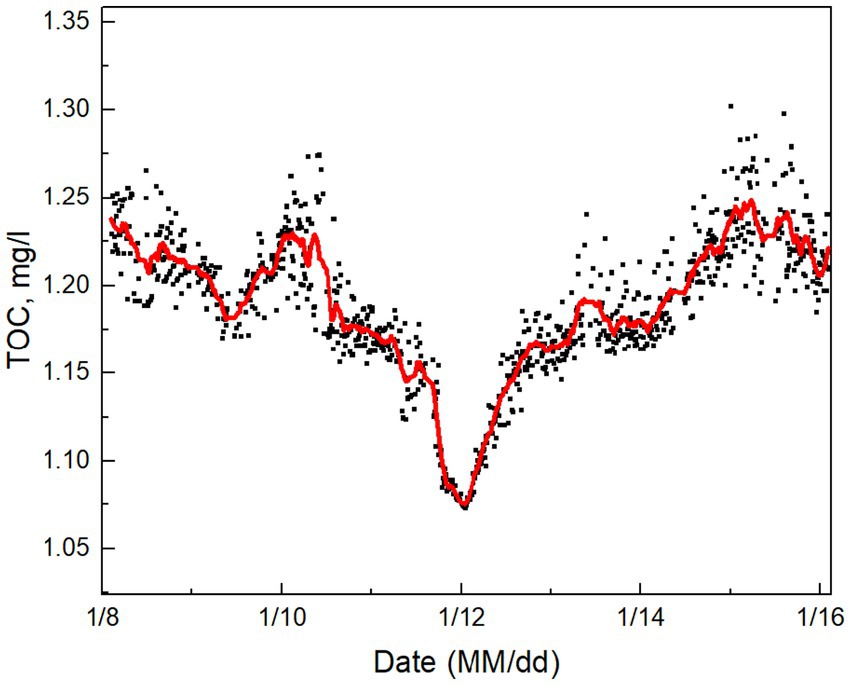
Figure 7. Signal of TOC measured with the SpectroMarine sensor over the course of a week – approximately 900 datapoints.
Further extended tests are planned to validate the sensor’s performance under various operational conditions, particularly its ability to predict membrane fouling and to optimize chemical usage.
As visible in Figure 4, the sensor window is completely unfouled right after taking it out of the measurement environment. As the measurement environment contained oxidizing agents, the sensor required zero maintenance during the whole pilot test span. Baseline data stays constant with no increase over time - there is no upwards or downwards trend - which indicates no biofouling present on the window. Peaks of Chlorophyll signal show events of reduced cleaning agent presence, and the missing data (i.e., 12/5–12/16) indicates periods where the sensor was turned off and took no measurements. No seasonal changes within the baseline signal are immediately visible, but this aspect would require further testing, as water temperature and sunlight availability are closely related to the growth rate of various organisms found within water. Additionally, the current unshielded design would be prone to sunlight variation affecting the measurement conditions (i.e., potential spectrometer overexposure, additional light filtering, additional signal processing) if the sensor was not placed in a dark, enclosed tank as in this case.
In environments without oxidizing agents, it is expected that bioaccumulation would be present on the measurement window over longer device employment periods, so an automated mechanical window wiping arm is planned to be implemented in future designs to further bolster the anti-biofouling measures of the sensor window and reduce maintenance requirements. Additionally, the flat glass window design and its periodic exposure to UV radiation prevents bioaccumulation even further (Figure 8).
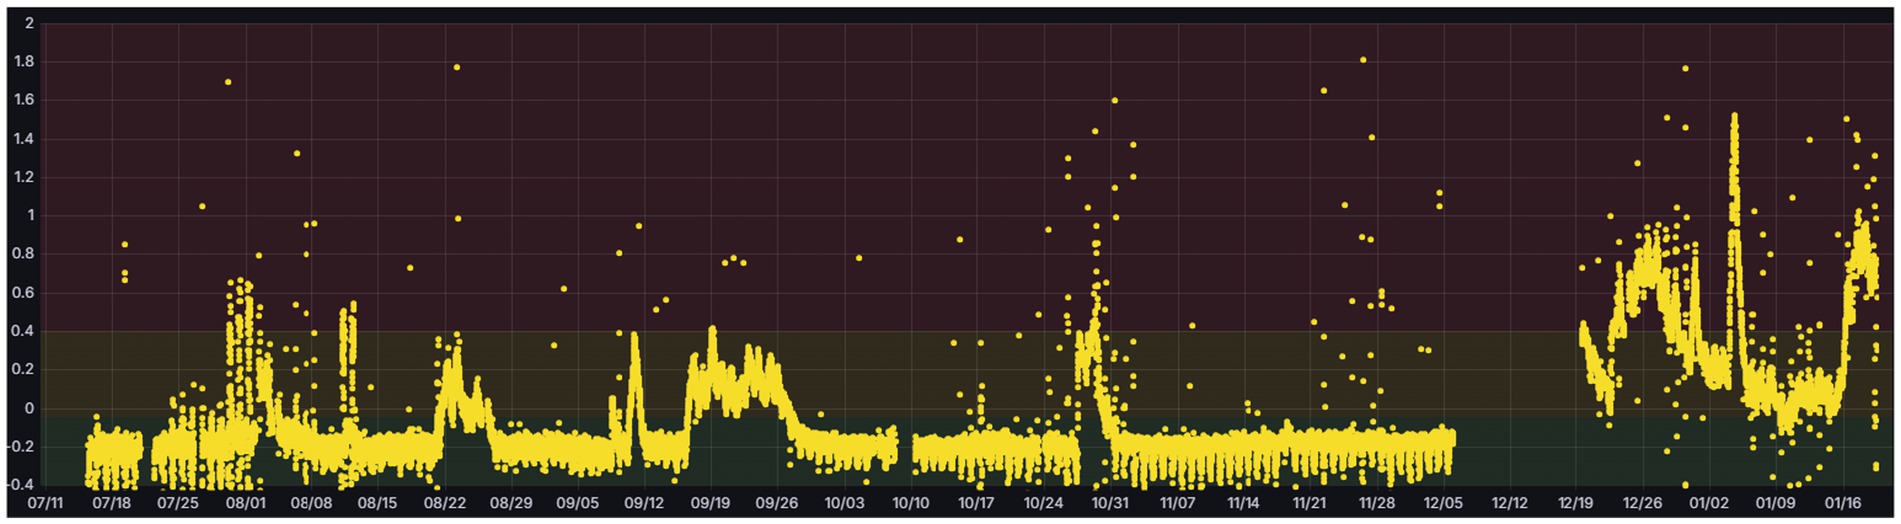
Figure 8. Signal of chlorophyll (a.u.) measured with the Spectromarine sensor over the course of 6 months. This graph contains approximately 25,000 data points.
SpectroMarine marks a groundbreaking step in the evolution of desalination technology. Its ability to provide real-time water quality data, combined with minimal maintenance requirements, addresses one of the industry’s most pressing challenges: membrane biofouling. The novelty of SpectroMarine lies in its integration of full range visible light fluorescence and absorption spectroscopy and IoT-enabled analytics, allowing operators to detect biofouling precursors with unmatched precision. Unlike conventional technologies, the system operates effectively for months without cleaning, requiring only a simple wipe to restore functionality when needed.
What truly sets SpectroMarine apart is its potential for scalability and future adaptability. Beyond its current capabilities, the sensor’s modular design supports the integration of additional monitoring functions, such as pH and CO2 measurement. The inclusion of AI-driven analytics further positions SpectroMarine as a future-ready solution, capable of enabling predictive maintenance and autonomous operation.
By significantly reducing operational costs, energy consumption, and chemical usage, while extending membrane lifespans, SpectroMarine offers unparalleled economic and environmental benefits. Its success in pilot testing demonstrates its readiness for deployment in real-world applications. Furthermore, its applicability extends beyond desalination to industries such as aquaculture and environmental monitoring, making it a versatile tool in water resource management.
As the desalination industry continues to grapple with sustainability challenges, SpectroMarine exemplifies how innovative technologies can drive efficiency and environmental stewardship. It is not merely a sensor but a transformative platform that redefines water quality monitoring for a sustainable future. Furthermore, it being an add-on system can aid in the digitalization of the pre-treatment systems in desalination leading to AI applications.
The original contributions presented in the study are included in the article/supplementary material, further inquiries can be directed to the corresponding author.
AM: Conceptualization, Funding acquisition, Investigation, Methodology, Project administration, Resources, Supervision, Validation, Visualization, Writing – original draft, Writing – review & editing. SA: Data curation, Investigation, Methodology, Supervision, Validation, Visualization, Writing – review & editing. AZ: Writing – review & editing. AA: Conceptualization, Investigation, Project administration, Visualization, Writing – review & editing. GO: Formal analysis, Funding acquisition, Project administration, Resources, Supervision, Visualization, Writing – review & editing. GT: Conceptualization, Formal analysis, Investigation, Methodology, Software, Writing – original draft.
The author(s) declare that no financial support was received for the research and/or publication of this article.
The authors declare that the research was conducted in the absence of any commercial or financial relationships that could be construed as a potential conflict of interest.
The authors declare that no Gen AI was used in the creation of this manuscript.
All claims expressed in this article are solely those of the authors and do not necessarily represent those of their affiliated organizations, or those of the publisher, the editors and the reviewers. Any product that may be evaluated in this article, or claim that may be made by its manufacturer, is not guaranteed or endorsed by the publisher.
Al-Ahmad, M., Abdul Aleem, F., Mutiri, A., and Ubaisy, A. (2000). Biofouling in RO membrane systems part 1: fundamentals and control. Desalination 132, 173–179. doi: 10.1016/S0011-9164(00)00146-6
Andersson, K., Hognes, E. S., Raadal, H. L., and Svanes, E. (2021). The environmental impact of industrial membrane biofouling: energy consumption and chemical emissions. J. Environ. Manag. 286:112184. doi: 10.1016/j.jenvman.2021.112184
Baker, J. S., and Dudley, L. Y. (1998). Biofouling in membrane systems — a review. Desalination 118, 81–89. doi: 10.1016/S0011-9164(98)00091-5
Bruijs, M. C. M. (2019). Technologies for Biofouling Control and Monitoring in desalination. Seawater Intake Systems for Seawater Desalination Facilities. Cham: Springer.
Cuevas, J.-P., Moraga, R., Sánchez-Alonzo, K., Valenzuela, C., Aguayo, P., Smith, C. T., et al. (2020). Characterization of the bacterial biofilm communities present in reverse-osmosis water systems for haemodialysis. Microorganisms. 8:1418. doi: 10.3390/microorganisms8091418
Flemming, H.-C. (1997). Reverse osmosis membrane biofouling. Exp. Thermal Fluid Sci. 14, 382–391. doi: 10.1016/S0894-1777(96)00140-9
Herzberg, M., and Elimelech, M. (2007). Biofouling of reverse osmosis membranes: role of biofilm-enhanced osmotic pressure. J. Membr. Sci. 295, 11–20. doi: 10.1016/j.memsci.2007.02.024
Khan, M. T., Hong, P.-Y., and Croué, J.-P. (2015). Does chlorination of seawater reverse osmosis membranes control biofouling? Water Res. 78, 84–97.
Liu, X., Wu, J., Hou, L., and Wang, J. (2020). Fouling and cleaning protocols for forward osmosis membrane used for radioactive wastewater treatment. Nucl. Eng. Technol. 52, 581–588. doi: 10.1016/j.net.2019.08.007
Mahmoud, A. M., Kim, Y., Mansour, R. B., Al-Aithan, A., Lee, Y., Ahmed, S., et al. (2017). Abu Derman, experimental analysis and techno-economic study of once through long tube MSF desalination plants. Desalin. Water Treat. 73, 137–144. doi: 10.5004/dwt.2017.20365
Matin, A., Khan, Z., Zaidi, S. M. J., and Boyce, M. C. (2011). Biofouling in reverse osmosis membranes for seawater desalination: phenomena and prevention. Desalination 281, 1–16. doi: 10.1016/j.desal.2011.06.063
Mohamed, A., Robert, J., Mabrouk, A. N., Ahmad, I., Ahmed, N., Choi, J. S., et al. New anti-scalant performance evaluation for MSF technology. Desalin. Water Treat. 51, 915–920. doi: 10.1080/19443994.2012.704701
Schultz, M. P., Bendick, J. A., Holm, E. R., and Hertel, W. M. (2011). Economic impact of biofouling on a naval surface ship. Biofouling 27, 87–98. doi: 10.1080/08927014.2010.542809
Shannon, M. A., Bohn, P. W., Elimelech, M., Georgiadis, J. G., Mariñas, B. J., and Mayes, A. M. (2008). Science and technology for water purification in the coming decades. Nature 452, 301–310. doi: 10.1038/nature06599
Shin, K., Ihm, S., Mansour, R. B., Aithan, A. A., Mahmoud, A. M., You, J., et al. (2018). New concept to characterize seawater quality for RO plant design and operation. Desalin. Water Treat. 109, 8–16. doi: 10.5004/dwt.2018.22151
Uçar, A., Karaköse, M., and Kırımca, N. (2024). Artificial intelligence for predictive maintenance applications: key components, trustworthiness, and future trends. Appl. Sci. 14:898. doi: 10.3390/app14020898
Vrouwenvelder, J. S., van Paassen, J. A. M., van Agtmaal, J. M. C., van Loosdrecht, M. C. M., and Kruithof, J. C. (2009). A critical flux to avoid biofouling of spiral wound nanofiltration and reverse osmosis membranes. J. Membr. Sci. 326, 36–44. doi: 10.1016/j.memsci.2008.09.029
Keywords: membrane biofouling, desalination, spectroscopy, sensor, reverse osmosis (RO), water quality monitoring
Citation: Mahmoud AM, Ahmed S, Zolotarjovs A, Alghamdi AS, Ozolins G and Tunens G (2025) SpectroMarine: advancing real-time water quality monitoring to mitigate biofouling in desalination plants. Front. Water. 7:1567826. doi: 10.3389/frwa.2025.1567826
Edited by:
Shailendra Kumar Shukla, Banaras Hindu University, IndiaReviewed by:
Zhengyu Jin, Minzu University of China, ChinaCopyright © 2025 Mahmoud, Ahmed, Zolotarjovs, Alghamdi, Ozolins and Tunens. This is an open-access article distributed under the terms of the Creative Commons Attribution License (CC BY). The use, distribution or reproduction in other forums is permitted, provided the original author(s) and the copyright owner(s) are credited and that the original publication in this journal is cited, in accordance with accepted academic practice. No use, distribution or reproduction is permitted which does not comply with these terms.
*Correspondence: Amr Mohamed Mahmoud, YW1haG1vdWQ0QHN3Y2MuZ292LnNh
Disclaimer: All claims expressed in this article are solely those of the authors and do not necessarily represent those of their affiliated organizations, or those of the publisher, the editors and the reviewers. Any product that may be evaluated in this article or claim that may be made by its manufacturer is not guaranteed or endorsed by the publisher.
Research integrity at Frontiers
Learn more about the work of our research integrity team to safeguard the quality of each article we publish.