 Younes Dahhane1*
 Victor Ongoma1
 Abdessamad Hadri1
 Mohamed Hakim Kharrou1
 Oualid Hakam1
 Abdelghani Chehbouni2
- 1International Water Research Institute, Mohammed VI Polytechnic University, Benguerir, Morocco
- 2Center for Remote Sensing Applications, Mohammed VI Polytechnic University, Benguerir, Morocco
Understanding the probability of drought occurrence in agricultural areas is important for designing effective adaptation strategies to drought impacts on agriculture and food security. This knowledge is critical, especially in arid and semi-arid areas of Morocco, which are prone and vulnerable to droughts. This study examines the linkage between meteorological drought (MD) and agricultural drought (AD) in a critical agricultural region in Morocco. Different agricultural drought indexes [NDVI anomaly, vegetation condition index (VCI), temperature condition index (TCI), vegetation health index (VHI)], and a meteorological drought index [Standardized Precipitation Evapotranspiration Index (SPEI) in different time scales (3, 6, 9, 12 months)] are assessed for the period 2000–2022. Statistical measures such as Spearman correlation (R), root mean square error (RMSE), and mean absolute error (MAE), are utilized to assess the performance of the meteorological drought index to detect the agricultural drought. The propagation time from meteorological drought to agricultural drought was identified, and probabilistic linkages between the two types of droughts were investigated using the copula function and Bayesian network. Results show that a combination of SPEI3 as meteorological drought index and VHI as agricultural drought index has the highest correlation coefficient of 0.65 and the lowest RMSE and MAE of 1.5 and 1.5, respectively. The propagation time from meteorological to agricultural drought was 39 days on a scale of 12 months, and seasonally, it was 29, 32, and 82 days, for autumn, winter, and spring, respectively. Bayesian network results show that agricultural droughts have the high probability to occur whenever there is severe and extreme meteorological drought, with the highest probabilities for mild and moderate agricultural drought. The findings have significant applications in water resource management and agricultural planning, for water usage and food security based on likelihood of agricultural drought occurence.
1 Introduction
Drought is one of the most destructive natural catastrophes, making it one of the biggest threats to socio-economic development (Apurv et al., 2017; Fernández et al., 2023). Agricultural drought directly impacts crop growth, negatively affecting yield production, food security, and livelihoods, especially for rural populations. This stresses a need for research to improve early warning capabilities for agricultural drought. Further research shows a strong relationship between meteorological drought and other types of droughts, knowing that meteorological drought is the precursor to other drought types (Fang et al., 2020; Li et al., 2020; Zhengguang et al., 2023). Therefore, a clear understanding of how meteorological droughts propagate to agricultural droughts and the probabilistic connections between the two drought types is important for proactively predicting agricultural droughts and minimizing their impacts (Zhengguang et al., 2023). This is of great importance especially in arid and semi-arid areas which are water scarce.
The long-term climate of a region, whether arid or humid, can be quantified using the aridity index (CAI), which is defined as the ratio of mean annual potential evaporation (Ep) to precipitation (P) (Budyko and Miller, 1974; Henning and Flohn, 1977). Regions with an aridity index >1 are generally classified as dry, while those with an index <1 are classified as humid (Arora, 2002; Ponce et al., 2000; Budyko and Miller, 1974). Semi-aridity is a common climatic characteristic that can have significant negative impacts. According to the findings of Hamed et al. (2024), Morocco is classified as semi-arid to sub-humid in the north and Arid in the south. Droughts are more frequently documented in semi-arid and sub-humid regions, which often attract high concentrations of human populations (Ponce et al., 2000).
Morocco is in a climate change hotspot (IPCC, 2021). Several studies indicate that drought events have become more frequent and intense in Morocco and the larger northern Africa region (Bouras et al., 2020; Henchiri et al., 2021; Verner et al., 2018; Zkhiri et al., 2019). Ouharba et al. (2024) reported that Morocco has experienced severe drought in different periods. Severe droughts affected the country in 1980–1985, 1990–1995, 1998–2002, and 2015–2020, causing water shortage that led to overexploitation of groundwater, and significant social and economic challenges. Unfortunately, there is a gap in understanding the evolution of the recent drought events from 2019 to 2024. According to IPCC (2021), the rise in climate-related hazards may become more severe in the future, causing significant material and human damage and an important imbalance between water supply and demand (Hadri et al., 2024; Saouabe et al., 2022). This is likely to derail efforts to realize most Sustainable Development Goals among them SDGs 1 and 2 aiming at No Poverty and No Hunger, respectively (WMO, 2022; Filho et al., 2023).
In Morocco, severe periods of drought led to significant job displacement in the agricultural sector with ~6.5% of workers losing their works and 39% remaining unemployed (Alfani et al., 2023), rural populations migrate to urban areas due to the absolute scarcity of water resources (Tribak et al., 2018). Women in rural areas have been significantly affected by water scarcity, impacting their agricultural roles and social activities (Bossenbroek and Ftouhi, 2024). Staple crops like cereals, that are highly sensitive to temperature and precipitation changes, were impacted by the drought events (Alfani et al., 2023; Achli et al., 2024).
Several studies have analyzed drought variability in Morocco. Researchers have investigated meteorological drought using precipitation products from reanalyzed and satellite datasets (PERSIAN-CDR, ERA5, CHIRPS) (e.g., Ouatiki et al., 2017; Salih et al., 2022; Ait Dhmane et al., 2023; Tuel and El Moçayd, 2023; Rachdane et al., 2022; Bouizrou et al., 2023); and agricultural drought using soil moisture, evapotranspiration, and vegetation indices from MODIS, Sentinel (Ezzine et al., 2014; Houmma et al., 2024; Elair et al., 2023; Acharki et al., 2023; Hakam et al., 2023). Terrestrial water storage changes are often monitored by GRACE satellites to track groundwater (hydrological drought). However, in the Casablanca Settat region, one of the most important agricultural areas in Morocco, and severely affected by meteorological and agricultural drought, a few studies have been conducted to characterize those events and no study has been conducted in the last period from 2019 to 2024.
Drought propagation is the transition from meteorological drought to other drought types. Amazirh et al. (2023) describe the drought propagation process as primarily initiated by a lack of precipitation, and it spreads slowly to soil moisture, vegetation, streamflow, and groundwater, affecting the entire hydrological processes across the landscape. The lag and probability of the propagation ought to be understood when analyzing the relationship between meteorological drought and agricultural drought in each area.
A few studies have investigated the probabilistic linkages of drought event characteristics between meteorological drought and agricultural drought. Currently, most studies focus on creating and understanding the relationship between agricultural and meteorological drought characteristics using simple regression models (Li et al., 2018; Wu et al., 2017; Yu et al., 2020; Zhou et al., 2021a). Probabilistic methods can describe this relationship since meteorological drought implies probability information regarding subsequent agricultural and other droughts. Therefore, there is a need to put more effort into demonstrating the feasibility of probabilistic statistical approaches to determine the probabilistic linkages between agricultural drought and meteorological drought event characteristics, which can provide key risk reduction information for decision-makers.
Probabilistic models offer significant advantages in evaluating the link between different types of droughts. Different models have been used, including Copula-based joint models that allow the characterization of complete interactions between different droughts, to identify the behaviors of large-scale drought datasets (Pan et al., 2013; Fang et al., 2019a,b), probabilistic framework that can analyze the propagation of meteorological drought to different drought types, Bayesian network models and copula functions method that estimate the joint probability of drought propagation, providing information on how the meteorological drought evolves into hydrological drought (Shin et al., 2019, 2016). All those methods can be applied to different drought types.
Probabilistic models are applied worldwide to link between droughts. Copula and Bayesian networks were applied in the Yangtze River Basin in China. The application uses a standardized precipitation index (SPI) and Soil moisture anomaly percentage Index (ISMAPI) to indicate meteorological and agricultural droughts; this method is applied to link the two drought types (Xu et al., 2023). In The Qinhe River Basin, Bayesian networks, and copula were used to determine the propagation threshold between meteorological and hydrological drought (Liu et al., 2022). In Balkhash Lake Basin in Central Asia, the Bayesian copula multivariate analysis (BCMA) method was applied to assess the impact of spatial-temporal variation on drought risk (Yang et al., 2022). Avilés et al. (2016) used the Markov chain and Bayesian network-based models for drought forecasting, and the copula functions were used to solve the Bayesian networks in Chulco River Basin, Southern Ecuador. On a global scale, a copula Bayesian framework was used to quantify the propagation from meteorological drought to soil moisture drought (Ma and Yuan, 2024).
In this paper, bivariate copula functions are used since they offer several advantages. It enables the analysis of two variables: drought duration and severity (Kim and Seo, 2025). The joint analysis helps better capture the relationship between meteorological and agricultural drought, providing a detailed image of drought dynamics (Nazeri Tahroudi et al., 2020). Bivariate Copula offers flexibility in marginal distributions, which is beneficial when dealing with different types of droughts (Madadgar et al., 2017); this flexibility ensures that the best-fit distributions can be used for each variable (Kim and Seo, 2025). Copulas enable the calculation of conditional probabilities and return periods for drought events, which is valuable for risk assessment and planning (Poonia et al., 2021). the bivariate copulas are particularly useful in agricultural drought risk management; they can model the dependencies between drought conditions and crop yield anomalies (Li et al., 2020; Ribeiro et al., 2019); this modeling is crucial in quantifying the impact of drought on crop yields, wish is essential for irrigation planning and agricultural practices (Li et al., 2021).
The purpose of this study is to determine the probability of agricultural drought occurrence at different classes of meteorological drought conditions in Casablanca Settat region in Morocco, which is one the most important agrarian area in Morocco. The findings of this paper will enable decision makers and farmers to assess the likelihood of agricultural droughts based on specific meteorological drought index classification. This information is crucial for optimizing irrigation schedules, planning crop cycles, and determining insurance premiums based on probabilistic risks. This can significantly assist in risk assessment and drought management in agricultural seasons.
2 Study area and data
2.1 Study area
Casablanca Settat region represents Morocco's important economic center. It lies between longitude −9° and −6.5°, and latitude 32° and 34°, with an altitude ranging from 56 m to 800 m (Figure 1). The region is characterized by a semi-arid climate, featuring average temperatures ranging from 12 to 21°C and an average annual rainfall of 422.3 mm. Moderate dry years are more prevalent than severe and extreme droughts. A warming climate was observed yearly and in the summer between 1961 and 2008 (Lachgar et al., 2022), severe droughts affecting this area located in Oum Errabia basin were recorded during the periods 1983/84, 1992/95, 1998/01, 2019/21 (Hamid et al., 2024).

Figure 1. (a) Geographical location of the study area; (b) Koppen Geiger climate classification; (c) Land use and land cover from ESA Word cover V100.
Agricultural land area accounts for 66.3% of the total land area, of which irrigated land covers ~10.8% of the cropland (146,436 hectares). Furthermore, this region contributes 15.8% of the National Agricultural Gross Domestic Product (Naamane et al., 2020). According to the High Commission for Planning 2024 census, at least 7.68 million people live in the region, with more than 2.055 million people in the rural areas (High Commission for Planning, 2024). The region is surrounded by critical hydrological infrastructure. The second largest dam in the country, Massira, with a capacity of 2.800 Mm3, is used for irrigation in Doukkala plain, located west of the study area and covering 96.000 ha. The region contributes to the national production of poultry, sugar beet, milk, cereals, and red meat by 45%, 40%, 24%, 24% and 18%, respectively (MAPMDREE, 2018).
2.2 Datasets
This study used different datasets to calculate drought indices (Table 1). PERSIANN-CDR is a satellite-based precipitation dataset providing rainfall estimates at a 0.25° resolution from 1983 to 2024 for monthly precipitation data. It is designed for long-term climate and hydrological studies, especially for analyzing extreme precipitation events (Hsu et al., 2014). The choice of PERSIANN CDR rainfall data is based on a country-wide study (Salih et al., 2022) that evaluated the performance of various datasets to reproduce rainfall over Morocco. PERSIANN CDR emerged as the best product for reproducing monthly and annual precipitation at all altitudes and for daily precipitation at high altitudes. This was confirmed in a related study.
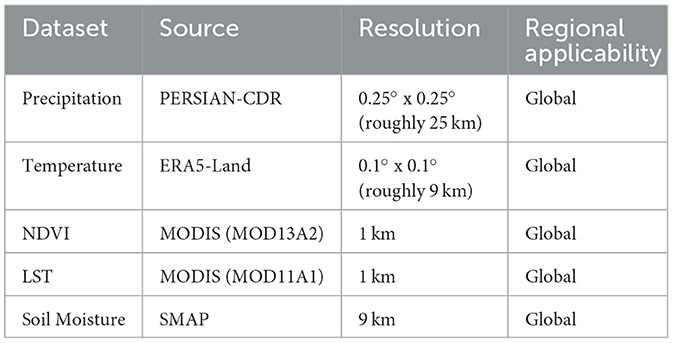
Table 1. Datasets of the different variables used in the study.
Monthly temperature data was sourced from ERA5-Land for the period 1983–2024. It is an enhanced global dataset developed by the European Center for Medium-Range Weather Forecasts (ECMWF) under the Copernicus Climate Change Service (C3S). It focuses on the land component of the fifth generation of European reanalysis (ERA5) and spans from 1950 to the present, with continuous updates (Muñoz-Sabater et al., 2021).
Monthly NDVI derived from MODIS MOD13A3v061 (https://lpdaac.usgs.gov/products/mod13a3v061/) with a spatial resolution of 1 km was extracted from 2000 to 2024 (Didan, 2021). This data is of relatively high quality and has been used in related research (e.g., Bai et al., 2019; Ma et al., 2017). Monthly land surface temperature (LST) with a spatial resolution of 1km is used from MODIS MOD11A2 (https://lpdaac.usgs.gov/products/mod11a2v006/). This data has a 1 km spatial resolution and is available in a 1,200 × 1,200 km grid (Wan et al., 2021). Each pixel value represents the average of 8 days' LST for that location. MOD11A2 provided both daytime and nighttime LST. However, in the present study, only daytime data were used for the LST analysis. Table 1 presents the datasets used in research.
3 Methodology
Monthly VCI, VHI, TCI, SMAI, and NDVI anomaly was evaluated to characterize agricultural drought to be linked with meteorological drought at different time scales. Statistical metrics [Spearman coefficient of correlation R, root mean square error (RMSE) and mean absolute error (MAE)] are used for performance evaluation of the combinations. Using the best combination between agricultural and meteorological indices, different time lag base cross-correlation and maximum correlation coefficients were assessed to determine the time it takes for meteorological drought to propagate to agricultural drought. A probability framework based on the copula function and Bayesian network was used to quantify the probabilistic linkages between the two types of droughts. Figure 2 shows the methodological framework adopted in this study.
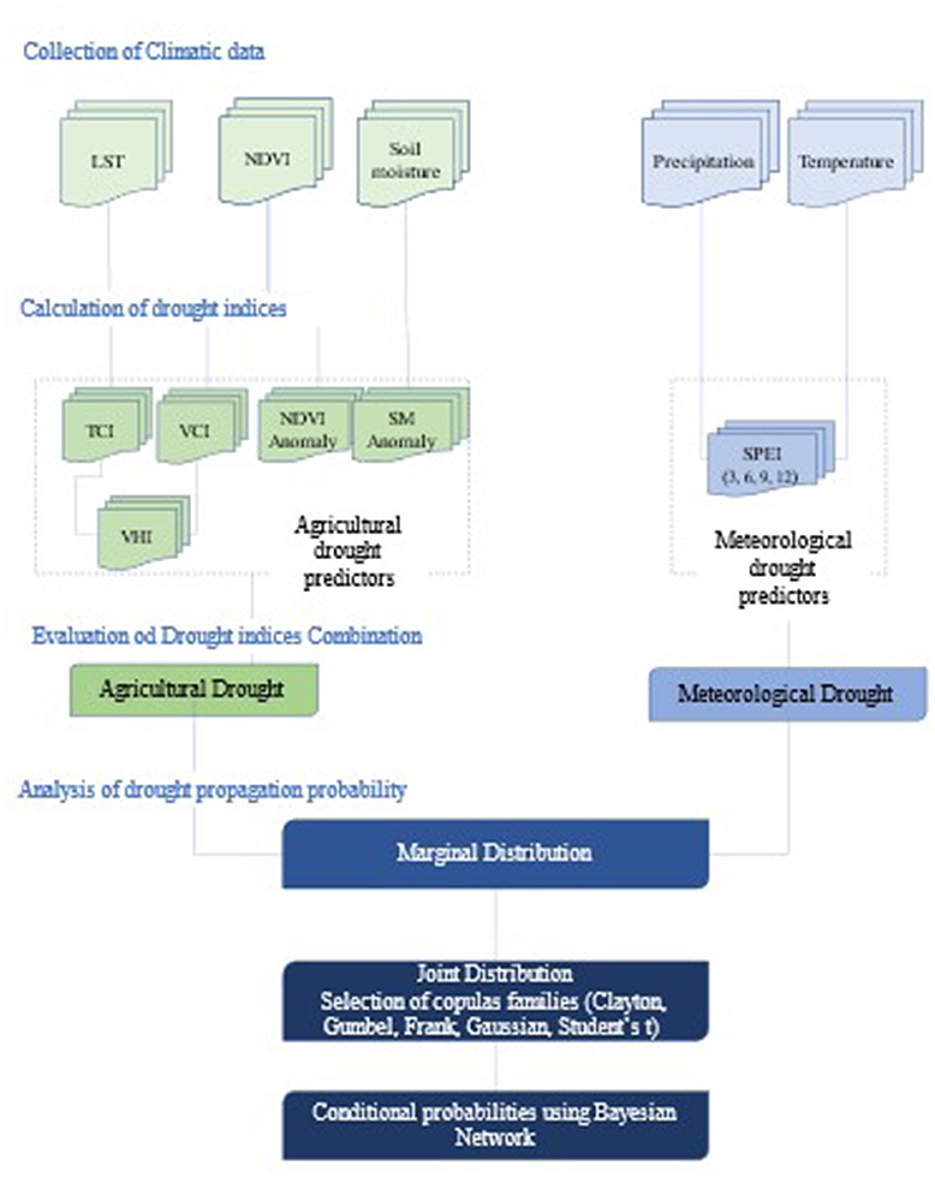
Figure 2. Methodological framework for drought propagation assessment in the study area.
3.1 Drought indices
The SPEI (Vicente-Serrano et al., 2010) is among the most used drought indices, particularly in arid and semi-arid areas. SPEI uses the long-term difference between the potential evapotranspiration (PET) calculated based on temperature and precipitation to capture drought. The index integrates the strengths of the standardized precipitation index (SPI) and the Palmer Drought Severity Index (PDSI). It effectively captures the cumulative effects of meteorological drought over various time scales and shows promising potential for practical applications (Zuo et al., 2019). Additionally, the Standardized Precipitation-Evapotranspiration Index (SPEI) is similar to the self-calibrating Palmar Drought Severity Index (scPDSI) and can identify increases in drought severity due to global warming. This is primarily attributed to the heightened water demand resulting from increased evapotranspiration (Vicente-Serrano et al., 2010; Liu et al., 2024). In this study, SPEI was calculated from 1983 to 2024 for accumulation periods of 1, 3, 6, 9, and 12 months.
The SPEI is computed using monthly precipitation and temperature data according to the following steps. The monthly difference between precipitation and PET is determined using Equation 1. The calculation of PET is done using the Hargreaves method, this method demonstrated high accuracy in semi-arid and arid climates (Er-Raki et al., 2010, 2011), and this method is very reliable in semi-arid conditions supports efficient water use in agriculture. Then, the accumulated difference between precipitation and PET at different time scales is computed using following Equation 2;
where is the accumulated difference between precipitation and PET values at the k-month timescale during (j) month in (i) year; Di,j denotes the monthly difference between precipitation and PET values in i-month of the I year. Thereafter, the accumulated difference is normalized to avoid having negative values from the data sequence , a three-parameter log-logistic probability distribution is used by the SPEI index (Vicente-Serrano et al., 2010). For the data sequence of the entire timescales, the accumulative function of the log-logistic probability distribution f(x) is given in Equation 4, where α is the scale parameter, β the shape parameter, and γ is the position parameter.
ρ shows the probability of a definite X value, as presented in Equation 5:
When ρ ≤ 0.5
When ρ > 0.5
where C0 = 2.515517, C1 = 0.802853, C2= 0.010328, d1= 1.432788, d2= 0.189269, and d3 = 0.001308.
Five key indices are often utilized to monitor agricultural drought. The temperature condition index (TCI) is widely used to assess the impact of temperature on vegetation health, often within the context of drought monitoring (Wassie et al., 2022). It measures how the current temperature compares to historical temperatures over a specific period, providing insight into how temperature extremes might affect crop and vegetation health. The TCI (Equation 9) measures the fluctuations in land surface temperature. Sensitive to temperature variations, this index is used to reflect thermal stress on vegetation and thus is more effective in regions where temperature is the limiting factor for vegetation growth.
The VCI is an agricultural drought index that measures the health and intensity of vegetation based on the NDVI. It helps assess the impact of drought on vegetation by comparing current vegetation conditions to historical data. The VCI (Equation 10) indicates vegetation health based on greenness and sensitivity to water availability; it is effective in regions where water is the limiting factor for vegetation growth (Kogan, 1995).
The VHI is an agricultural drought index that indicates the health and intensity of vegetation based on the vegetation condition index and the temperature condition index. It provides a more integrated view of vegetation stress by considering vegetation and temperature conditions, making it a valuable tool for monitoring drought impacts on agriculture. It comprehensively measures vegetation health by integrating greenness and thermal stress (Kogan, 1997). It suits diverse climatic regions, offering a balanced view of drought impacts. It is calculated based on the combination of VCI and temperature condition index. VHI is calculated using Equation 11.
Normalized Difference Vegetation Index anomaly (NDVI anomaly) measures how the NDVI deviates from long-term averages, reflecting changes in vegetation health caused by drought. This anomaly is effective for identifying areas with significant changes in vegetation due to drought, making it useful for early warning systems. NDVI anomaly is the simplest and most common NDVI-based approach for detecting and mapping drought using its long-term mean for a pixel or region at a given time (Anyamba and Tucker, 2012). The variation of the NDVI with a positive value indicates normal conditions, while a negative value indicates severe drought conditions (Vaani and Porchelvan, 2017). NDVI anomaly is computed using Equation 12.
Soil Moisture Anomaly Index (SMAI) is essential for accurately characterizing soil water status. This index provides a global analysis of water conditions in a region, making it an invaluable tool for monitoring and assessing drought. According to Bergman et al. (1988), the interpretation of the SMAI can help identify dry periods indirectly. Specifically, suppose that when SMAI is <0, it indicates that the average soil moisture for a month i is lower than the historical average for that month, suggesting a potentially dry period. Conversely, suppose the SMAI is >0. In that case, it indicates that the average soil moisture for month i is higher than the historical average, suggesting a wet period due to rainfall or irrigation. Equation 13 calculates the SMAI.
Table 2 presents the classification used to define agricultural drought intensities.
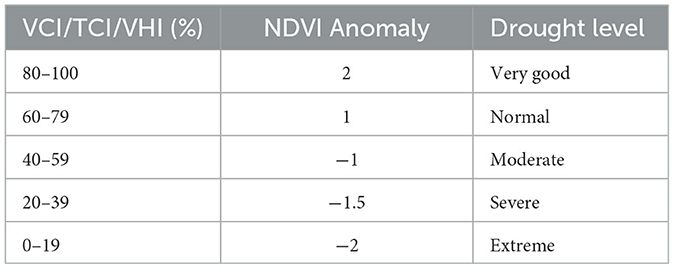
Table 2. Agricultural drought indices classification.
3.2. Drought propagation time
Determining the propagation time is crucial for linking agricultural drought and meteorological drought. The two widely used methods come into play to calculate propagation between different types of droughts. The first method involves determining the lag time between drought types using correlation analysis. This method is practical for understanding the relationship between different drought types. The second method quantifies the interval between the start, peak, and end times of paired drought events to understand the duration and intensity of drought events. Examining the propagation time across different seasons is a practical approach for seasonal variability analysis. In this study, we adopted the first method to calculate the lag time between the meteorological and agricultural drought that occurred in the studied region over the period.
3.3 Occurrence probabilities of agricultural drought under different levels of meteorological drought
3.3.1 Copula function
The copula function is a mathematical function used in statistics and probability theory to describe the relationship between the distributions of multiple random variables (Sklar, 1959). Copula is a multivariable joint distribution function that is the joint distribution of multiple random variables through their respective marginal distribution functions (Sklar, 1959; Michele and Salvadori, 2003; Salvadori and Michele, 2004). It has been widely utilized in studies related to drought (Geng et al., 2024; Kanthavel et al., 2023; Bai et al., 2023; Jung et al., 2022; Hadri et al., 2024).
This study uses the bivariate copula, where random variables X remain to the meteorological drought indices and Y remain to the agricultural drought indices with marginal distribution FX(x) and Fy(y). There is a two- dimensional copula function C that combines these two marginal distributions to form a joint distribution function, FX, Y(x, y) (Equation 13):
The copula function was used to analyze the occurrence probability of agricultural drought under meteorological drought conditions. There are many copula families, including Archimedean, elliptical, and quadratic copula. The most widely used is the Archimedean copula for analyzing bivariate joint dependence structures (Wu et al., 2015). This study uses five copula functions: Clayton, Frank, Gumbel, Student's, and Gaussian Copula. The RMSE between the empirical and theoretical values is adopted for the fit of goodness to choose the best copula in each grid. Descriptive of the Copula functions used in this work are presented in Table 3.
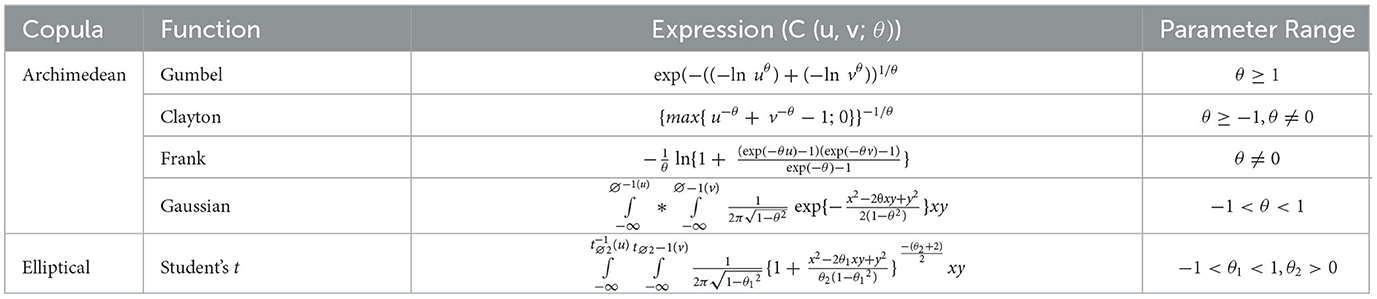
Table 3. Copula function used in the study.
3.3.2 Conditional probabilities calculation using Bayesian network
Meteorological drought indices and agricultural drought indices variables of each grid are regarded as two random variables, and the choice of distribution to fit depends on the index. If the index used is standardized, a normal distribution is used; if not, we assess a different distribution. Significant correlations between MD and AD are essential for the construction of the joint distribution of MD and AD series using Copula; for that, we keep only grids with a correlation coefficient between MD and AD >0.5 for this study to estimate the conditional probability of agricultural drought conditioned on meteorological drought.
A Bayesian network is a method that represents the conditional dependencies between various variables and has been extensively utilized in calculating conditional probabilities (Guo et al., 2020; Han et al., 2021; Sattar and Kim, 2018; Sattar et al., 2019). MD and AD are classified into four categories (mild, moderate, severe, and extreme). The marginal distribution of the two random variables and the best-fit copula is determined, and the conditional probabilities of AD conditioned on MD can be calculated using a Bayesian network. Hence, the conditional probability of moderate or severe AD under moderate or severe MD conditions can be estimated using Equation 16:
The conditioned probability of extreme AD under light (moderate or severe) MD conditions can be estimated as follows (Equation 17):
The conditioned probability of light (moderate or severe) AD under extreme MD conditions can be estimated by this equation (Equation 18):
The conditioned probability of extreme AD under extreme MD conditions can be estimated by this equation (Equation 19):
where FM and FA are the marginals cumulative distributions of the MD indices and AD indices,FM(m) and FA(a) are the cumulative probabilities of M ≤ m and A ≤ a, and C(FA(a), FM(m)) is the joint cumulative probability of M ≤ m and A ≤ a, m1 and m2 are the minimum and maximum value of meteorological drought class, and a1 and a2 are the minimum and maximum value of agricultural drought class, respectively. For instance, for severe meteorological drought m1 = 1.5 and m2 = 2.
4 Results and discussion
This study analyzed the propagation process from meteorological drought to agricultural drought, focusing on identifying drought type, propagation time and conditional probability of drought occurrence. The conditional probability is calculated using the copula function and Bayesian network; this method has the advantage of describing the relationship between variables.
4.1 Drought variability
Fluctuations in drought conditions within the Casablanca-Settat region were analyzed over the period from 1985 to 2024 using SPEI index calculated at various time scales (3, 6, 9, and 12 months). Figure 3 shows that drought episodes occur more frequently at shorter time scales, although drought variability exhibited a consistent trend across all scales. Notably, exceptionally dry decades were recorded in the 2000s and 2020s, while unusually wet periods were observed in 1990, 1996, and 2010.
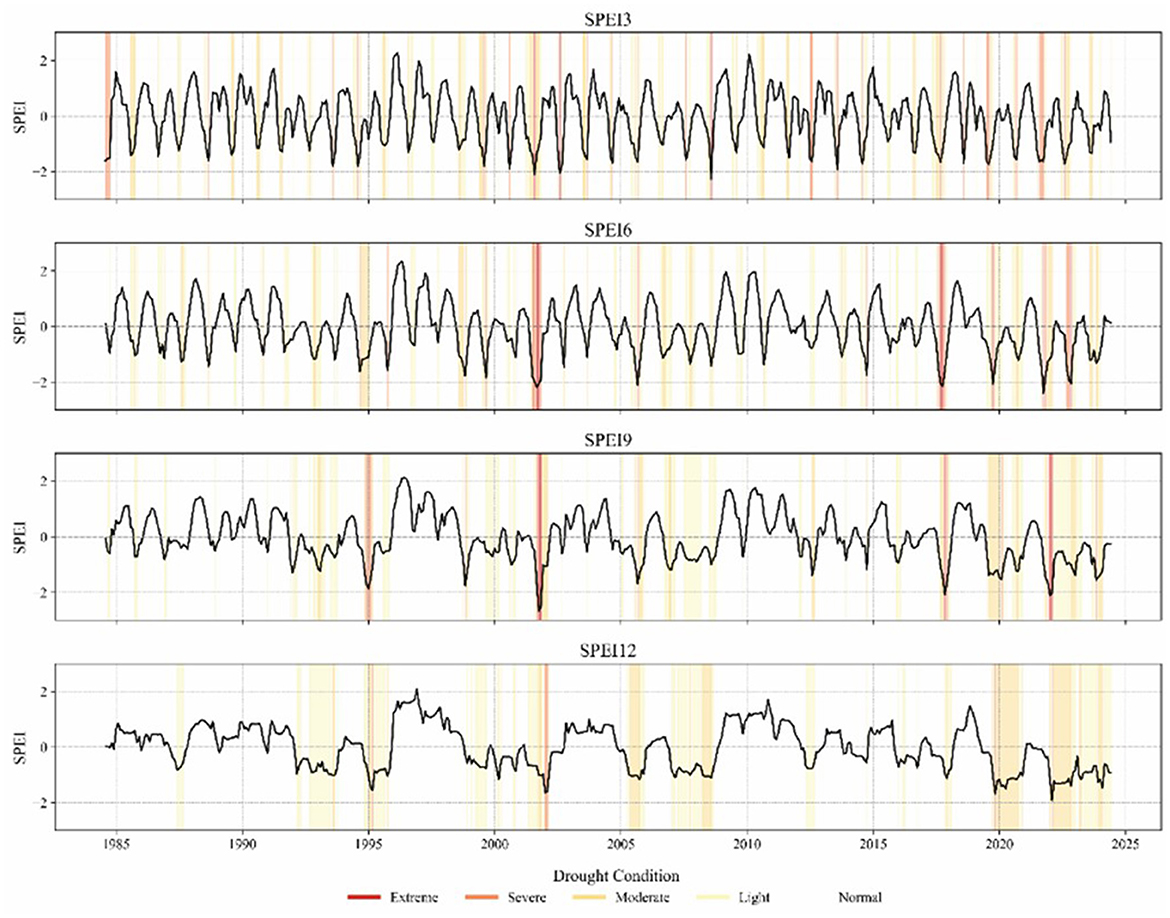
Figure 3. Historical time series of SPEI at 3-, 6-, 9-, and 12-month time scales during the period (1983–2024), white for normal conditions, light yellow for Light drought, yellow for Moderate drought, orange for severe drought, and red for severe drought.
The SPEI time series demonstrates sensitivity to the time scales employed. The SPEI3 and SPEI6 indices capture short-term and frequent seasonal fluctuations. In contrast, the SPEI9 and SPEI12 indices, being less frequent but of longer duration, provide a more comprehensive representation of average or annual water conditions. For instance, the SPEI3 and SPEI6 indicate drought occurrences of 30.27 and 30.48%, respectively, with average severities of −1.41 and −1.42 and average durations of 3 months, and 3 to 4 months. In contrast, the SPEI9 and SPEI12 indices reveal less frequent but longer droughts, with a relatively high average severity of −1.39 and −1.2 and average durations of 4 and 7 months, respectively. Historically, the frequency of drought episodes for the SPEI3, 6, 9, and 12 is 0.47, 0.4, 0.34, and 0.2, suggesting that the shorter time scale SPEI series exhibit a higher frequency of drought occurrences. In contrast, the frequencies for the longer time scales of 9 and 12 months have stabilized significantly.
Therefore, longer analysis periods are better suited for understanding the conditions and identifying historically significant events. They also shed light on the seasonal and interannual fluctuations that occur regularly. The characteristics of drought in the studied region have varied over time, revealing a history of recurrent drought occurrences and notable fluctuations in their frequency, which indicate a high sensitivity to this hydrological extreme. These findings are consistent with the results reported by Hamid et al. (2024) and Zhim et al. (2019), who also observed similar patterns of drought variability in Oum Errabia watershed.
4.2 Performance of meteorological drought indices in capturing agricultural drought conditions
SPEI in different timescales (3, 6, 9, and 12 months) as a meteorological drought index were utilized to find the best combination of drought indices that best describes the link between meteorological and agricultural drought indices. The Standardized Precipitation-Evapotranspiration Index (SPEI) considers both precipitation and potential evapotranspiration (PET), which is calculated from temperature. This dual consideration makes it effective for monitoring and predicting drought (Saharwardi et al., 2023). In contrast, the Standardized Precipitation Index (SPI) relies solely on precipitation data (Saharwardi et al., 2023; Mckee et al., 1993). When SPEI is used with probabilistic model, it becomes a method that demonstrates superior spatial coverage than other indices like SPI, and high accuracy in predicting drought (Talebi and Samadianfard, 2024). Spearman correlation coefficients were calculated between the SPEI at various time scales and several agricultural drought indices (NDVI anomaly, VCI, TCI, VHI) (Figure 4). The results show a notable variation in correlation values between these indices' time series and the SPEI, depending on the time scale applied. The correlation strengthened when the SPEI at shorter time scales was associated with indices related to vegetation condition, such as NDVI and VCI. Furthermore, the analyses confirm the hypothesis observed in the time series, suggesting that the SPEI3 is the most relevant for capturing agricultural drought conditions. This finding aligns with the work of Bouras et al. (2020) and Hakam et al. (2023), who also observed a strong correlation between vegetation cover and SPEI-3. However, some studies (e.g., Vermote and Saleous, 2006; Ejaz et al., 2023) indicate that monthly and annual time scales could also provide important explanatory insights. It is therefore essential to consider local conditions in vegetation's response to drought.
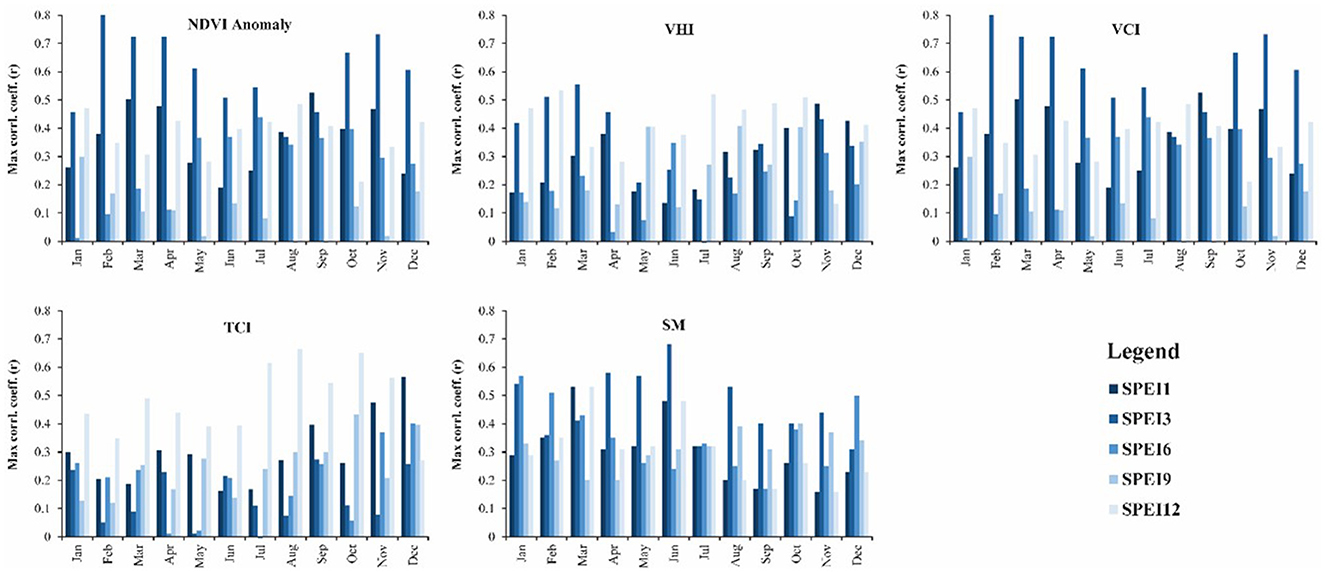
Figure 4. Monthly maximum Spearman correlation between SPEI in different time scales and agricultural drought indices.
At longer time scales (SPEI 9 and SPEI 12), the correlation values reveal a significant response with the TCI index, which reflects thermal stress experienced by vegetation, particularly on an annual scale and during the dry summer season (Figure 4). This strong correlation can be explained by the calculation parameters of these indices, which are primarily based on temperature.
A composite index that assesses vegetation health by accounting for both hydric and thermal stress shows moderate correlations with the SPEI across different time scales. Moreover, the seasons where the highest correlation between SPEI3 and VHI occur is spring (March–May) and winter (December–February), with correlation values exceeding 0.5. In contrast, the SPEI6 shows relatively weak correlations compared to the other scales analyzed.
The SPEI3 shows high correlations with NDVI anomaly indices and the VCI, with correlation coefficients exceeding 0.7. These correlations indicate a strong response of vegetation to drought conditions on short time scales, consistent with the direct impact of water deficits on vegetation cover (Bento et al., 2018). A spatial correlation analysis was conducted for each pixel in the region to better identify areas vulnerable to drought due to unfavorable climatic conditions. This analysis also helps assess the effectiveness of SPEI3 in tracking agricultural drought across the entire region. Results (Figure 5) reveal that the highest and most consistent correlations are observed between SPEI3 and vegetation indices, such as NDVI anomaly, VCI, and VHI, covering the entire study region. These high correlations demonstrate that SPEI3 is particularly effective in representing vegetation's water stress status at a seasonal scale, as these indices (NDVI, VCI, and VHI) capture changes in vegetation greenness and health in response to variations in water availability. The RMSE and MAE of the correlations are relatively low, with values ranging from 0.5 to 0.7 for VHI and VCI, and up to 1.5 to 1.6 for NDVI anomaly. These low error values show that vegetation-based indices respond consistently to changes in SPEI3, reinforcing the notion that this index is reliable for assessing agricultural drought. In contrast, the correlation values between TCI and SPEI3 are primarily between 0.1 and −0.1, indicating areas without any correlations. This suggests that the TCI, which measures thermal stress, is less influenced by water deficits and more by episodes of extreme heat, independently of drought conditions, explaining the low RMSE and MAE values observed for this index compared to the others.
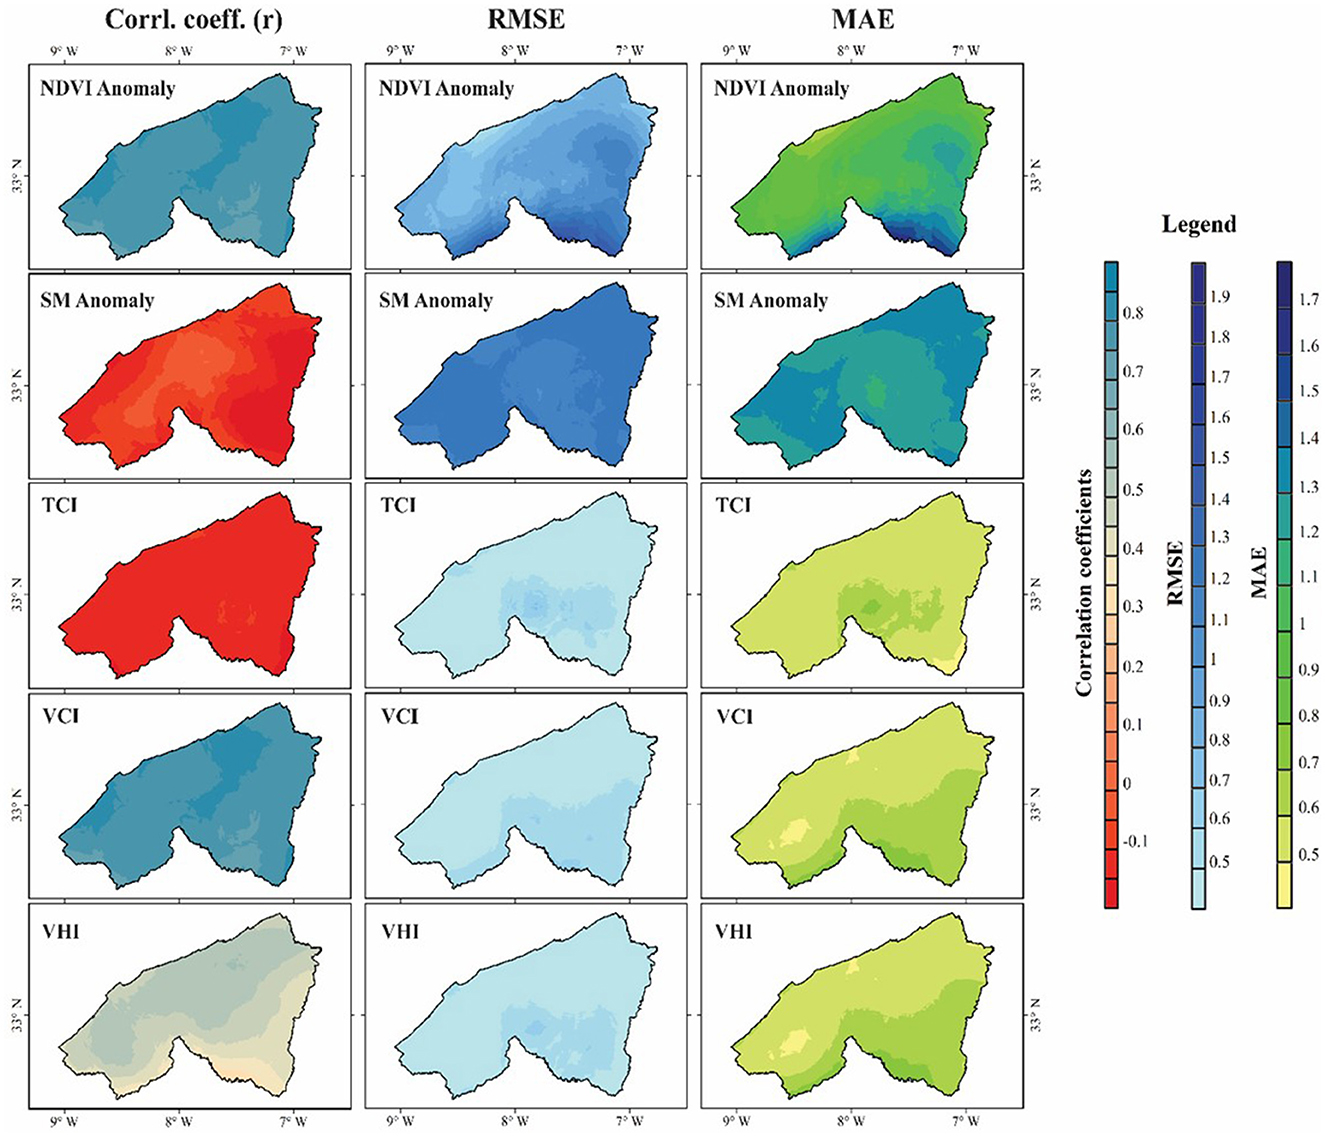
Figure 5. Spatial correlation, RMSE, and MAE maps between SPEI at 3-month time scale and agricultural drought indices.
The soil moisture anomaly (SM anomaly), on the other hand, shows the weakest correlations with SPEI3 of −0.1 to 0.2, along with some of the highest RMSE and MAE values of 1.5 and 1.3, respectively. These results may be explained by the relatively low spatial resolution of the soil moisture products used, which may not adequately capture drought variations at the regional scale. Additionally, soil moisture dynamics can be influenced by local factors such as soil type, water-holding capacity, and vegetation cover, which are not fully represented in global data (Chai et al., 2021; Liu et al., 2024).
Overall, the results of this analysis highlight the importance of using a range of indices for agricultural drought monitoring, as each index responds differently to climatic conditions. The SPEI3 proves particularly relevant for assessing the effects of short-term droughts on vegetation, while indices like TCI and soil moisture anomaly can provide complementary information but are less directly related to water deficits base of the spatial resolution that we have from soil moisture product.
4.3 Drought propagation time and its seasonal variability
The transition from meteorological drought to agricultural drought is influenced by a range of complex physiological processes, ecosystem dynamics, and water availability (Amazirh et al., 2023; Nemani et al., 2003). This suggests that the time taken for propagation can vary significantly based on these factors. As a meteorological drought evolves beyond a certain threshold, it can profoundly impact soil moisture levels, ultimately leading to reduced agricultural yields. In contrast to meteorological drought, the monitoring of agricultural drought typically reveals a temporal lag in its onset (Cammalleri et al., 2024).
In this section, we utilized the SPEI index at different time scales (1, 3, 6, 9, and 12 months) along with the VHI to illustrate meteorological and agricultural droughts, respectively. According to the sequence of drought occurrences, the maximum correlation was used to calculate the propagation relationship of these two types of droughts at annual, interannual, and seasonal scales. Figure 6 presents the spatial patterns of the propagation from meteorological drought to agricultural drought, as well as the corresponding Spearman correlation coefficients. It appears that the propagation delay from meteorological drought to agricultural drought in this region shows a certain homogeneity, oscillating between 31 and 61 days depending on the different time scales, while displaying relatively low correlations.
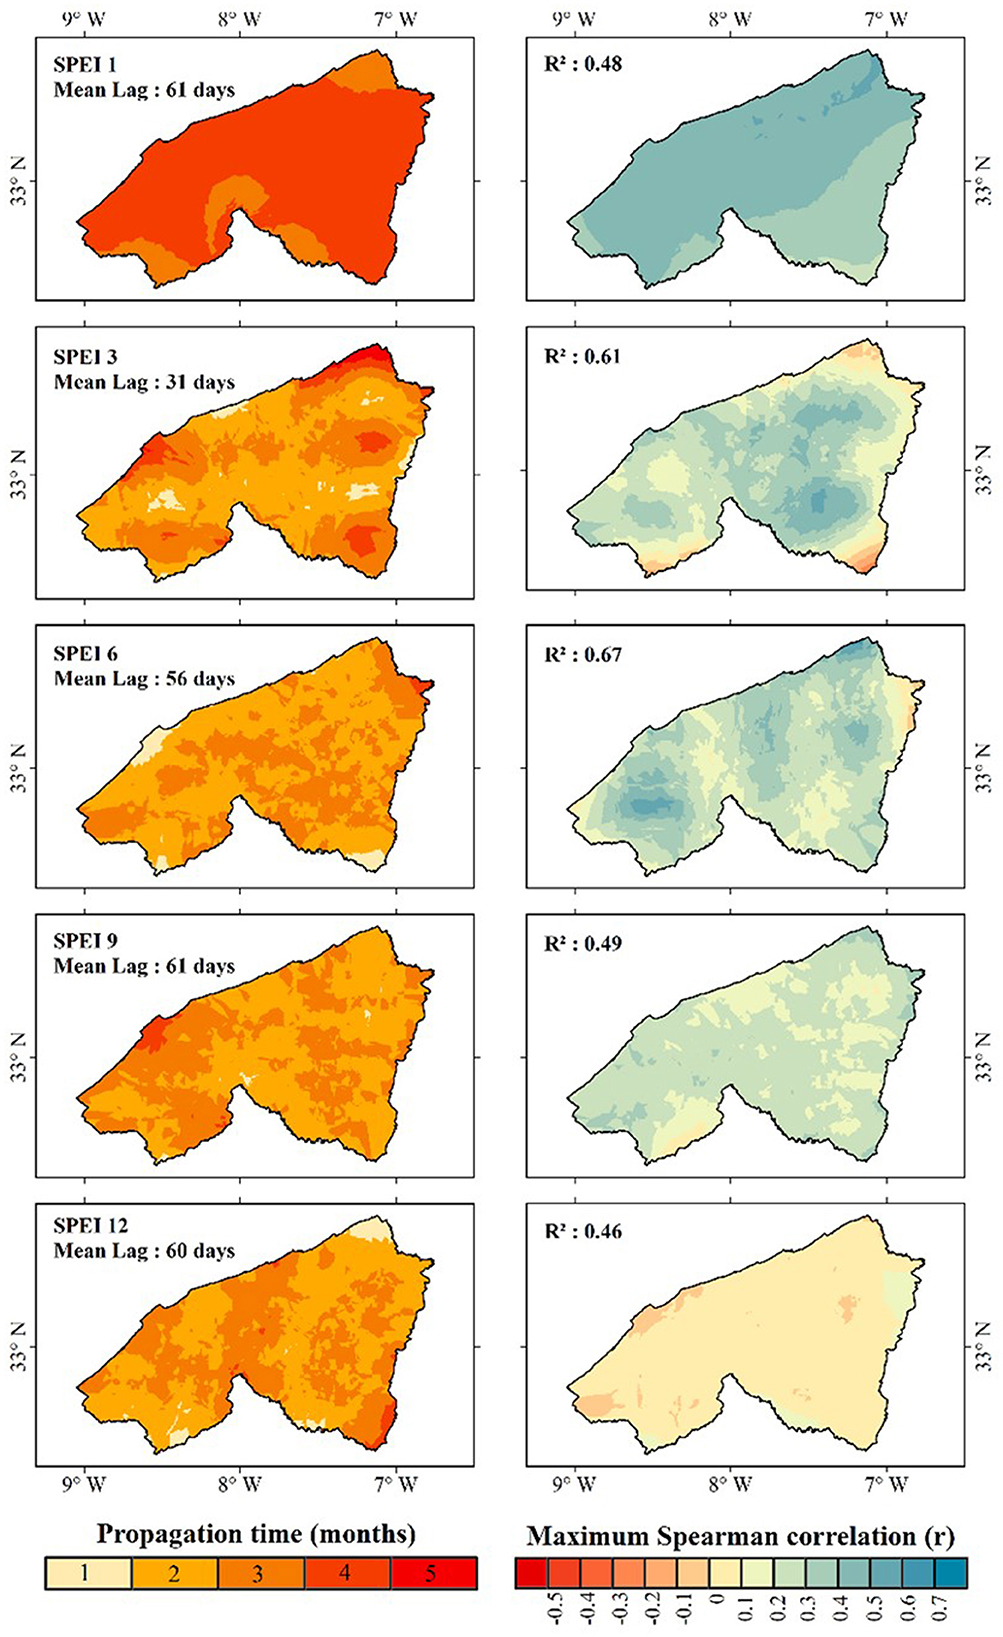
Figure 6. Propagation time from meteorological to agricultural drought and its corresponding Spearman correlation coefficient in the Casablanca Settat region.
In contrast, a shorter average delay of 31 days was observed using the SPEI at a 3-month scale. The Spearman rank correlation coefficient between SPEI3 and VHI in the study area is 0.61, indicating a substantial response relationship between agricultural drought and meteorological drought in the study area. Furthermore, in ~90% of the analyzed grids, the Spearman rank correlation coefficient was ≥0.60, highlighting the robustness of this correlation. This reinforces our findings that the quarterly SPEI3 index effectively captures agricultural drought conditions and can be used to predict this drought using the VHI.
SPEI at the 6-month scale showed a high correlation of 0.67, indicating a good response between agricultural drought and meteorological drought using this index. However, the average delay was 56 days, which indicates that SPEI at 6-month scales will take longer to predict agricultural drought. The maximum correlation was lower for SPEI at 1, 9, and 12-month scales, 0.48, 0.49, and 0.46, respectively. Also, the response between the two types of droughts was longer than SPEI3 and SPEI6, 61 days for SPEI1 and SPEI9 and 60 days for SPEI at 12-month scales.
At the seasonal scale, a relatively homogeneous drought propagation from meteorological to agricultural drought is observed across the entire Casablanca-Settat region. Figure 7 showing results from SPEI3 and VHI, reveals propagation delays that vary by season: 29 days in winter, 32 days in autumn, 82 days in spring, and 87 days in summer. The longer propagation times in spring and summer may be attributed to more prolonged meteorological and agricultural drought episodes, which limit the rapid succession of propagation events.
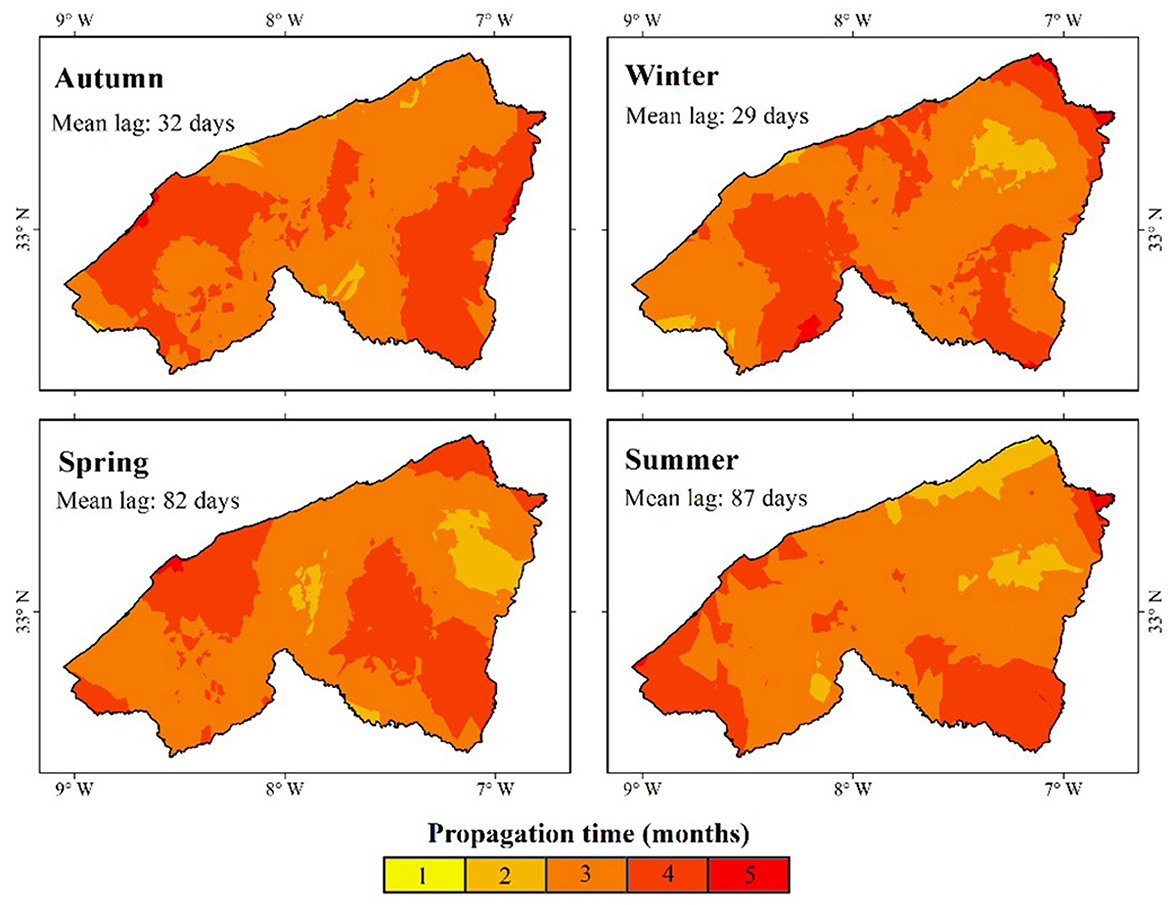
Figure 7. Seasonal variability of propagation time from meteorological to agricultural drought.
During winter, the drought propagation time covers the entire region uniformly. In autumn, this duration is significantly shortened, with a heterogeneous distribution of 3 to 4 months across the region. In spring, propagation is faster in the central part compared to the western and eastern areas. In summer, the propagation time remains like that observed in autumn, reflecting the region's consistent response to drought events despite seasonal variations.
Overall, seasonal differences in drought propagation time are minor in the study region. Propagation time in spring and summer (with average durations of 82 and 87 days, respectively) is slightly longer than in winter and autumn (with averages of 29 and 32 days, respectively). These observations align with previous research on drought propagation dynamics in similar environments. For example, Possega et al. (2023) reported a transition from meteorological drought to agricultural drought within 1 to 2 months in the Iberian region, influenced by the severity of the initial drought. Similarly, Amazirh et al. (2023), in their study on drought propagation in Africa using NDVI anomaly and SPEI3 indices, found that a persistent precipitation deficit translates into a soil moisture deficit in about a month before manifesting in vegetation. The results of this study are consistent with those of Amazirh et al. (2023) for northern and central Morocco, where a similar lag of 1 to 2 months is observed.
Several environmental factors can modulate these variations in the duration and spatial dynamics of drought propagation between meteorology and agriculture. Indeed, watershed characteristics, soil composition, and the structure of aquifer systems all influence the region's response to drought periods (Huang et al., 2017). Funk and Brown (2006) documented a typical 1–2 months lag between rainfall and vegetation response in semi-arid areas of Africa, particularly after periods of heavy rainfall. Thus, these results highlight the importance of considering local and regional factors in interpreting drought propagation patterns. They also highlight the relevance of using various indices to characterize agricultural drought and assess vegetation response times to water conditions, allowing for a more fine-grained analysis of climate impacts on plant ecosystems in the region.
Drought propagation demonstrates how a drought signal transitions from one type of drought to another, such as meteorological drought to agricultural drought. This demonstration is crucial for effectively predicting and managing drought impacts. Also, agricultural drought significantly impacts crop yield and food security, and by understanding propagation from meteorological to agricultural drought, we can predict and mitigate drought impacts and ensure food supply stability.
4.4 Probability of agricultural drought occurrence under meteorological drought scenarios
4.4.1 Best-fit copula for joint distribution of meteorological and agricultural drought indices
The copula function was used to quantify the propagation from meteorological to agricultural drought. Five copulas were selected for the best-fit test according to the Akaike Information Criterion (AIC) and Bayesian Information Criterion (BIC) goodness of fit test results. The copula with the lowest AIC and BIC compared to drought datasets is considered the best copula. The average AIC and BIC values for the region are shown in Table 4. The Frank copula function exhibits the lowest AIC and BIC values for describing the joint distribution between SPEI3 and VHI (e.g., MD to AD) with 49.6 in AIC and 45.7 in BIC, similar results using Clayton with 49.8 in AIC and 46.5 in BIC, the rest of the copulas show significant results with 54.5 in AIC and 46.8 in BIC using Gumbel, 65.2 in AIC and 54.3 in BIC using Gaussian and 67.3 in AIC and 54.7 in BIC using Student's copula. Figure 8 shows the spatial distributions of copula functions along with their respective percentages. The results indicate that the Frank copula fits 82.24% of the pixels, while the Gumbel copula fits 7.27%, and both the student's t and Clayton copulas fit 4.24% each. Statistical analysis demonstrates that the Frank copula provides the best fit, as evidenced by its lower AIC and BIC values. Based on these findings, the Frank copula is utilized to examine the conditional probability of the progression from meteorological drought to agricultural drought.
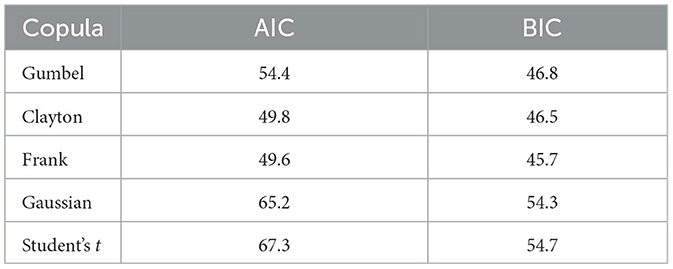
Table 4. Comparison of Five Copula using AIC and BIC.
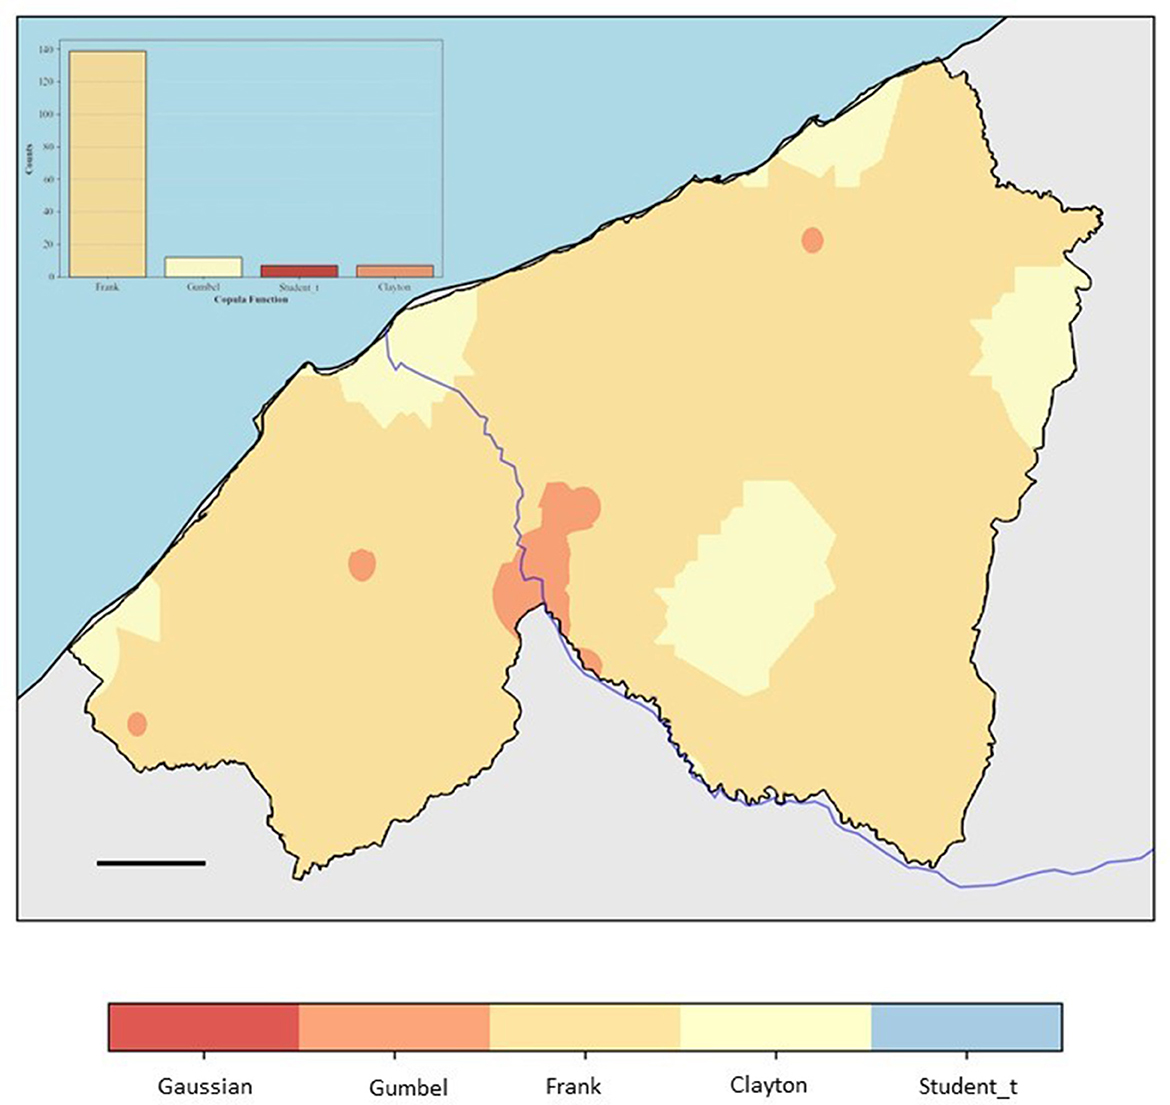
Figure 8. Spatial distribution of copula function fits and their pixel counts.
4.4.2 Conditional probability of drought propagation using Bayesian network
The research employed a copula with the best-fit function to calculate the conditional probability of propagation from meteorological drought to agricultural drought. The research was done under various drought conditions, including light, moderate, severe, and extreme, to understand the relationship between these two types of droughts comprehensively.
Figure 9 illustrates the probability of progression from meteorological drought to agricultural drought under various preceding drought conditions. The probabilities of meteorological drought (MD) transitioning to agricultural drought (AD) vary from mild to extreme classifications.
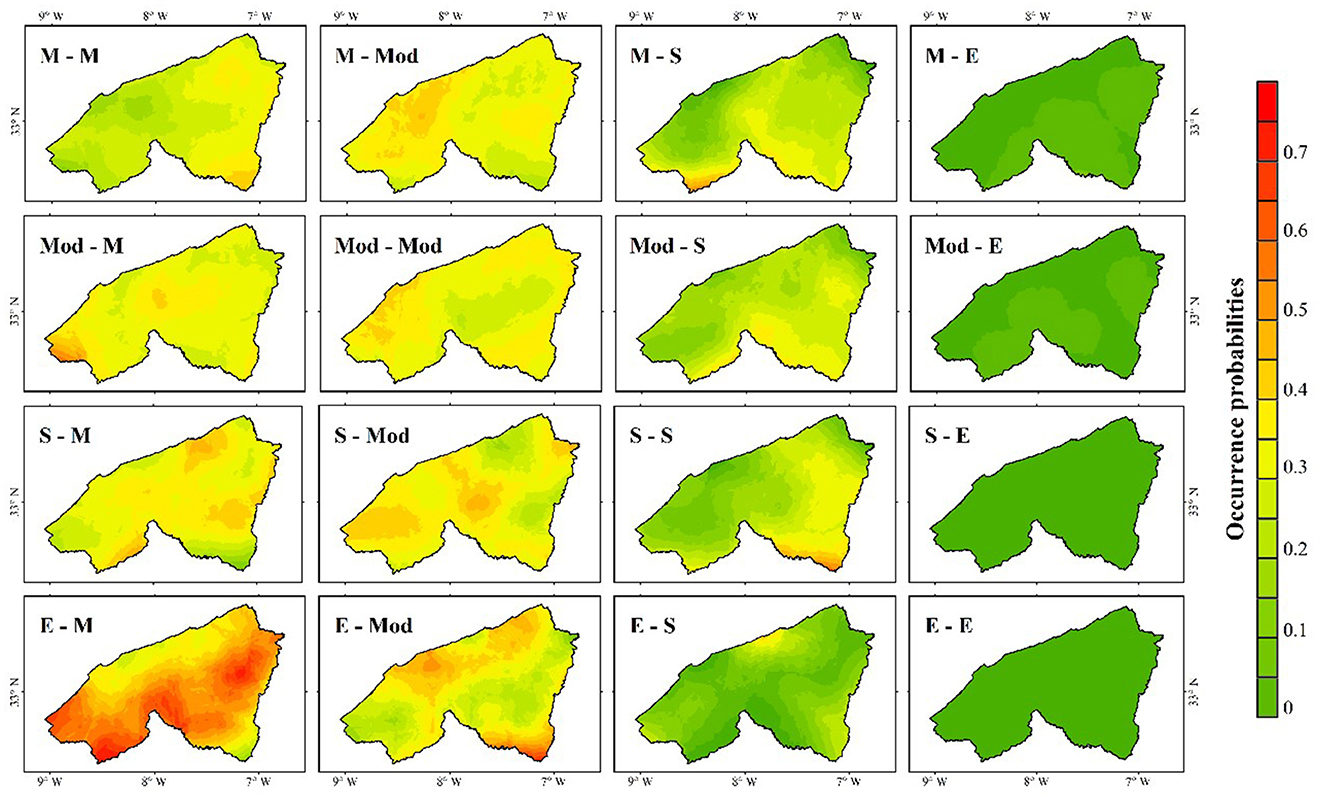
Figure 9. Probabilities of agricultural drought conditions under meteorological drought conditions (where M, Mod, S, and E represent mild, moderate, severe, and extreme drought, respectively. The first letter denotes the meteorological drought level, and the second letter denotes the agricultural drought level. For example, M–S represents the occurrence probability of severe agricultural drought under mild meteorological drought).
When meteorological drought is categorized as “Mild,” the occurrence probability for mild agricultural drought ranges from 0.1 to 0.3. Moderate agricultural drought probabilities average between 0.3 and 0.45, while severe agricultural droughts have a probability of 0.1 to 0.3. Extreme agricultural droughts show a probability between 0.5 and 1.5. Under moderate meteorological drought, the occurrence probability for mild agricultural drought averages between 0.3 and 0.4. For moderate agricultural drought, the probability ranges from 0.15 to 0.4; for severe agricultural drought, it is between 0.1 and 0.3, and for extreme agricultural drought, it falls between 0.05 and 0.15. In conditions of severe meteorological drought, the probability of mild agricultural drought ranges from 0.3 to 0.4, followed by moderate agricultural drought with probabilities from 0.1 to 0.4, severe agricultural drought ranging from 0.1 to 0.3, and extreme agricultural drought between 0 and 0.5. Under Extreme meteorological drought, the occurrence probability of mild agricultural drought is the highest, averaging 0.7 across most of the study area. Moderate agricultural drought has a probability averaging between 0.2 and 0.8, severe agricultural drought averages between 0.1 and 0.3, and extreme agricultural drought ranges from 0 to 0.5.
Our finding on drought occurrence probabilities indicates a strong link between meteorological and agricultural droughts. Even mild to moderate meteorological drought can lead to significant agricultural drought, with the likelihood of transition increasing as the severity of the meteorological drought rises. For instance, during extreme meteorological drought conditions, the probability of experiencing mild or moderate agricultural drought exceeds 0.7 in most areas studied. Furthermore, the consistent risk of agricultural drought occurring even during mild to moderate meteorological droughts ranging from 0.3 to 0.5 highlights the importance of implementing regional early warning systems and response strategies for irrigation planning and crop management immediately. Interestingly, the probability of facing extreme or severe agricultural drought remains low, even when severe or extreme meteorological drought conditions are present. This suggests that farmers have developed adaptive strategies to cope with high levels of drought stress or the occurrence of such events are very rare.
Droughts tend to be more frequent in the eastern parts of the study area compared to the western regions, largely due to the presence of irrigation fields in the east. Human activities also intensify the impacts of prolonged meteorological droughts by disrupting natural river flows and altering water retention times (Li et al., 2024), especially during periods of low streamflow. While irrigation can enhance soil moisture, helping to alleviate the effects of agricultural drought on vegetation, it can also reduce surface water levels, thereby increasing the risk of agricultural drought (Zhou et al., 2021b; Chang et al., 2017). These human-induced factors, compounded by climatic variability, affect arid regions over shorter periods and influence drought dynamics, particularly in intensively managed basins such as Oum Errabia and Bou Regreg, where this study is situated.
According to several studies including IPCC (2021), Morocco and the MENA region at large is a climate change hotspot. Observational scientific evidence show that various natural systems are impacted by regional climate changes, specifically temperature increases (Sarker, 2022). Agriculture is one of the most impacted economic sectors. Increase in droughts is a threat to food security. The findings of our study provide information on propagation of meteorological to agricultural drought. This information is an important component of early warning system for decision making in agricultural sector. The information can inform farmers on the choice of crops to plant, and where need be, decision makers can use the information to make key decisions such as food reservation and importation.
5 Conclusion
Agricultural drought is a complex phenomenon caused by different sources, natural and anthropogenic, which limits conventional temporal evolution. Different drought indices were calculated and compared in the Casablanca-Settat using multiple datasets to identify meteorological and agricultural droughts. Gridded datasets from PERSIAN-CDR (Precipitation) and ERA5 land (Temperature) were used to calculate SPEI in different time scales (1, 3, 6, 9, and 12), NDVI and LST from MODIS was used to calculate VCI, NDVI Anomaly and TCI. We also used VCI and TCI to calculate VHI, soil moisture from SMOS to calculate soil moisture anomaly index (SMI).
The findings indicate that VCI, NDVI Anomaly, and VHI exhibit the highest correlations with SPEI3, with correlation coefficients of 0.78, 0.71, and 0.63, respectively. The RMSE and MAE for VCI and NDVI Anomaly ranged from 1 to 1.5, while for VHI, they were between 0.5 and 1. Based on this information, we consider the combination of VHI and SPEI3 to be the most effective for using these datasets in this region, as they demonstrate a strong correlation and low statistical error metrics (RMSE and MAE).
The average propagation times from meteorological drought to agricultural drought were 31 days, and the seasonal time was 32, 29, 82, and 87 in autumn, winter, spring, and summer, respectively. The occurrence probabilities for agricultural droughts under various preceding meteorological drought conditions were calculated using the copula function and Bayesian network. Research findings indicate that the likelihood of agricultural drought rises with the severity of meteorological drought, highlighting a strong correlation between the two types of droughts. Additionally, the high probability of agricultural drought, even during periods of mild or moderate meteorological drought, underscores the necessity for building local resilience. This can be achieved by implementing an early drought warning system that provides farmers with specific recommendations, which may not be apparent during Mild or moderate drought conditions.
Propagation times and probabilities for MD to AD show different change patterns in the study area, indicating that the output of combining copula and Bayesian network using different drought indices as a tool for drought early warning can be helpful to tasks such as risk assessment for drought management and for local policymakers in managing agriculture seasoned and drought, While copula-based models provide a promising approach for agricultural drought early warning, the complexity of the models, the need to assess different distributions and the need for accurate parameter estimation can pose challenges in practical applications.
Data availability statement
The original contributions presented in the study are included in the article/supplementary material, further inquiries can be directed to the corresponding author.
Author contributions
YD: Conceptualization, Formal analysis, Investigation, Methodology, Validation, Visualization, Writing – original draft, Writing – review & editing, Project administration. VO: Formal analysis, Funding acquisition, Supervision, Writing – review & editing. AH: Formal analysis, Writing – review & editing. MK: Formal analysis, Writing – review & editing. OH: Formal analysis, Visualization, Writing – review & editing. AC: Writing – review & editing.
Funding
The author(s) declare that financial support was received for the research and/or publication of this article. This research was funded by the UM6P (Mohammed VI Polytechnic University) through a startup research grant for Professor Victor Ongoma.
Acknowledgments
We would like to appreciate all the sources of data used in this study namely, European Medium-Range Weather Prediction Centre for ERA5, the Climate Hazards Group for CHIRPS, and NOAA NCDC (National Climatic Data Center) for PERSIANN-CDR.
Conflict of interest
The authors declare that the research was conducted in the absence of any commercial or financial relationships that could be construed as a potential conflict of interest.
Generative AI statement
The author(s) declare that no Gen AI was used in the creation of this manuscript.
Publisher's note
All claims expressed in this article are solely those of the authors and do not necessarily represent those of their affiliated organizations, or those of the publisher, the editors and the reviewers. Any product that may be evaluated in this article, or claim that may be made by its manufacturer, is not guaranteed or endorsed by the publisher.
References
Acharki, S., Singh, S. K., do Couto, E.V., Arjdal, Y., and Elbeltagi, A. (2023). Spatio-temporal distribution and prediction of agricultural and meteorological drought in a Mediterranean coastal watershed via GIS and machine learning. Phys. Chem. Earth 131:103425. doi: 10.1016/j.pce.2023.103425
Achli, S., Epule, T. E., Dhiba, D., Salih, W., and Chehbouni, A. (2024). Vulnerability of maize, barley, and wheat yields to growing season temperature and socioeconomic indicators in Morocco. J. Water Clim. Change 15, 1588–1611. doi: 10.2166/wcc.2024.498
Ait Dhmane, L., Moustadraf, J., Rachdane, M., Saidi, M. E., Benjmel, K., Amraoui, F., et al. (2023). Spatiotemporal assessment and correction of gridded precipitation products in north western Morocco. Atmos 14:1239. doi: 10.3390/atmos14081239
Alfani, F., Molini, V., Pallante, G., and Palma, A. (2023). “Job displacement and reallocation failure,” in Evidence from Climate Shocks in Morocco. (Washington, DC: World Bank).
Amazirh, A., Chehbouni, A., Bouras, E. H., Benkirane, M., Hssaine, B. A., and Entekhabi, D. (2023). Drought cascade lag time estimation across Africa based on remote sensing of hydrological cycle components. Adv. Water Resour. 182:104586. doi: 10.1016/j.advwatres.2023.104586
Anyamba, A., and Tucker, C. J. (2012). “Historical perspective of AVHRR NDVI and vegetation drought monitoring” in Remote Sensing of Drought: Innovative Monitoring Approaches, eds. B. D. Wardlow, M. C. Anderson, and J. P. Verdin (Boca Raton: CRC Press).
Apurv, T., Sivapalan, M., and Cai, X. (2017). Understanding the role of climate characteristics in drought propagation. Water Resour. Res. 53, 9304–9329. doi: 10.1002/2017WR021445
Arora, V. K. (2002). The use of the aridity index to assess climate change effect on annual runoff. J. Hydrol. 265, 164–177. doi: 10.1016/S0022-1694(02)00101-4
Avilés, A., Célleri, R., Solera, A., and Paredes, J. (2016). Probabilistic forecasting of drought events using markov chain- and bayesian network-based models: a case study of an andean regulated river basin. Water 8:37. doi: 10.3390/w8020037
Bai, X., Jin, J., Wu, C., Zhou, R., Zhou, Y., Ning, S., et al. (2023). Cloud transformation algorithm and Copulas function coupling model for drought hazard comprehensive evaluation. Ecol. Eng.187:106870. doi: 10.1016/j.ecoleng.2022.106870
Bai, Y., Yang, Y., and Jiang, H. (2019). Intercomparison of AVHRR GIMMS3g, Terra MODIS, and SPOT-VGT NDVI products over the Mongolian plateau. Remote Sens. 11:2030. doi: 10.3390/rs11172030
Bento, V. A., Gouveia, C. M., DaCamara, C. C., and Trigo, I. F. (2018). A climatological assessment of drought impact on vegetation health index. Agric. For. Meteorol. 259, 286–295. doi: 10.1016/j.agrformet.2018.05.014
Bergman, K., Sabol, P., and Miskus, D. (1988). “Experimental indices for monitoring global drought conditions,” in Proceedings of the 13th Annual Climate Diagnostics Workshop. 190–197.
Bossenbroek, L., and Ftouhi, H. (2024). “Altering water flows in the Draa valley, Morocco: a feminist analysis,” in Handbook of Gender and Water Governance, 1st Edn, eds. T. Acevedo-Guerrero, L. Bossenbroek, I. Leonardelli, M. Zwarteveen, and S. Kulkarni, (London: Routledge).
Bouizrou, I., Bouadila, A., Aqnouy, M., and Gourfi, A. (2023). Assessment of remotely sensed precipitation products for climatic and hydrological studies in arid to semi-arid data-scarce region, central-western Morocco. Remote Sens. Appl. Soc. Environ. 30:100976. doi: 10.1016/j.rsase.2023.100976
Bouras, E. H., Jarlan, L., Er-Raki, S., Albergel, C., Richard, B., Balaghi, R., et al. (2020). Linkages between rainfed cereal production and agricultural drought through remote sensing indices and a land data assimilation system: a case study in Morocco. Remote Sens. 12:4018. doi: 10.3390/rs12244018
Cammalleri, C., McCormick, N., Spinoni, J., and Nielsen-Gammon, J. W. (2024). An analysis of the lagged relationship between anomalies of precipitation and soil moisture and its potential role in agricultural drought early warning. J. Climatol. Appl. Meteorol. 63, 339–350. doi: 10.1175/JAMC-D-23-0077.1
Chai, Q., Wang, T., and Di, C. (2021). Evaluating the impacts of environmental factors on soil moisture temporal dynamics at different time scales. J. Water Clim. Change 12, 420–432. doi: 10.2166/wcc.2020.011
Chang, J., Li, Y., Yuan, M., and Wang, Y. (2017). Efficiency evaluation of hydropower station operation: a case study of Longyangxia station in the Yellow river, China. Energy 135, 23–31. doi: 10.1016/j.energy.2017.06.049
Didan, K. (2021). “MODIS/Terra vegetation indices monthly L3 global 1km SIN grid V061 [data set], in NASA EOSDIS Land Processes Distributed Active Archive Center.
Ejaz, N., Bahrawi, J., Alghamdi, K. M., Rahman, K. U., and Shang, S. (2023). Drought monitoring using landsat derived indices and google earth engine platform: a case study from Al-Lith Watershed, kingdom of Saudi Arabia. Remote Sens. 15:984. doi: 10.3390/rs15040984
Elair, C., Rkha Chaham, K., and Hadri, A. (2023). Assessment of drought variability in the Marrakech-Safi region (Morocco) at different time scales using GIS and remote sensing. Water Supply 23, 4592–4624. doi: 10.2166/ws.2023.283
Er-Raki, S., Chehbouni, A., Ezzahar, J., Khabba, S., Lakhal, E. K., and Duchemin, B. (2011). Derived crop coefficients for winter wheat using different reference evapotranspiration estimates methods. J. Agric. Sci. Technol. 13, 209–221.
Er-Raki, S., Chehbouni, A., Khabba, S., Simonneaux, V., Jarlan, L., Ouldbba, A., et al. (2010). Assessment of reference evapotranspiration methods in semi-arid regions: can weather forecast data be used as alternate of ground meteorological parameters? J. Arid Environ. 74, 1587–1596. doi: 10.1016/j.jaridenv.2010.07.002
Ezzine, H., Bouziane, A., and Ouazar, D. (2014). Seasonal comparisons of meteorological and agricultural drought indices in Morocco using open short time-series data. Int. J. Appl. Earth Obs. Geoinf. 26, 36–48. doi: 10.1016/j.jag.2013.05.005
Fang, W., Huang, S. Z., Huang, G. H., Huang, Q., Wang, H., Leng, G. Y., et al. (2019b). Probabilistic assessment of remote sensing-based terrestrial vegetation vulnerability to drought stress of the Loess Plateau in China. Remote Sens. Environ. 232:111290. doi: 10.1016/j.rse.2019.111290
Fang, W., Huang, S. Z., Huang, Q., Huang, G. H., Wang, H., Wang, L., et al. (2019a). Copulas-based risk analysis for inter-seasonal combinations of wet and dry conditions under a changing climate. Int. J. Climatol. 39, 2005–2021. doi: 10.1002/joc.5929
Fang, W., Shengzhi, H., Qiang, H., Huang, G., Wang, H., Leng, G., et al. (2020). Identifying drought propagation by simultaneously considering linear and nonlinear dependence in the Wei River basin of the Loess Plateau, China. J. Hydrol. 591:125287. doi: 10.1016/j.jhydrol.2020.125287
Fernández, F. J., Vásquez-Lavín, F., Ponce, R. D., Garreaud, R., Hernández, F., Link, O., et al. (2023). The economics impacts of long-run droughts: Challenges, gaps, and way forward. J. Environ. Manage. 344:118726. doi: 10.1016/j.jenvman.2023.118726
Filho, W. L., Wall, T., Salvia, A. L., Dinis, M. A., and Mifsud, M. (2023). The central role of climate action in achieving the United Nations' sustainable development goals. Sci. Rep. 13, 1–7. doi: 10.1038/s41598-023-47746-w
Funk, C. C., and Brown, M. E. (2006). Intra-seasonal NDVI change projections in semi-arid Africa. Remote Sens. Environ. 101, 249–256. doi: 10.1016/j.rse.2005.12.014
Geng, G., Zhang, B., Gu, Q., He, Z., and Zheng, R. (2024). Drought propagation characteristics across China: time, probability, and threshold. J. Hydrol. 631:130805. doi: 10.1016/j.jhydrol.2024.130805
Guo, Y., Huang, S., Huang, Q., Leng, G., Fang, W., Wang, L., et al. (2020). Propagation thresholds of meteorological drought for triggering hydrological drought at various levels. Sci. Total Environ. 712:136502. doi: 10.1016/j.scitotenv.2020.136502
Hadri, A., Ndiaye, A. S., Khadir, L., Jaffar, O., Zamzami, H. A., El Khalki, E. M., et al. (2024). Spatio-temporal analysis of meteorological drought return periods in a Mediterranean arid region, the center of Morocco. J. Water Clim. Chang. 15, 4573–4595. doi: 10.2166/wcc.2024.192
Hakam, O., Baali, A., Azennoud, K., Lyazidi, A., and Bourchachen, M. (2023). Assessments of drought effects on plant production using satellite remote sensing technology, gis and observed climate data in Northwest Morocco, case of the lower Sebou Basin. Int. J. Plant Prod. 17, 267–282. doi: 10.1007/s42106-023-00236-5
Hamed, M. M., Sobh, M. T., Ali, Z., Nashwan, M. S., and Shahid, S. (2024). Aridity shifts in the MENA region under the Paris agreement climate change scenarios. Glob. Planet. Change 238:104483. doi: 10.1016/j.gloplacha.2024.104483
Hamid, M., Aguerd, J., and El Ghachi, M. (2024). “Climatic Drought in the Hydraulic Basin of Oum Er Rbia, Morocco (1980–2021): Statistical and Cartographic Analysis,” in Climate Change Effects and Sustainability Needs, eds. K. Kahime, M. El Yamani, and S. Pouffary (Cham: Springer), 65–77.
Han, Z., Huang, S., Huang, Q., Leng, G., Liu, Y., Bai, Q., et al. (2021). GRACE-based high-resolution propagation threshold from meteorological to groundwater drought. Agric. For. Meteorol. 307:108476. doi: 10.1016/j.agrformet.2021.108476
Henchiri, M., Igbawua, T., Javed, T., Bai, Y., Zhang, S., Essi,fi, B., et al. (2021). Meteorological drought analysis and return periods over North and West Africa and linkage with El Niño–Southern Oscillation (ENSO). Remote Sens. 13:4730. doi: 10.3390/rs13234730
Henning, D., and Flohn, D. (1977). “Climat aridity index map,” in United nations conference on desertification. Nairobi 30 August- 9 Sept.1977. Doc. A/conf. 74/31 (Paris-Rome: FAO et UNESCO).
High Commission for Planning (2024). Recensement Général de la Population et de l'Habitat 2024. Kingdom of Morocco, Rabat, Morocco.
Houmma, I. H., Gadal, S., Mansouri, L. E., Hadria, R., and Gbetkom, P. G. (2024). “A Composite approach to assessing similarity in the risk level of agricultural drought: an example of the tensift and moulouya watershed in Morocco,” in Recent Research on Geotechnical Engineering, Remote Sensing, Geophysics and Earthquake Seismology, eds. M. Bezzeghoud, Z. A. Ergüler, J. Rodrigo-Comino, M. K. Jat, R. Kalatehjari, D. S. Bisht, et al. (Cham: Springer). doi: 10.1007/978-3-031-48715-6_29
Hsu, K., Ashouri, H., Braithwaite, D., and Sorooshian, S. (2014). “Climate Algorithm Theoretical Basis Document (C-ATBD)—Precipitation—PERSIANN-CDR. Washington, DC: National Oceanic and Atmospheric Administration.
Huang, S., Li, P., Huang, Q., Leng, G., Hou, B., and Ma, L. (2017). The propagation from meteorological to hydrological drought and its potential influence factors. J. Hydrol. 547, 184–195. doi: 10.1016/j.jhydrol.2017.01.041
IPCC (2021). “Climate Change 2021: The Physical Science Basis,” Contribution of Working Group I to the Sixth Assessment Report of the Intergovernmental Panel on Climate Change, eds. V. Masson-Delmotte, P. Zhai, A. Pirani, S. L. Connors, C. Péan, S. Berger, et al. (New York, NY: Cambridge University Press), 2391. doi: 10.1017/9781009157896
Jung, H., Won, J., Kang, S., and Kim, L. H. (2022). Characterization of the propagation of meteorological drought using the copula model. Water 14:3293. doi: 10.3390/w14203293
Kanthavel, P., Jhajharia, D., Yurembam, G., and Mirabbasi, R. (2023). “Comparative copula-based multivariate meteorological drought analysis,” in Integrated Drought Management (Boca Raton: CRC Press).
Kim, S. U., and Seo, D. I. (2025). Comparison of the drought return periods by univariate, bivariate probability distribution, and copula function under SSPs scenarios. Theor. Appl. Climatol. 156:67. doi: 10.1007/s00704-024-05248-3
Kogan, F. N. (1995). Droughts of the late 1980s in the United States as derived from NOAA polar-orbiting satellite data. Bull. Am. Meteorol. Soc. 76, 655–668.
Lachgar, R., Badri, W., and Chlaida, M. (2022). Assessment of future changes in downscaled temperature and precipitation over the Casablanca-Settat region (Morocco). Model. Earth Syst. Environ. 8, 2123–2133. doi: 10.1007/s40808-021-01213-5
Li, H., Li, Y., Huang, G., and Sun, J. (2021). Probabilistic assessment of crop yield loss to drought time-scales in Xinjiang, China. Int. J. Climatol. 41, 4077–4094. doi: 10.1002/joc.7059
Li, J., Guo, Y., Wang, Y., Lu, S., and Chen, X. (2018). Drought propagation patterns under naturalized condition using daily hydrometeorological data. Adv. Meteorol. 2469156. doi: 10.1155/2018/2469156
Li, R., Chen, N., Zhang, X., Zeng, L., Wang, X., Tang, S., et al. (2020). Quantitative analysis of agricultural drought propagation process in the Yangtze River Basin by using cross-wavelet analysis and spatial autocorrelation. Agric. For. Meteorol. 280:107809. doi: 10.1016/j.agrformet.2019.107809
Li, Y., Huang, Y., Li, Y., Zhang, H., Fan, J., Deng, Q., et al. (2024). Spatiotemporal heterogeneity in meteorological and hydrological drought patterns and propagations influenced by climatic variability, LULC change, and human regulations. Sci. Rep. 14, 1–18. doi: 10.1038/s41598-024-56526-z
Liu, S., van Meerveld, I., Zhao, Y., Wang, Y., and Kirchner, J. W. (2024). Seasonal dynamics and spatial patterns of soil moisture in a loess catchment. Hydrol. Earth Syst. Sci. 28, 205–216. doi: 10.5194/hess-28-205-2024
Liu, Y., Huang, S., Guo, Y., Liu, Y., Li, Z., and Huang, Q. (2022). Propagation threshold of meteorological drought to different levels of hydrological drought. a case study of Qinhe River basin. J. Hydrol. Eng. 41, 9–19. (In Chinese, summary provided.)
Ma, F., and Yuan, X. (2024). Vegetation greening and climate warming increased the propagation risk from meteorological drought to soil drought at subseasonal timescales. Geophys. Res. Lett. 51. doi: 10.1029/2023GL107937
Ma, W., Wang, X., Zhou, N., and Jiao, L. (2017). Relative importance of climate factors and human activities in impacting vegetation dynamics during 2000–2015 in the Otindag Sandy Land, northern China. J. Arid. Land 9, 558–567. doi: 10.1007/s40333-017-0062-y
Madadgar, S., AghaKouchak, A., Farahmand, A., and Davis, S. J. (2017). Probabilistic estimates of drought impacts on agricultural production. Geophys. Res. Lett. 44, 7799–7807. doi: 10.1002/2017GL073606
MAPMDREE (2018). Monographie Agricole De La Region Casablanca-Settat. Kingdom of Morocco, Casablanca, Morocco.
Mckee, T. B., Doesken, N. J., and Kleist, J. (1993). “The relationship of drought frequency and duration to time scales,” in Paper Presented at the Eighth Conference on Applied Climatology.
Michele, D., and Salvadori, G. (2003). A Generalized Pareto intensity-duration model of storm rainfall exploiting 2-Copulas. J. Geophys. Res. 108:4067. doi: 10.1029/2002JD002534
Muñoz-Sabater, J., Dutra, E., Agustí-Panareda, A., Albergel, C., Arduini, G., Balsamo, G., et al. (2021). ERA5-Land: a state-of-the-art global reanalysis dataset for land applications. Earth Syst. Sci. Data 13, 4349–4383. doi: 10.5194/essd-13-4349-2021
Naamane, A., Sadiq, A., Belhouari, A., Iounes, N., and El Amrani, S. (2020). Enquête sur l'utilisation des engrais et pesticides chez les agriculteurs de la région de Casablanca-Settat. Rev. Mar. Sci. Agron. Vét. 8, 279–285.
Nazeri Tahroudi, M., Ramezani, Y., De Michele, C., and Mirabbasi, R. (2020). A new method for joint frequency analysis of modified precipitation anomaly percentage and streamflow drought index based on the conditional density of copula functions. W. Resour. Manag. 34, 4217–4231. doi: 10.1007/s11269-020-02666-6
Nemani, R. R., Keeling, C. D., Hashimoto, H., Jolly, W. M., Piper, S. C., Tucker, C. J., et al. (2003). Climate-driven increases in global terrestrial net primary production from 1982 to 1999. Science 300, 1560–1563. doi: 10.1126/science.1082750
Ouatiki, H., Boudhar, A., Tramblay, Y., Jarlan, L., Benabdelouhab, T., Hanich, L., et al. (2017). Evaluation of TRMM 3B42 V7 Rainfall Product over the Oum Er Rbia Watershed in Morocco. Climate 5:1. doi: 10.3390/cli5010001
Ouharba, E. H., Mabrouki, J., and Triqui, Z. E. A. (2024). Assessment and future climate dynamics in the Bouregreg basin, Morocco—impacts and adaptation alternatives. Ecol. Eng. Environ. Technol. 25, 51–63. doi: 10.12912/27197050/177823
Pan, M., Yuan, X., and Wood, E. F. (2013). A probabilistic framework for assessing drought recovery. Geophys. Res. Lett. 40, 3637–3642. doi: 10.1002/grl.50728
Ponce, V. M., Pandey, R. P., and Ercan, S. (2000). Characterization of drought across climatic spectrum. J. Hydrol. Eng. 5, 222–224. doi: 10.1061/(ASCE)1084-0699(2000)5:2(222)
Poonia, V., Jha, S., and Goyal, M. K. (2021). Copula based analysis of meteorological, hydrological and agricultural drought characteristics across Indian river basins. Int. J. Climatol. 41, 4637–4652. doi: 10.1002/joc.7091
Possega, M., García-Valdecasas Ojeda, M., and Gámiz-Fortis, S. R. (2023). Multi-scale analysis of agricultural drought propagation on the iberian peninsula using non-parametric indices. Water 15:2032. doi: 10.3390/w15112032
Rachdane, M., El Khalki, M., Saidi, M. E., Nehmadou, M., Ahbari, A., and Tramblay, Y. (2022). Comparison of high-resolution satellite precipitation products in Sub-Saharan Morocco. Water 14:3336. doi: 10.3390/w14203336
Ribeiro, A. F., Russo, A., Gouveia, C. M., and Páscoa, P. (2019). Copula-based agricultural drought risk of rainfed cropping systems. Agric. Water Manag. 223:105689. doi: 10.1016/j.agwat.2019.105689
Saharwardi, M. S., Dasari, H. P., Aggarwal, V., Ashok, K., and Hoteit, I. (2023). Long-term variability in the Arabian Peninsula droughts driven by the Atlantic Multidecadal Oscillation. Earth's Future 11:e2023EF003549. doi: 10.1029/2023EF003549
Salih, W., Chehbouni, A., and Epule, T. E. (2022). Evaluation of the performance of multi-source satellite products in simulating observed precipitation over the tensift basin in Morocco. Remote Sens. 14:1171. doi: 10.3390/rs14051171
Salvadori, G., and Michele, C. D. (2004). Frequency analysis via copulas: theoretical aspects and applications to hydrological events. Water Resour. Res. 40. doi: 10.1029/2004WR003133
Saouabe, T., Ait Naceur, K., El Khalki, E. M., Hadri, A., and Saidi, E. M. (2022). GPM-IMERG product: a new way to assess the climate change impact on water resources in a Moroccan semi-arid basin. J. Water Clim. Change 13, 2559–2576. doi: 10.2166/wcc.2022.403
Sarker, S. (2022). Fundamentals of climatology for engineers: lecture note. Eng. 3, 573–595. doi: 10.3390/eng3040040
Sattar, M. N., and Kim, T. W. (2018). Probabilistic characteristics of lag time between meteorological and hydrological droughts using a bayesian model. Terr. Atmos. Ocean. Sci. 29, 709–720. doi: 10.3319/TAO.2018.07.01.01
Sattar, M. N., Lee, J.-Y., Shin, J.-Y., and Kim, T. W. (2019). Probabilistic characteristics of drought propagation from meteorological to hydrological drought in South Korea. Water Resour. Manag. 33, 2439–2452. doi: 10.1007/s11269-019-02278-9
Shin, J. Y., Ajmal, M., Yoo, J., and Kim, W. (2016). A bayesian network-based probabilistic framework for drought forecasting and outlook. Adv. Meteorol. 2016:9472605. doi: 10.1155/2016/9472605
Shin, J. Y., Kwon, H., Lee, H., and Kim, W. (2019). Probabilistic long-term hydrological drought forecast using Bayesian networks and drought propagation. Meteorol. Appl. 27:e1827. doi: 10.1002/met.1827
Sklar, A. (1959). Fonctions de repartition à n dimensions et leurs marges. Public. Inst. Statis. Univ.Paris 8, 229–231.
Talebi, H., and Samadianfard, S. (2024). Integration of machine learning and remote sensing for drought index prediction: a framework for water resource crisis management. Earth Sci. Inform. 17, 4949–4968. doi: 10.1007/s12145-024-01437-w
Tribak, A., Paradiso, M., and Azagouagh, K. (2018). “Climate refugees, housing in risk areas, and vulnerability of the built environment in the Fez urban area of Morocco (case of the Medina and outlying districts),” in Mediterranean Mobilities, ed. M. Paradiso (Cham: Springer), 139–155. doi: 10.1007/978-3-319-89632-8_12
Tuel, A., and El Moçayd, N. (2023). Evaluating extreme precipitation in gridded datasets with a novel station database in Morocco. Stoch. Environ. Res. Risk Assess. 37, 3085–3097. doi: 10.1007/s00477-023-02437-w
Vaani, N., and Porchelvan, P. (2017). GIS based agricultural drought assessment for the state of Tamilnadu, India using vegetation condition index (VCI). Int. J. Civil Eng. Technol. 8, 1185–1194.
Vermote, E. F., and Saleous, N. (2006). “Operational atmospheric correction of MODIS visible to milddle infrared land surface data in the case of an infinite Lambertian target,” in Earth Science Satellite Remote Sensing: Vol. 1: Science and Instruments (New York, NY: Springer), 123–153.
Verner, D., Treguer, D. O., Redwood, J., Christensen, J. H., Mcdonnell, R., Elbert, C., et al. (2018). Climate variability, drought, and drought management in morocco's agricultural sector (english). Washington, DC: World Bank Group.
Vicente-Serrano, S. M., Beguería, S., and López-Moreno, J. I. (2010). A multiscalar drought index sensitive to global warming: the standardized precipitation evapotranspiration index. J. Clim. 23, 1696–1718. doi: 10.1175/2009JCLI2909.1
Wan, Z., Hook, S., and Hulley, G. (2021). MODIS/Terra Land Surface Temperature/Emissivity 8-Day L3 Global 1km SIN Grid V061. NASA EOSDIS Land Processes Distributed Active Archive Center. doi: 10.5067/MODIS/MOD11A2.061
Wassie, W. A., Assegahegn, G. F., Tsegaye, B. A., and Mekonnen, A. B. (2022). Evaluation of intrarow spacing on growth and yield performance of four onion (Allium cepa L.) varieties in Beyeda district, North Gondar, Ethiopia. Adv. Agric. 9408607. doi: 10.1155/2022/9408607
WMO (2022). Droughts threaten sustainable development. Available online at: https://wmo.int/media/news/droughts-threatensustainable-development (accessed January 6, 2025).
Wu, J., Chen, X., Yao, H., Gao, L., Chen, Y., and Liu, M. (2017). Non-linear relationship of hydrological drought responding to meteorological drought and impact of a large reservoir. J. Hydrol. 551, 495–507. doi: 10.1016/j.jhydrol.2017.06.029
Wu, Z., Lin, Q., Lu, G., He, H., and Qu, J. J. (2015). Analysis of hydrological drought frequency for the Xijiang River Basin in South China using observed streamflow data. Nat. Hazards 77, 1655–1677. doi: 10.1007/s11069-015-1668-z
Xu, Z., Wu, Z., Guo, X., and He, H. (2023). Estimation of water required to recover from agricultural drought: perspective from regression and probabilistic analysis methods. J. Hydrol. 617:128888. doi: 10.1016/j.jhydrol.2022.128888
Yang, X., Li, Y. P., Huang, G. H., and Zhang, S. Q. (2022). Analyzing spatial–temporal change of multivariate drought risk based on Bayesian copula: application to the Balkhash Lake basin. Theor. Appl. Climatol. 149, 787–804. doi: 10.1007/s00704-022-04062-z
Yu, M., Liu, X., and Li, Q. (2020). Responses of meteorological drought–hydrological drought propagation to watershed scales in the upper Huaihe River basin, China. Environ. Sci. Pollut. Res. 27, 17561–17570. doi: 10.1007/s11356-019-06413-2
Zhengguang, X., Zhiyong, W., Quanxi, S., Hai, H., and Xiao, G.uo. (2023). From meteorological to agricultural drought: propagation time and probabilistic linkages. J. Hydrol. Reg. Stud. 46:101329. doi: 10.1016/j.ejrh.2023.101329
Zhim, S., Larabi, A., and Brirhet, H. (2019). Analysis of precipitation time series and regional drought assessment based on the standardized precipitation index in the Oum Er-Rbia basin (Morocco). Arab. J. Geosci. 12:507. doi: 10.1007/s12517-019-4656-x
Zhou, Z., Shi, H., Fu, Q., Ding, Y., Li, T., Wang, Y., et al. (2021a). Investigating the propagation from meteorological to hydrological drought by introducing the nonlinear dependence with directed information transfer index. Water Resour. Res. 57:e2021WR030028. doi: 10.1029/2021WR030028
Zhou, Z., Shi, H., Fu, Q., Ding, Y., Li, T., Wang, Y., et al. (2021b). Characteristics of propagation from meteorological drought to hydrological drought in the Pearl River basin. J. Geophys. Res. Atmos. 126:e2020JD033959. doi: 10.1029/2020JD033959
Zkhiri, W., Tramblay, Y., Hanich, L., Jarlan, L., and Ruelland, D. (2019). Spatiotemporal characterization of current and future droughts in the high Atlas basins (Morocco). Theor. Appl. Climatol. 135, 593–605. doi: 10.1007/s00704-018-2388-6
Keywords: agriculture, drought, early warning system, food security, Morocco
Citation: Dahhane Y, Ongoma V, Hadri A, Kharrou MH, Hakam O and Chehbouni A (2025) Probabilistic linkages of propagation from meteorological to agricultural drought in the North African semi-arid region. Front. Water 7:1559046. doi: 10.3389/frwa.2025.1559046
Received: 11 January 2025; Accepted: 17 March 2025;
Published: 08 April 2025.
Edited by:
Munir Ahmad Nayak, Indian Institute of Technology Indore, IndiaReviewed by:
Shiblu Sarker, Virginia Department of Conservation and Recreation, United StatesMd Saquib Saharwardi, King Abdullah University of Science and Technology, Saudi Arabia
Iqura Malik, Indian Institute of Technology Gandhinagar, India
Copyright © 2025 Dahhane, Ongoma, Hadri, Kharrou, Hakam and Chehbouni. This is an open-access article distributed under the terms of the Creative Commons Attribution License (CC BY). The use, distribution or reproduction in other forums is permitted, provided the original author(s) and the copyright owner(s) are credited and that the original publication in this journal is cited, in accordance with accepted academic practice. No use, distribution or reproduction is permitted which does not comply with these terms.
*Correspondence: Younes Dahhane, ZGFoaGFuZS55b3VuZXNAdW02cC5tYQ==