
95% of researchers rate our articles as excellent or good
Learn more about the work of our research integrity team to safeguard the quality of each article we publish.
Find out more
ORIGINAL RESEARCH article
Front. Water , 31 March 2025
Sec. Water and Hydrocomplexity
Volume 7 - 2025 | https://doi.org/10.3389/frwa.2025.1536881
This article is part of the Research Topic Climate, Water and Land in Africa: Research Trends and Challenges View all 8 articles
 Morteza Zargar1*
 Axel Bronstert1
 Till Francke1
 Fasikaw A. Zimale2
 Kindie Bitew Worku1,2
 Rebecca Wiegels3
 Christof Lorenz3Yasir Hageltom3Windmanagda Sawadogo3
 Harald Kunstmann3
The Upper Blue Nile Basin (UBNB) is a critical water resource, facing challenges from population growth, climate variability, and transboundary water management. For any type of water resources assessment, the availability and reliability of rainfall data is of fundamental importance. Global data sets, derived from satellite information and/or climate models and/or assimilated products have been applied in recent years more frequently, but their reliability for particular regions needs to be evaluated. This study therefore evaluates the performance of four rainfall datasets-CHIRPS, IMERG, ERA5, and ERA5-Land-against ground-based rainfall data from 75 stations across the UBNB from 2001 to 2019. Metrics including RMSE, MAE, ME, RE, R, and NSE were used to assess the datasets at daily and monthly scales. CHIRPS, ERA5, and IMERG demonstrated the best agreement with observed data at the daily scale, with mean RE values of 2.68, 3.14, and 4.56% respectively, compared to 66.06% for ERA5-Land. On the monthly scale, IMERG, CHIRPS, and ERA5 outperformed ERA5-Land, achieving NSE values of 0.83, 0.80, and 0.76, respectively, while ERA5-Land averaged −0.84. The annual rainfall averages reveal that CHIRPS, ERA5, and IMERG align closely with station measurements, whereas ERA5-Land consistently overestimates rainfall, with several areas in the UBNB showing average annual values exceeding 5,000 mm. Scatter plot analysis at the dekadal scale further demonstrates that CHIRPS, IMERG, and ERA5 achieve higher correlation coefficients compared to ERA5-Land, which shows a significant overestimation of heavy rainfall events. Using the WASA-SED model to simulate the streamflow of the UBNB. CHIRPS and IMERG yielded NSE values of 0.81 and 0.80 at daily scales during validation, confirming their suitability for hydrological modeling. Conversely, ERA5-Land exhibited poor performance due to substantial rainfall overestimation. IMERG particularly excelled with daily RE values as low as −0.94%, making it highly reliable for water resource management. This study highlights the potential of CHIRPS, IMERG, and ERA5 for hydrological applications in complex, data-scarce regions like the UBNB while emphasizing the need for improved rainfall representation in ERA5-Land. These findings support informed decision-making for sustainable water management and reinforce the applicability of evaluated accordingly adjusted satellite-derived rainfall data for streamflow prediction in data-scarce tropical regions.
The Upper Blue Nile Basin (UBNB) serves as a crucial water resource for approximately 20 million people in Ethiopia and 200 million downstream residents in Sudan and Egypt (Abera et al., 2017). The basin faces multiple challenges, including population growth, agricultural expansion, and hydropower development, which place increasing pressure on its limited water resources (Rahman, 2013; Paisley and Henshaw, 2013; Oestigaard, 2012). Climate variability and change further exacerbate these challenges, with predictions indicating increased rainfall variability and more frequent droughts and floods (Coffel et al., 2019; Elkollaly et al., 2018; Zaroug et al., 2014; Roth et al., 2018). These shifts in rainfall patterns may significantly impact water availability, agricultural productivity, and ecosystem health, necessitating sustainable water management strategies to address water scarcity, ecosystem degradation, and food security issues in this transboundary basin (Abtew et al., 2019).
Rainfall in the UBNB is essential for both downstream Nile water availability and local subsistence agriculture within the basin. Besides supporting agriculture, the basin’s water resources contribute to hydropower, fishing, and tourism, providing economic benefits for the local population (Mellander et al., 2013). Effective management of these resources is critical for sustaining livelihoods within the basin and maintaining consistent downstream water flow.
Rainfall information is a prerequisite for assessing water resources in that region, for a scientifically sound estimation of its future developments, and for hydrological water budget simulations in that region. Such information is derived from various sources, including ground-based measurements (Mohammed et al., 2022; Samy et al., 2019; Mengistu et al., 2014), remote sensing products (Abebe et al., 2020; Ayehu et al., 2018; Bayissa et al., 2017; Lakew et al., 2020; Rientjes et al., 2013), and reanalysis datasets (Abebe et al., 2020; Lakew et al., 2017; Koukoula et al., 2020). Each data source has strengths and weaknesses. Ground-based data offers high precision but often limited spatial coverage and may also face data gaps, while remote sensing derived rainfall estimates provides extensive coverage but may lack accuracy, particularly in extreme weather events. Reanalysis datasets combine observational data with model outputs, offering a comprehensive view but potentially introducing biases and inadequate spatial patterns. Comparing and evaluating these diverse data sources is essential for selecting suitable datasets for regional hydrological modeling and water resource assessment, including improving the applicability of seasonal hydro-meteorological forecasts.
Recent data collection and analysis advancements promise improved rainfall estimation accuracy in the UBNB, enhancing hydrological modeling efforts. Satellite-based products are increasingly used to refine rainfall estimates, though selecting the most representative product remains crucial for reconciling discrepancies between ground-based and remote-sensing data. Addressing these gaps is vital for developing robust hydrological models that support seasonal forecasts, ultimately aiding effective water management and building resilience to drought.
Among satellite-based rainfall products, Climate Hazards Group InfraRed Precipitation with Station data (CHIRPS) has been identified as one of the most reliable for the UBNB (Ahmed et al., 2024; GADO et al., 2024; Abdelmoneim et al., 2020; Gebremicael et al., 2019; Ayehu et al., 2018; Dinku et al., 2018). Studies by Ayehu et al. (2018) and Dinku et al. (2018) have shown that CHIRPS outperform other products like ARC2 and TAMSAT in terms of correlation and bias, making it suitable for hydrological modeling and drought assessment in the region. GADO et al. (2024) evaluated four high-resolution satellite rainfall products—TRMM-3B42RT, PERSIANN-CCS, GSMaP-NRT, and CHIRPS-V2—against ground-based observations across the UBNB. Their findings revealed that CHIRPS-V2, PERSIANN-CCS, and TRMM-3B42RT demonstrated rather reliable agreement with ground measurements in estimating and detecting rainfall events. Notably, CHIRPS-V2 exhibited superior skill compared to the other products, while GSMaP-NRT showed the weakest performance.
Reanalysis datasets, such as ERA5 and ERA5-Land from the European Centre for Medium-Range Weather Forecasts (ECMWF), have also been evaluated in the UBNB recently. Ahmed et al. (2024) found that while CHIRPS performed better in high-altitude regions, ERA5 had limitations, particularly in complex terrains and during extreme rainfall events. These limitations highlight the need for selecting datasets that can accurately capture local rainfall patterns and support reliable hydrological modeling. Many studies in the upper Blue Nile region used satellite-derived rainfall products after applying bias correction, as they believe these products should not be used without such adjustments. Some of them advocate bias correction (Fenta et al., 2014).
Some research, such as Gebremichael et al. (2014), has evaluated the accuracy of satellite rainfall estimates in Lowland plains versus highland mountains of the UBNB. Their findings revealed that all the satellite products considered tend to overestimate the mean rainfall rate at the lowland plain site but underestimate it at the highland mountain site.
Opposed to comparison with observed rainfall, in some studies, hydrological models have been employed to evaluate the accuracy of satellite rainfall products. For example, Polanco et al. (2017) used the SWAT model to assess the CFSR dataset by comparing it with ground-based data (Rainfall and Discharge), while Abdelmoneim et al. (2020) evaluated TRMM 3B42V7 and CHIRPS against ground observations across the Blue Nile Basin (BNB). They also applied TRMM 3B42V7 and CHIRPS in the Hydro-BEAM model for streamflow simulations in the UBNB, finding that both TRMM 3B42V7 and CHIRPS showed strong agreement with rain gauge observations and good correlation with monthly observed discharge at most stations.
In addition to their use for hydrological modeling, remote sensing-based global rainfall data have been increasingly used for bias-corrected seasonal forecasts or future climate projections. For example, Lorenz et al. (2020) utilized ERA5-Land to generate seasonal forecast datasets for the Tekeze-Atbara and Blue Nile Basins in Ethiopia and Sudan. Rottler et al. (2024) conducted a similar approach for the semi-arid state of Ceará in the Northeast of Brazil. These datasets are based on SEAS5, the latest seasonal forecast product from the ECMWF, which was Bias-Corrected and Spatially Disaggregated (BCSD) to align with the high-resolution ERA5-Land reanalysis, thus providing detailed land component data within ECMWF’s climate reanalysis framework.
This study focuses on comparing the latest rainfall products from reanalysis-based, remote sensing-based, and ground-based sources. Beyond direct data comparison, it assesses the performance of hydrological models driven by these different rainfall datasets. Comparing the respective model results yields a hydrological evaluation of the different rainfall data sets. By identifying the strengths and weaknesses of each dataset, this research aims to support decision-makers in the UBNB by fostering effective water management practices and enhancing resilience to climate variability and change.
This study evaluates the performance of CHIRPS, IMERG, ERA5, and ERA5-Land satellite rainfall estimates at daily, dekadal (10-day), monthly, and annual scales by comparing them with data from 75 rain gauge stations across the UBNB from 2001 to 2019. Daily rain gauge observations, CHIRPS, IMERG, ERA5, and ERA5-Land data were aggregated to create dekadal, monthly, and annual datasets.
To compare gridded satellite rainfall estimates with ground observations, either grid-to-grid or point-to-grid comparison methods can be used. However, converting point-based ground observations to a gridded interpolated dataset yields poor results for an uneven spatial distribution of gauge stations (Ayehu et al., 2018). Consequently, this study employed a point-to-grid comparison approach. For each validation station, the grid cell values of the satellite rainfall products containing the station were extracted, allowing for pairwise comparisons with the corresponding rain gauge values. The average annual rainfall distribution maps of CHIRPS, IMERG, ERA5, and ERA5-Land were also calculated and compared with each other.
Additionally, WASA-SED, a physically-based distributed hydro-sedimentological model (Müller et al., 2010; Güntner and Bronstert, 2004; Güntner et al., 2004; Bronstert et al., 2014), was applied to evaluate the hydrological plausibility of the different rain data sets, i.e. how adequate the CHIRPS, IMERG, ERA5, and ERA5-Land data are to simulate the streamflow in the UBNB.
The Blue Nile River is a principal tributary of the Nile River, originating in the Ethiopian highlands. It flows northwest into Sudan, where it converges with the White Nile at Khartoum, forming the main Nile River. As a critical source of water, the Blue Nile contributes about 60% of the Nile’s total flow (Conway, 2005). The drainage area of the Blue Nile Basin (BNB) is approximately 325,000 km2 at Khartum (Ragab and Valeriano, 2014). The river is essential for downstream countries’ agriculture, hydropower, and water resources. However, the region faces significant challenges from land degradation, soil erosion, and sedimentation, exacerbated by intensive rainfall and steep terrain, which impact water quality and reservoir storage (Easton et al., 2010).
The UBNB, also referred to as the Abay Basin in Ethiopia, is a vital watershed stretching to the Sudan border and covering approximately 199,812 km2. Located in the Ethiopian Highlands, it spans between latitudes 7°45′–12°45′ N and longitudes 34°05′–39°45′ E, with elevations ranging from 500 meters near the Sudan border to over 4,260 meters in the highlands (Figure 1).
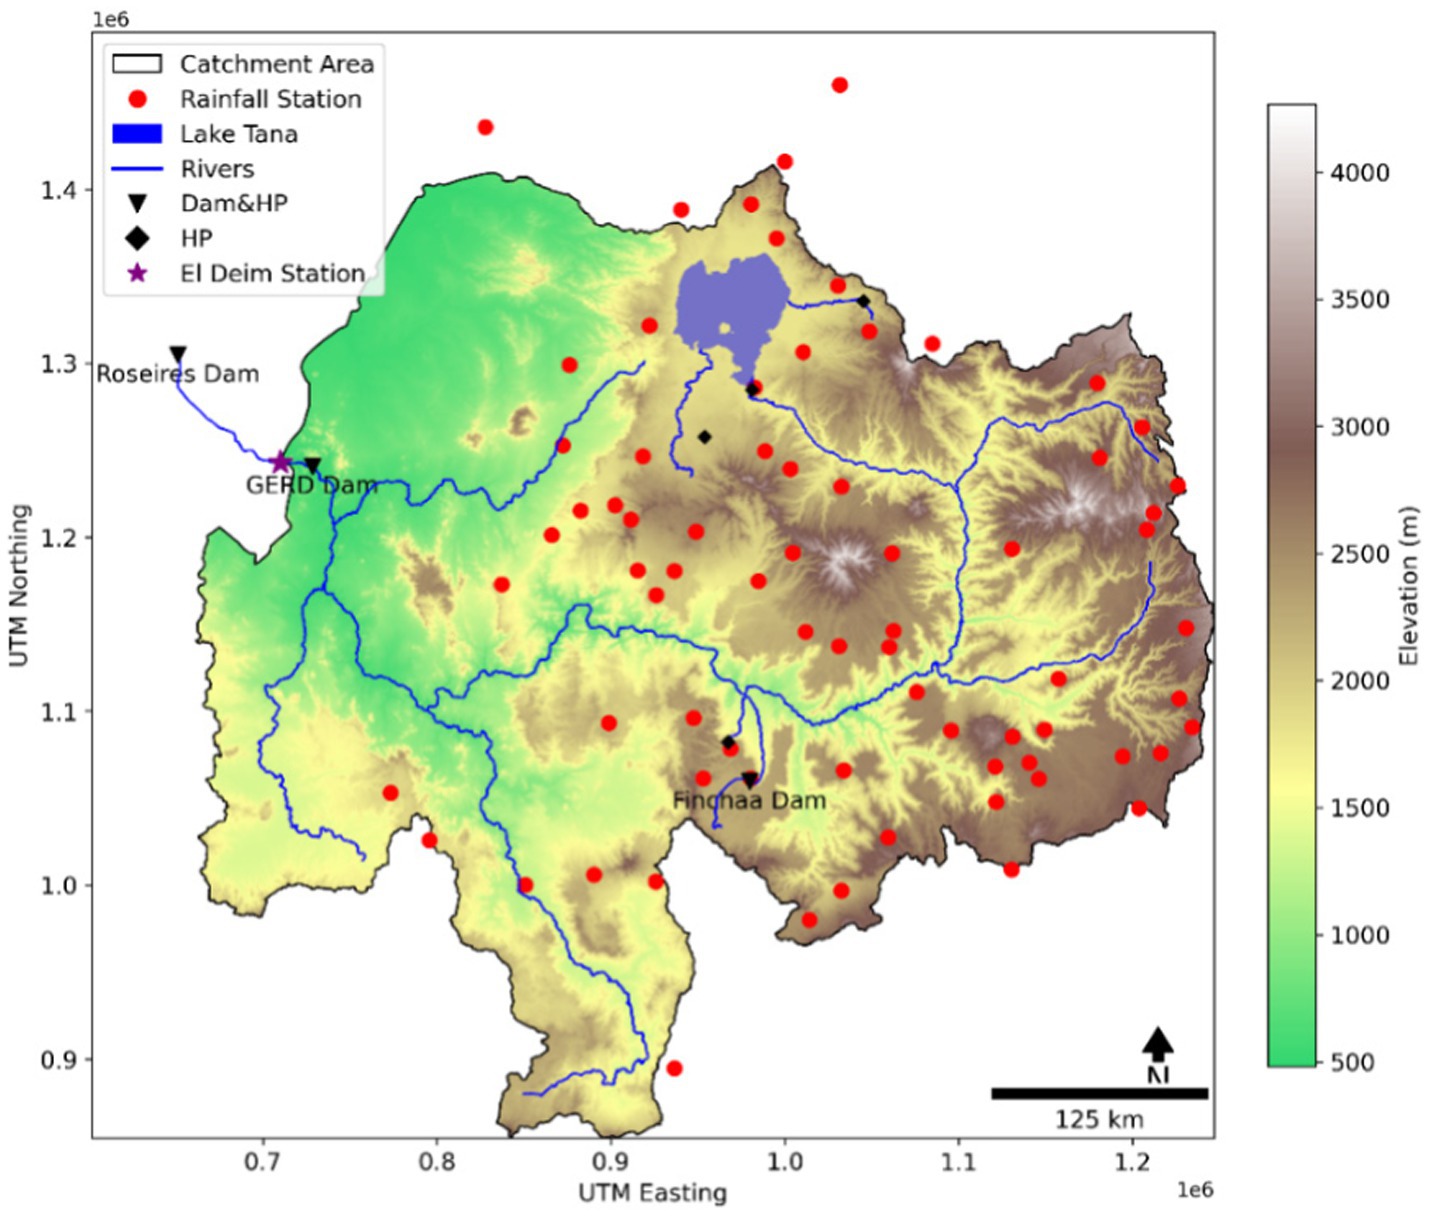
Figure 1. Elevation map of the UBNB and geographical locations of the selected rainfall stations in UBNB.
The climate in the UBNB is marked by distinct wet and dry seasons. Figure 2 illustrates the average monthly rainfall over the UBNB and the mean monthly streamflow at the El Deim station (Mulat, 2015). The average annual streamflow of the UBNB is about 50 billion cubic meters per year at the El Deim station. The main rainy season, locally called “Kiremt,” lasts from June to September, followed by a dry season from October to January and a shorter rainy season, “Belg,” from February to May. According to Kim et al. (2008), approximately 70% of the annual precipitation in the UBNB occurs during Kiremt, with rainfall varying from 800 mm in lowland areas to over 2,000 mm in some highland regions. The annual mean rainfall ranges between 1,200 and 1,800 mm (Conway, 2000), showing an increasing trend from northeast to southwest within the basin (Kim et al., 2008). Temperature varies with altitude, generally ranging from 15°C to 25°C, with cooler temperatures in the highlands (Mulat, 2015). These climatic conditions result in highly variable river flows with significant seasonal fluctuations, influencing both surface water and groundwater recharge.
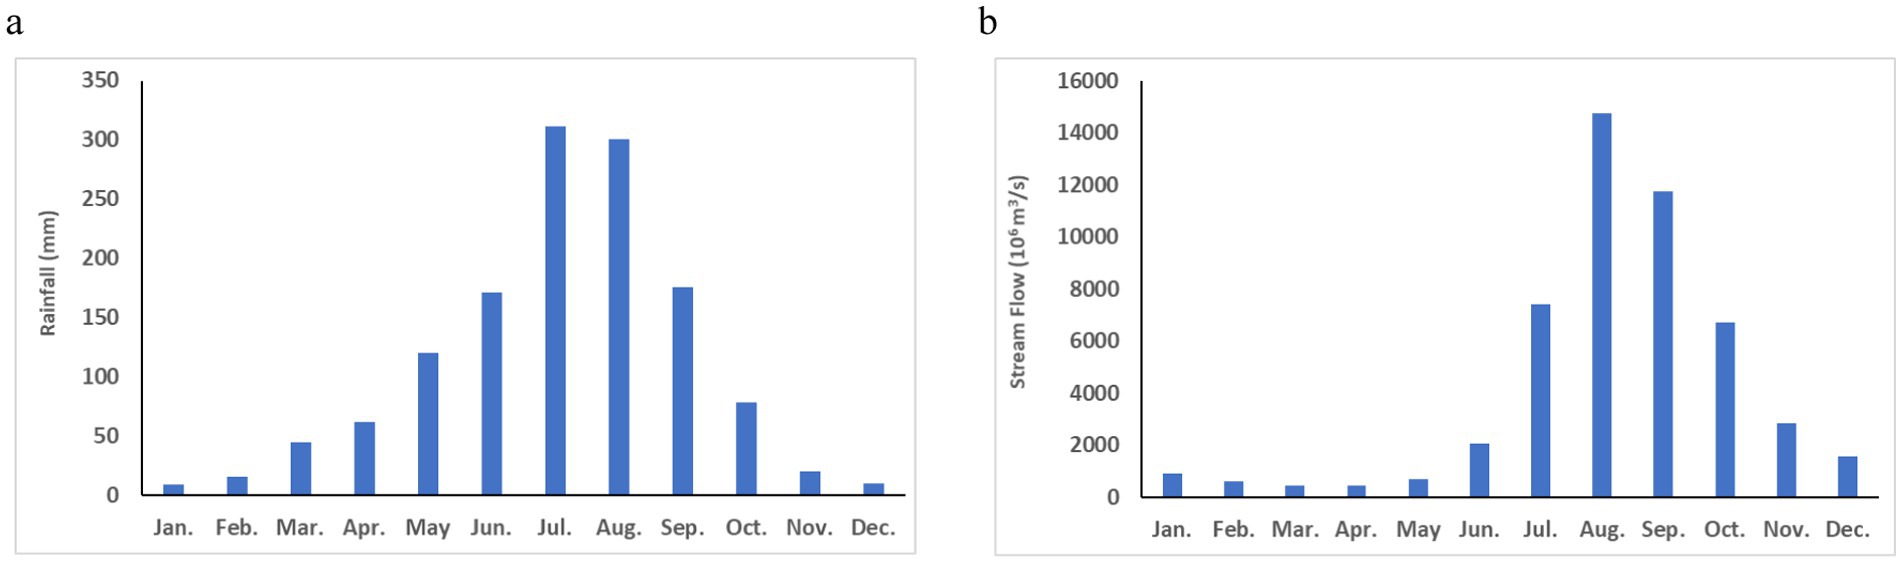
Figure 2. Average monthly rainfall and the streamflow over the UBNB. (a) Rainfall. (b) Streamflow at the El Deim station.
Several small hydropower plants, such as Ribb and Koga, operate in the Blue Nile Basin. The Finchaa Dam and Power Plant, with a reservoir capacity of 2.4 billion cubic meters, was the first reservoir dam constructed on the headwaters of the Blue Nile River (McCartney and Menker Girma, 2012). The largest dam in Africa, the Grand Ethiopian Renaissance Dam (GERD), has a maximum storage capacity of 74 billion cubic meters. Located on the Blue Nile River in Ethiopia, near the Sudanese border (Ferrari et al., 2013), GERD began operations in 2022. GERD holds strategic importance for Ethiopia’s energy production and regional influence and has been a focal point for significant diplomatic and environmental discussions among Nile-dependent countries, particularly Egypt and Sudan.
This combination of physiographic, meteorological, hydrological and hydro-political characteristics makes the UBNB a crucial area for water resource studies and sustainable management efforts.
A range of multiple and spatially distributed datasets such as topographic features, soil types, land use/land cove, climate, and hydrological data are needed for the WASA-SED model (Müller et al., 2010). In the present study, the topographic, land use, soil, climate, and hydrological data of the UBNB were collected from different sources (Table 1). Rainfall data for this study were collected from ground-based weather stations (Ethiopian Meteorological Institute (EMI)) and remote sensing satellite estimates and global dataset (Tables 1, 2).
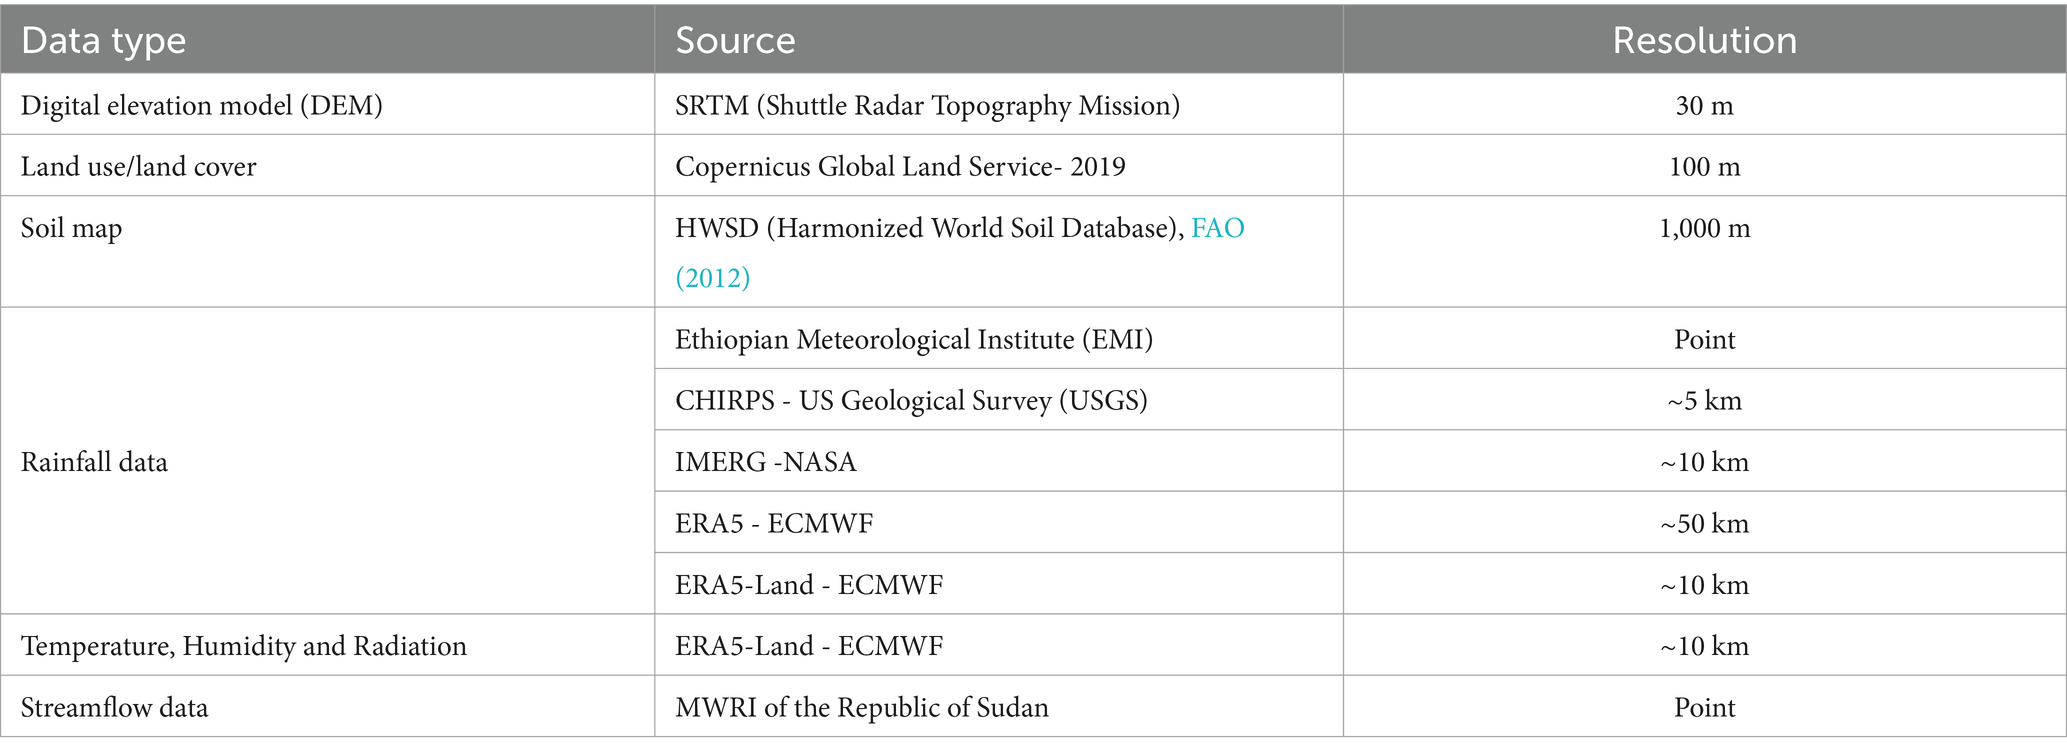
Table 1. Data type, source, and resolution.
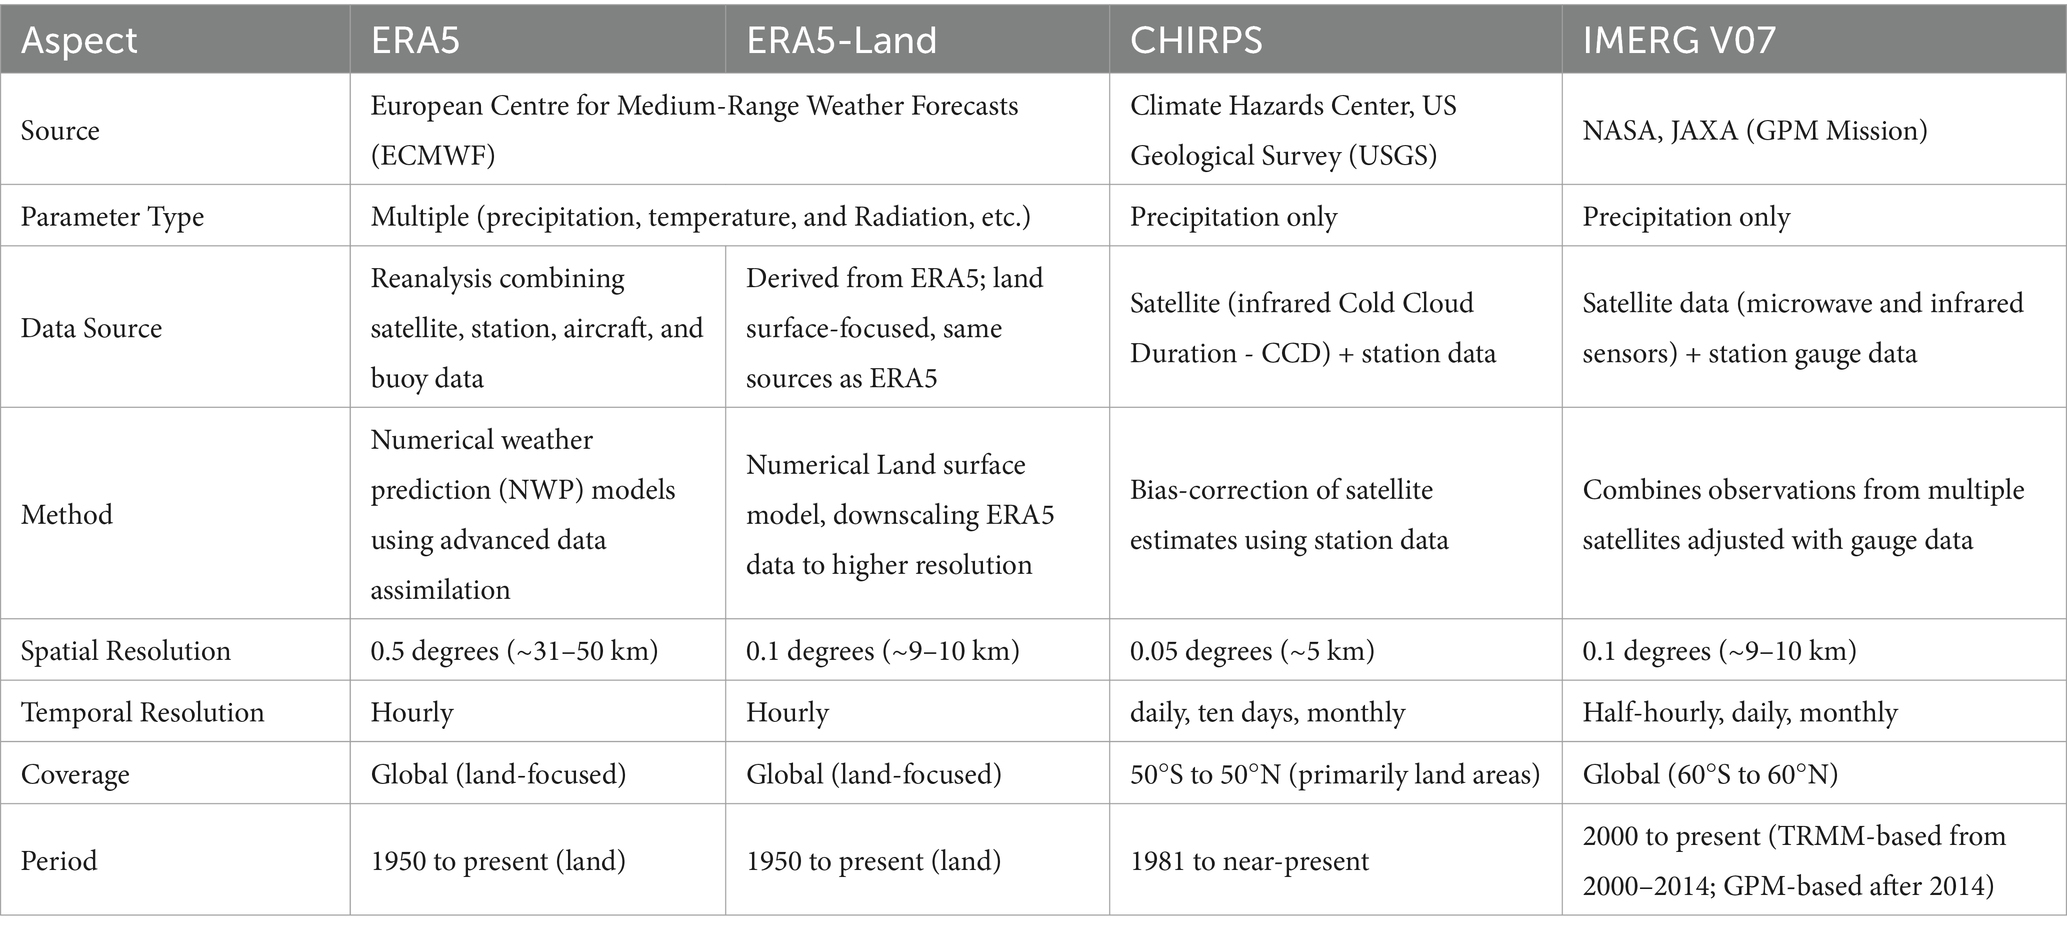
Table 2. Comparison of ERA5, ERA5-Land, CHIRPS, and IMERG datasets.
The 134 ground rain gauge datasets reviewed in this study were obtained from the Ethiopian Meteorological Institute (EMI), covering the UBNB for the evaluation period from 1996 to 2019. This period was chosen due to the availability of both local rain gauge data and satellite rainfall records. Following an assessment of data completeness, 75 stations with the most consistent and complete data throughout the evaluation period were selected as reference stations, as shown in Figure 1. The selection of the 75 stations was based on a rigorous quality control process. Stations with <80% data completeness from 1996 to 2019 were excluded. To ensure continuity in the dataset, missing values were filled using data from the closest station with a correlation coefficient above 0.85. Furthermore, stations with unrealistic trends or inconsistencies in long-term records were removed to ensure data reliability.
The CHIRPS (Climate Hazards Group InfraRed Precipitation with Station data) dataset is a widely used product providing rainfall estimates at high spatial resolution (0.05 degrees or ~5 km). Developed by the US Geological Survey (USGS) and the Climate Hazards Group at the University of California (Funk et al., 2014; Knapp et al., 2011). The preliminary product CHIRP combines CHPclim (Funk et al., 2015), the monthly precipitation climatology based on station normal, satellite means and elevation, and Cold Cloud Duration (CCD) data based on infrared satellite imagery. The final product CHIRPS blends station data into CHIRPS by applying a modified inverse distance weighting. A detailed description of the procedure is given in Funk et al. (2015). CHIRPS covers land areas between 50°S and 50°N from 1981 to the present, providing data at different temporal (daily, dekadal, and monthly) resolution with a 3-week latency (Funk et al., 2015). In the present study, the dataset used was downloaded from: https://data.chc.ucsb.edu/products/CHIRPS-2.0/global_daily/netcdf/p05/.
Integrated Multi-satellitE Retrievals for GPM (IMERG) V07 Final Run, a product of NASA’s Global Precipitation Measurement (GPM) mission, integrates precipitation estimates from multiple satellite sensors, including both microwave and infrared data, with rain gauge adjustments to improve accuracy. IMERG provides near-real-time precipitation data at a 0.1-degree (~9–10 km) spatial resolution with a high temporal frequency (half-hourly), making it suitable for real-time flood monitoring and early warning systems. Covering global latitudes between 60°S and 60°N, IMERG data is available from 2000 onwards, with consistent calibration across time enabled by the GPM constellation of satellites. The dataset used was downloaded from: https://disc.gsfc.nasa.gov/datasets/GPM_3IMERGDF_07/summary?keywords=IMERG.
ERA5, a global atmospheric reanalysis dataset produced by the European Centre for Medium-Range Weather Forecasts (ECMWF), provides comprehensive historical weather data at a spatial resolution of approximately 31–50 km. This dataset combines observations from satellites, weather stations, aircraft, and buoys with model outputs using advanced data assimilation techniques. ERA5 offers hourly precipitation data along with a wide range of meteorological parameters, such as temperature, wind, and humidity, making it suitable for diverse climate and hydrological studies. Covering the period from 1950 to the present, ERA5 ensures consistent long-term records for analyzing weather trends, extreme events, and climate variability. The dataset used was downloaded from: https://cds.climate.copernicus.eu/datasets/reanalysis-era5-single-levels?tab=overview.
ERA5-land, an extension of the ERA5 reanalysis dataset, offers high-resolution (~9–10 km) hourly precipitation data optimized for land areas. Produced by the European Centre for Medium-Range Weather Forecasts (ECMWF), ERA5-Land utilizes a land surface model to downscale ERA5’s broader spatial resolution. With global coverage from 1950 to the present, ERA5-Land provides a consistent reanalysis of historical and current weather data, offering an extensive temporal range for trend analysis and climate modeling. The dataset used was downloaded from: https://cds.climate.copernicus.eu/datasets/reanalysis-era5-land?tab=overview.
As a benchmark of hydrologic validation, daily measured streamflow data in the period 2000–2012 at El Deim river gaging station (on the border of Sudan and Ethiopia) were obtained from reports published by the Ministry of water resources and irrigation (MWRI) of the Republic of Sudan (source: MWRI Database).
The WASA-SED model (Water Availability in Semi-arid Areas with Sediment Dynamics) is designed for meso-scale hydrological modeling in multiple spatial scales, covering domains of several hundred, thousands to several hundred thousands of square kilometers. It consists of process-oriented hydrological components adapted to semi-arid conditions (WASA, as detailed by Bronstert et al., 2014) and coupled with sediment dynamics components for simulating erosion, sediment transport, and deposition (Müller et al., 2010). Water management options have been added recently (Voit et al., 2023). This model is particularly suited for multi-scale, continuous, spatially distributed simulations, with a flexible daily or hourly time step, incorporating channel-flow routines, reservoir retention, and management functions.
The model’s spatial multi-scale spatial discretization approach structures the catchment into hierarchical levels that reflect essential landscape features, including terrain types, soils, vegetation, and reservoirs, all integrated with the channel system (Güntner and Bronstert, 2004). This landscape-adaptive scheme enables applications at various scales from small watersheds to catchments of over 10,000 km2. WASA-SED partitions the study area into five hierarchical levels: (I) Sub-basins; (II) landscape units (LU) with hydrologically similar areas; (III) terrain components (TC) as simplified planar elements of LUs; (IV) soil-vegetation components (SVC) for specific soil-vegetation associations; and (V) soil profiles with multiple layers. This scale-dependent discretization improves model efficiency, allowing high-resolution representation of relevant features while enabling large-scale simulations. This hierarchical concept of the spatial model structuring (only levels I, II, III) is briefly schematized in Figure 3.
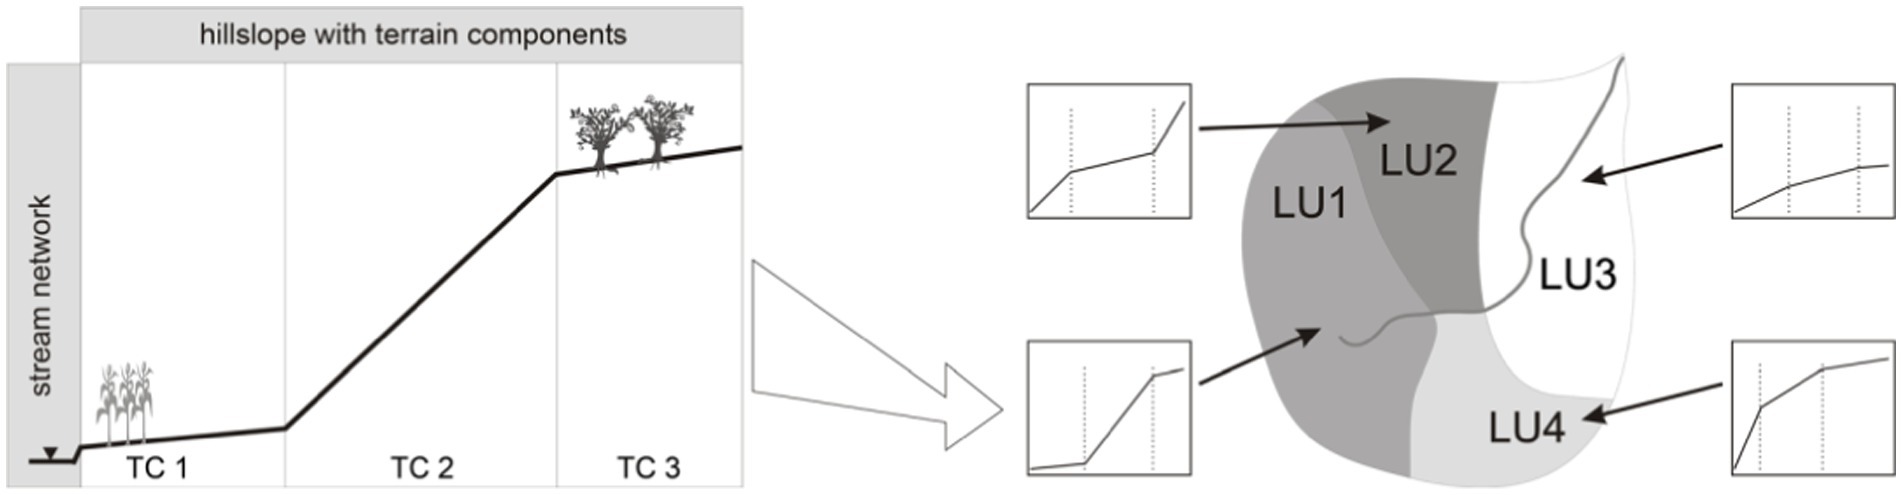
Figure 3. Spatial discretization scheme of the WASA-SED model: an example with three terrain components (TC) describing a catena and four landscape units (LU) describing a sub-catchment (from Müller et al. (2010)).
The model simulates both vertical (e.g., evapotranspiration, infiltration) and lateral (e.g., overland flow) hydrological processes. SVCs are derived from GIS-based soil and vegetation data, while landscape and terrain structuring can be performed semi-automatically with the Landscape Unit Mapping Program (lumpR) tool (Francke et al., 2008; Pilz et al., 2017). lumpR integrates DEM data with land use and soil information to delineate landscape units and terrain components, maintaining information on hillslope properties relative to the river network. WASA-SED includes water routing through reservoir networks, providing detailed water balance calculations.
The hydrological component of the WASA-SED model at the hillslope scale has been extensively detailed by Güntner (2002) and Güntner and Bronstert (2004). Operating at daily or hourly time steps, the model simulates key processes for each soil-vegetation component within terrain components. These processes include interception losses, evaporation, and transpiration, calculated using the modified Penman-Monteith approach (Shuttleworth and Wallace, 1985). It also incorporates infiltration using the Green-Ampt method (Green and Ampt, 1911), runoff generation from infiltration-excess and saturation-excess mechanisms, and the lateral redistribution of runoff between soil-vegetation and terrain components. Additionally, the model tracks soil moisture and water fluxes through a multi-layer storage structure, subsurface flow, and groundwater recharge using a linear storage representation (Güntner, 2002). Runoff generated at the hillslope level is routed through associated channel stretches using the kinematic wave method, with interactions modeled for simplified and detailed reservoir systems.
The UBNB modeling framework was developed to assess the performance of rainfall station data, CHIRPS, IMERG, ERA5, and ERA5-Land rainfall datasets for streamflow simulation using the WASA-SED model. The initial step in the model development involved watershed delineation, where sub-basins and reaches of the watershed were derived from a digital elevation model (DEM) with the LUMPR tool (Pilz et al., 2017). This delineation was based on the spatial distribution of hydrometric stations, dams, and tributaries in the basin, resulting in the identification of 103 sub-basins, with a minimum threshold area of 50,000 ha.
After delineation, landscape units (LUs), terrain components (TCs), soil-vegetation components (SVCs), and soil profiles with multiple layers were defined using lumpR, guided by physiographical data such as land use, soil type, and slope (Güntner, 2002). Consequently, 10,359 combinations of sub-basins, landscape units, and terrain components were established.
The model simulation period spanned from 1996 to 2011, with the first 6 years (1996–2001) used as a warm-up period to minimize the effects of initial conditions; hence, this period was excluded from the analysis. A 6-year warm-up period was chosen based on prior studies (e.g., Francke, 2009; Güntner, 2002) to ensure stable hydrological initial conditions, particularly for soil moisture and groundwater storage.
Separate WASA-SED models were prepared for each rainfall dataset—station data, CHIRPS, IMERG, ERA5, and ERA5-Land—while keeping other inputs (topography, vegetation, soil, LUs, TCs, SVCs, and meteorological data) consistent across simulations. Daily temperature, humidity, solar radiation, and wind data from the ERA5-Land dataset were used in all simulations as input parameters.
Calibration focused on key hydrological parameters, as identified in prior studies (Francke, 2009; Güntner, 2002), using a heuristic, gradient-free optimization algorithm known as dynamically dimensioned search (Tolson and Shoemaker, 2007), implemented in the PPSO package (Francke, 2015). The objective function for optimization was based on root mean square error (RMSE), utilizing 11 years of discharge data at the El Deim station. The period from 2001 to 2006 was used for calibration, while 2007 to 2011 was reserved for validation.
In this study, six widely used metrics were applied to quantitatively evaluate the agreement of CHIRPS, IMERG, ERA5, and ERA5-Land rainfall estimates with in-situ rainfall observations. These metrics were also utilized for assessing the performance of simulated discharge against observed streamflow data. These metrics are the root mean square error (RMSE), mean absolute error (MAE), mean error (ME), percentage relative error (RE), Pearson correlation coefficient (R), and Nash-Sutcliffe efficiency (NSE). Their formulas are provided as follows:
where and represent the values of the CHIRPS, IMERG, ERA5, and ERA5-Land estimates and rain gauge observation data, respectively; and are their mean values; and n is the total number of time steps. The rainfall products are fully consistent with the rain gauge data if RMSE, MAE, ME, and RE are equal to 0, and R and NSE are equal to 1. Higher values of R and NSE, along with lower values of RMSE, MAE, ME, and RE, indicate greater accuracy of the satellite rainfall products. NSE values range from to 1. A negative NSE, specifically, implies that the residual variance (difference between observed and predicted values) is greater than the variance of the observed data around its mean.
The descriptive statistics, as summarized in boxplots, were used to evaluate the daily and monthly rainfall performance of CHIRPS, IMERG, ERA5, and ERA5-Land against 75 in situ rainfall stations (see Table 3 and Figures 4, 5). The boxplots illustrate that CHIRPS, IMERG, and ERA5 products show relatively good agreement with the measured rain gauge data, as indicated in Figures 4, 5. However, the rainfall values of ERA5-Land are consistently higher than the measured rainfall values in most of the stations. The boxplots reveal that CHIRPS, IMERG, and ERA5 align closely with the median and interquartile ranges of observed values, indicating better accuracy. In contrast, ERA5-Land exhibits notably higher rainfall values than observed data at most stations, as evidenced by its elevated medians and broader interquartile ranges. This discrepancy suggests a tendency for ERA5-Land to overestimate rainfall, which may limit its applicability for precise rainfall analysis on a daily timescale within this region. The variability in ERA5-Land’s values could present challenges in hydrological modeling where daily accuracy is essential.
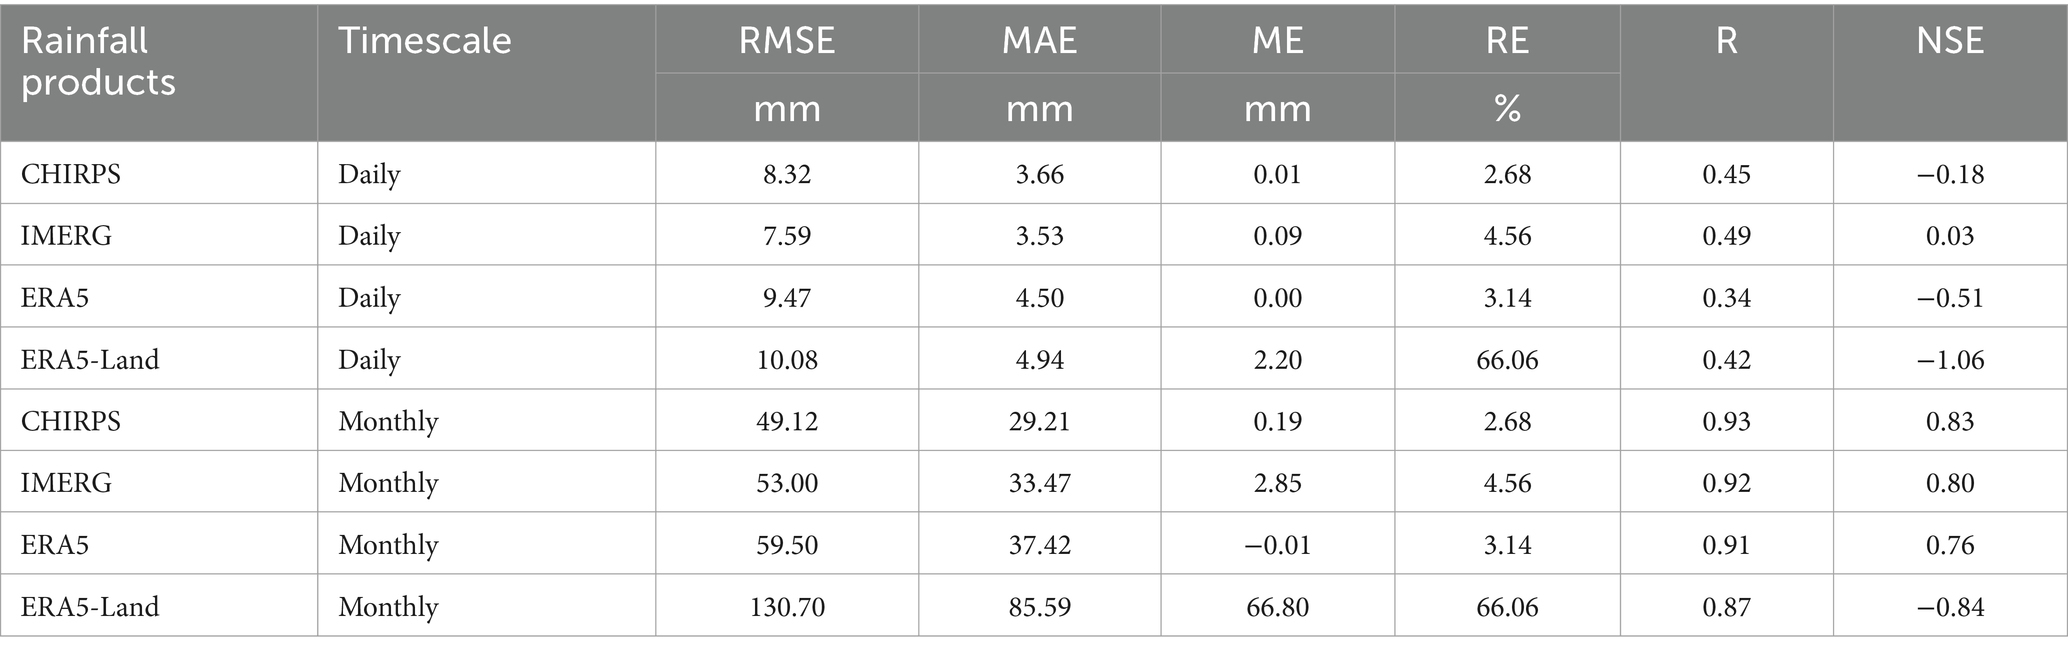
Table 3. Mean values of statistical analysis of satellite rainfall estimates against rain gauge measurements in the UBNB.
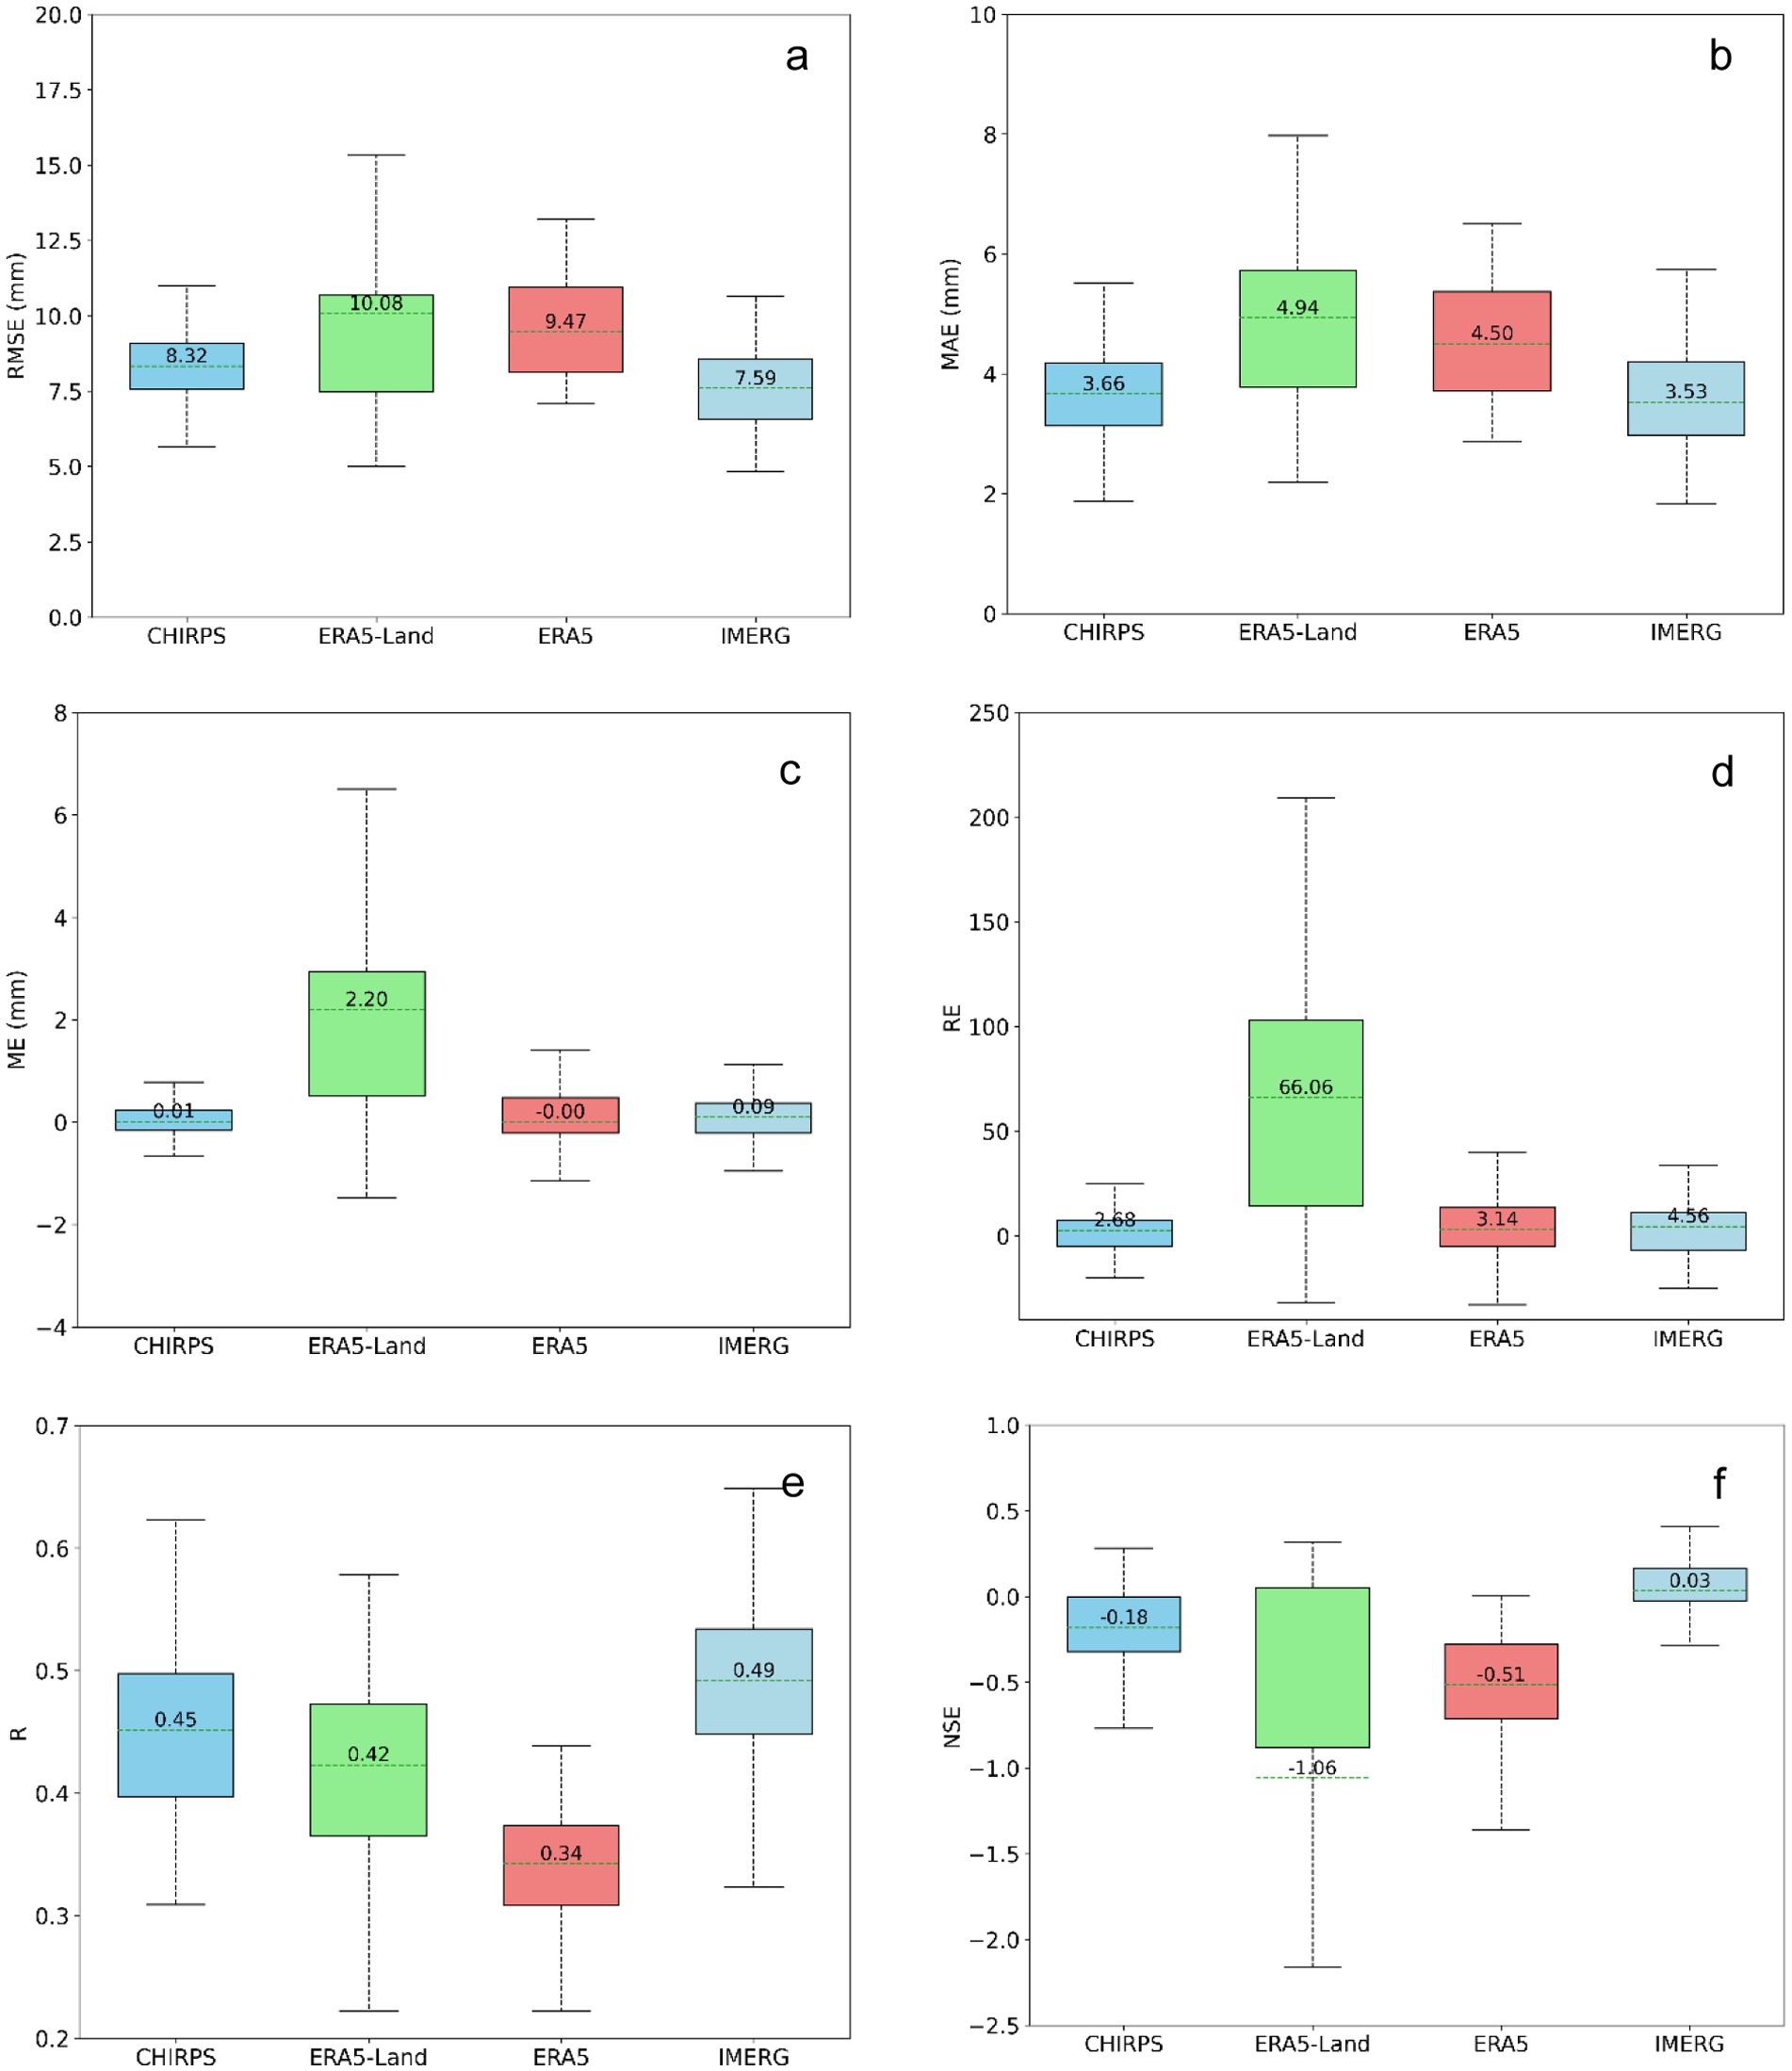
Figure 4. Boxplots of the performance metrics for CHIRPS, IMERG, ERA5, and ERA5-Land daily rainfall products against observation data from 72 stations during the period 2001–2019. (a) RMSE values. (b) MAE values. (c) ME values. (d) RE values. (e) R values. (f) NSE values.
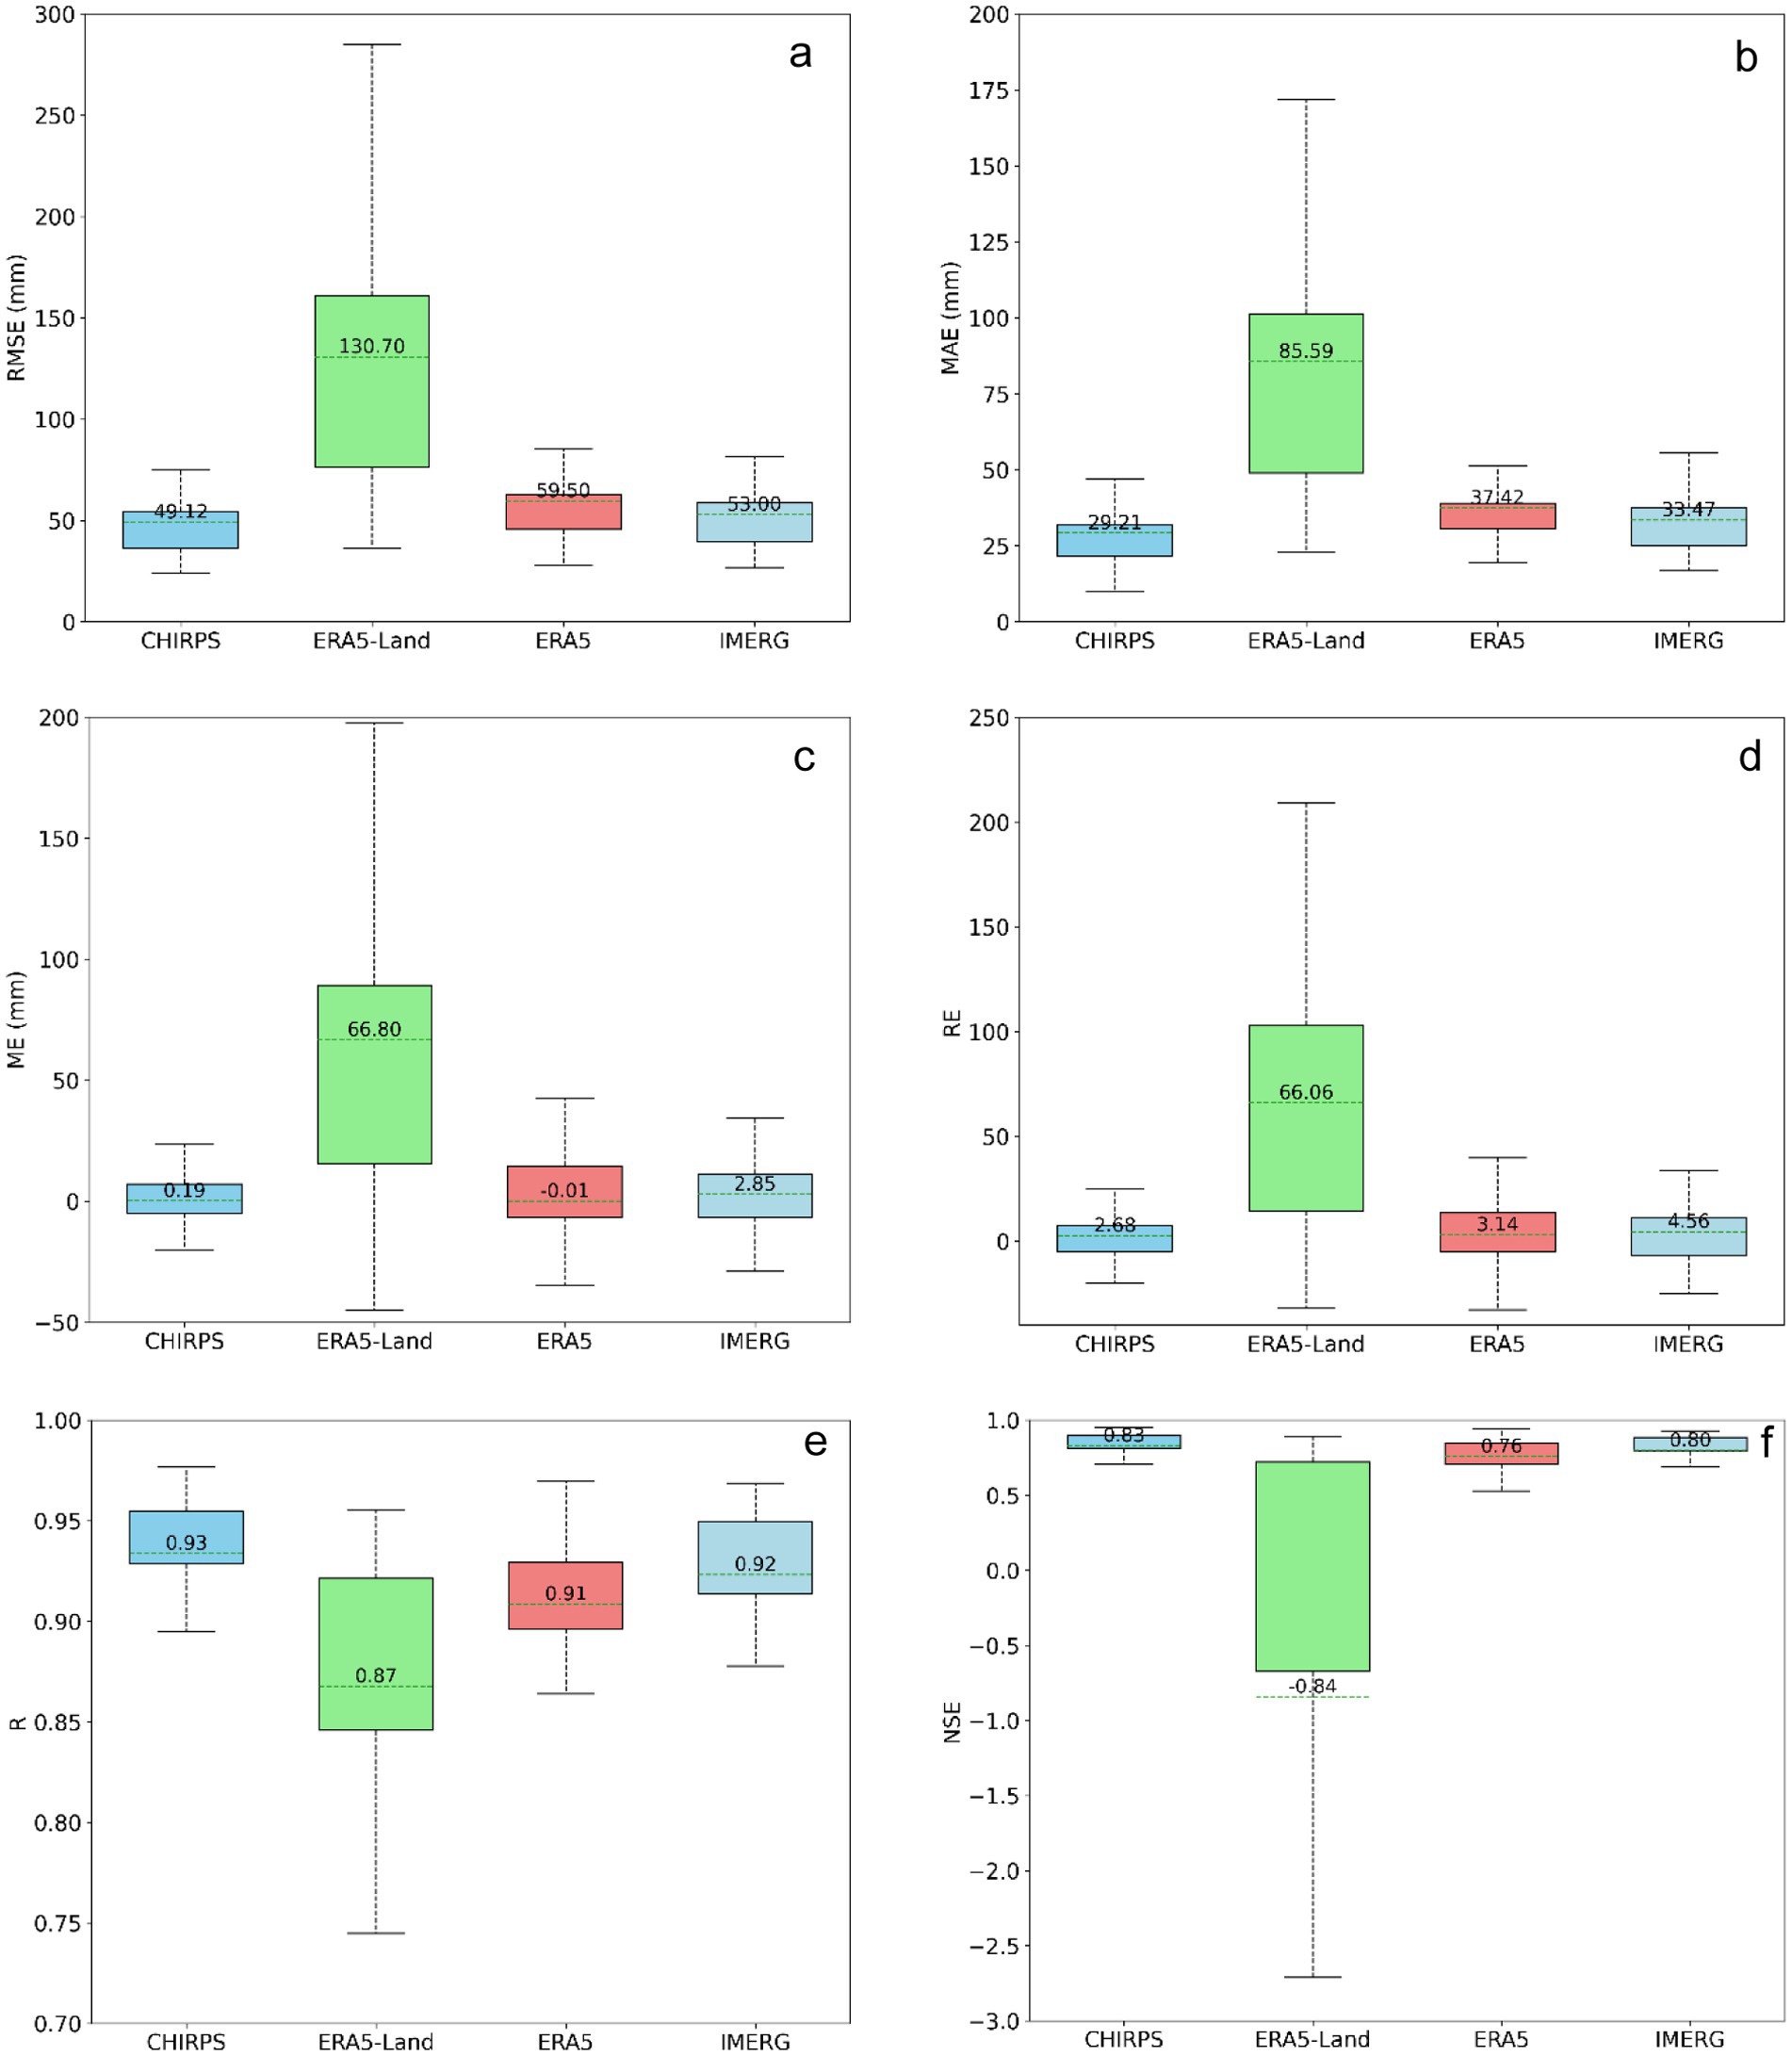
Figure 5. Boxplots of the continuous statistical indices for CHIRPS, IMERG, ERA5, and ERA5-Land monthly rainfall products against monthly rain gauge measurements during the period 2001–2019. (a) RMSE values. (b) MAE values. (c) ME values. (d) RE values. (e) R values. (f) NSE values.
On a daily scale, CHIRPS exhibits correlation coefficient (R) values ranging from 0.65 to 0.31, with a mean of 0.45, while IMERG’s R values range from 0.66 to 0.32, with a mean of 0.49. In comparison, ERA5 shows R values ranging from 0.47 to 0.22, with a mean of 0.34, and ERA5-Land demonstrates R values ranging from 0.58 to 0.22, with a mean of 0.42. Similarly, for the Nash-Sutcliffe Efficiency (NSE), CHIRPS shows values between −0.8 and 0.5, with a mean of −0.18, while IMERG ranges from −0.3 to 0.4, with a mean of 0.03. In comparison, ERA5 ranges from −1.4 to 0.0, with a mean of −0.51, and ERA5-Land exhibits NSE values from −2.3 to 0.3, with a mean −1.06, indicating significantly poorer performance. Overall, all products reveal relatively poor correlations and NSE with daily observed rain gauge data, as reflected in R and NSE values below 0.5 at most stations. These findings align with prior studies in the Eastern Nile Basin, such as those by Abdelmoneim et al. (2020) and Gebremicael et al. (2019), which highlighted similar limitations for CHIRPS in daily rainfall estimations.
Regarding mean error (ME), CHIRPS varies from −0.76 to 0.82 mm with a mean of 0.01 mm, IMERG ranges from −1.09 to 1.25 mm with a mean of 0.09 mm, ERA5 ranges from −1.26 to 1.4 mm with a mean of 0.00 mm, and ERA5-Land spans a much wider range, from −1.48 to 6.57 mm, with a mean of 2.20 mm. These values indicate that the mean error (ME) for ERA5 and CHIRPS is close to zero, reflecting good agreement with station data based on this metric. Conversely, ERA5-Land exhibits a pronounced tendency to overestimate rainfall, often with significantly larger deviations from observed data.
For mean absolute error (MAE), CHIRPS values range from 1.6 to 5.8 mm, with a mean of 3.66 mm (compared to 3.37 mm reported by Abdelmoneim et al., 2020), while IMERG ranges from 1.8 to 5.7 mm, with a mean of 3.53 mm. ERA5 shows MAE values ranging from 2.9 to 6.5 mm, with a mean of 4.5 mm, and ERA5-Land spans a wider range, from 2.2 to 8.7 mm, with a mean of 4.94 mm.
In terms of root mean square error (RMSE), CHIRPS values range from 5.3 to 11.4 mm, with a mean of 8.32 mm (compared to 7.43 mm reported by Abdelmoneim et al., 2020). IMERG ranges from 4.8 to 10.6 mm, with a mean of 7.59 mm, ERA5 ranges from 7.1 to 13.2 mm, with a mean of 9.47 mm, and ERA5-Land shows a broader range, from 5.0 to 15.5 mm, with a mean of 10.98 mm. This wider range in ERA5-Land highlights greater variability and lower accuracy in capturing daily rainfall patterns compared to CHIRPS and IMERG.
On a monthly scale, all statistical parameters, especially R and NSE, show improvement for all four datasets (see Figure 5). For example, CHIRPS displays correlation coefficient (R) values ranging from 0.89 to 0.98, with a mean of 0.93, while IMERG’s R values range from 0.73 to 0.96, with a mean of 0.92 and ERA5’s R values range from 0.85 to 0.97, with a mean of 0.91. In contrast, ERA5-Land shows R values between 0.73 and 0.92, with a mean of 0.87, again suggesting that CHIRPS, ERA5 and IMERG maintain a stronger and more consistent relationship with observed monthly rainfall than ERA5-Land.
Similarly, for Nash-Sutcliffe Efficiency (NSE), CHIRPS shows values between 0.69 and 0.95 with a mean of 0.83, IMERG varies from 0.66 to 0.93 with a mean of 0.80, and ERA5 varies from 0.5 to 0.94 with a mean of 0.76, while ERA5-Land’s NSE values range from −2.77 to 0.89, with a mean of −0.84, indicating poor monthly performance. The negative NSE values for ERA5-Land on a monthly scale imply that its precipitation estimates are significantly higher than measured values at most stations.
In terms of mean error (ME), CHIRPS values range from −25.1 to 23 mm with a mean of 0.19 mm, IMERG ranges from −33.3 to 38 mm with a mean of 2.85 mm, ERA5 ranges from −38.2 to 42.7 mm with a mean of −0.01 mm, while ERA5-Land spans from −45 to 200 mm, averaging 66.80 mm, suggesting that ERA5-Land often overestimates monthly rainfall by a larger margin.
For mean absolute error (MAE), CHIRPS ranges from 9.9 to 47 mm with a mean of 29.21 mm, IMERG ranges from 17 to 56.2 mm with a mean of 33.47 mm, ERA5 ranges from 18.1 to 51.5 mm with a mean of 37.42 mm, and ERA5-Land spans from 22.3 to 179.9 mm with a mean of 85.59 mm. This indicates that ERA5-Land has higher monthly errors compared to CHIRPS and IMERG.
Finally, for root mean square error (RMSE), CHIRPS ranges from 23.9 to 81.6 mm with a mean of 49.12 mm, IMERG ranges from 26.7 to 87.2 mm with a mean of 53.00 mm, ERA5 ranges from 27.8 to 87.9 mm with a mean of 59.5 mm, and ERA5-Land ranges from 36.2 to 287.9 mm with a mean of 130.70 mm. This again reflects the higher errors in ERA5-Land’s monthly estimates.
For relative error (RE) on both daily and monthly scales, CHIRPS values range from −23.4 to 25.9%, with a mean of 2.68%, while IMERG ranges from −34.1 to 38.6%, with a mean of 4.56%. ERA5 shows RE values ranging from −33.2 to 41.5%, with a mean of 3.14%, whereas ERA5-Land exhibits a significantly wider range, from −32 to 235.1%, with a mean of 66.06%. This pronounced positive bias in ERA5-Land highlights a considerable overestimation of rainfall compared to the other datasets. The presence of negative RE values across all datasets indicates a slight underestimation of rainfall in specific stations. Similar findings for CHIRPS have been reported by Abdelmoneim et al. (2020), with a mean RE of −0.91% in the Eastern Nile Basin.
In conclusion, while CHIRPS, ERA5, and IMERG provide closer approximations to observed daily and monthly rainfall across various metrics, ERA5-Land displays substantial positive bias and higher variability, particularly in terms of relative error and mean error. At the daily scale, CHIRPS, ERA5, and IMERG demonstrated the best agreement with observed data, achieving mean RE values of 2.68, 3.14, and 4.56%, respectively, compared to 66.06% for ERA5-Land. On the monthly scale, IMERG, CHIRPS, and ERA5 outperformed ERA5-Land, with NSE values of 0.83, 0.80, and 0.76, respectively, while ERA5-Land averaged −0.84. These findings suggest that CHIRPS, ERA5, and IMERG are relatively more suitable datasets for daily and monthly rainfall analysis due to their consistency with in situ data.
In Figure 6, the annual rainfall averages over the period 2001–2019 are compared for CHIRPS, IMERG, ERA5, ERA5-Land, and observed station data. This figure shows that CHIRPS, ERA5 and IMERG align relatively well with station measurements, whereas ERA5-Land consistently reports higher annual values, confirming the observed overestimation. Additionally, the bar chart (Figure 7) presents the average annual rainfall variability across individual stations, highlighting that ERA5-Land’s higher precipitation estimates are particularly prominent at several locations.
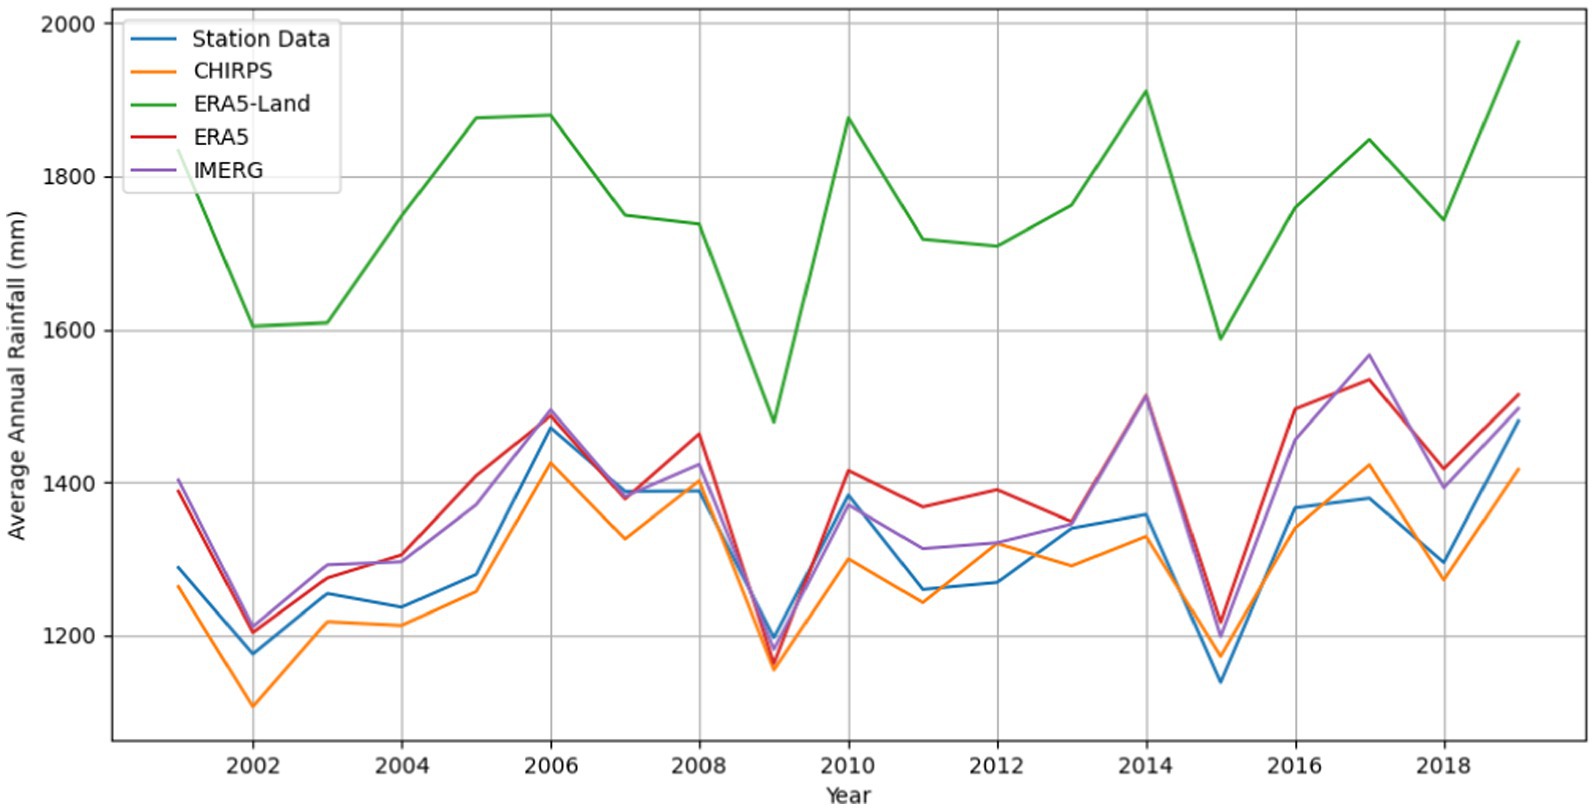
Figure 6. Mean spatial annual rainfall distribution in the UBNB over the period (2001–2019).
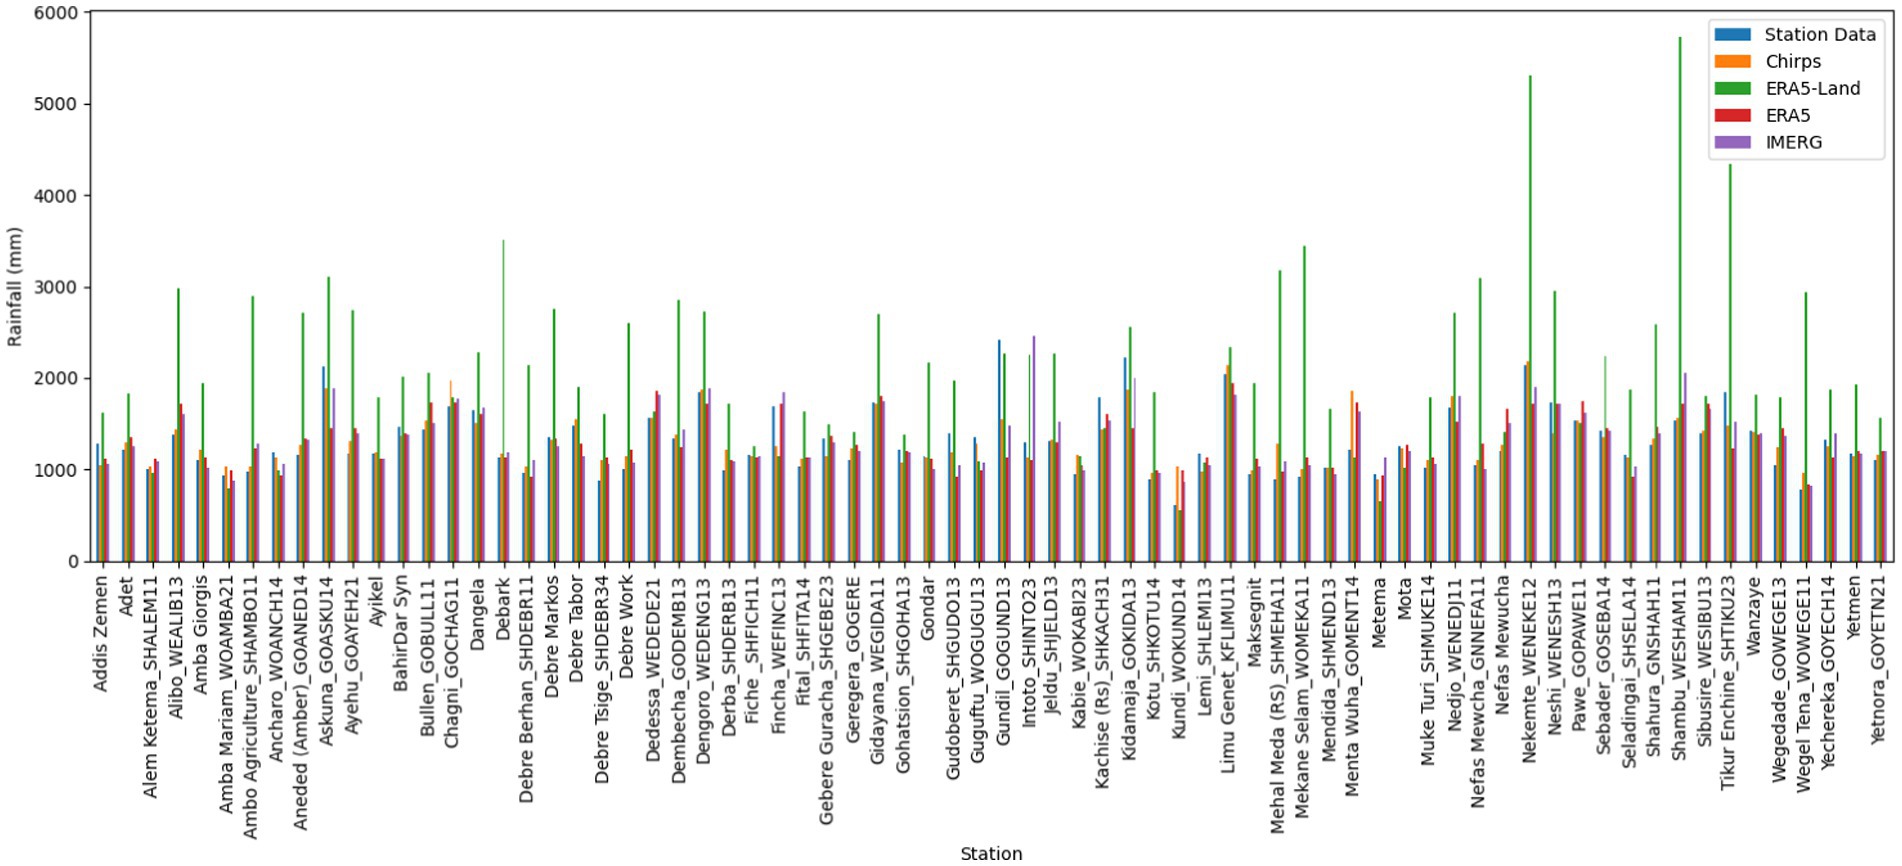
Figure 7. Average annual rainfall in the UBNB (2001–2019).
The annual rainfall distribution over the UBNB provides a comparative analysis of CHIRPS, IMERG, ERA5, and ERA5-Land datasets against station data. The spatial maps (Figure 8) illustrate the average annual rainfall patterns from CHIRPS, ERA5, ERA5-Land, and IMERG, revealing distinct regional rainfall gradients. CHIRPS and IMERG exhibit similar spatial rainfall patterns, with the highest precipitation concentrations occurring in the southwestern and central areas of the basin, closely aligning with observed station data. As shown in Figure 8d, several areas in the UBNB exhibit average annual rainfall exceeding 5,000 mm on the ERA5-Land map, which is inconsistent with ground observations and other satellite products. This excessive estimation suggests that the ERA5-Land rainfall distribution map is inaccurate and may not be suitable for precise hydrological modeling in this region.
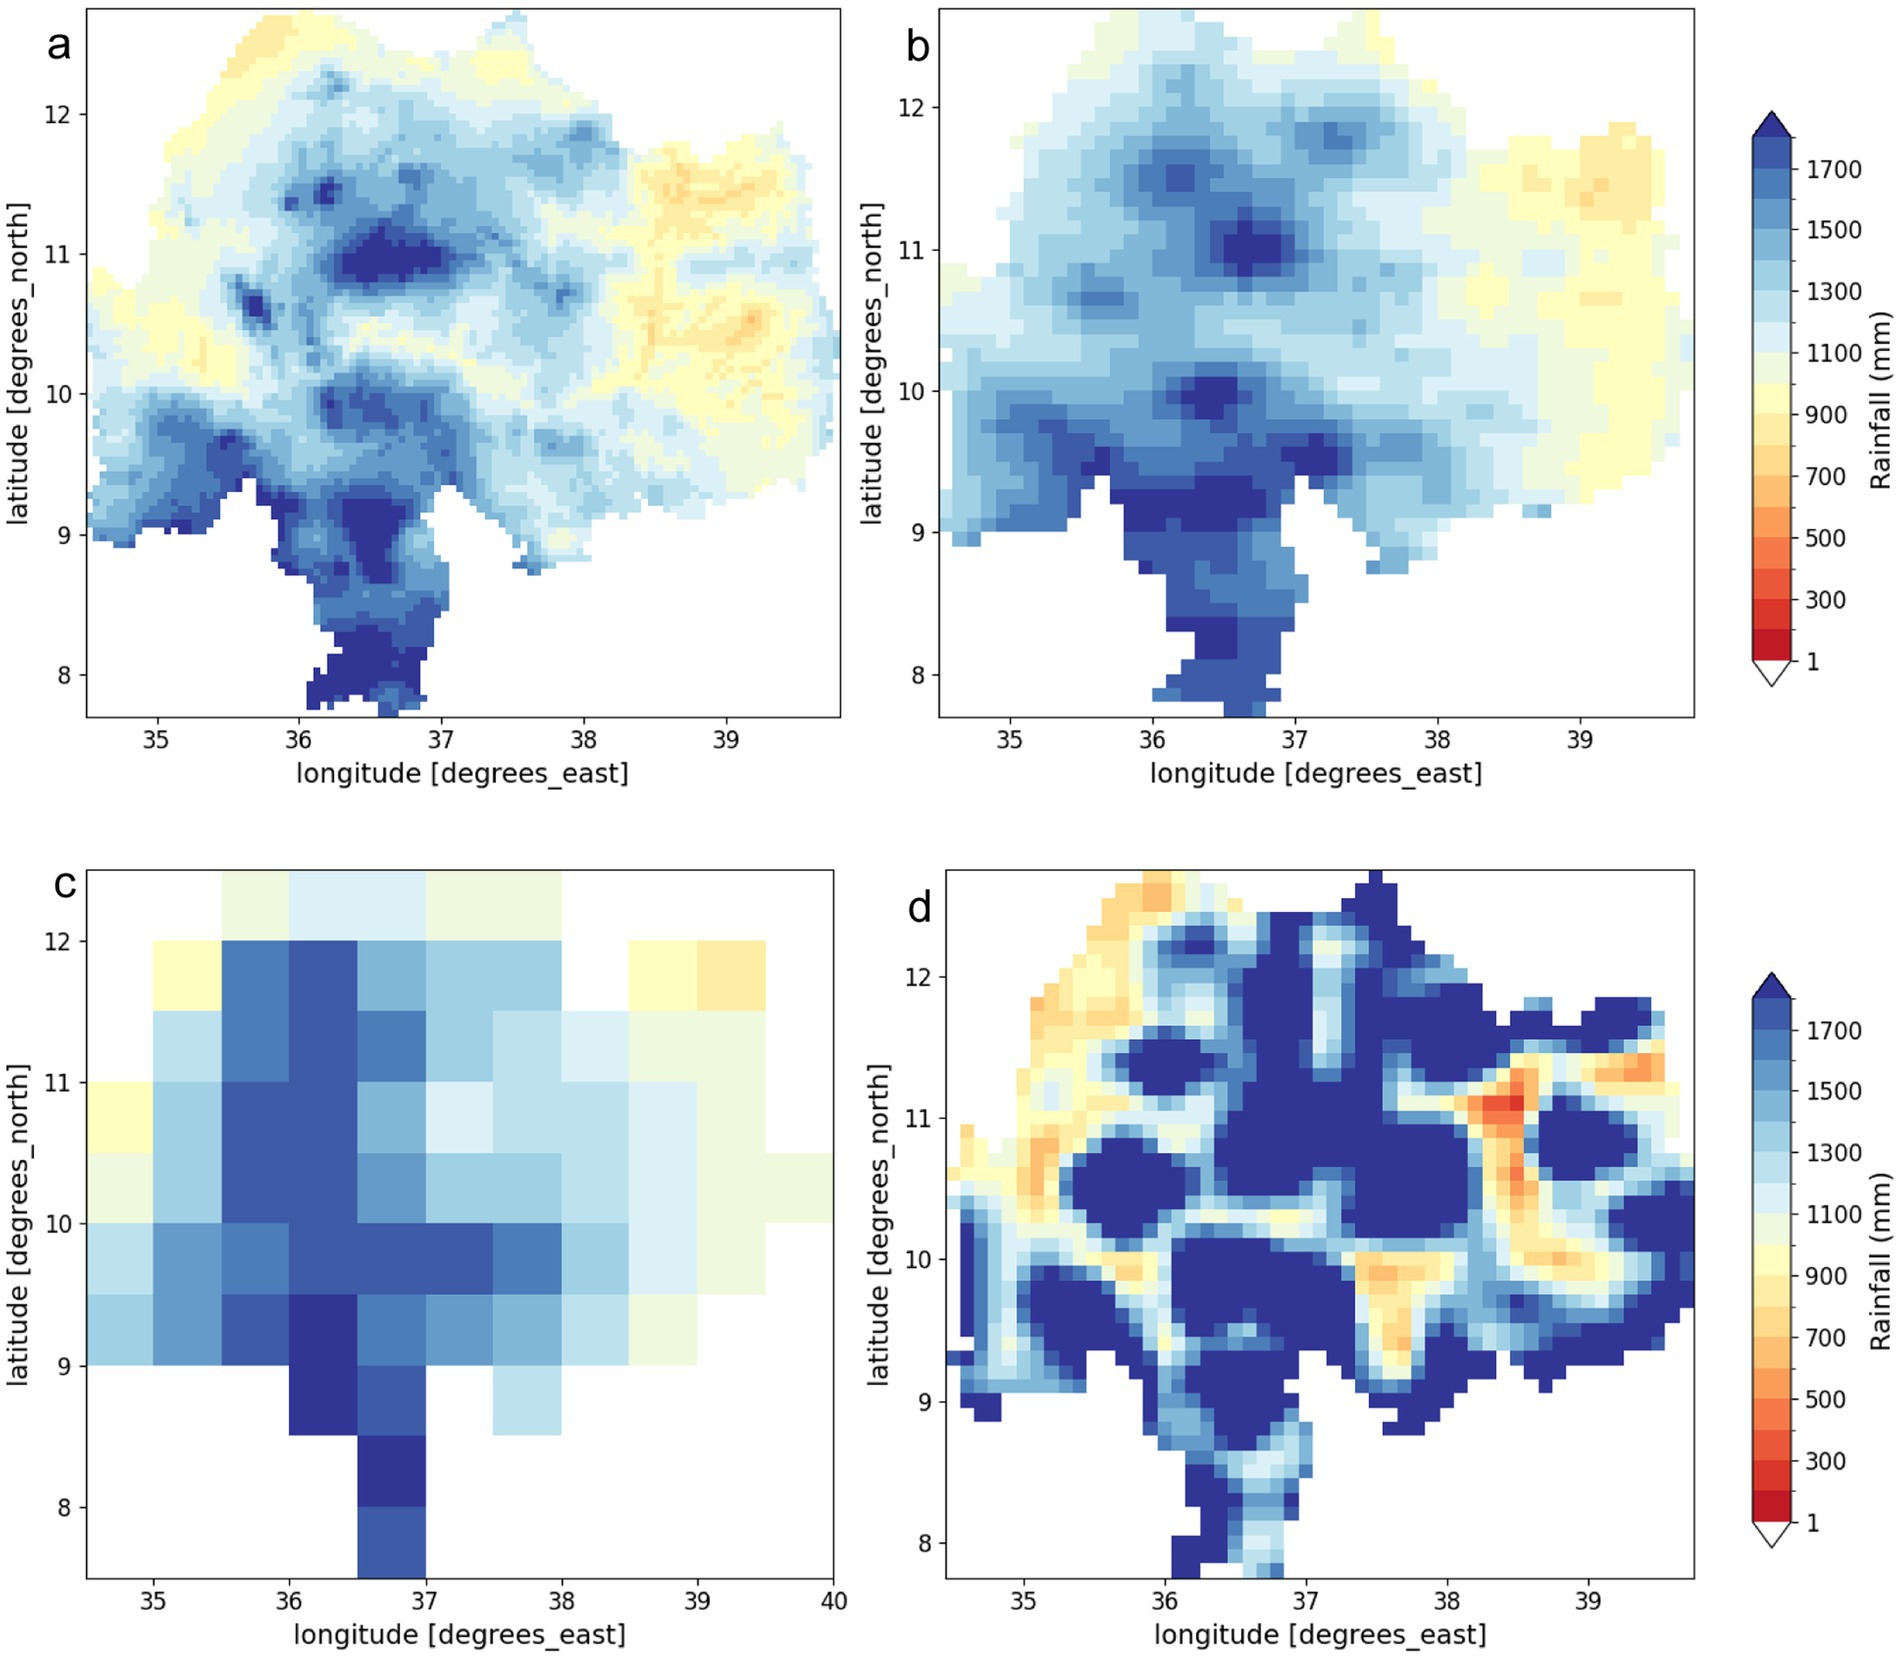
Figure 8. Spatial annual rainfall in the UBNB from different sources: (a) CHRIPS, (b) IMERG and (c) ERA5, (d) ERA5-Land.
In addition, the scatter plots in Figure 9 illustrate the relationship between satellite rainfall products and rain gauge observations at the dekadal timescale over the UBNB for the period 2001–2019. The satellite rainfall estimates show a stronger agreement with rain gauge observations at lower rainfall amounts, with the agreement gradually decreasing at higher rainfall values. However, CHIRPS, IMERG and REA5 demonstrate relatively better agreement with rain gauge observations (with correlation coefficients of 0.97, 0.98, and 0.96 respectively) compared to ERA5-Land at the dekadal timescale. As seen in Figure 9, the ERA5-Land values for heavier rainfall events tend to be higher than the observed values, indicating an overestimation of rainfall by ERA5-Land at this timescale.
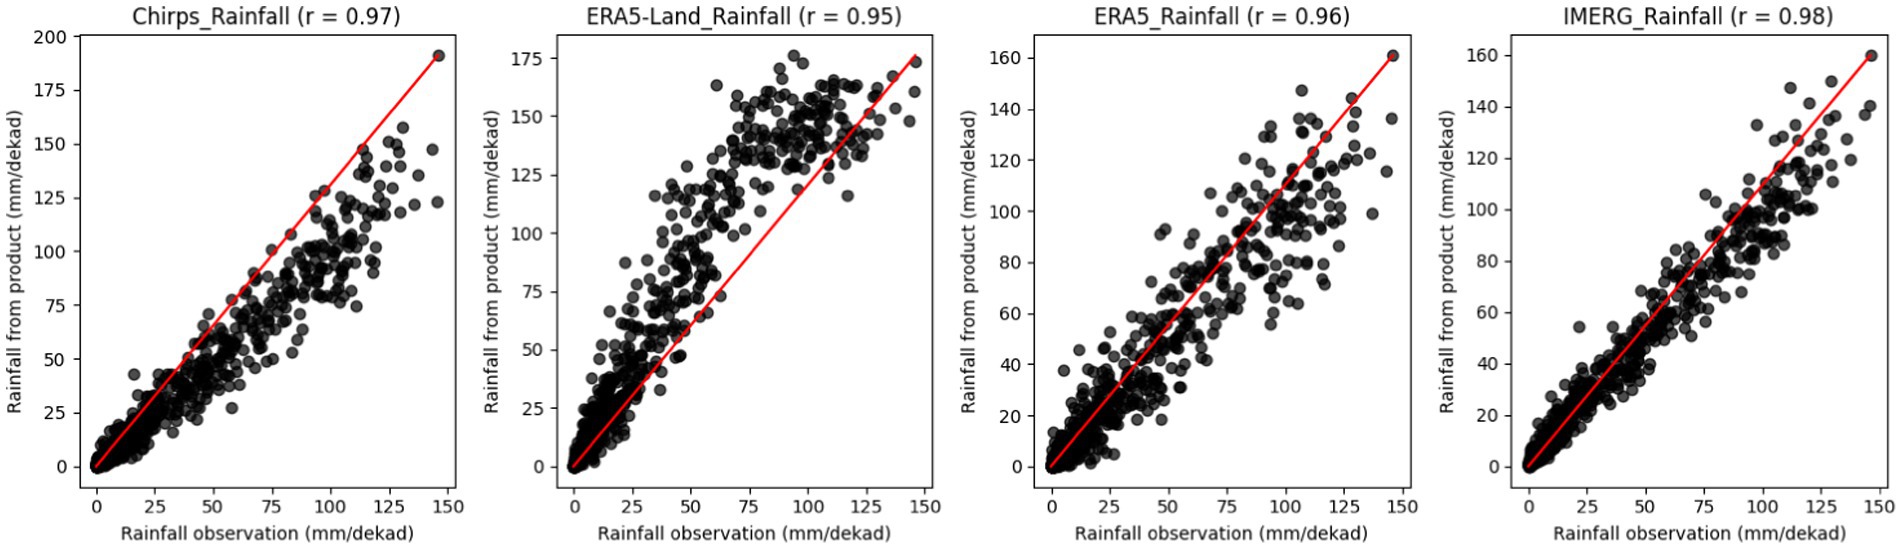
Figure 9. Comparison between rain gauge observations and satellite rainfall estimate at dekadal temporal scale over the UBNB for the period of 2001–2019. Red line denotes 1:1 relationship.
These findings underscore the reliability of CHIRPS, ERA5, and IMERG for rainfall analysis, demonstrating their strong consistency with in situ data and their suitability for hydrological applications in the UBNB. It is important to note that both CHIRPS and IMERG Final Run incorporate gauge correction, which may contribute to their superior performance compared to ERA5 and ERA5-Land. This suggests that rainfall products with in-situ gauge assimilation may provide more reliable estimates, especially in regions with complex topography like the UBNB.
A graphical comparison of daily and monthly observed and simulated discharge at the El Diem station during the calibration and validation periods is shown in Figures 10, 11. Various statistical parameters are reported in Table 4.
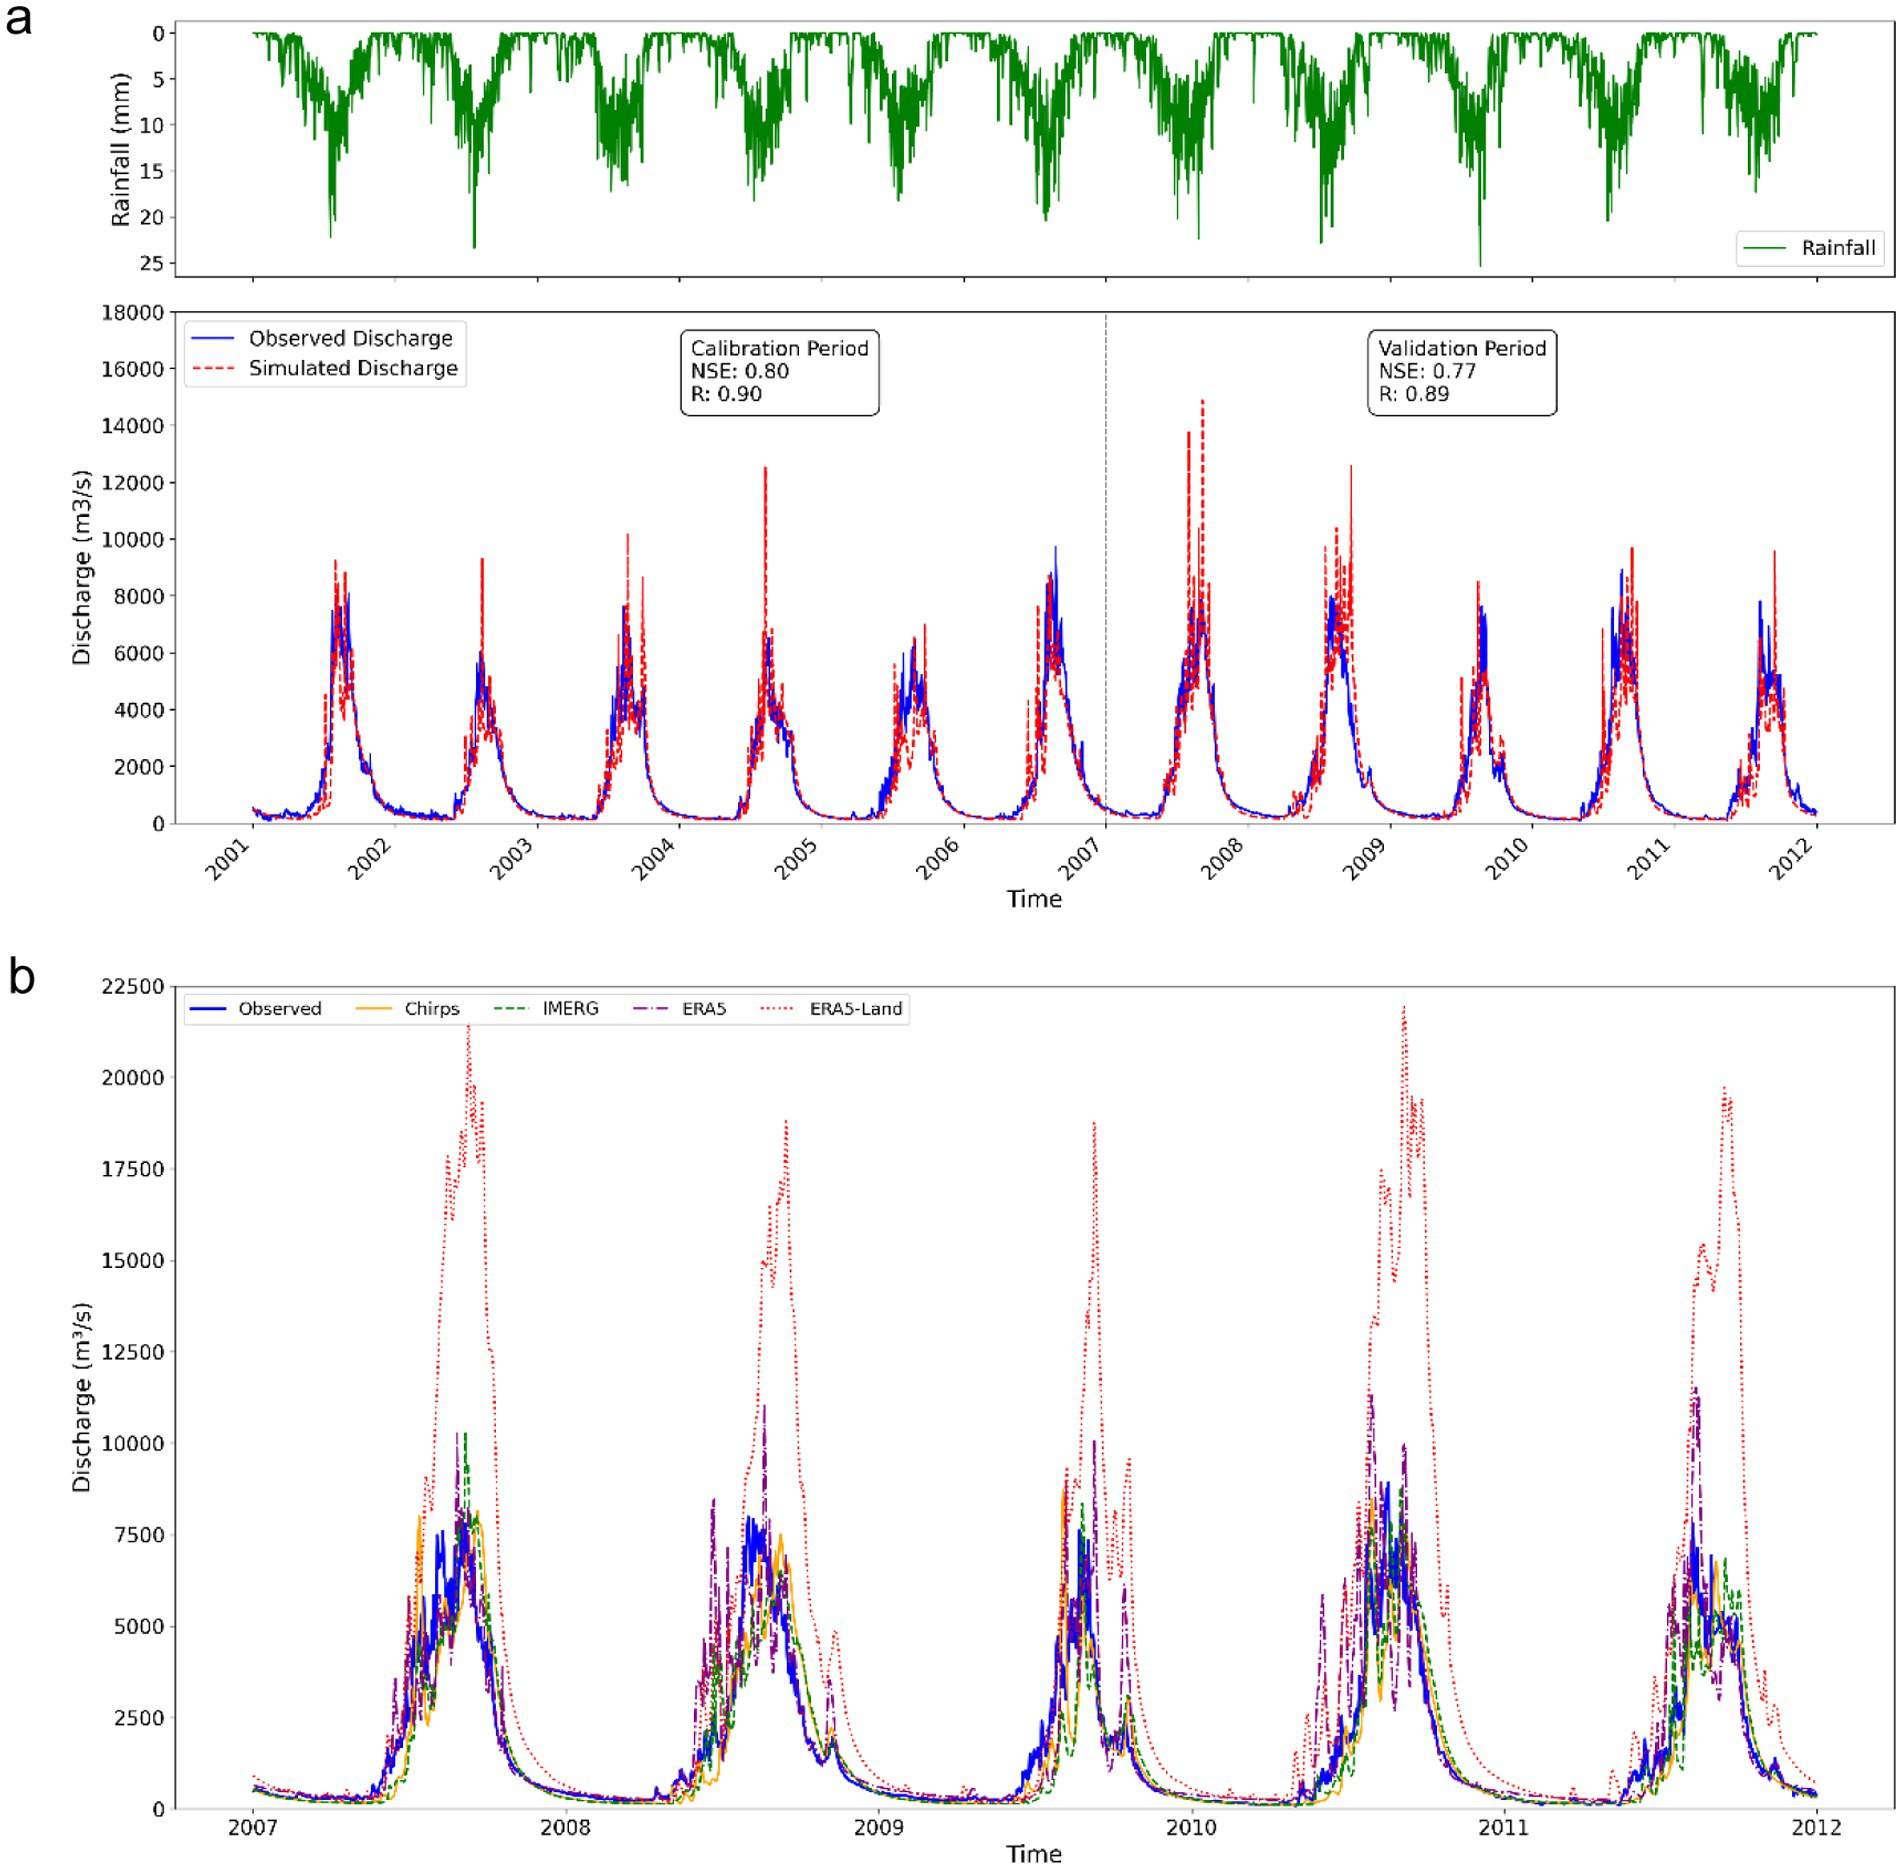
Figure 10. Comparison of daily simulated and observed hydrographs at the El Deim station of the BNB. (a) Station data in both calibration and validation periods, (b) remote sensing satellite estimates for validation period.
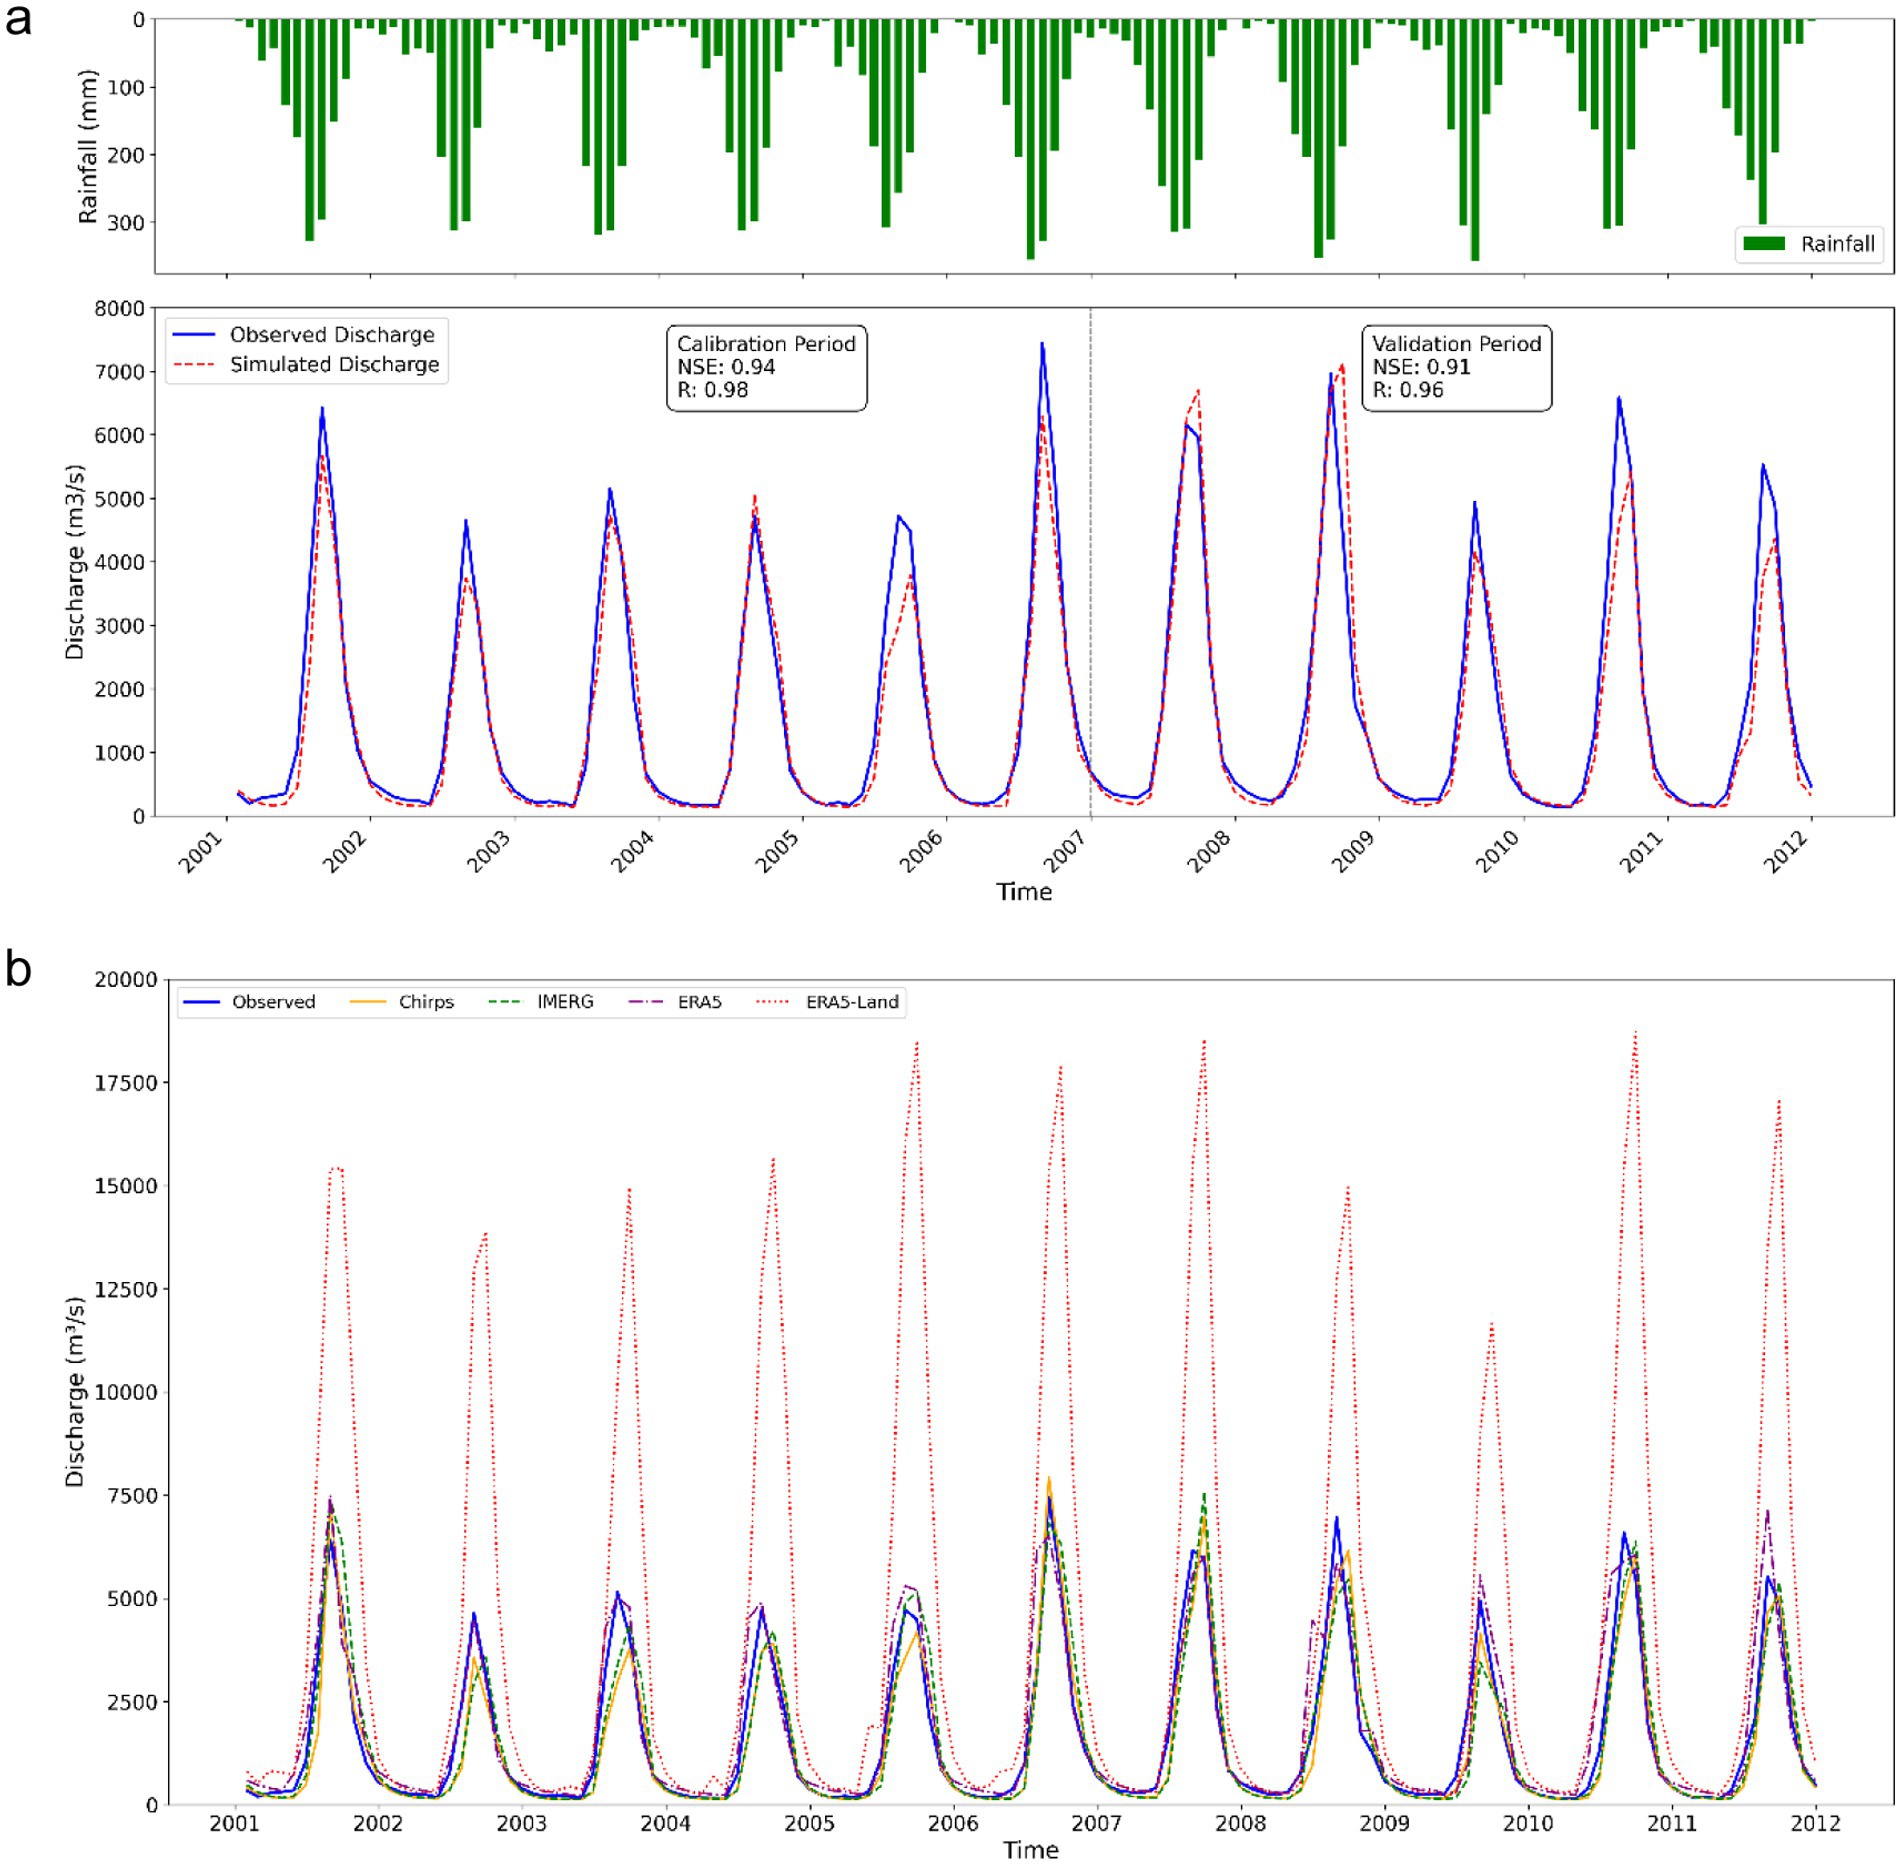
Figure 11. Monthly comparison of simulated and observed hydrographs in both calibration and validation periods at the El Deim station of the BNB. (a) Station data, (b) remote sensing satellite.
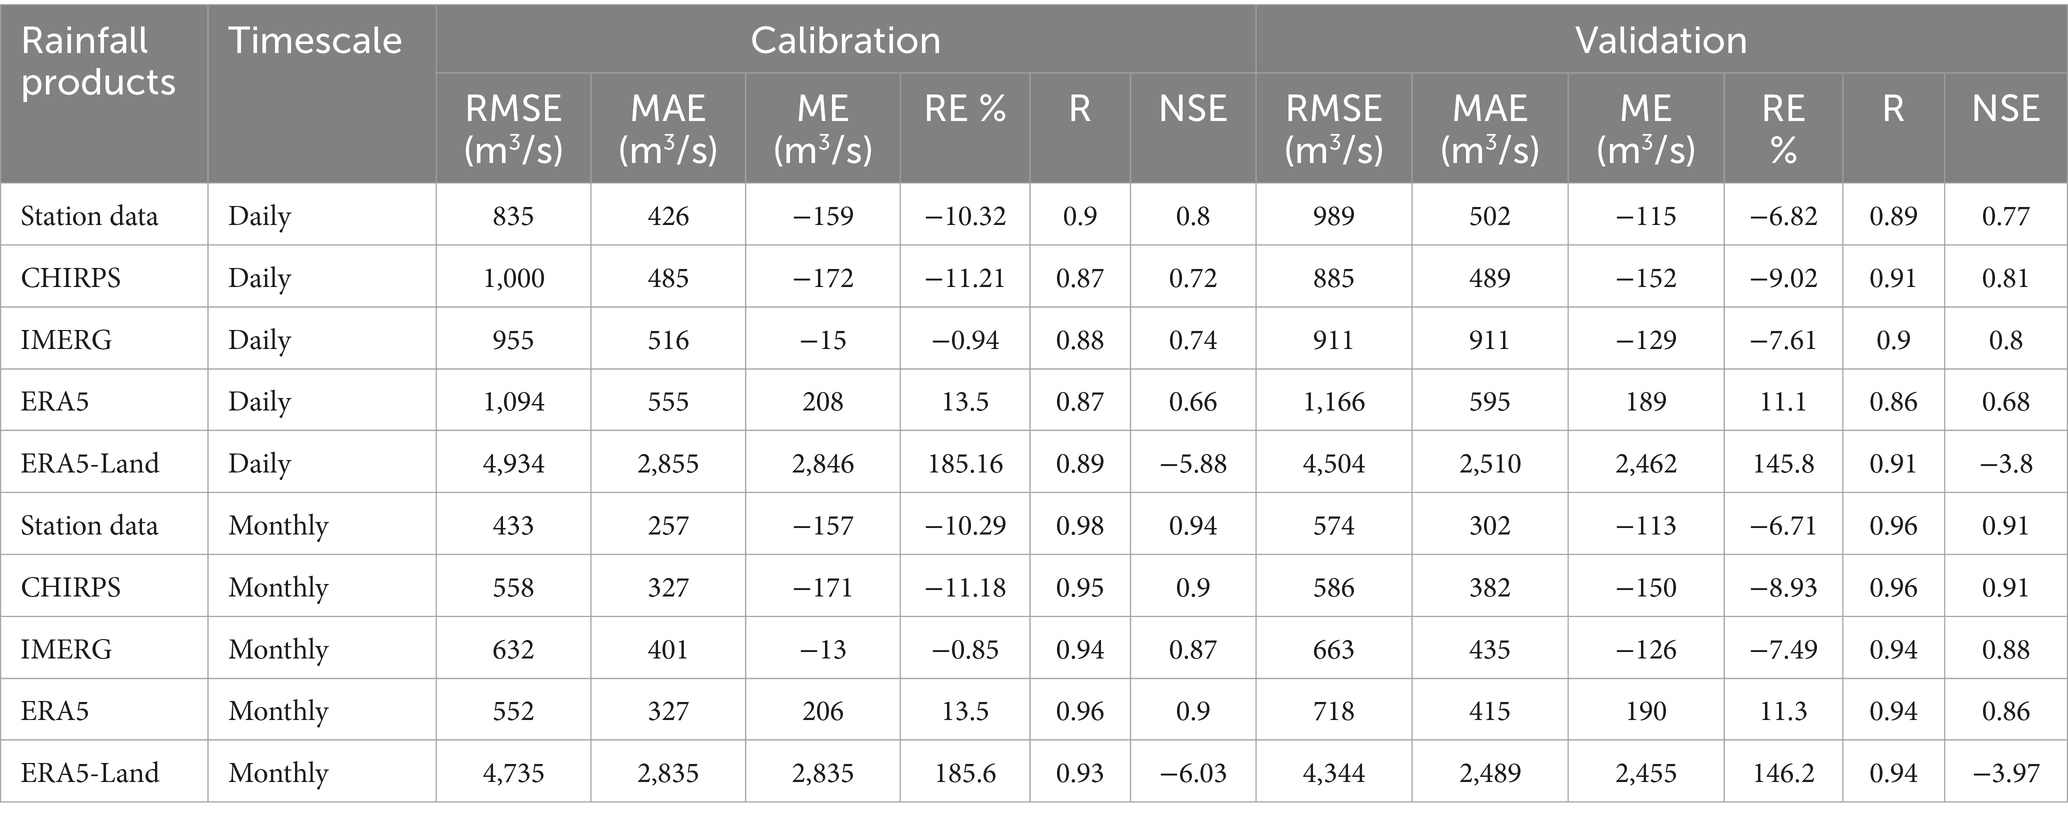
Table 4. Statistical analysis for the hydrologic evaluation at daily and monthly timescales over the El Deim station.
The WASA-SED model’s performance using station data, CHIRPS, IMERG, ERA5, and ERA5-Land in the UBNB ranged from acceptable to poor. For example, Nash–Sutcliffe efficiency (NSE) values in daily timescale for the calibration period were 0.80, 0.72, 0.74, 0.66 and −5.8 for rainfall station data, CHIRPS, IMERG, ERA5, and ERA5-Land, respectively. In validation, NSE values improved slightly for CHIRPS, IMERG and ERA5 at 0.81, 0.8, and 0.68 respectively, but ERA5-Land continued to perform poorly with an NSE of −3.8, mainly due to long periods of overestimation in daily streamflow simulations.
The correlation coefficient (R) values in daily timescale for the calibration period were 0.9 (station data), 0.87 (CHIRPS), 0.88 (IMERG), 0.87 (ERA5), and 0.89 (ERA5-Land), indicating a good correlation with observed data. During validation, R values were 0.89 (station data), 0.91 (CHIRPS), 0.9 (IMERG), 0.86 (ERA5), and 0.91 (ERA5-Land), indicating a strong agreement between observed and simulated streamflow for both periods.
Relative error (RE) in the daily timescale during calibration showed underestimation for Station data (−10.32%), CHIRPS (−11.21%), IMERG (−0.94%), and overestimation for ERA5 (13.5%) and ERA5-Land (185.2%). In validation, RE values for Station data, CHIRPS, IMERG, and ERA5 improved to −6.82, −9.02%, −7.61, and 11.1%, respectively, while ERA5-Land continued to overestimate streamflow with an RE of 145.8%.
At the monthly scale, statistical parameters, particularly R and NSE, showed improvement across all datasets except ERA5-Land (see Table 4). For example, NSE values for monthly simulation were 0.94 for station data, 0.9 for CHIRPS, 0.87 for IMERG, 0.9 for ERA5, and −6.03 for ERA5-Land during the calibration period, indicating improved model performance for station data, CHIRPS, IMERG and ERA5. In the validation period, NSE values remained consistent, with station data at 0.91, CHIRPS at 0.91, IMERG at 0.88, ERA5 at 0.86, and ERA5-Land continuing to underperform with an NSE of −3.97. This discrepancy highlights that while CHIRPS, IMERG and ERA5 are effective for simulating streamflow on a monthly basis, ERA5-Land’s tendency to overestimate rainfall diminishes its utility for accurate hydrological simulation.
The correlation coefficient (R) values further emphasize this trend. During calibration, R values for monthly streamflow simulations were 0.98 (station data), 0.95 (CHIRPS), 0.94 (IMERG), 0.96 (ERA5), and 0.93 (ERA5-Land). Validation results showed similar improvements, with R values of 0.96 for station data, 0.96 for CHIRPS, 0.94 for IMERG, 0.94 for ERA5, and 0.94 for ERA5-Land.
As illustrated in Figure 10, exceptionally high daily discharge peaks in El Deim station in the model results from the CHIRPS, IMERG, and ERA5 datasets. However, these pronounced peaks are not reflected on the monthly scale (Figure 11). This discrepancy is likely due to errors in the daily rainfall data over a limited number of days in specific sub-basins or differences in data quality between highland and lowland regions in satellite rainfall products (Gebremichael et al., 2014). These anomalies could amplify daily discharge estimates in the model, leading to isolated spikes that do not impact the monthly aggregated values in the same manner.
Given that the ERA5 grid is 10 times larger than CHIRPS, it is understandable that the hydrological model’s performance with ERA5 data is somewhat less accurate compared to CHIRPS. Overall, the WASA-SED model demonstrated that CHIRPS, IMERG, and ERA5 data could effectively simulate streamflow at daily and monthly timescales in the UBNB. CHIRPS and IMERG, which perform well on daily and monthly scales, are particularly useful for short-term flood forecasting and daily reservoir operations. ERA5, despite moderate errors, may be suitable for seasonal forecasts and long-term water planning. Notably, IMERG excelled with a much lower relative error (RE), averaging −0.94% on a daily scale and −0.85% on a monthly scale, highlighting its reliability for water management applications. In contrast, ERA5-Land’s pronounced tendency to overestimate rainfall significantly hindered its hydrologic performance, particularly in daily and monthly streamflow predictions. These findings underscore the suitability of CHIRPS, IMERG, and ERA5 datasets for hydrologic modeling in this region, confirming the model’s alignment with past studies on the UBNB.
Table 4 also shows that ground-based measurements provide better results than satellite estimates. While ground-based measurements provide the most direct and accurate observations, their sparse distribution limits their use in large-scale hydrological studies. A combination of satellite and ground-based data remains the best approach for comprehensive hydrological assessments (Polanco et al., 2017).
This study provides a comprehensive evaluation of the CHIRPS, IMERG, ERA5, and ERA5-Land satellite rainfall products for the UBNB, comparing their performance against ground-based measurements from 75 rain gauge stations. By examining daily, dekadal, monthly, and annual scales over the period from 2001 to 2019, we assessed the suitability of these datasets in capturing rainfall patterns and variability within the basin.
CHIRPS, IMERG, and ERA5 consistently aligned more closely with observed rainfall data across various timescales, exhibiting strong correlations and lower errors compared to ERA5-Land, which demonstrated significant overestimations, especially for higher rainfall values. At the daily scale, CHIRPS, ERA5, and IMERG had mean RE values of 2.68, 3.14, and 4.56%, respectively, compared to 66.06% for ERA5-Land. On the monthly scale, IMERG, CHIRPS, and ERA5 performed well, achieving NSE values of 0.83, 0.80, and 0.76, respectively, whereas ERA5-Land averaged −0.84.
The annual rainfall averages revealed that CHIRPS, ERA5, and IMERG closely matched station measurements, while ERA5-Land consistently overestimated rainfall, with some regions in the UBNB exceeding 5,000 mm annually. CHIRPS and IMERG exhibited similar spatial rainfall patterns, with the highest concentrations in the southwestern and central basin, aligning well with observed data. At the dekadal scale, scatter plot analysis showed that CHIRPS, IMERG, and ERA5 achieved higher correlation coefficients (0.97, 0.98, and 0.96, respectively) compared to ERA5-Land, which overestimated heavy rainfall events.
Following this evaluation, we implemented the WASA-SED model, a physically-based distributed hydrological model, to simulate streamflow using each of the rainfall datasets. The hydrological simulations demonstrated that CHIRPS, IMERG and ERA5 were capable of generating streamflow estimates that closely matched observed discharge data at both daily and monthly scales. ERA5-Land, however, produced less reliable results, with substantial discrepancies due to its rainfall overestimation. The calibration and validation processes confirmed the effectiveness of CHIRPS, IMERG and ERA5 in hydrological modeling for the UBNB, with acceptable different statistical parameters such as Nash-Sutcliffe Efficiency (NSE), Relative error (RE) and correlation values for these datasets, while ERA5-Land showed significantly lower performance.
In conclusion, this study highlights the potentials, uncertainties and limitations of CHIRPS, IMERG, and ERA5 as satellite-derived rainfall information products for hydrological modeling in the UBNB. We have shown that such an evaluation is key for a subsequent modeling of the hydrological cycle and water resources options in such a regional context. One must not rely on such products for any type of environmental modeling without a prior sincere check of the product’s reliability. We have shown that IMERG, in particular, excelled with a much lower relative error, emphasizing its utility for water management applications. In case one wants to use the globally available products, a bias correction method, suitable and adapted for the particular regions, is strongly recommended.
The WASA-SED model demonstrated its capability to simulate streamflow in this large complex tropical catchment. The usage of satellite-derived rainfall can be appropriate after the before mentioned sincere evaluation. In this regard, it shows an important value for water resource planning and management in such a regional scale and tropical environment. Future research should focus on refining satellite rainfall products like ERA5-Land and enhancing bias correction techniques to improve their applicability for hydrological modeling in complex, data-scarce regions.
The raw data supporting the conclusions of this article will be made available by the authors, without undue reservation.
MZ: Conceptualization, Data curation, Formal analysis, Funding acquisition, Investigation, Methodology, Project administration, Resources, Software, Supervision, Validation, Visualization, Writing – original draft, Writing – review & editing. AB: Writing – original draft, Writing – review & editing. TF: Writing – original draft, Writing – review & editing. FZ: Writing – review & editing. KW: Writing – review & editing. RW: Writing – review & editing. CL: Writing – review & editing. YH: Writing – review & editing. WS: Writing – review & editing. HK: Writing – review & editing.
The author(s) declare that financial support was received for the research and/or publication of this article. This research is part of the SPS-Blue Nile project (Development and Transfer of a Seamless Prediction System for Decision Support in Transboundary Water Management of the Blue Nile), funded by the Federal Ministry of Education and Research of Germany (BMBF) under the Water as a Global Resource (GRoW) program.
The authors declare that the research was conducted in the absence of any commercial or financial relationships that could be construed as a potential conflict of interest.
The authors declare that no Gen AI was used in the creation of this manuscript.
All claims expressed in this article are solely those of the authors and do not necessarily represent those of their affiliated organizations, or those of the publisher, the editors and the reviewers. Any product that may be evaluated in this article, or claim that may be made by its manufacturer, is not guaranteed or endorsed by the publisher.
Abdelmoneim, H., Soliman, M. R., and Moghazy, H. M. (2020). Evaluation of TRMM 3B42V7 and CHIRPS satellite precipitation products as an input for hydrological model over eastern Nile Basin. Earth Syst. Environ. 2020, 685–698. doi: 10.1007/s41748-020-00185-3
Abebe, S. A., Qin, T., Yan, D., Gelaw, E. B., Workneh, H. T., Kun, W., et al. (2020). Spatial and temporal evaluation of the latest high-resolution precipitation products over the upper Blue Nile River basin, Ethiopia. Water 12:3072. doi: 10.3390/w12113072
Abera, W., Formetta, G., Brocca, L., and Rigon, R. (2017). Modeling the water budget of the upper Blue Nile basin using the JGrass-NewAge model system and satellite data. Hydrol. Earth Syst. Sci. 21, 3145–3165. doi: 10.5194/hess-21-3145-2017
Abtew, W., Dessu, S. B., Abtew, W., and Dessu, S. B. (2019). Hydrology of the Blue Nile Basin overview. Grand Ethiopian Renaissance Dam Blue Nile 2019, 39–62. doi: 10.1007/978-3-319-97094-3_4
Ahmed, J. S., Buizza, R., Dell’Acqua, M., Demissie, T., and Enrico Pè, M. (2024). Evaluation of ERA5 and CHIRPS rainfall estimates against observations across Ethiopia. Meteorog. Atmos. Phys. 136:17. doi: 10.1007/s00703-024-01008-0
Ayehu, G. T., Tadesse, T., Gessesse, B., and Dinku, T. (2018). Validation of new satellite rainfall products over the upper Blue Nile Basin, Ethiopia. Atmospheric Measur. Tech. 11, 1921–1936. doi: 10.5194/amt-11-1921-2018
Bayissa, Y., Tadesse, T., Demisse, G., and Shiferaw, A. (2017). Evaluation of satellite-based rainfall estimates and application to monitor meteorological drought for the upper Blue Nile Basin, Ethiopia. Remote Sensing 9:669. doi: 10.3390/rs9070669
Bronstert, A., de Araújo, J. C., Batalla, R. J., Costa, A. C., Delgado, J. M., Francke, T., et al. (2014). Process-based modelling of erosion, sediment transport and reservoir siltation in mesoscale semi-arid catchments. J. Soils Sediments 14, 2001–2018. doi: 10.1007/s11368-014-0994-1
Coffel, E. D., Keith, B., Lesk, C., Horton, R. M., Bower, E., Lee, J., et al. (2019). Future hot and dry years worsen Nile Basin water scarcity despite projected precipitation increases. Earth's Future 7, 967–977. doi: 10.1029/2019EF001247
Conway, D. (2000). Some aspects of climate variability in the northeast Ethiopian highlands-Wollo and Tigray. Ethiopian J. Sci. 23, 139–161.
Conway, D. (2005). From headwater tributaries to international river: observing and adapting to climate variability and change in the Nile basin. Glob. Environ. Change 15, 99–114. doi: 10.1016/j.gloenvcha.2005.01.003
Dinku, T., Funk, C. C., Peterson, P., Maidment, R., Tadesse, T., Gadain, H., et al. (2018). Validation of the CHIRPS satellite rainfall estimates over eastern Africa. Adv. Remote Sensing Rainfall Snowfall 144, 292–312. doi: 10.1002/qj.3244
Easton, Z. M., Fuka, D. R., White, E. D., Collick, A. S., Biruk Ashagre, B., McCartney, M., et al. (2010). A multi basin SWAT model analysis of runoff and sedimentation in the Blue Nile, Ethiopia. Hydrol. Earth Syst. Sci. 14, 1827–1841. doi: 10.5194/hess-14-1827-2010
Elkollaly, M., Khadr, M., and Zeidan, B. (2018). Drought analysis in the eastern Nile basin using the standardized precipitation index. Environ. Sci. Pollut. Res. 25, 30772–30786. doi: 10.1007/s11356-016-8347-9
FAO. (2012). Harmonized World Soil Database (version 1.2). FAO, Rome, Italy and IIASA, Laxenburg, Austria. Available at: http://webarchive.iiasa.ac.at/Research/LUC/External-World-soil-database/HTML/HWSD_Data.html?sb=4
Fenta, A. A., Rientjes, T., Haile, A. T., and Reggiani, P. (2014). Satellite rainfall products and their reliability in the Blue Nile Basin. Nile River Basin Ecohydrol. Challenges Climate Change Hydropolitics 13, 51–67.
Ferrari, E., McDonald, S., and Osman, R. (2013). “Grand Ethiopian renaissance dam: A global CGE model to assess the economic effects on the Ethiopian economy,” in 16th Annual Conference on Global Economic Analysis, “New Challenges for Global Trade in a Rapidly Changing World” Information Building, Shanghai Institute of Foreign Trade, 2013.
Francke, T. (2009). Measurement and modelling of water and sediment fluxes in meso-scale dryland catchments, PhD-Thesis. Potsdam: University of Potsdam.
Francke, T. (2015). PPSO—R-package ppso: Particle swarm optimization and dynamically dimensioned search, optionally using parallel computing based on Rmpi, rev. 0.9–9., R-package.
Francke, T., Güntner, A., Bronstert, A., Mamede, G., and Mueller, E. N. (2008). Automated catena-based discretization of landscapes for the derivation of hydrological modelling units. Int. J. Geograph. Inf. Sci. 22, 111–132. doi: 10.1080/13658810701300873
Funk, C. C., Peterson, P. J., and Landsfeld, M. F. (2014). A quasi-global precipitation time series for drought monitoring. US Geol Surv Data Ser 832:4. doi: 10.3133/ds832
Funk, C. C., Verdin, A., and Michaelsen, J. (2015). A global satellite-assisted precipitation climatology. Earth Syst. Sci. 7, 275–287. doi: 10.5194/essd-7-275-2015
Gado, T. A., Zamzam, D. H., Guo, Y., and Zeidan, B. A. (2024). Evaluation of satellite-based rainfall estimates in the upper Blue Nile basin. J. Earth Syst. Sci. 133:27. doi: 10.1007/s12040-023-02235-6
Gebremicael, T. G., Mohamed, Y. A., Van Der Zaag, P., Gebremedhin, A., Gebremeskel, G., Yazew, Y., et al. (2019). Evaluation of multiple satellite rainfall products over the rugged topography of the Tekeze-Atbara basin in Ethiopia. Int. J. Remote Sens. 40, 1–20. doi: 10.1080/01431161.2018.1562585
Gebremichael, M., Bitew, M. M., Hirpa, F. A., and Tesfay, G. N. (2014). Accuracy of satellite rainfall estimates in the Blue Nile Basin: lowland plain versus highland mountain. Water Resour Re. 50, 8775–8790. doi: 10.1002/2013WR014500
Green, W. H., and Ampt, G. A. (1911). Studies on soil physics I. The flow of air and water through soils. J. Agr. Sci 4, 1–24.
Güntner, A. (2002). Large-scale hydrological modelling in the semi-arid north-east of Brazil, PhD-Thesis. Potsdam: University of Potsdam.
Güntner, A., and Bronstert, A. (2004). Representation of landscape variability and lateral redistribution processes for large-scale hydrological modelling in semi-arid areas. J. Hydrol. 297, 136–161. doi: 10.1016/j.jhydrol.2004.04.008
Güntner, A., Krol, M., de Araújo, J. C., and Bronstert, A. (2004). Simple water balance modelling of surface reservoir systems in a large data-scarce semiarid region. Hydrol. Sci. J. 49, 901–918.
Kim, U., Kaluarachchi, J., and Smakhtin, V. (2008). Generation of monthly precipitation under climate change for the upper Blue Nile River basin, Ethiopia. J. Am. Water Resour. 44, 1231–1247. doi: 10.1111/j.1752-1688.2008.00220.x
Knapp, K., Ansari, S., and Bain, C. (2011). Globally gridded satellite observations for climate studies. Bull. Am. Meteorol. Soc. 92, 893–907. doi: 10.1175/2011BAMS3039.1
Koukoula, M., Nikolopoulos, E. I., Dokou, Z., and Anagnostou, E. N. (2020). Evaluation of global water resources reanalysis products in the upper Blue Nile River basin. J. Hydrometeorol. 21, 935–952. doi: 10.1175/JHM-D-19-0233.1
Lakew, H. B., Moges, S. A., and Asfaw, D. H. (2017). Hydrological evaluation of satellite and reanalysis precipitation products in the upper Blue Nile Basin: a case study of Gilgel Abbay. Hydrology 4:39. doi: 10.3390/hydrology4030039
Lakew, H. B., Moges, S. A., and Asfaw, D. H. (2020). Hydrological performance evaluation of multiple satellite precipitation products in the upper Blue Nile basin, Ethiopia. J. Hydrol. Reg. Stu. 27:100664. doi: 10.1016/j.ejrh.2020.100664
Lorenz, C., Portele, T., Laux, P., and Kunstmann, H. (2020). Seasonal water resources Management for Semiarid Areas: Bias-corrected and spatially disaggregated seasonal forecasts for the Tekeze-Atbara and Blue Nile basins (Ethiopia/Eritrea/Sudan). Hamburg: World data Center for Climate (WDCC) at DKRZ.
McCartney, M. P., and Menker Girma, M. (2012). Evaluating the downstream implications of planned water resource development in the Ethiopian portion of the Blue Nile River. Water Int. 37, 2012, 362–379.
Mellander, P. E., Gebrehiwot, S. G., Gärdenäs, A. I., Bewket, W., and Bishop, K. (2013). Summer rains and dry seasons in the upper Blue Nile Basin: the predictability of half a century of past and future spatiotemporal patterns. PLoS One 8:68461. doi: 10.1371/journal.pone.0068461
Mengistu, D., Bewket, W., and Lal, R. (2014). Recent spatiotemporal temperature and rainfall variability and trends over the upper Blue Nile River basin, Ethiopia. Int. J. Climatol. 34:3837. doi: 10.1002/joc.3837
Mohammed, J. A., Gashaw, T., Tefera, G. W., Dile, Y. T., Worqlul, A. W., and Addisu, S. (2022). Changes in observed rainfall and temperature extremes in the upper Blue Nile Basin of Ethiopia. Weather Clim. Extremes 37:100468. doi: 10.1016/j.wace.2022.100468
Müller, E. N., Güntner, A., Francke, T., and Mamede, G. (2010). Modelling sediment export, retention and reservoir sedimentation in drylands with the WASA-SED model. Geosci. Model Dev. 3:275291.
Mulat, A. G. (2015). Water resource system modeling of the eastern Nile River basin, PhD-Thesis. Addis Ababa: Addis Ababa University.
Oestigaard, T. (2012). Water scarcity and food security along the Nile: Politics, population increase and climate change. Uppsala: Nordiska Afrika institute.
Paisley, R. K., and Henshaw, T. W. (2013). Transboundary governance of the Nile River basin: past, present and future. Environ. Dev. 7, 59–71. doi: 10.1016/j.envdev.2013.05.003
Pilz, T., Francke, T., and Bronstert, A. (2017). lumpR 2.0.0: an R package facilitating landscape discretisation for hillslope-based hydrological models. Geosci. Model Dev. 10, 3001–3023. doi: 10.5194/gmd-10-3001-2017
Polanco, E. I., Fleifle, A., Ludwig, R., and Disse, M. (2017). Improving SWAT model performance in the upper Blue Nile Basin using meteorological data integration and subcatchment discretization. Hydrol. Earth Syst. Sci. 21, 4907–4926. doi: 10.5194/hess-21-4907-2017
Ragab, O., and Valeriano, O. C. S. (2014). “Flood forecasting in Blue Nile Basin using a process-based distributed hydrological model and satellite distributed hydrological model and satellite derived precipitation product,” in ASEE 2014 Zone I Conference. USA.
Rahman, M. A. (2013). Water security: Ethiopia–Egypt transboundary challenges over the Nile river basin. J. Asian Afr. Stud. 48, 35–46. doi: 10.1177/0021909612438517
Rientjes, T., Haile, A. T., and Fenta, A. A. (2013). Diurnal rainfall variability over the upper Blue Nile Basin: a remote sensing-based approach. Int. J. Appl. Earth Obs. Geoinf. 21, 311–325. doi: 10.1016/j.jag.2012.07.009
Roth, V., Lemann, T., Zeleke, G., Subhatu, A. T., Nigussie, T. K., and Hurni, H. (2018). Effects of climate change on water resources in the upper Blue Nile Basin of Ethiopia. Heliyon 4:e00771. doi: 10.1016/j.heliyon.2018.e00771
Rottler, E., Schüttig, M., Bronstert, A., Sousa Estáicio, A. B., Vieira Rocha, R., de Carvalho Junior, V. N., et al. (2024). Regional-scale seasonal forecast of surface water availability in a semi-arid environment: the case of Ceará state in northeast of Brazil. J. Hydrol. Reg. Stu. 56:102058. doi: 10.1016/j.ejrh.2024.102058
Samy, A., Ibrahim, G. M., Mahmod, W. E., Fujii, M., Eltawil, A., and Daoud, W. (2019). Statistical assessment of rainfall characteristics in upper Blue Nile basin over the period from 1953 to 2014. Water 11:468. doi: 10.3390/w11030468
Tolson, B. A., and Shoemaker, C. A. (2007). Dynamically dimensioned search algorithm for computationally efficient watershed model calibration. Water Resource Research. 43:W01413. doi: 10.1029/2005WR004723
Shuttleworth, J., and Wallace, J. S. (1985). Evaporation from sparse crops – an energy combination theory. Q. J. R. Meteorol. Soc. 111, 839–855.
Voit, P., Francke, T., and Bronstert, A. (2023). Accounting for operational irrigation options in mesoscale hydrological modelling of dryland environments. Hydrol. Sci. J. 68, 670–684. doi: 10.1080/02626667.2023.2187296
Keywords: Upper Blue Nile Basin, satellite rainfall, CHIRPS, IMERG, ERA5, ERA5-Land, hydrological modeling, WASA-SED
Citation: Zargar M, Bronstert A, Francke T, Zimale FA, Worku KB, Wiegels R, Lorenz C, Hageltom Y, Sawadogo W and Kunstmann H (2025) Comparison and hydrological evaluation of different precipitation data for a large tropical region: the Blue Nile Basin in Ethiopia. Front. Water. 7:1536881. doi: 10.3389/frwa.2025.1536881
Edited by:
Donatella Termini, University of Palermo, ItalyReviewed by:
Luca Ciabatta, National Research Council (CNR), ItalyCopyright © 2025 Zargar, Bronstert, Francke, Zimale, Worku, Wiegels, Lorenz, Hageltom, Sawadogo and Kunstmann. This is an open-access article distributed under the terms of the Creative Commons Attribution License (CC BY). The use, distribution or reproduction in other forums is permitted, provided the original author(s) and the copyright owner(s) are credited and that the original publication in this journal is cited, in accordance with accepted academic practice. No use, distribution or reproduction is permitted which does not comply with these terms.
*Correspondence: Morteza Zargar, bXphcmdhckB1bmktcG90c2RhbS5kZQ==
Disclaimer: All claims expressed in this article are solely those of the authors and do not necessarily represent those of their affiliated organizations, or those of the publisher, the editors and the reviewers. Any product that may be evaluated in this article or claim that may be made by its manufacturer is not guaranteed or endorsed by the publisher.
Research integrity at Frontiers
Learn more about the work of our research integrity team to safeguard the quality of each article we publish.