
94% of researchers rate our articles as excellent or good
Learn more about the work of our research integrity team to safeguard the quality of each article we publish.
Find out more
ORIGINAL RESEARCH article
Front. Water, 13 February 2025
Sec. Environmental Water Quality
Volume 7 - 2025 | https://doi.org/10.3389/frwa.2025.1507254
 Mohammad Mohinuzzaman1*†
 Jannatul Mowa1†
 Mohammad Mahbub Kabir1,2
 Muhammed Alamgir Zaman Chowdhury3Meherun Nesha3Khan M. G. Mostofa4
 Nahin Mostofa Niloy5,6Mashura Shammi5
 Shafi M. Tareq5
This study aimed to evaluate the physicochemical properties and the characteristics of the fluorescent dissolved organic matter (FDOM) in the Dhaleshwari River, located in the peripheral Dhaka district, Bangladesh. The Dhaleshwari River was selected as the study area due to the presence of a tannery industrial estate and various industries discharging effluents in the surrounding areas. The socioeconomic and ecological significance of the river is highly critical to the locality. Water samples were collected in the dry season for pH, electrical conductivity (EC), salinity, total dissolved solids (TDS), dissolved oxygen (DO), biochemical oxygen demand (BOD), chemical oxygen demand (COD), and FDOM analyses. The river water quality values were compared to the recommended standards of the Environmental Conservation Rules (ECR), and it was observed that the BOD and COD levels exceeded the limits. The water quality index (WQI) values showed that river water is extremely polluted, and the values significantly increased from the upstream to the Keraniganj BSCIC area. 3DEEM-PARAFAC analysis confirmed the presence of protein-like substances, terrestrial humic and fulvic acids, and degraded fulvic acids in the samples, which provided evidence of organic matter pollution. Relatively higher FDOM levels were found in the upstream area of the river compared to the downstream part. Furthermore, we found that with the increase in the river depth, the FDOM substances decreased due to the absorption of sunlight, microbial degradation, and photosynthesis. It is recommended that industrial estates implement proper wastewater treatment plants, and the Department of Environment (DoE) should take political and legislative actions to establish an adequate water quality monitoring system.
Natural organic substances found in the soil and water, such as humic and fulvic acids (Mohinuzzaman et al., 2020), can degrade and enter the surrounding environment as dissolved organic matter (DOM) (Zark and Dittmar, 2018; Mostofa et al., 2019). To identify and characterize fluorescent dissolved organic matter (FDOM) such as humic acid, fulvic acid-like, and protein-like fluorophores in water, an excitation-emission matrix (EEM) spectroscopy coupled with parallel factor analysis (PARAFAC) has been used (Gabor et al., 2015; Gao et al., 2018). EEM-PARAFAC modeling is a quick, powerful, and simple tool that can identify sources and characterize biogeochemical signatures and their transformation mechanisms of FDOM in surface waters (Mostofa et al., 2019). In aquatic ecosystem, the production of FDOM substantially influences numerous biogeochemical processes and functions (Yang et al., 2020). Currently, one of the most important technologies for determining the source of water chemistry is the assessment of water pollution through variations in the fluorescence characteristics of DOM, influenced by different components and properties of DOM under different temporal and spatial conditions (He et al., 2022).
Bangladesh is located in the deltaic or lower regions of the Ganga-Padma, Brahmaputra-Jamuna, and Barak-Meghna river systems, which are three major river systems. Many small rivers, peninsulas, perennial streams, beels, and estuaries cover approximately 25% of the land area (Paul and Haq, 2010). The rivers of Bangladesh have significant multi-usage components, such as fisheries, energy production, drinking water sources, and irrigation. All of these greatly depend on water quality, making it essential to maintain the river water at levels that are safe for both human and animal use (Iscen et al., 2008). The rivers of Bangladesh have a profound impact on the physiography of the nation and the life of the people (Mirza et al., 2003; Smith et al., 1998). However, the quality of surface water is deteriorating daily (Hasan et al., 2019).
The Dhaleshwari River is one of the most ecologically significant rivers due to its connection with the Buriganga River for receiving water from the Jamuna River. However, it also receives indiscriminate disposal and dumping of various types of waste from Dhaka City and its adjacent areas (Paul and Haq, 2010). In particular, the riverside tannery industries are a significant contributor to the pollution of the Dhaleshwari River water. Out of the 154 tanneries located at the Savar Tanneries Estate, 55 began producing wet blue leather on 31 May 2017 (Islam, 2018). During the peak season, the waste generated by these tanneries is only partially treated by the central effluent treatment plant (CETP). As a result, some waste is disposed of before it undergoes comprehensive treatment at the CETP. Various sources of pollution pose a threat to river water quality, which include untreated hazardous chemicals from tannery waste, industrial effluents, municipal wastewater, runoff from chemical fertilizers and pesticides, oil spillage around river ports, and indiscriminate dumping of tannery effluent (Goutam, 2018; Sarkar et al., 2019).
Water quality depends on a substantial number of physicochemical and biological parameters, and any abnormal changes in these parameters indicates the degradation of the water quality (Reddi et al., 1993). Assessing the water quality index (WQI) is crucial for preventing and controlling river pollution and obtaining reliable information regarding water quality, which assists in effective water resource management (Islam et al., 2020). The WQI typically signifies the overall quality based on various critical water quality criteria, including pH, EC, TDS, BOD, and COD, among others (Hossain and Hossain, 2021). An estimation of the WQI is important to understand the overall water condition. It serves as an indicator of water pollution (Islam et al., 2020). Hence, evaluating and monitoring the water’s physicochemical parameters and WQI are crucial for accurately representing the overall water quality. The river water quality can be classified as excellent, good, poor, very poor, or unfit for consumption/use based on the WQI values (Ahsan et al., 2023). Polluted water quality parameters have a negative impact on agricultural production, aquaculture, and fish production (Singh et al., 2002). On the other hand, as the river receives a high amount of untreated hazardous chemicals from different sources, it is important to conduct a risk assessment. Even at trace levels, these contaminants have substantial toxicities that could threaten the lives of people who drink or use the water. A non-carcinogenic risk assessment model, recommended by the United Nations Environmental Protection Agency (USEPA), is generally adopted for health risk assessments. (Ning Liu et al., 2012). It is extensively used to assess the chronic risk associated with the use of water for both adults and children. The water quality of the Dhaleshwari River has emerged as a significant concern in light of the accelerated economic growth in Bangladesh (Rafid et al., 2019). The evaluation of water quality is significant for any developmental activities. The chemical composition of water, on the other hand, is influenced by various hydrogeochemical processes occurring within a specific environment. Therefore, periodic measurement and monitoring of water quality parameters are vital for mitigating water pollution and effectively managing water resources (Waeles et al., 2005; USEPA, 1983). In recent years, many scientists have studied the physicochemical parameters of the Dhaleshwari River (Ahsan et al., 2018; Hasan et al., 2020; Hasan et al., 2019). However, the present study aims to evaluate both the physicochemical parameters and the dynamics of FDOM in the Dhaleshwari River, an area that has yet to be explored.
This study aims to assess the water quality of the Dhaleshwari River by analyzing the physicochemical parameters at various locations, including the upstream, Keraniganj BSCIC, and downstream areas. Additionally, the study seeks to characterize the FDOM using EEM-PARAFAC modeling, while evaluating the overall WQI and the non-carcinogenic risk associated with the river.
The study area consists of the Dhaleshwari River, which is considered a distributary of the Jamuna River. The Dhaleshwari River is 160 km long. It originates from the Jamuna near the northwestern tip of Tangail District (Haque, 2018). After that, it is divided into two branches: the first is called Kaliganga River, and the second one retains the name Dhaleshwari (Rabbani, 2013). Water samples were collected from 30 sampling points (10 samples from each region) across three different locations: the upstream, where the Dhaleshwari River originates near the Tangail district; the Keraniganj Bangladesh Small and Cottage Industries Corporation (BSCIC) near Hemayetpur, Savar; and the downstream, where the Dhaleshwari River meets with the Shitalakshya River in Narayanganj district (Haque, 2018). Samples were collected at half-kilometer intervals.
The water samples were collected in January 2021 (Figure 1) following the standard protocol (USEPA, 1999). The water samples were taken at a depth of 0–12 cm and collected in 1.0-L aluminum bottles, which were previously washed with 10% HNO3 acid solution and rinsed with distilled water (Manoj et al., 2012). Three individual samples were collected at each point and combined to create a composite sample, ensuring a more accurate representation of water quality. After collection, the water samples were immediately transported to the laboratory. One-half of the 1-l sample was preserved for the analysis of FDOM, pH, EC, salinity, DO, BOD, and COD; the other half was kept for heavy metal analysis. To minimize bacterial growth, 500 mL water of each sample was transferred to a beaker and digested by adding 5 mL of concentrated HNO3. The samples were filtrated through a Whatman No. 44 (3 μm) filter paper into a 500-ml volumetric flask and diluted to the mark with distilled water. For FDOM analysis, the water samples were filtrated through a 0.7-μm GF/F filter to remove suspended materials that may react with DOM and stored at 4°C for further analysis.
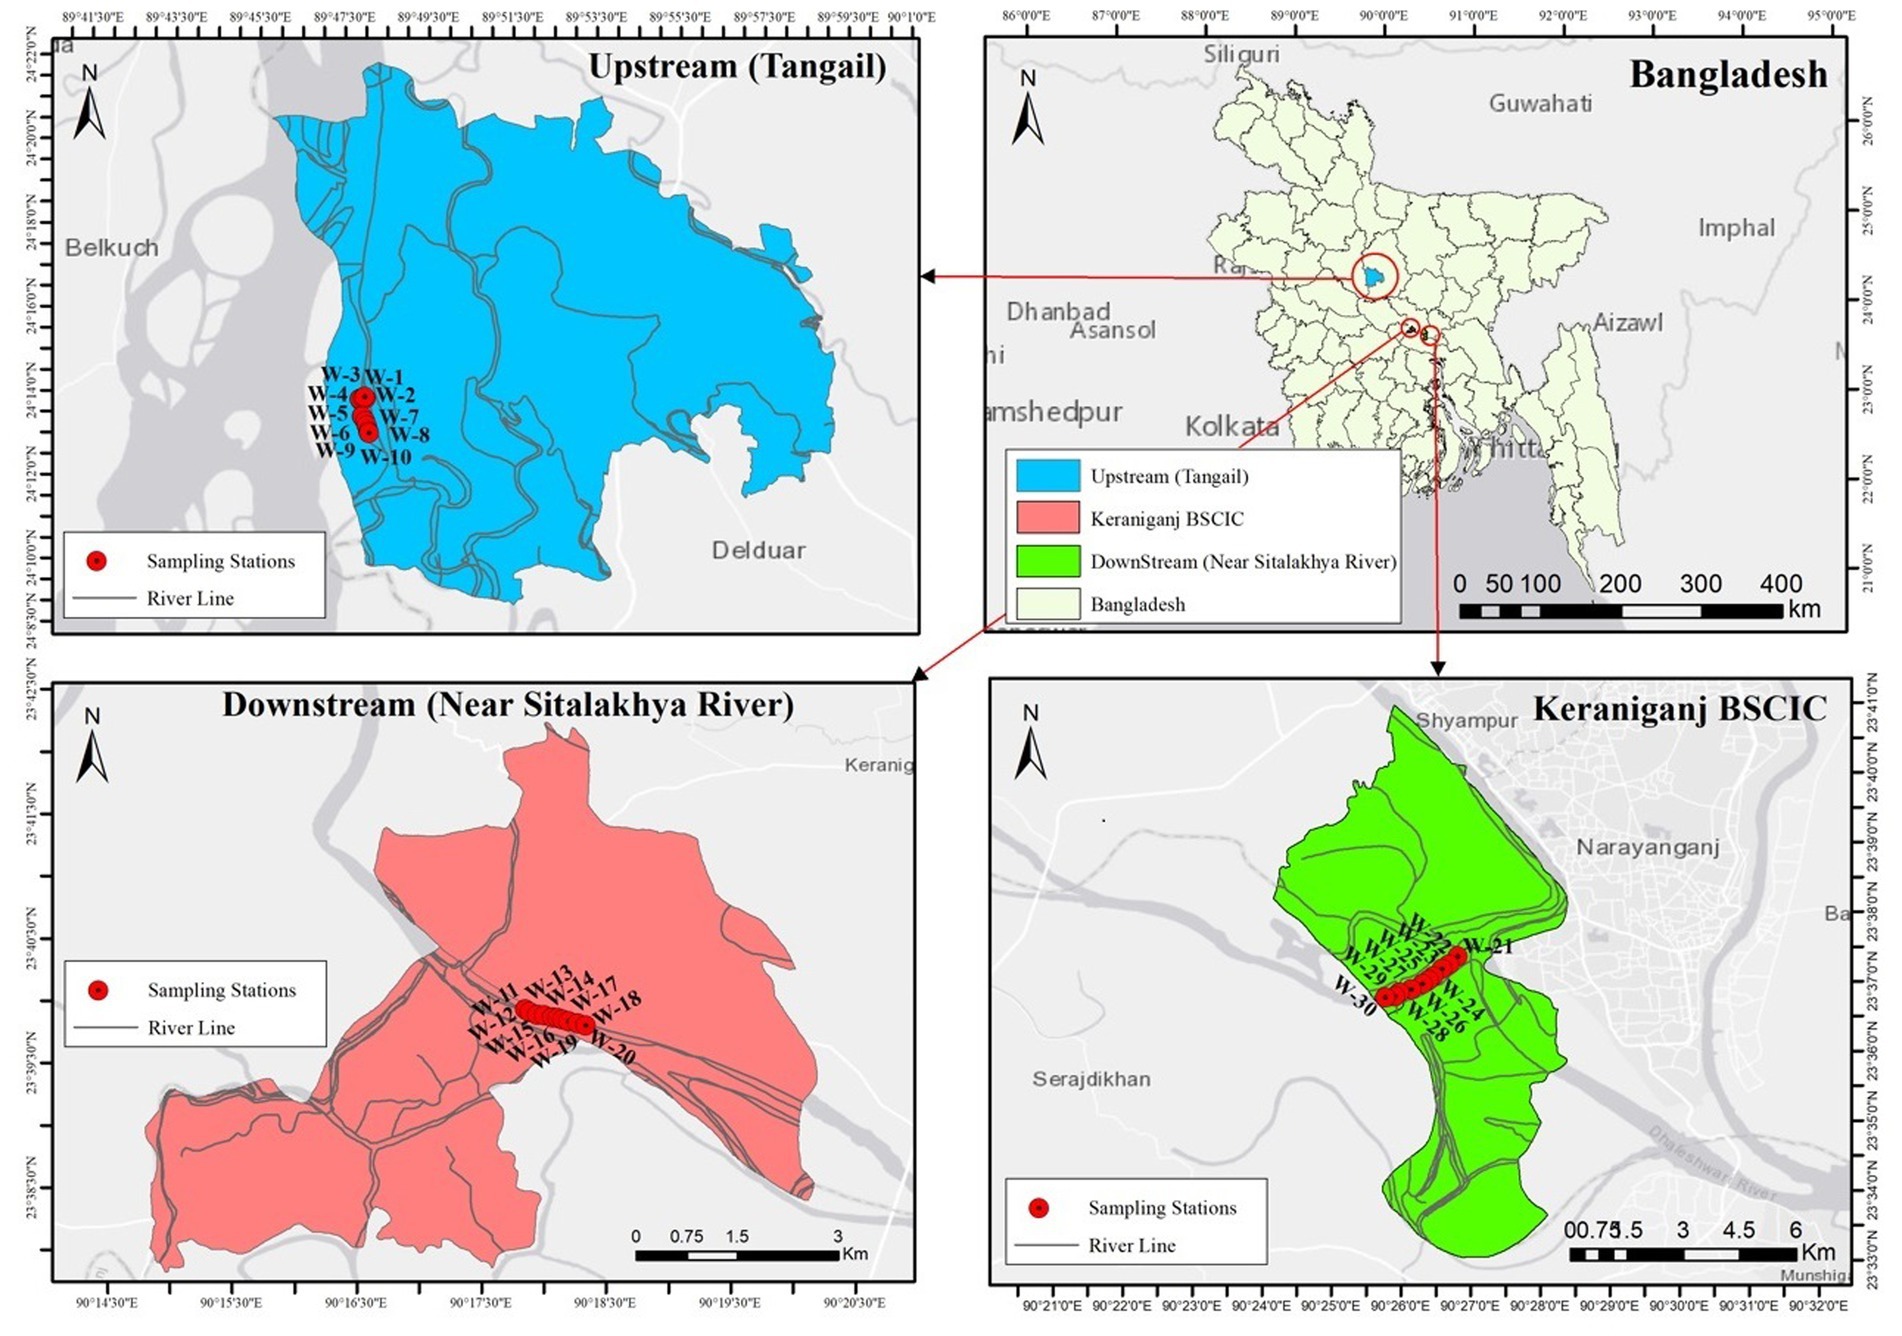
Figure 1. Sampling site of the Dhaleshwari River.
The pH, EC, salinity, DO, and TDS were determined using a multiparameter (Model: Multi 3,510 IDS SET3, Germany), with the probe directly dipped into the sample beaker. For the BOD5 measurement, the water samples were incubated at 20°C in dark bottles to prevent photosynthesis for 5 days. Before and following five days of incubation at 20°C, the samples’ dissolved oxygen (DO) content was assessed, and the BOD values were computed as the difference between the initial and final DO (Ahsan et al., 2018). COD was measured by using the open reflux method (American Public Health Association, American Water Works Association and Water Environment Federation, 1998).
Fluorescence EEM spectra were recorded using a fluorescence spectrophotometer (F-4600, Hitachi, Japan) following measurement procedures reported previously (Rikta et al., 2016). The scanning ranges were 220–400 nm for excitation at intervals of 5 nm and 280–550 nm for emission at intervals of 1 nm using a scanning speed of 1,200 nm min−1 and 700 v. A slit width of 5 nm was used for both excitation and emission, and all EEM spectra were recorded in both excitation and emission corrected modes. Ultrapure water was used as the blank and measured before sample analysis and after every 10 samples (Yang et al., 2020). The fluorescence intensities of all samples were measured in arbitrary units (AU).
EEM-PARAFAC modeling was conducted on preprocessed EEM data, using the N-way Toolbox for MATLAB. Rayleigh and Raman peaks, as well as ultrapure water blank, were subtracted from the measured EEM spectra (Niloy et al., 2022; Stedmon and Bro, 2008). Finally, constraints that are not negative were applied to the PARAFAC model. Furthermore, to avoid the possible production of artifacts by mixing fluorescent components among different water samples, the PARAFAC analysis was performed on selective characteristic samples (Mohinuzzaman et al., 2020). As shown in Figures 2, a four-component model was chosen to describe the EEM features of the upstream and BSCIC samples, while a three-component model was applied to the downstream samples, as indicated by the high explained variance (97–98%). Each model was applied to 10 samples. The detailed procedure for applying PARAFAC modeling to the sample EEM spectra has been reported elsewhere (Zhang et al., 2023).
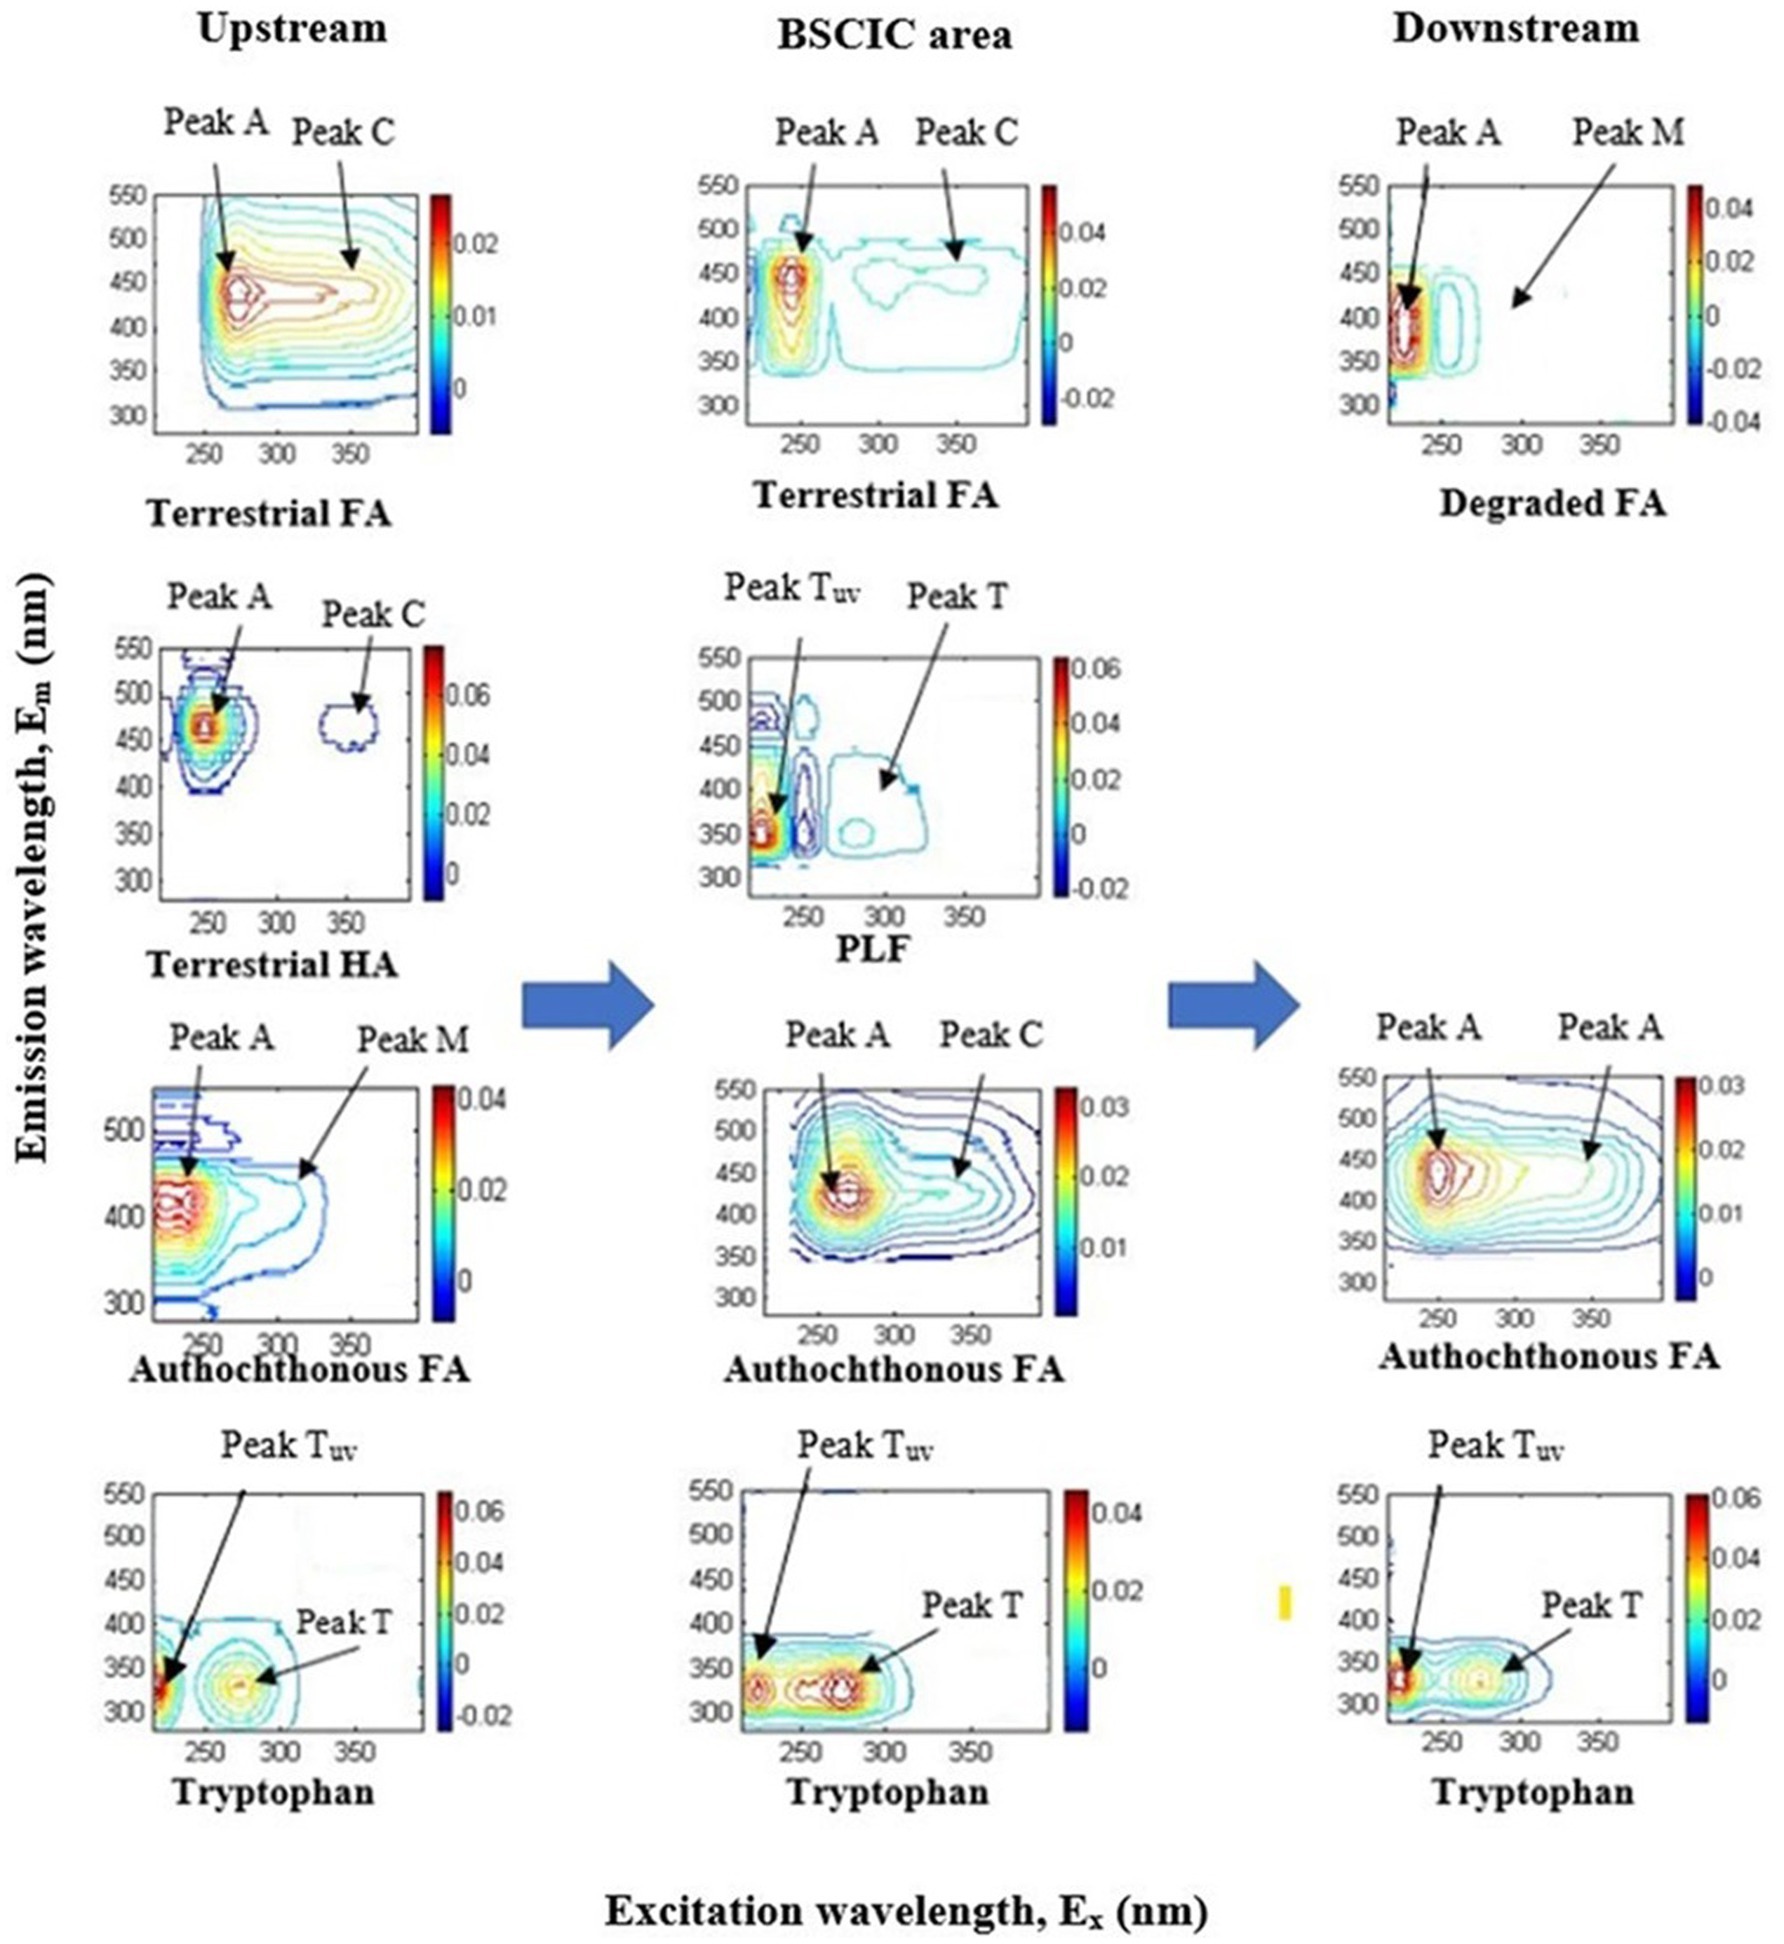
Figure 2. EEM plots of upstream, Keraniganj BSCIC, and downstream of the Dhaleshwari River water samples.
In this research, a wavelength range of 200–700 nm was employed to measure the UV–VIS absorbance of the samples (EMC-61PC-UV–VIS Spectrophotometer, Germany). UV–VIS absorbance spectroscopy is used to determine the light-absorbing (i.e., absorbance from 200 to 700 nm) or chromatographic fraction of DOM (i.e., CDOM) (Fellman et al., 2010; Cory et al., 2011; Waterloo et al., 2006). This method can also provide information on the aromaticity and molecular weight of DOM. However, it is important to note that UV–VIS absorbance cannot determine all properties of the total DOM pool. Nevertheless, the aromaticity of DOC is positively correlated with specific UV absorbance (i.e., SUVA254) (Cory et al., 2011). Subsequently, using the absorbance data, slopes were determined in two specified ranges, namely S275–295 and S350–400, employing a method developed and implemented in Excel (Helms et al., 2008).
The water quality index (WQI) is a simple term that describes the complex influence of various parameters on river water quality. To examine the overall quality, the WQI was calculated based on six parameters: pH, EC, DO, TDS, BOD, and COD (Mohanta and Patra, 2000; Padmanabha and Belagali, 2005).
The water quality index (WQI) was calculated using equations (1)–(3), based on the water quality index method developed by Tiwari and Mishra (1985) (Table 1).
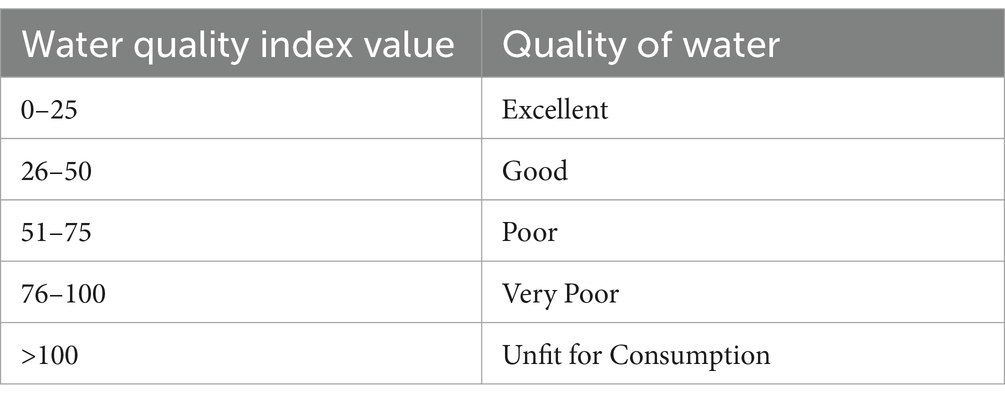
Table 1. Water quality index method developed by Tiwari and Mishra (1985).
Specifically,
Where, Va = actual value present in the water sample; Vi = ideal value (0 for all parameters except pH and DO, which are 7.0 and 14.6 mg/1, respectively); and Vs = standard value.
If quality rating Qi = 0, it means there is the absence of pollutants, while 0 < Qi < 100 indicates that the pollutants are prescribed standard. When Qi > 100, it indicates that the pollutants are above the standards.
Where K (constant) = 1/(1/VW1 + 1/VW2 + 1/VW3 + 1/VW4 +... + 1/VWn), Sn = ‘n’ number of standard values, Vw1 = value of respective parameter at sampling station S1, and so on. In this study, as standard value (Vs), we have followed the ECR 2023 standard to calculate various parameters. Where pH = 6.5–8.5, EC = 2,250, DO = >1, TDS = 1,000, BOD =12, and COD = 100.
To measure the concentration of heavy metals (Pb, Cd, Zn, and Cr) in water samples, the standard metal solution of different concentrations for each element was prepared to calibrate the instrument (Manoj et al., 2012). Reference standard heavy metals, such as cadmium (Cd), lead (Pb), chromium (Cr), and zinc (Zn), were obtained from Inorganic Ventures, USA. A reagent blank was prepared to avoid reagent contamination. A flame atomic absorption spectroscopy (AAS) (Model: AA-7000, Shimadzu Corporation, Japan) was used in this study. A deuterium-arc lamp was used for background correction. An aliquot of the digested sample was injected into the air acetylene flame for the detection of Pb, Cd, Zn, and Cr using a Shimadzu autosampler ASC-7000. The instrument setting and operational conditions were based on the manufacturers’ specifications.
A hazard quotient (HQ) (Equation 4) is the ratio of the potential exposure to a substance and the level at which no adverse effects are expected (US EPA, 2005).
where the exposure concentration is in milligrams per liter (mg/L) or parts per million (ppm), and the reference concentration (RfC) is an estimate of continuous inhalation exposure to the human population (including sensitive subgroups) that is likely to be without an appreciable risk of deleterious effects over a lifetime. Its unit is also mg/L or ppm.
The hazard index (HI) is the sum of more than one hazard quotient for multiple substances, multiple exposure pathways, or both. The hazard index is calculated separately for chronic, sub-chronic, and shorter-duration exposures. In this study, we calculated the hazard index by following the procedures outlined in US EPA (2005) (equation (5).
where hazard quotienti = hazard quotient for species i.
Different statistical analyses were conducted using MATLAB version 7.0 (MathWorks, USA) Microsoft Office Excel 2016, FL-solution for f-4600 software, R-Studio, and UV Spectra software (EMC-61PC-UV Spectrophotometer). Arc GIS (Arc Map 10.8) was used to locate the spatial distribution of sampling points.
The physical, chemical, and biological properties of river waters dictate the overall quality. Water quality parameters of the Dhaleshwari River are presented in Table 2.
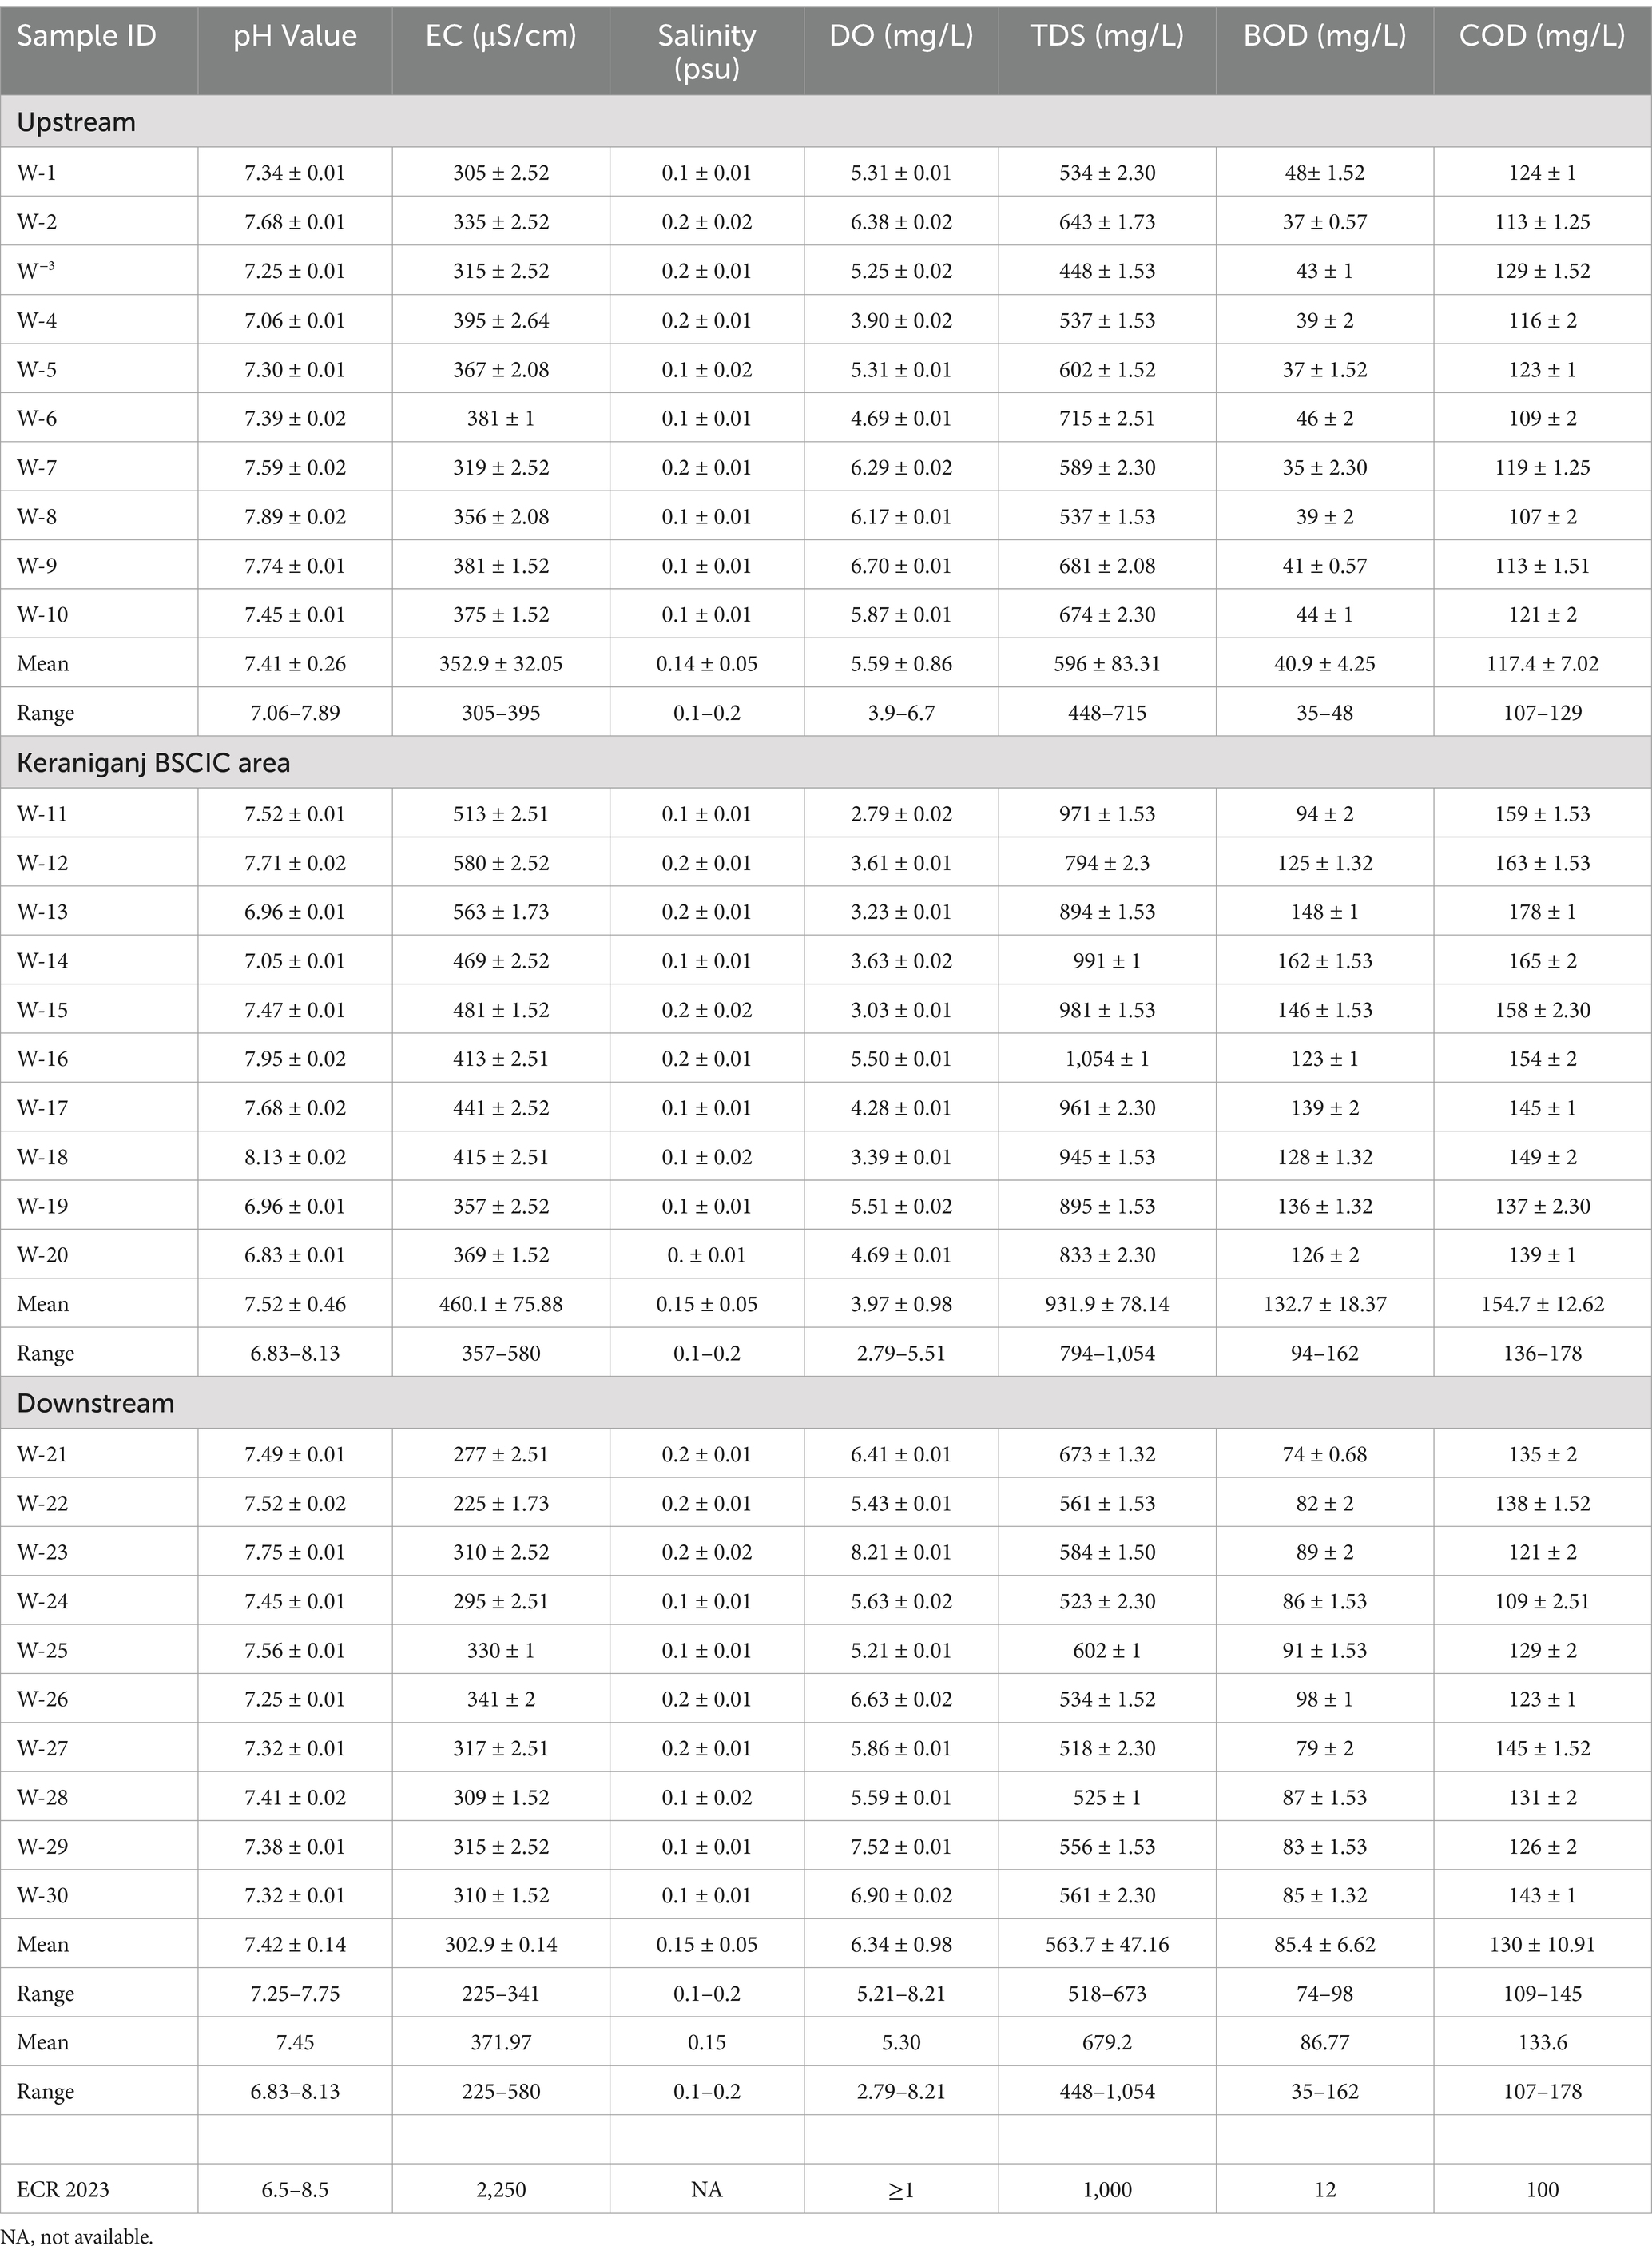
Table 2. Physicochemical parameters of the Dhaleshwari River water.
Table 2 shows that the mean value of pH in the Dhaleshwari River, from upstream to downstream, was 7.45, which was within the permissible limit of the surface water quality standards (ECR, 2023). Rikta et al. (2016) also found that the average pH value of the Dhaleshwari River was 7.64. The average pH value in the upstream of Dhaleshwari River indicated the water was slightly alkaline and very useful for freshwater fishes and organisms. In the Keraniganj BSCIC area, the mean pH value was increased, but in the downstream, the mean value was decreased (near upstream values). The release of industrial effluent could cause an increase in pH. Generally, variations from upstream to downstream may occur due to the dumping of untreated industrial wastewater into the water body, as well as the inflow of different types of effluents from surrounding industries (Hasan et al., 2020). We observed some acidic pH values only in the Keraniganj BSCIC area. This slightly acidic to slightly alkaline pH is probably related to the carbonate nature of the river water (Barakat et al., 2012). The EC values found in the Dhaleshwari River were within the permissible limit of surface water quality standards (ECR, 2023) and differed significantly (p ≤ 0.05) from the upstream to downstream. The electrical conductivity of water varies directly with the temperature and is proportional to its dissolved mineral matter content (Waghmare et al., 2012).
Table 2 also indicates that DO values were significantly (p ≤ 0.05) lower in the Keraniganj BSCIC area and higher in the downstream than the upstream areas. The average DO value was 5.30 mg/L, which was quite similar to the findings by Rikta et al. (2016), and all values are within the permissible limit of the ECR (2023). The average TDS value in the Dhaleshwari River water was 697.2 mg/L. The Dhaleshwari River TDS values were below the ECR 2023 standard of Bangladesh. Rikta et al. (2016) also found that the average TDS value was 982.5 mg/L. The BOD values of the Dhaleshwari River water exceeded the surface water quality standards (ECR, 2023) due to discharges from nearby industries, hanging latrines along the river banks, and runoff from animal manure into the water body. Table 2 shows that the overall COD values of the Dhaleshwari River at different sampling sites showed significant (p ≤ 0.05) variation. In the upstream of the Dhaleshwari River, the COD value ranged from 107 to 129 mg/L, with an average COD value of 117.4 mg/L. In the Keraniganj BSCIC area, the COD value ranged from 136 to 178 mg/L, with an average value of 154.7 mg/L. In the downstream, the value ranged from 109 to 145 mg/L, with an average of 130 mg/L. The high COD values indicate the toxic condition and the presence of biologically resistant oxygen-demanding chemicals due to discharge of the industrial effluents and noxious substances. In the Keraniganj BSCIC area, we noted increased pH, EC, TDS, BOD, and COD and a corresponding decrease in the DO levels in the river water, attributed to the discharge of effluents from different industries (Ali et al., 2024). As shown in Supplementary Table S1, the mean concentration of Pb, Zn, and Cr is high in the Keraniganj BSCIC area in comparison with other areas and all were within the permissible limits of the ECR 2023. In the case of Cd, it was observed that the mean concentration was higher upstream, and no values exceeded the limits set by the ECR 2023 for surface water.
We characterized the DOM samples using some optical measurements. The absorption coefficient, spectral slope S350–400 and S275–295, and slope ratio (SR) were calculated for UV–VIS absorbance. The spectral slope (S) and SR obtained for the filtered samples showed inconsistent trends from upstream to downstream. The upstream samples had lower S275–295 values and SR values (Table 3) than the BSCIC and the downstream samples. In contrast, the downstream samples of the Dhaleshwari River showed consistently higher S275–295 and SR values, along with a decrease in UV absorption. Based on the conducted analysis, the S275–295 values in the upstream region of the Dhaleshwari River ranged from a minimum of 0.0123 to a maximum of 0.0477. In contrast, the S350–400 values ranged from a minimum of 0.0008 to a maximum of 0.0066.
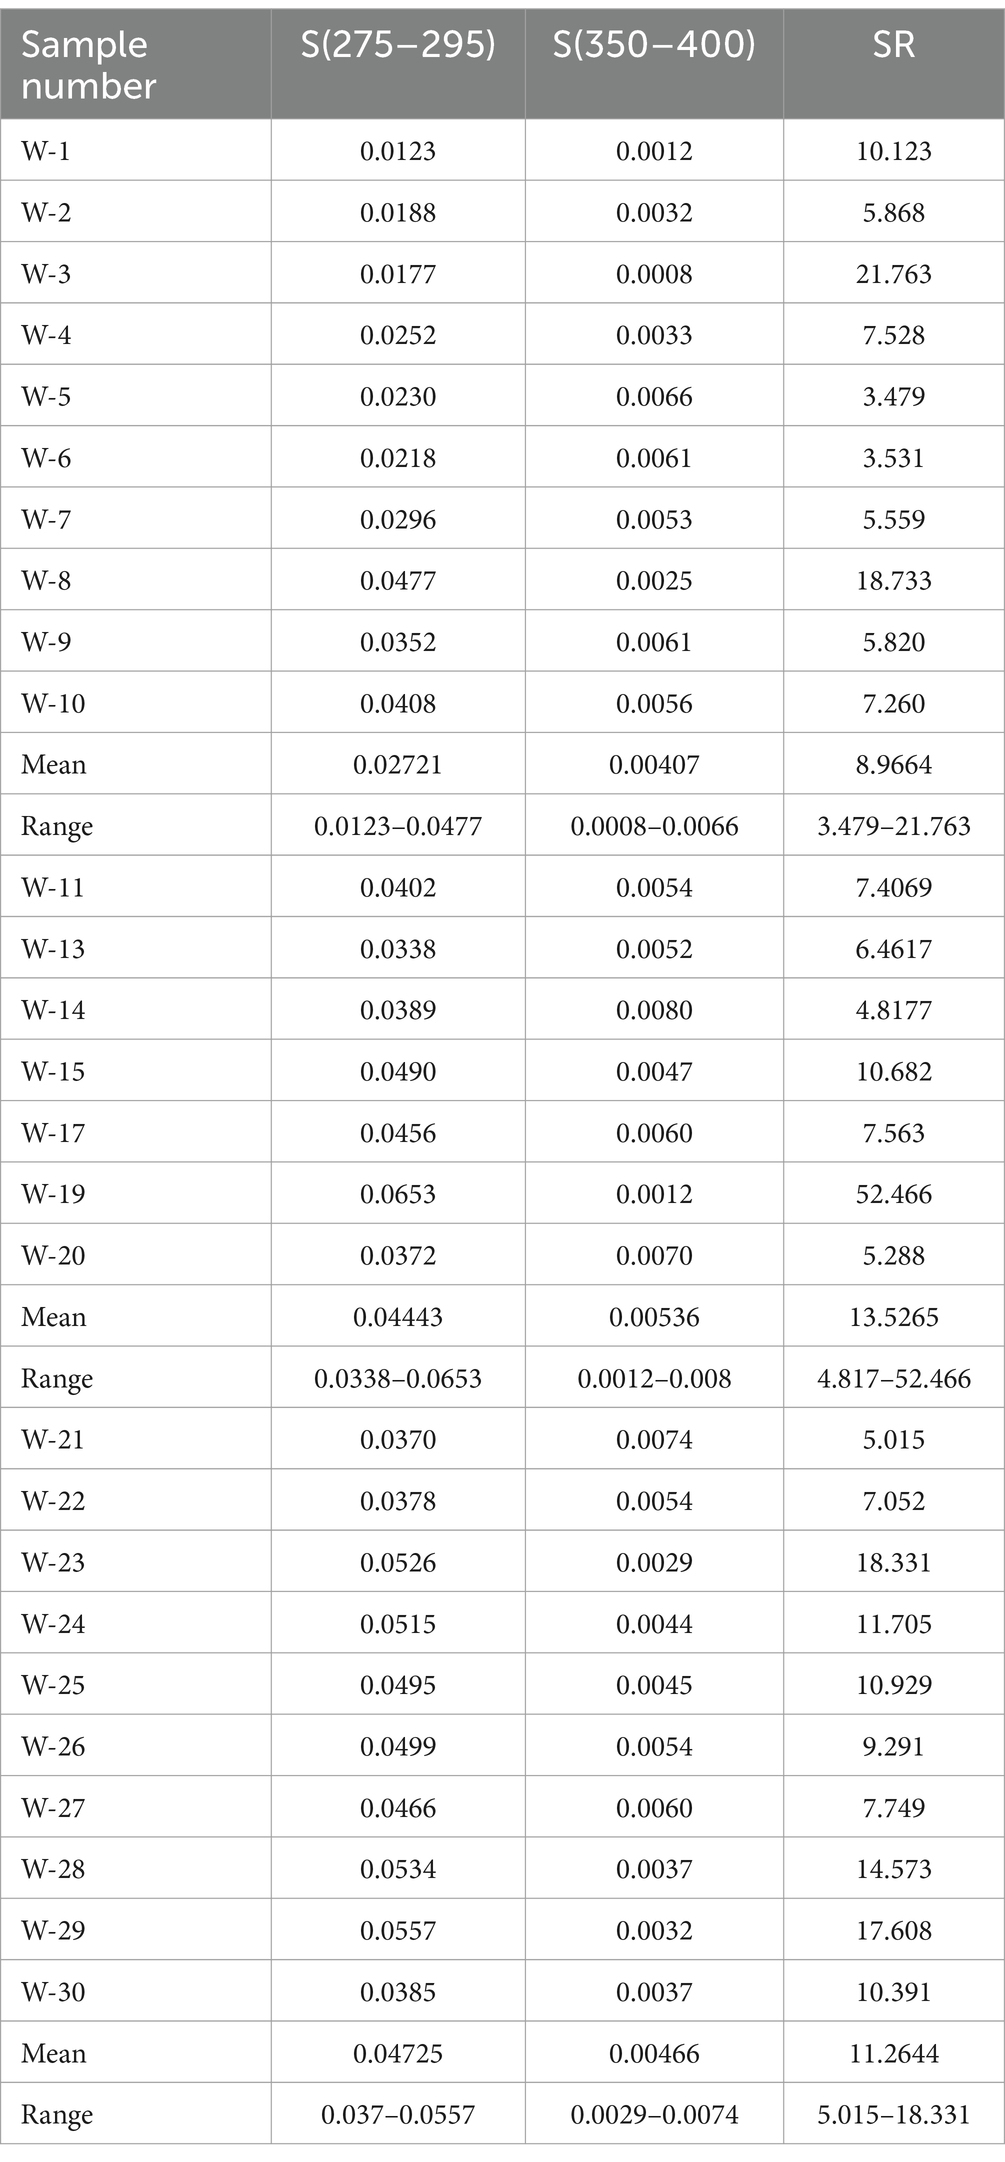
Table 3. Analyzed data on UV–VIS absorbance.
In the Keraniganj BSCIC area, the lowest value of S275–295 was 0.0338, and the highest was 0.063. Conversely, the lowest value of S350–400 was 0.0012, and the highest was 0.008. In the downstream section of the river, the S275–295 values ranged from 0.037 to 0.0557, while the S350–400 values ranged from 0.0029 to 0.0074 (Table 3). From the average values of spectral slopes S275–295, it can be observed that the values increase with distance (Supplementary Figure S1). The average values of S275–295 and S350–400 showed the following order: 0.04725 (downstream) > 0.04428 (Keraniganj BSCIC area) > 0.02721 (upstream) and 0.00536 (Keraniganj BSCIC area) > 0.00466 (downstream) > 0.00407 (upstream). These results provide evidence that shifts in the SR and S275–295 are related to photochemical or microbial degradation of the DOM with distance and time (Helms et al., 2008). The low values of absorbance slope may be attributed to the geological formation of the sampling area. Additionally, the slope heights indicate relatively high degradation of FDOM substances.
Fluorescence three-dimensional excitation-emission matrices equipped with parallel factor analysis (EEM-PARAFAC) identified several components (Figure 2). In the upstream water samples of the Dhaleshwari River, protein-like substances, which are mainly tryptophan, were found at Ex/Em = 250–300/300–350 nm. Autochthonous fulvic acid-like substances were found at Ex/Em = 250–300/300–400 nm (Yamashita et al., 2008). Terrestrial fulvic acid and terrestrial humic-like substances were detected at Ex/Em = 300–350/350–560 nm (Mostofa et al., 2019) and Ex/Em = 250–350/400–500 nm (Mostofa et al., 2019), respectively, which indicates the presence of organic substances. In the upstream, the source of FDOM is the runoff from adjacent area soil (Lee and Kim, 2018; Wang et al., 2022) and microbes (Mostofa et al., 2013) present in that water. In the upstream, the pollution level was very low, so the DOM substances were not significantly degraded. Terrestrial humic acid was only observed upstream, totally absent in the Keraniganj BSCIC and downstream samples. This suggests that the upstream area contains non-degraded humic substances from terrestrial sources in the catchment areas.
In the BSCIC area sample, terrestrial fulvic acid-like substances were found at Ex/Em = 250–350/300–450 nm (Yamashita et al., 2008). In the Figure 2, we see that fulvic acids are degraded. It may be due to the absorbance of DOM substances by microbes and photosynthesis. Autochthonous fulvic acid-like substances were detected at Ex/Em = 250–350/300–450 nm. Protein-like fluorophores and tryptophan-like substances were detected at Ex/Em = 250–350/300–450 nm (Shammi et al., 2017) and Ex/Em = 250–300/300–360 nm, respectively (Fu et al., 2010). It may be due to river water flow long distances, and FDOM substances were degraded due to the sunlight, consumption by the microbes, and photosynthesis. The degradation of humic substances caused by exposure to natural sunlight is known as ‘blue-shift’. In this area, the huge industrial discharge altered the pH and salinity of the water, leading to the deposition and degradation of terrestrial humic acid. As a result, humic acid was absent here (Mostofa et al., 2013).
Autochthonous fulvic acid-like substances were detected downstream at Ex/Em = 250–350/300–480 nm. Protein substances such as tryptophan were detected at Ex/Em = 250–300/300–360 nm (Mostofa et al., 2010). Degraded fulvic acids-like substances were detected at Ex/Em = 250–350/300–450 nm. Downstream, terrestrial humic acid-like substances were fully degraded. FDOM components can undergo photoinduced decomposition by natural sunlight in surface waters or laboratory conditions (Mostofa et al., 2013). FDOM components are also decomposed microbiologically in deep natural waters. The Dhaleshwari River protein-like substances were detected by Rikta et al. (2016) at Ex/Em = 250–260/290–390 nm. Humic and fulvic-like substances were detected at Ex/Em = 320–480/360–560 nm and Ex/Em =320–450/360–490 nm, respectively. Only three fluorescent components were prevalent in the downstream samples, where terrestrial humic acid and fulvic acid were absent. In this region, the fulvic acid peak A shifted to a lower wavelength, and peak M decreased to very low intensities.
In Figure 3, we can see that the upstream terrestrial fulvic acid—peak C, autochthonous fulvic acid—peak M, terrestrial humic acid—peak C, and tryptophan—peak T were the highest in DSW-U-8. In the Keraniganj BSCIC area, terrestrial fulvic acid—peak C, autochthonous fulvic acid—peak C, protein-like fluorophores—peak T, and tryptophan—peak T were the highest in DSW-M-13. In the downstream autochthonous fulvic acid—peak C, degraded fulvic acid—peak M, and tryptophan—peak T were the highest in DSW-D-24. Dissolved organic matter (DOM) contents were identified using the relative fluorescence intensity of DOM (Rikta et al., 2016).
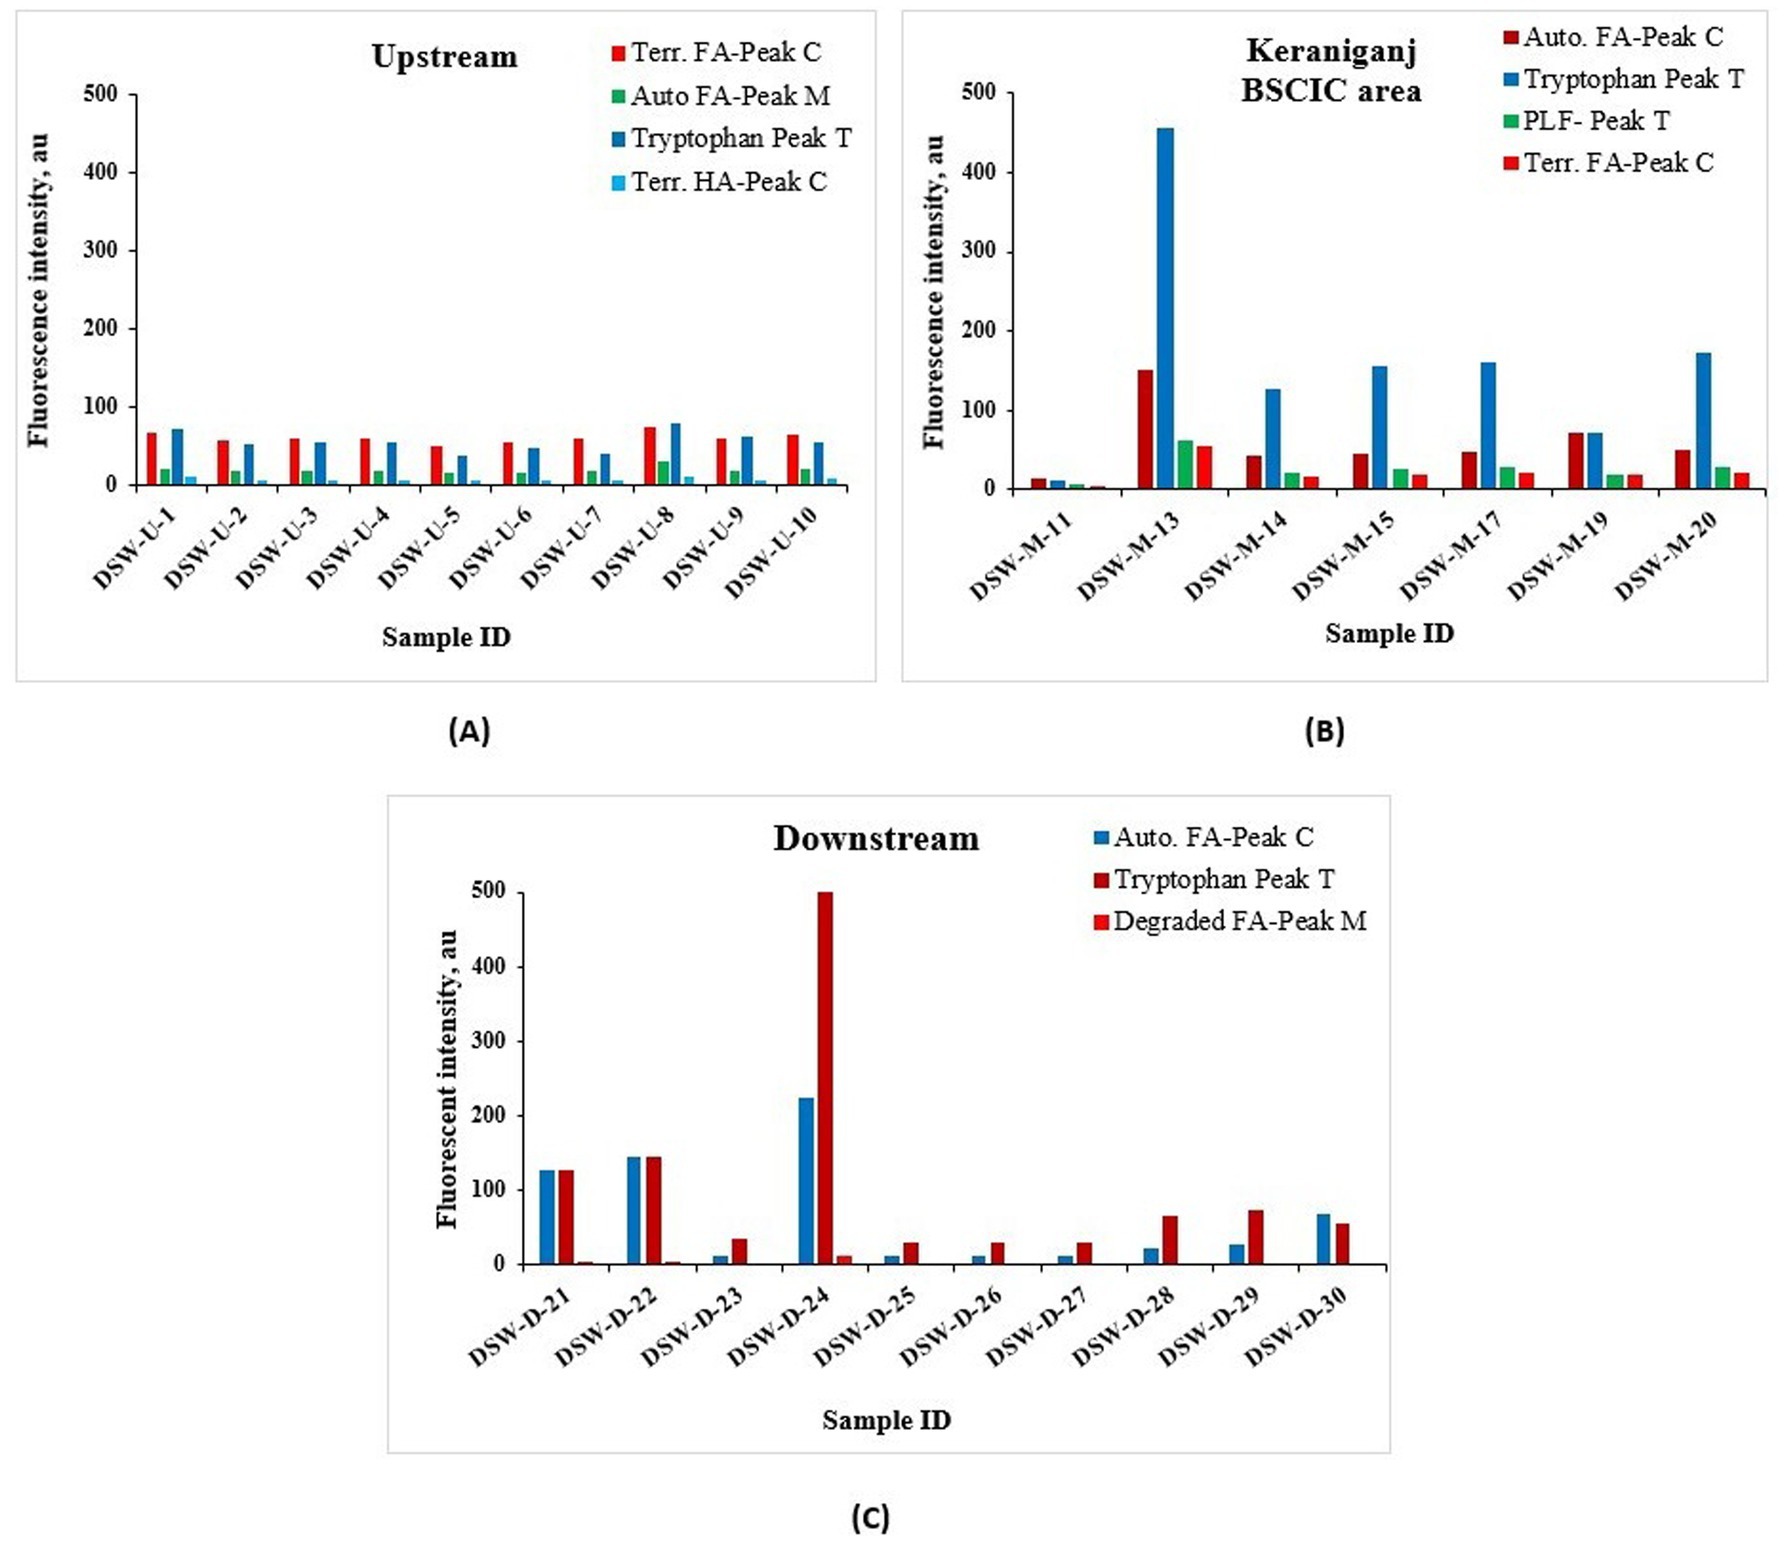
Figure 3. Graphical presentation of fluorescence intensity (FI) of identified components in (A) upstream, (B) BSCIC area (Keraniganj), and (C) downstream of the Dhaleshwari River. Here, the sample ID is given as DSW.
The water quality index of the present study was established from various important physicochemical parameters, mainly pH, EC, DO, TDS, BOD, and COD, at three different points (upstream, the Keraniganj BSCIC area, and downstream). The values of various physicochemical parameters used for calculating the water quality index are presented in Table 1. From that table, we can observe that the water quality deteriorated from upstream to downstream. The same trend was also observed from the results of the WQI calculation. This can be attributed to the presence of a large amount of industries in the Keraniganj BSCIC area. The values of BOD and COD may play an important role in deteriorating the WQI, as we observed that these parameters exceeded the ECR 2023 standards at all points, with significant variation (p ≤ 0.05) from upstream to downstream. In contrast, TDS values in all water samples met the criteria of ECR 2023 except for sample W-13, and also showed significant variation (p ≤ 0.05) from upstream to downstream.
The calculated WQI values for most of the upstream sampling sites of the Dhaleshwari River ranged from 70 to 100. The WQI value at sampling site W-7 was categorized as poor, while the remaining sites had WQI values categorized as very poor (Figure 4). For the industrial area (Keraniganj BSCIC), the calculated WQI values for all the sampling sites exceeded 100 (WQI > 100), indicating that the water quality at these sites was unfit for use (Figure 5).
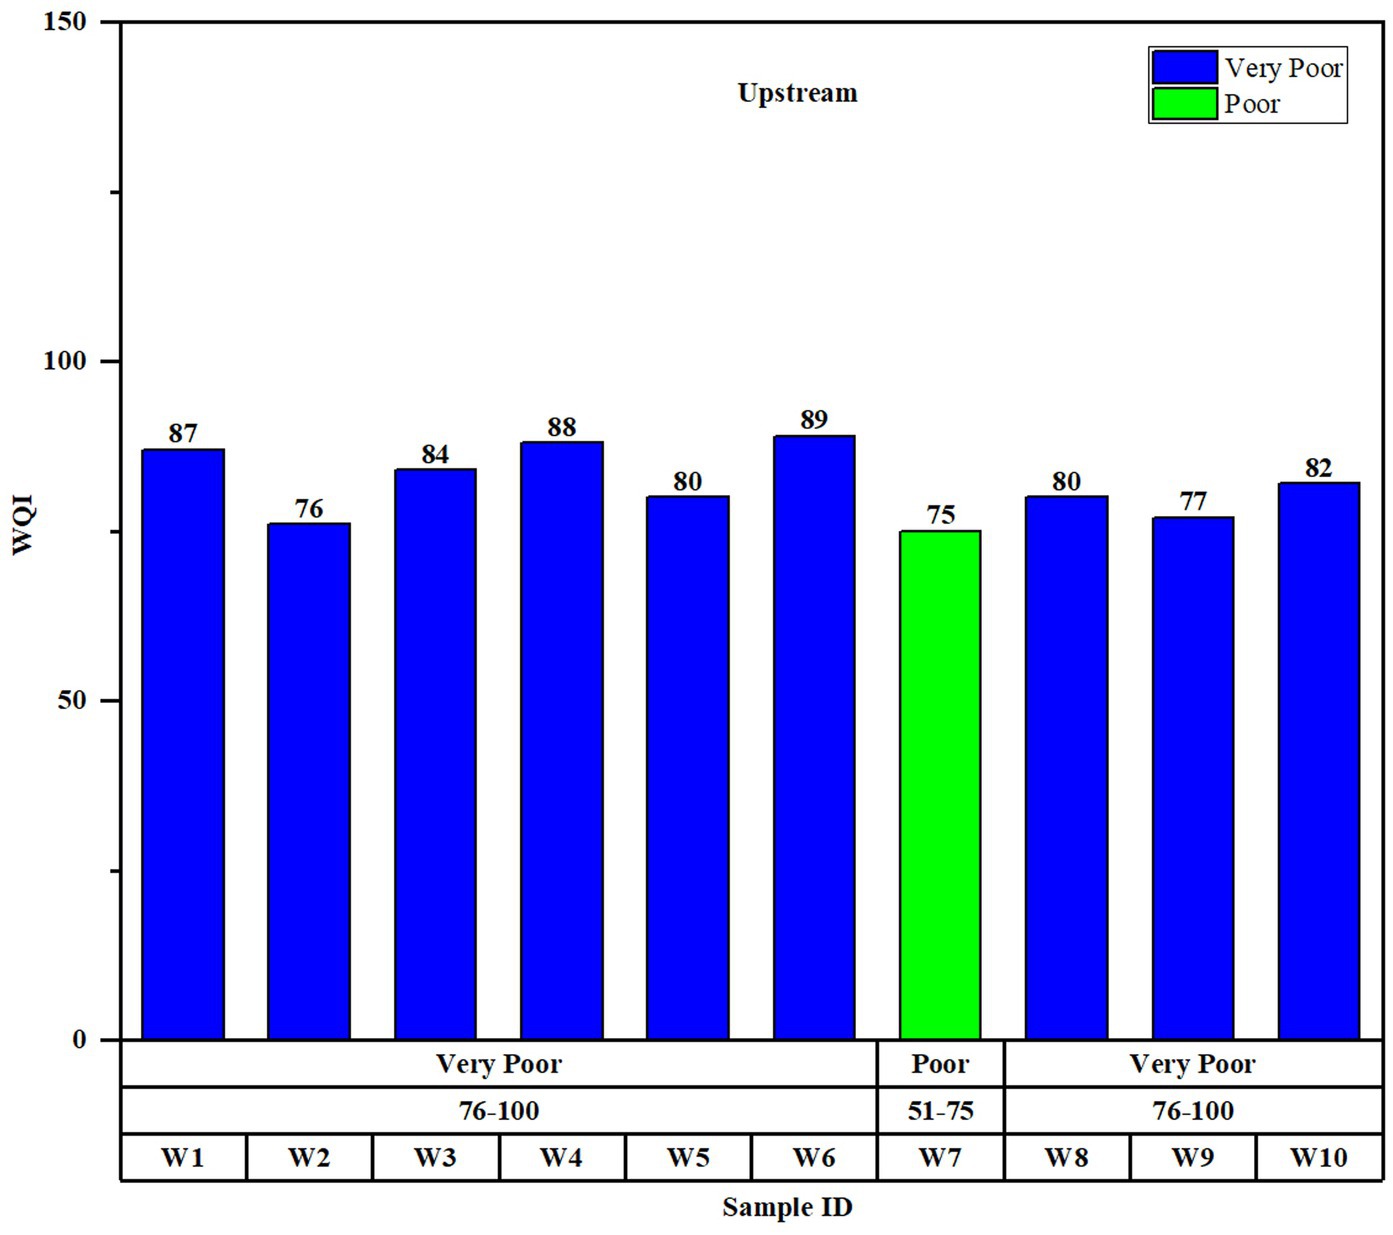
Figure 4. WQI of the Dhaleshwari River water (Upstream).
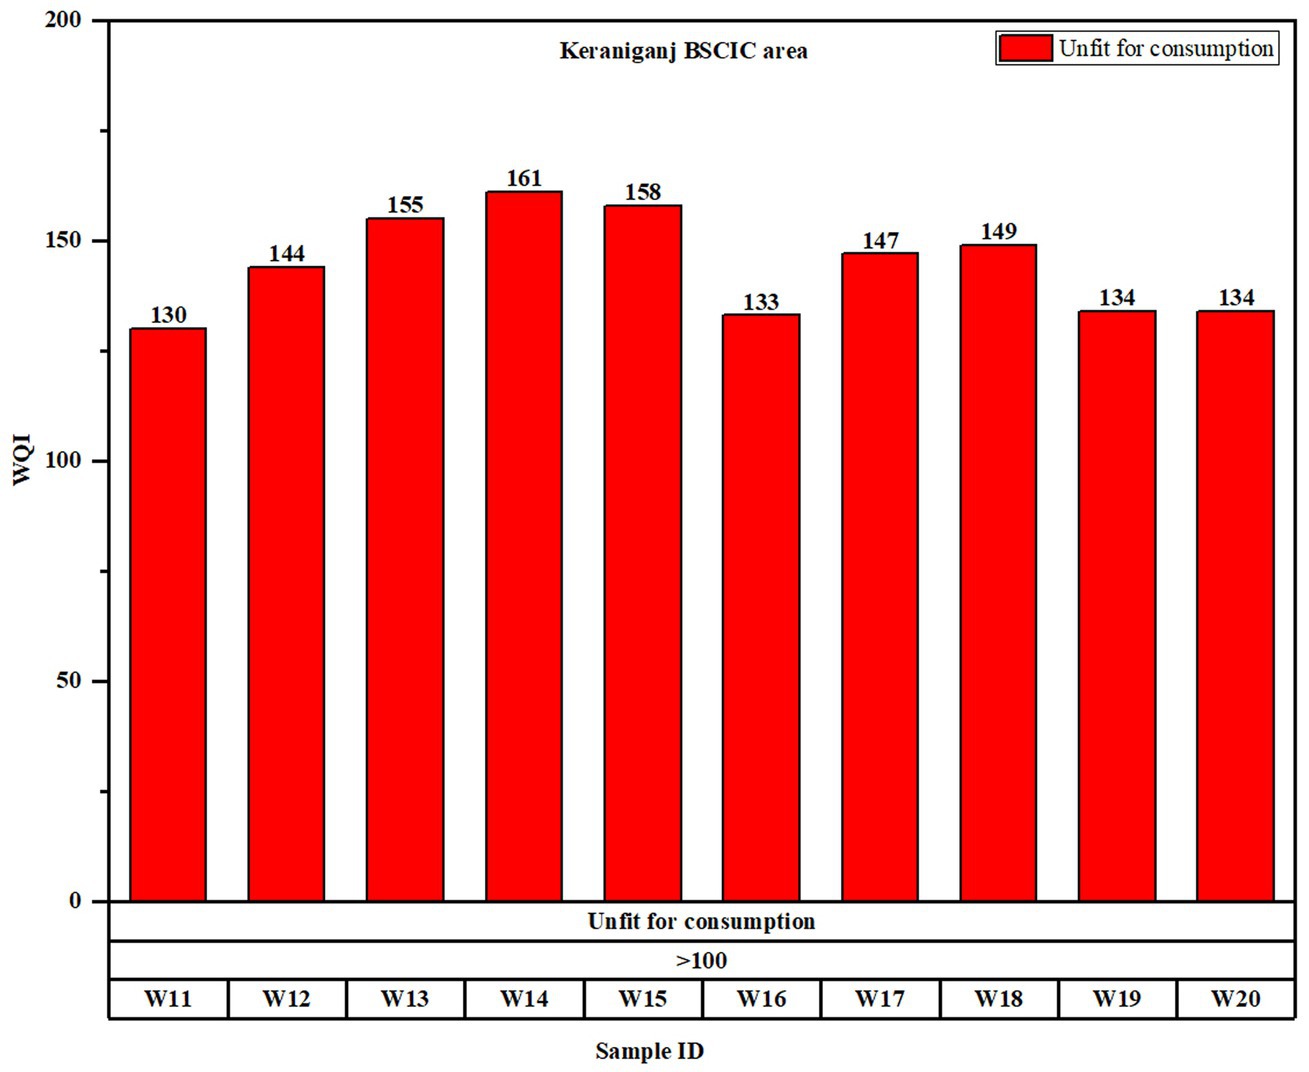
Figure 5. WQI of the Dhaleshwari River water (Keraniganj BSCIC area).
In the downstream section of the Dhaleshwari River, the WQI values ranged from 90 to 110. The WQI values at sampling sites W-21, W-22, W-23, W-29, and W-30 were categorized as very poor, while the remaining sampling sites had WQI values categorized as unfit for use (Figure 6). All the sites were classified using the WQI classification method of Tiwari and Mishra (1985).
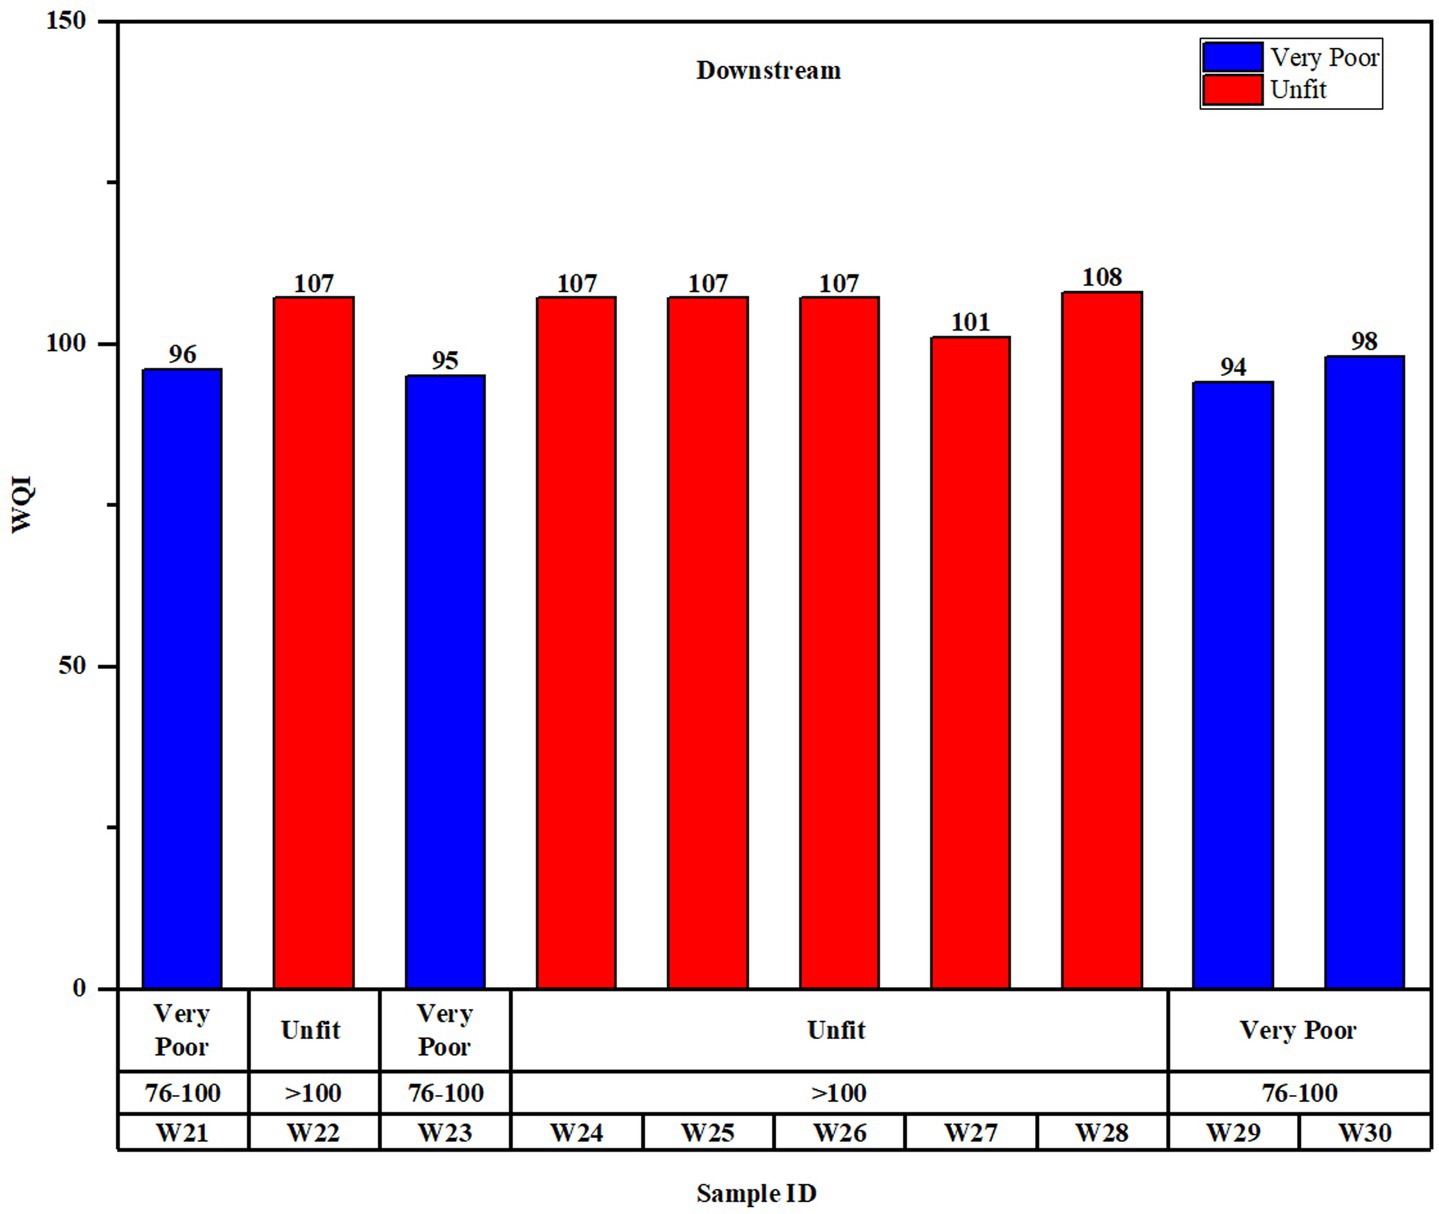
Figure 6. WQI of the Dhaleshwari River water (Downstream).
This study has already demonstrated, through previous discussions on water quality, that the Dhaleshwari River is heavily polluted. To evaluate the related impact of water pollution on human health, the hazard quotient (HQ) is considered an important tool to calculate the possible non-carcinogenic health risks by establishing a related hazard index (HI). The health risk from potentially harmful substances in the same environment is cumulative (Onoyima and Ibraheem, 2021). If the hazard quotient (HQ) is less than 1, it is believed that people will not experience any adverse health effects. However, non-carcinogenic health effects may manifest if the HQ is greater than or equal to 1 (El Morabet et al., 2022).
For adults, the lowest HQ values for Pb, Cd, Cr, and Zn were 0.2592, 0.0035, 0.0297, and 1.2E-05, respectively, and the highest values were 0.8633, 0.0678, 1.1297, and 0.0029, respectively. The HQ values for Pb, Cd, and Zn were less than 1 at all sampling sites, suggesting that these elements pose a low individual risk. In this study, for adults across all sampling sites, the HQ values for Pb, Cd, and Zn were found to be less than 1, indicating that these elements pose a low degree of hazard. The HQ values of Cr, except for four points (W-13, W-14, W-15, and W-24), also indicated a low risk. The HI ranged from 0.4972 to 1.9423, with a mean value of 1.0948 for adults. According to the USEPA, 2015, 16.66% of the samples showed high chronic risk, 33.33% showed medium chronic risk, and 50% showed low chronic risk for adults (Supplementary Figure S2).
For children, the lowest HQ values for Pb, Cd, Cr, and Zn were 0.8164, 0.0112, and 0.0937, respectively, and the highest values were 2.7192, 0.2137, 3.5587, and 0.0091, respectively. Cr, Cd, and Pb exhibited an HQ > 1, suggesting potential risks, whereas Zn remained below the threshold, indicating no significant concern. In the case of children, the HI values ranged from 1.5664 to 6.1184, with a mean value of 3.4487. Based on the HI values, we can say that all sampling points showed a high chronic risk for children (Supplementary Figure S2) (USEPA, 2015).
We observed the highest average HQ values for Pb and the lowest for Zn regarding both age groups and oral ingestion routes. The HQ values across the study sites were found in the following descending order: Pb > Cr > Cd > Zn for both age groups. The excessive concentration of lead in the water may consistently increase the mean HQ value and is mainly attributed to limited anthropogenic activities. Accurate health impact prediction in terms of HI is challenging. However, the strength of the risk contributed by each component of the mixture can be represented through the HI value. If the HI exceeds unity (HI > 1), the risk is equivalent to a single exposure exceeding its permissible level by the same proportion (EPA, 1989). Table 4 presents the calculated average HI values for the Dhaleshwari River water across different age groups (Individual HI values for both age groups are provided in Supplementary Table S4, S5).
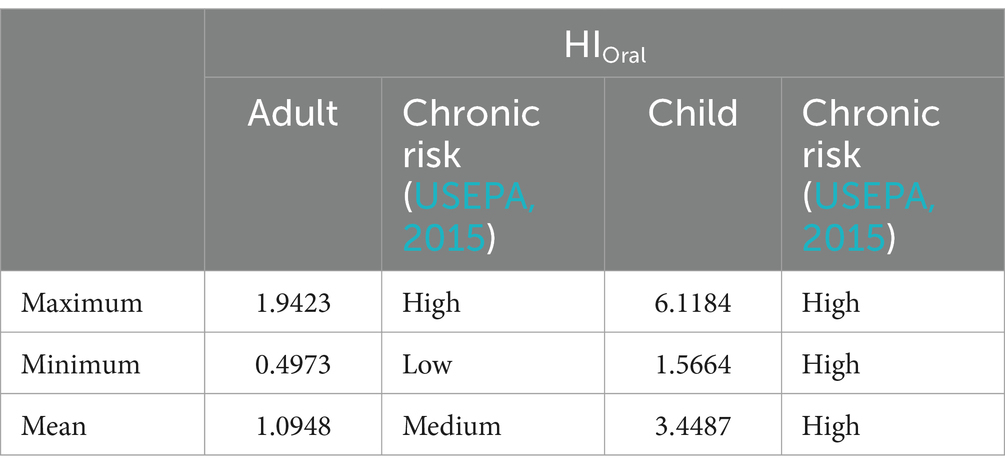
Table 4. Hazard index (HI) value from measured trace metals for evaluating the non-carcinogenic risk of collected water samples of the Dhaleshwari River.
Monitoring the quality of river water is crucial in countries such as Bangladesh, where rivers are being degraded with extreme ecological consequences. Physicochemical analyses analysis indicated that the water quality was polluted; however, the actual scenario could be different, as the samples were collected during the rainy season. In this study, we observed that the majority of the water samples collected from upstream to downstream showed a slightly alkaline pH; however, a few samples of the Keraniganj BSCIC area exhibited acidic pH, which may occur due to the release of industrial effluents. In addition, we observed that the pH, EC, TDS, and DO values were within the permissible limit set by the ECR 2023 standard, but in the case of COD and BOD values, all the sampling points exceeded the ECR 2023 standard. According to the WQI values, the river water, mainly from the Keraniganj BSCIC area, was found to be extremely polluted due to industrial effluent discharge, sewage waste, agricultural and municipal runoff, and anthropogenic activities. Even in the downstream areas, 60% of the sampling points were deemed unfit for use, while 40% were classified as very poor, as wastewater flowed from upstream to downstream. PARAFAC analysis revealed that FDOM substances are most abundant in the upstream region. In the upstream region, we found terrestrial HA-like, terrestrial FA-like, autochthonous FA-like and tryptophan-like substances. However, in the Keraniganj BSCIC area, the FDOM substances were degraded due to factors such as sunlight, photosynthesis, microbiological degradation, and the flow of the river water. In the downstream, the FDOM substances were nearly fully degraded, with only degraded FA-like, autochthonous FA-like, and tryptophan-like substances remaining. The value of the hazard index revealed that all the samples can pose a significant level of chronic risk to children but lower risk to adults (50%) through oral exposure. We observed that the pollution levels of the Dhaleshwari River increased from upstream to downstream. Therefore, mitigation processes such as regular water quality monitoring, raising public awareness, and enforcing strict regulations for the river’s water use and maintenance are essential to prevent further deterioration of water quality.
The original contributions presented in the study are included in the article/Supplementary material, further inquiries can be directed to the corresponding author.
MM: Conceptualization, Formal analysis, Methodology, Writing – original draft, Funding acquisition, Supervision. JM: Data curation, Formal analysis, Validation, Writing – review & editing. MK: Formal analysis, Validation, Writing – review & editing. MC: Investigation, Resources, Writing – review & editing. MN: Investigation, Resources, Writing – review & editing. KM: Formal analysis, Writing – review & editing. NN: Resources, Software, Writing – review & editing. MS: Resources, Software, Writing – review & editing. ST: Resources, Software, Writing – review & editing.
The author(s) declare that financial support was received for the research, authorship, and/or publication of this article. This research was supported by the Research Cell, Noakhali Science and Technology University, Project No. NSTU/RC-ESDM/T-21/57, 2020–21.
The authors acknowledge the assistance provided by Abdullah Al Mamun, Tanvir, and laboratory staff of ESDM, NSTU, and Agrochemicals and Environmental Research Division, Institute of Food and Radiation Biology, Bangladesh Atomic Energy Commission, AERE, Savar, Dhaka.
The authors declare that the research was conducted in the absence of any commercial or financial relationships that could be construed as a potential conflict of interest.
The authors declare that no Generative AI was used in the creation of this manuscript.
All claims expressed in this article are solely those of the authors and do not necessarily represent those of their affiliated organizations, or those of the publisher, the editors and the reviewers. Any product that may be evaluated in this article, or claim that may be made by its manufacturer, is not guaranteed or endorsed by the publisher.
The Supplementary material for this article can be found online at: https://www.frontiersin.org/articles/10.3389/frwa.2025.1507254/full#supplementary-material
Ahsan, M. A., Siddique, M. A. B., Munni, M. A., Akbor, M. A., Akter, S., and Mia, M. Y. (2018). Analysis of physicochemical parameters, anions and major heavy metals of the Dhaleshwari River water, Tangail, Bangladesh. Am. J. Environ. Protect. 7, 29–39. doi: 10.11648/j.ajep.20180702.12
Ahsan, A., Ahmed, T., Uddin, M. A., Al-Sulttani, A. O., Shafiquzzaman, M., Islam, M. R., et al. (2023). Evaluation of water quality index (WQI) in and around Dhaka City using groundwater quality parameters. Water 15:1–12. doi: 10.3390/w15142666
Ali, M. S., Begum, S., Rabbi, F. M., Sumaia, H., Rahman, M. A., Rahman, M. M., et al. (2024). Multivariate analysis of water quality in the Dhaleshwari River, Bangladesh: identifying pollution sources and environmental implications. Water Pract. Technol. 19, 4128–4147. doi: 10.2166/wpt.2024.251
American Public Health Association, American Water Works Association and Water Environment Federation (1998). Standard methods for the examination of water and wastewater. 20th Edn. Washington, D.C.: American Public Health Association.
Barakat, A., Baghdadi, M. E., Rais, J., and Nadem, S. (2012). Assessment of heavy metal in surface sediments of Day River at Beni-Mellal region, Morocco. Res. J. Environ. Earth Sci. 4, 797–806.
Cory, R. M., Boyer, E. W., and McKnight, D. M. (2011). “Spectral methods to advance understanding of dissolved organic carbon dynamics in forested catchments” in Forest hydrology and biogeochemistry: Synthesis of past research and Future directions. eds. L. F. Delphis and C. M. Darry (Dordrecht: Springer), 117–135.
ECR (2023) Risk-based screening table-generic Table.’United States Environmental Protection Agency, Washington, DC. Available at: https://www.fao.org/faolex/results/details/en/c/LEX-FAOC219240/ (Accessed November 10, 2023).
El Morabet, E., Berhazi, L., Khan, R. A., Bouhafa, S., Khan, N. A., Hakh, T., et al. (2022). Pollution and health risk assessment of water quality: a case study in Mohammedia prefecture in Morocco. J. Achieve. Materials Manufact. Engin. 110, 67–85. doi: 10.5604/01.3001.0015.7045
EPA (1989) Risk assessment guidance for superfund. Volume I human health evaluation manual (part a): Interim final. PB-90-155581/XAB; EPA-540/1–89/002. United States. Available at: https://www.epa.gov/sites/default/files/2015-09/documents/rags_a.pdf (Accessed: 11 October 2023).
Fellman, J. B., Hood, E., and Spencer, R. G. M. (2010). Fluorescence spectroscopy opens new windows into dissolved organic matter dynamics in freshwater ecosystems: a review. Limnol. Oceanogr. 55, 2452–2462. doi: 10.4319/lo.2010.55.6.2452
Fu, P., Mostofa, K. M. G., Wu, F., Liu, C. Q., Li, W., Liao, H., et al. (2010). Excitation-emission matrix characterization of dissolved organic matter sources in two eutrophic lakes (southwestern China plateau). Geochem. J. 44, 99–112. doi: 10.2343/geochemj.1.0047
Gabor, R. S., Burns, M. A., Lee, R. H., Elg, J. B., Kemper, C. J., Barnard, H. R., et al. (2015). Influence of leaching solution and catchment location on the fluorescence of water-soluble organic matter. Environ. Sci. Technol. 49, 4425–4432. doi: 10.1021/es504881t
Gao, L., Zhou, Z., Reyes, A. V., and Guo, L. (2018). Yields and characterization of dissolved organic matter from different aged soils in northern Alaska. J. Geophys. Res. Biogeo. 123, 2035–2052. doi: 10.1029/2018JG004408
Goutam, A. (2018) A survey to access household water quality at Narayanganj industrial zone. BRAC University. Available at: http://hdl.handle.net/10361/10959 (Accessed October 13, 2023).
Haque, M.E. (2018) Study on surface water availability for future water demand for Dhaka City. Department of Water Resources Engineering. Available at: http://lib.buet.ac.bd:8080/xmlui/handle/123456789/5001%09 (Accessed December 19, 2023).
Hasan, M. M., Ahmed, M. S., and Adnan, R. (2020). Assessment of physico-chemical characteristics of river water emphasizing tannery industrial park: a case study of Dhaleshwari River, Bangladesh. Environ. Monit. Assess. 192:807. doi: 10.1007/s10661-020-08750-z
Hasan, M. K., Shahriar, A., and Jim, K. U. (2019). Water pollution in Bangladesh and its impact on public health. Heliyon 5:e02145. doi: 10.1016/j.heliyon.2019.e02145
He, J., Wu, X., Zhi, G., Yang, Y., Wu, L., Zhang, Y., et al. (2022). Fluorescence characteristics of DOM and its influence on water quality of rivers and lakes in the Dianchi Lake basin. Ecol. Indic. 142:109088. doi: 10.1016/j.ecolind.2022.109088
Helms, J. R., Stubbins, A., Ritchie, J. D., Minor, E. C., Kieber, D. J., and Mopper, K. (2008). Absorption spectral slopes and slope ratios as indicators of molecular weight, source, and photobleaching of chromophoric dissolved organic matter. Limnol. Oceanogr. 53, 955–969. doi: 10.4319/lo.2008.53.3.0955
Hossain, M. M., and Hossain, M. N. (2021). Determination of quality index for surface and ground water of Jashore, Bangladesh. Ann. Bangladesh Agric. 25, 117–122. doi: 10.3329/aba.v25i1.58160
Iscen, F. C., Emiroglu, O., Ilhan, S., Arslan, N., Yilmaz, V., and Ahiska, S. (2008). Application of multivariate statistical techniques in the assessment of surface water quality in Uluabat Lake, Turkey. Environ. Monit. Assess. 144, 269–276. doi: 10.1007/s10661-007-9989-3
Islam, M.R. (2018) Effects of relocation of tannery industries from Hazaribagh on water quality of Buriganga River. Bangladesh University of Engineering and Technology. Available at: http://lib.buet.ac.bd:8080/xmlui/handle/123456789/4886 (Accessed October 13, 2023).
Islam, M. S., Azadi, M. A., Nasiruddin, M., and Islam, M. S. (2020). Water quality index of Halda River, southeastern Bangladesh. Am. J. Environ. Engin. 10, 59–68. doi: 10.5923/j.ajee.20201003.02
Lee, S. A., and Kim, G. (2018). Sources, fluxes, and behaviors of fluorescent dissolved organic matter (FDOM) in the Nakdong River estuary, Korea. Biogeosciences 15, 1115–1122. doi: 10.5194/bg-15-1115-2018
Manoj, K., Kumar, B., and Padhy, P. (2012). Characterisation of metals in water and sediments of Subarnarekha River along the projects’ sites in lower basin, India. Univ. J. Environ. Res. Technol. 2:1–9.
Mirza, M. M. Q., Warrick, R. A., and Eriksen, N. J. (2003). The implications of climate change on floods of the Ganges, Brahmaputra and Meghna rivers in Bangladesh. Clim. Chang. 57, 287–318. doi: 10.1023/A:1022825915791
Mohanta, B. K., and Patra, A. K. (2000). Studies on the water quality index of river Sanamachhakandana at Keonjhar Garh, Orissa, India. Pollut. Res. 19, 377–385.
Mohinuzzaman, M., Yuan, J., Yang, X., Senesi, N., Li, S. L., Ellam, R. M., et al. (2020). Insights into solubility of soil humic substances and their fluorescence characterisation in three characteristic soils. Sci. Total Environ. 720:137395. doi: 10.1016/j.scitotenv.2020.137395
Mostofa, K. M. G., Jie, Y., Sakugawa, H., and Liu, C. Q. (2019). Equal treatment of different EEM data on PARAFAC modeling produces artifact fluorescent components that have misleading biogeochemical consequences. Environ. Sci. Technol. 53, 561–563. doi: 10.1021/acs.est.8b06647
Mostofa, K. M. G., Liu, C. Q., Yoshioka, T., Vione, D., Zhang, Y., and Sakugawa, H. (2013). “Fluorescent dissolved organic matter in natural waters” in Photobiogeochemistry of organic matter: Principles and practices in water environments. eds. K. M. G. Mostofa, et al. (Berlin Heidelberg (Environmental Science and Engineering): Springer-Verlag), 429–559.
Mostofa, K. M. G., Wu, F., Liu, C. Q., Fang, W. L., Yuan, J., Ying, W. L., et al. (2010). Characterization of Nanming River (southwestern China) sewerage-impacted pollution using an excitation-emission matrix and PARAFAC. Limnology 11, 217–231. doi: 10.1007/s10201-009-0306-4
Niloy, N. M., Shammi, M., Haque, M. M., and Tareq, S. M. (2022). ‘Investigating dissolved organic matter dynamics in the downstream reaches of the Ganges and Brahmaputra Rivers using fluorescence using fluorescence spectroscopy. Front. Earth Sci. 10, 1–14. doi: 10.3389/feart.2022.821050
Ning Liu, N., Zhu, Q., Qian, X., Yang, L., Dai, M., Jiang, X., et al. (2012). Non-carcinogenic risks induced by heavy metals in water from a Chinese River. Pol. J. Environ. Stud. 21, 967–972.
Onoyima, C., and Ibraheem, W. (2021). Assessment of water quality of shallow aquifer resources of Agbabu, Ondo state, Nigeria. ChemSearch J. 12, 41–49.
Padmanabha, B., and Belagali, S. L. (2005). Comparative study on the water quality index of four lakes in the Mysore city. Environ. Sci. 25, 873–876.
Paul, R., and Haq, A. (2010) Challenges of water quality management: Case of peripheral Rivers in Dhaka mega City. Presentation from the world water week in Stockholm. Stockholm, Sweden. Available at: https://www.slideshare.net/slideshow/challenges-of-water-quality-management-case-of-peripheral-rivers-in-dhaka-mega-city-presented-by-reba-paul-executive-secretary-bwp-and-azharul-haq-former-managing-director-dhaka-wasa-at-world-water-week-2010/5352131 (Accessed October 17, 2023).
Rabbani, M.G. (2013) River water quality report 2011, Natural Resource Managment Section, Department of Environment, Ministry of Environment and Forests
Rafid, A. S., Rahman, M. T. U., Palash, M. M. H., Ullah, A. K. M. A., and Quraishi, S. B. (2019). “A brief assessment of water quality of Dhaleshwari River” in Climate change mitigation and adaptation, 121–130.
Reddi, K. R., Jayaraju, N., Suryakumar, I., and Sreenivas, K. (1993). Tidal fluctuations in relation to certain physic-chemical parameters in Swarnamukhi river estuary, east coast of India. Indian J. Marine Sci. 22, 232–234.
Rikta, S. Y., Rahaman, M. S., Mehjabin, J. J., Uddin, M. K., Kabir, M. M., and Tareq, S. M. (2016). Evaluation of water quality parameters and humic substance status of Bangshi, Dhaleshwari and Padma Rivers in Bangladesh. Int. J. Environ. Sci. 6, 1129–1139. doi: 10.6088/ijes.6018
Sarkar, A. M., Rahman, A. K. M. L., Samad, A., Bhowmick, A. C., and Islam, J. B. (2019). Surface and ground water pollution in Bangladesh: a review. Asian Rev. Environ. Earth Sci. 6, 47–69. doi: 10.20448/journal.506.2019.61.47.69
Shammi, M., Pan, X., Mostofa, K. M. G., Zhang, D., and Liu, C. Q. (2017). Seasonal variations and characteristics differences in the fluorescent components of extracellular polymeric substances from mixed biofilms in saline lake. Sci. Bullet. 62, 764–766. doi: 10.1016/j.scib.2017.04.016
Singh, S. P., Pathak, D., and Singh, R. (2002). Hydrobiological studies of two ponds of Satna (M.P.), India. Econ. Environ. Conserv. 8, 289–292.
Smith, B. D., Haque, A. K. M. A., Hossain, M. S., and Khan, A. (1998). PROFILE: river dolphins in Bangladesh: conservation and the effects of water development. Environ. Manag. 22, 323–335. doi: 10.1007/s002679900108
Stedmon, C. A., and Bro, R. (2008). Characterizing dissolved organic matter fluorescence with parallel factor analysis: a tutorial. Limnol. Oceanogr. Methods 6, 572–579. doi: 10.4319/lom.2008.6.572b
Tiwari, T. N., and Mishra, M. A. (1985). A preliminary assignment of water quality index of major Indian Rivers. Indian J. Environ. Protect. 5, 276–279.
US EPA (2005). “Chapter 7: characterizing characterizing risk and Hazard” in Human health risk assessment protocol, 1–15.
USEPA (1983). Sampling handling and preservation. In metals for chemical analysis of water and wastes. Environ. Protect. Agency 600, 58–61.
USEPA (1999) ‘Appendix E: Toxicity reference values’, in screening level ecological risk assessment protocol for hazardous waste combustion facilities. United States Environmental Protection Agency. Available at: https://archive.epa.gov/epawaste/hazard/tsd/td/web/html/ecorisk.html (Accessed October 11, 2023).
USEPA (2015) ‘Risk-based screening table-generic Table.’United States Environmental Protection Agency, Washington, DC. Available at: http://semspub.epa.gov/work/03/2218450.pdf%23_ga=1.192660266.1609005446.1445688363 (Accessed January 1, 2025).
Waeles, M., Riso, R. D., and Le Corre, P. (2005). Seasonal variations of dissolved and particulate copper species in estuarine waters. Estuar. Coast. Shelf Sci. 62, 313–323. doi: 10.1016/j.ecss.2004.09.019
Waghmare, N. V., Shinde, V. D., Surve, P. R., and Ambore, N. E. (2012). Seasonal variations of phsycio-chemical characteristics of Jamgavan dam water of Hingoli District (M.S.) India. Int. Multidisciplin. Res. J. 2, 23–25.
Wang, C., Hu, X., Liu, Y., and Jin, G. (2022). Sources, spectral characteristics, and fluxes of dissolved organic matter in coastal groundwater and river water in western Guangdong, China. Front. Environ. Sci. 10, 1–18. doi: 10.3389/fenvs.2022.995190
Waterloo, M. J., Oliveira, S. M., Drucker, D. P., Nobre, A. D., Cuartas, L. A., Hodnett, M. G., et al. (2006). Export of organic carbon in run-off from an Amazonian rainforest Blackwater catchment. Hydrol. Process. 20, 2581–2597. doi: 10.1002/hyp.6217
Yamashita, Y., Jaffé, R., Maie, N., and Tanoue, E. (2008). ‘assessing the dynamics of dissolved organic matter (DOM) in coastal environments by excitation emission matrix fluorescence and parallel factor analysis (EEM-PARAFAC)’. Limnol. Oceanogr. 53, 1900–1908. doi: 10.4319/lo.2008.53.5.1900
Yang, X., Yuan, J., Yue, F. J., Li, S. L., Wang, B., Mohinuzzaman, M. M., et al. (2020). New insights into mechanisms of sunlight-and dark-mediated high-temperature accelerated diurnal production-degradation of fluorescent DOM in lake waters. Sci. Total Environ. 760:143377. doi: 10.1016/j.scitotenv.2020.143377
Zark, M., and Dittmar, T. (2018). Universal molecular structures in natural dissolved organic matter. Nat. Commun. 9:3178. doi: 10.1038/s41467-018-05665-9
Keywords: Dhaleshwari River, fluorescent dissolved organic matter, physiochemical parameters, water quality index, humic substances
Citation: Mohinuzzaman M, Mowa J, Kabir MM, Chowdhury MAZ, Nesha M, Mostofa KMG, Niloy NM, Shammi M and Tareq SM (2025) Water quality and fluorescent dissolved organic matter dynamics of Dhaleshwari River. Front. Water. 7:1507254. doi: 10.3389/frwa.2025.1507254
Edited by:
Martin Thullner, Federal Institute for Geosciences and Natural Resources, GermanyReviewed by:
Vijay Anand L., Indian Institute of Technology Ropar, IndiaCopyright © 2025 Mohinuzzaman, Mowa, Kabir, Chowdhury, Nesha, Mostofa, Niloy, Shammi and Tareq. This is an open-access article distributed under the terms of the Creative Commons Attribution License (CC BY). The use, distribution or reproduction in other forums is permitted, provided the original author(s) and the copyright owner(s) are credited and that the original publication in this journal is cited, in accordance with accepted academic practice. No use, distribution or reproduction is permitted which does not comply with these terms.
*Correspondence: Mohammad Mohinuzzaman, bW9oaW51enphbWFuQG5zdHUuZWR1LmJk
†These authors have contributed equally to this work and share first authorship
Disclaimer: All claims expressed in this article are solely those of the authors and do not necessarily represent those of their affiliated organizations, or those of the publisher, the editors and the reviewers. Any product that may be evaluated in this article or claim that may be made by its manufacturer is not guaranteed or endorsed by the publisher.
Research integrity at Frontiers
Learn more about the work of our research integrity team to safeguard the quality of each article we publish.