 Hanaa A. Megahed1*
 Abd El-Hay A. Farrag2Amira A. Mohamed2Mahmoud H. Darwish3
 Mohamed A. E. AbdelRahman4
 Heba El-Bagoury5
 Paola D’Antonio6
 Antonio Scopa6*
 Mansour A. A. Saad7
- 1Division of Geological Applications and Mineral Resources, National Authority for Remote Sensing and Space Sciences (NARSS), Cairo, Egypt
- 2Geology Department, Faculty of Science, Assiut University, Assiut, Egypt
- 3Geology Department, Faculty of Science, New Valley University, El Kharga, Egypt
- 4Division of Environmental Studies and Land Use, National Authority for Remote Sensing and Space Sciences (NARSS), Cairo, Egypt
- 5Geography Department, Faculty of Arts, Port Said University, Port Said, Egypt
- 6Dipartimento di Scienze Agrarie, Forestali, Alimentari ed Ambientali (DAFE), Università degli Studi della Basilicata, Potenza, Italy
- 7Higher Institute of Literary Studies, Higher Institutes in King Mariout (KMA), Alexandria, Egypt
Availability in Egypt is minimal due to a real restriction on the quantity and quality of acceptable water; it is also increasingly in demand, particularly since the reduction in the share in the Nile following the construction of the Renaissance Dam in Ethiopia. At the same time, the need for water increases due to population growth, industrial development and the cultivation of desert land. The country depends significantly on its water supply on the groundwater. Wadi Qena represents one of the most promising valleys, on which the government depends for land reclamations and developments. This study aims to assess groundwater quality for drinking and irrigation purposes by integrating quantitative analyses and GIS techniques. To achieve this goal, 17 groundwater samples were collected from the Quaternary and Nubian aquifer from the middle and southern part of the Wadi. Chemical analysis of the major cations and anions was carried out at Assuit’s Regional Soil Fertility Laboratory. Maps of chemical variables are created using statistical tools by combining observations with interpolation models that can incorporate simple process relations. Major ions, total salinity, Na%, SAR, EC, RSC, PI, MH, KR, SSP, TH, and Cl− were used to assess the groundwater for drinking and irrigation purposes. Schoeller’s, Stiff’s, and Piper’s, diagrams were used to determine the hydrochemical facies of groundwater in the area. The hydrochemical composition reflects that Sodium–Chloride is the main water type in the study area, and in the sequence of the cations and anions, 100% of the groundwater samples are in the order Na+ > Ca2+ > Mg2+/Cl− > SO42− > HCO3−. Comparative analysis against standard quality guidelines indicated that most groundwater samples exceeded safe levels for major constituents, TDS, TH, pH, and EC, making them unsuitable for drinking but potentially suitable for irrigation of high salt-tolerant crops. The results of hydrochemical analysis maps and analytical diagrams of groundwater samples revealed that the water was characterized by natural to alkali and the total dissolved solids (TDS) increasing from the Nubian to Quaternary and high ranges of sodium absorption (SAR). The GIS-spatial model indicated that the southwest part and northwest part represented the highest and lowest suitability, respectively, for drinking water purposes. In contrast, the northwest part and southwest parts represented the highest and lowest suitability, respectively, for irrigation purposes. This is confirmed by the values of Na+, SAR, EC, RSC, PI, MH, KR, SSP, TH, and Cl−. The values of Na+, SAR, EC, RSC, PI, MH, KR, SSP, TH, and Cl confirm this. The study lists corrective measures to improve groundwater quality using monitoring systems, efficient irrigation techniques, localized desalination, artificial recharge projects, stricter waste management and agricultural policies that will minimize sources of contamination. This study’s proposed model offers a promising and potentially universal tool for water quality assessment in the Nile basin and similar settings worldwide with the innovative model presented in this study.
1 Introduction
Groundwater plays a crucial role in the Earth’s hydrological cycle and is a valuable resource that must be conserved. Availability of water of acceptable quality in Egypt is limited and getting even more restricted where the country relies heavily on groundwater with increasing population growth, industrial development, and the cultivation of desert lands. Wadi Qena, located in the Egyptian Eastern Desert, is a vast valley extending from the town of Qena south to the Galala Plateau in the north, west of the Gulf of Suez. The main objective of this research is to assess groundwater quality for various purposes using Geographic Information System (GIS) techniques. Like the study area, arid-semi-arid regions rely heavily on groundwater for their water supply. The chemical properties, water quality characteristics, and evolutionary patterns of groundwater are closely related to the surrounding environment. They are mainly influenced by hydrogeological conditions, water-rock interactions, and other natural factors, as well as human activities and misuse of groundwater (Jiang et al., 2015; Ren and Zhang, 2020; Xiao et al., 2023; Gong et al., 2023). Human actions, dissolution of soluble salts, evaporation and weathering of silicate minerals are the main influences on the development of groundwater (Yidana et al., 2018; Pazand et al., 2018; Metwaly et al., 2022). Assessing groundwater quality and monitoring groundwater levels is essential for effective management of groundwater sources (Metwaly et al., 2022; Haghizadeh et al., 2017; Honarbakhsh et al., 2019). It is crucial to preserve groundwater resources through innovative approaches, especially considering the increasing global population and scarcity of fresh water. Given its diverse applications, water is recognized as a precious natural good, and the provision of clean and accessible water is fundamental for all individuals (Ferreira dos Santos and Cunha-Santino, 2015). The increase in population, the objectives of agricultural, and industrial progress and the growing needs for water could potentially lead to the depletion of water reserves and the degradation of their quality (Simonetti et al., 2019). Groundwater quality can be influenced by a multitude of factors, including geological formations that contain water, human activities, environmental conditions, agricultural practices, irrigation methods, and the use of fertilizers in agriculture (Belkhiri et al., 2010; Darwish and Galal, 2020; Galal and Darwish, 2022; El-Rawi et al., 2020). The increasing demand for water has necessitated an immediate need for water as a supplement for various purposes. This issue has received increased attention through the implementation of new reclamation initiatives and development efforts, particularly in regions characterized by aridity and semi-aridity (Darwish et al., 2023; AbdelRahman et al., 2018). Groundwater hydrochemistry is primarily influenced by processes such as rock weathering, mineral dissolution, and ion exchange (Yuan et al., 2024).
The integration of modeling software and a geographic information system (GIS) facilitates the creation of a holistic representation of groundwater quality (Mohamaden et al., 2024; Wang et al., 2008; Megahed et al., 2023). The use of a finite element model in conjunction with numerical modeling of groundwater flows can be very effective in assessing the influence of climate on cropping patterns and optimizing irrigation water management (Sanaullah et al., 2023). Groundwater chemical constituents can serve as indicators of water quality attributes and provide insight into the chemical composition of groundwater in the designated research region (Kreins et al., 2015). The major factors contributing to soil fertility, optimal plant development, and abundant agricultural yield in each region can be attributed mainly to the use of superior quality irrigation water (Giri et al., 2021).
The hydrochemical composition of groundwater is influenced by both sedimentary conditions and human activities (Mester et al., 2022). Groundwater pollution is mainly caused by agricultural activities, industrial discharges, domestic wastewater and overexploitation, which contribute to the degradation of water quality. Among these factors, agricultural runoff represents a significant contributor to contamination. Another concern is the presence of hazardous disinfection byproducts (DBPs) that can occur during the disinfection process. Finally, the overall environmental impact must also be taken into consideration when assessing the quality of drinking water (Han and Currell, 2017; Srivastav et al., 2020). Water quality management requires continuous assessment and sustained monitoring to ensure its safe use for various purposes (Wali et al., 2022). Many analytical techniques are used to analyze groundwater evolution processes. Various analytical methods are used to characterize groundwater evolution processes (Zhang et al., 2022; Abu Salem et al., 2022).
Application of water quality entropy weight index (EWQI) along with multivariate statistical methods proves to be very beneficial for water quality assessment and improvement of monitoring approaches (Han et al., 2024). Sustainable land use planning and appropriate agricultural management practices are essential for establishing new communities, particularly in arid regions. A comprehensive assessment of soil and irrigation water characteristics is essential, as the quantitative parameters used can be identified through monitoring temporal variations in arid areas and assessing water properties in relation to management strategies and environmental risks (Megahed et al., 2022). Assessing groundwater quality in desert systems poses a significant challenge, primarily due to the paucity of hydrological data and the isolated nature of desert oases. To deal with future obstacles faced by arid and semi-arid regions, the use of a geographic information system (GIS) model becomes essential (Megahed et al., 2023).
This research aims to assess groundwater quality in Wadi Qena, Egypt using GIS techniques. Groundwater quality is influenced by hydrogeological conditions, water-rock interactions, natural factors, human activities, and misuses. The study highlights the importance of continued evaluation and monitoring for safe use. Factors affecting drinking water quality include anthropogenic contaminants, conventional treatment processes, and hazardous disinfection byproducts. Sustainable land use and agricultural management practices are essential for establishing new communities in arid regions.
2 Materials and methods
2.1 Description of the study area
Wadi Qena is one of Egypt’s largest wadies, on which the government depends for land reclamations and developments. It is located northeast of Qena city between latitudes 26°00′ and 28°20′N and longitudes 32°00′ and 33°00′E, covering approximately 16,000 km2. The study area includes the southern part of the Wadi (Figure 1A). Wadi Qena has extreme aridity, with deficient and unpredictable rainfall, high evaporation rates, and high summer temperatures.
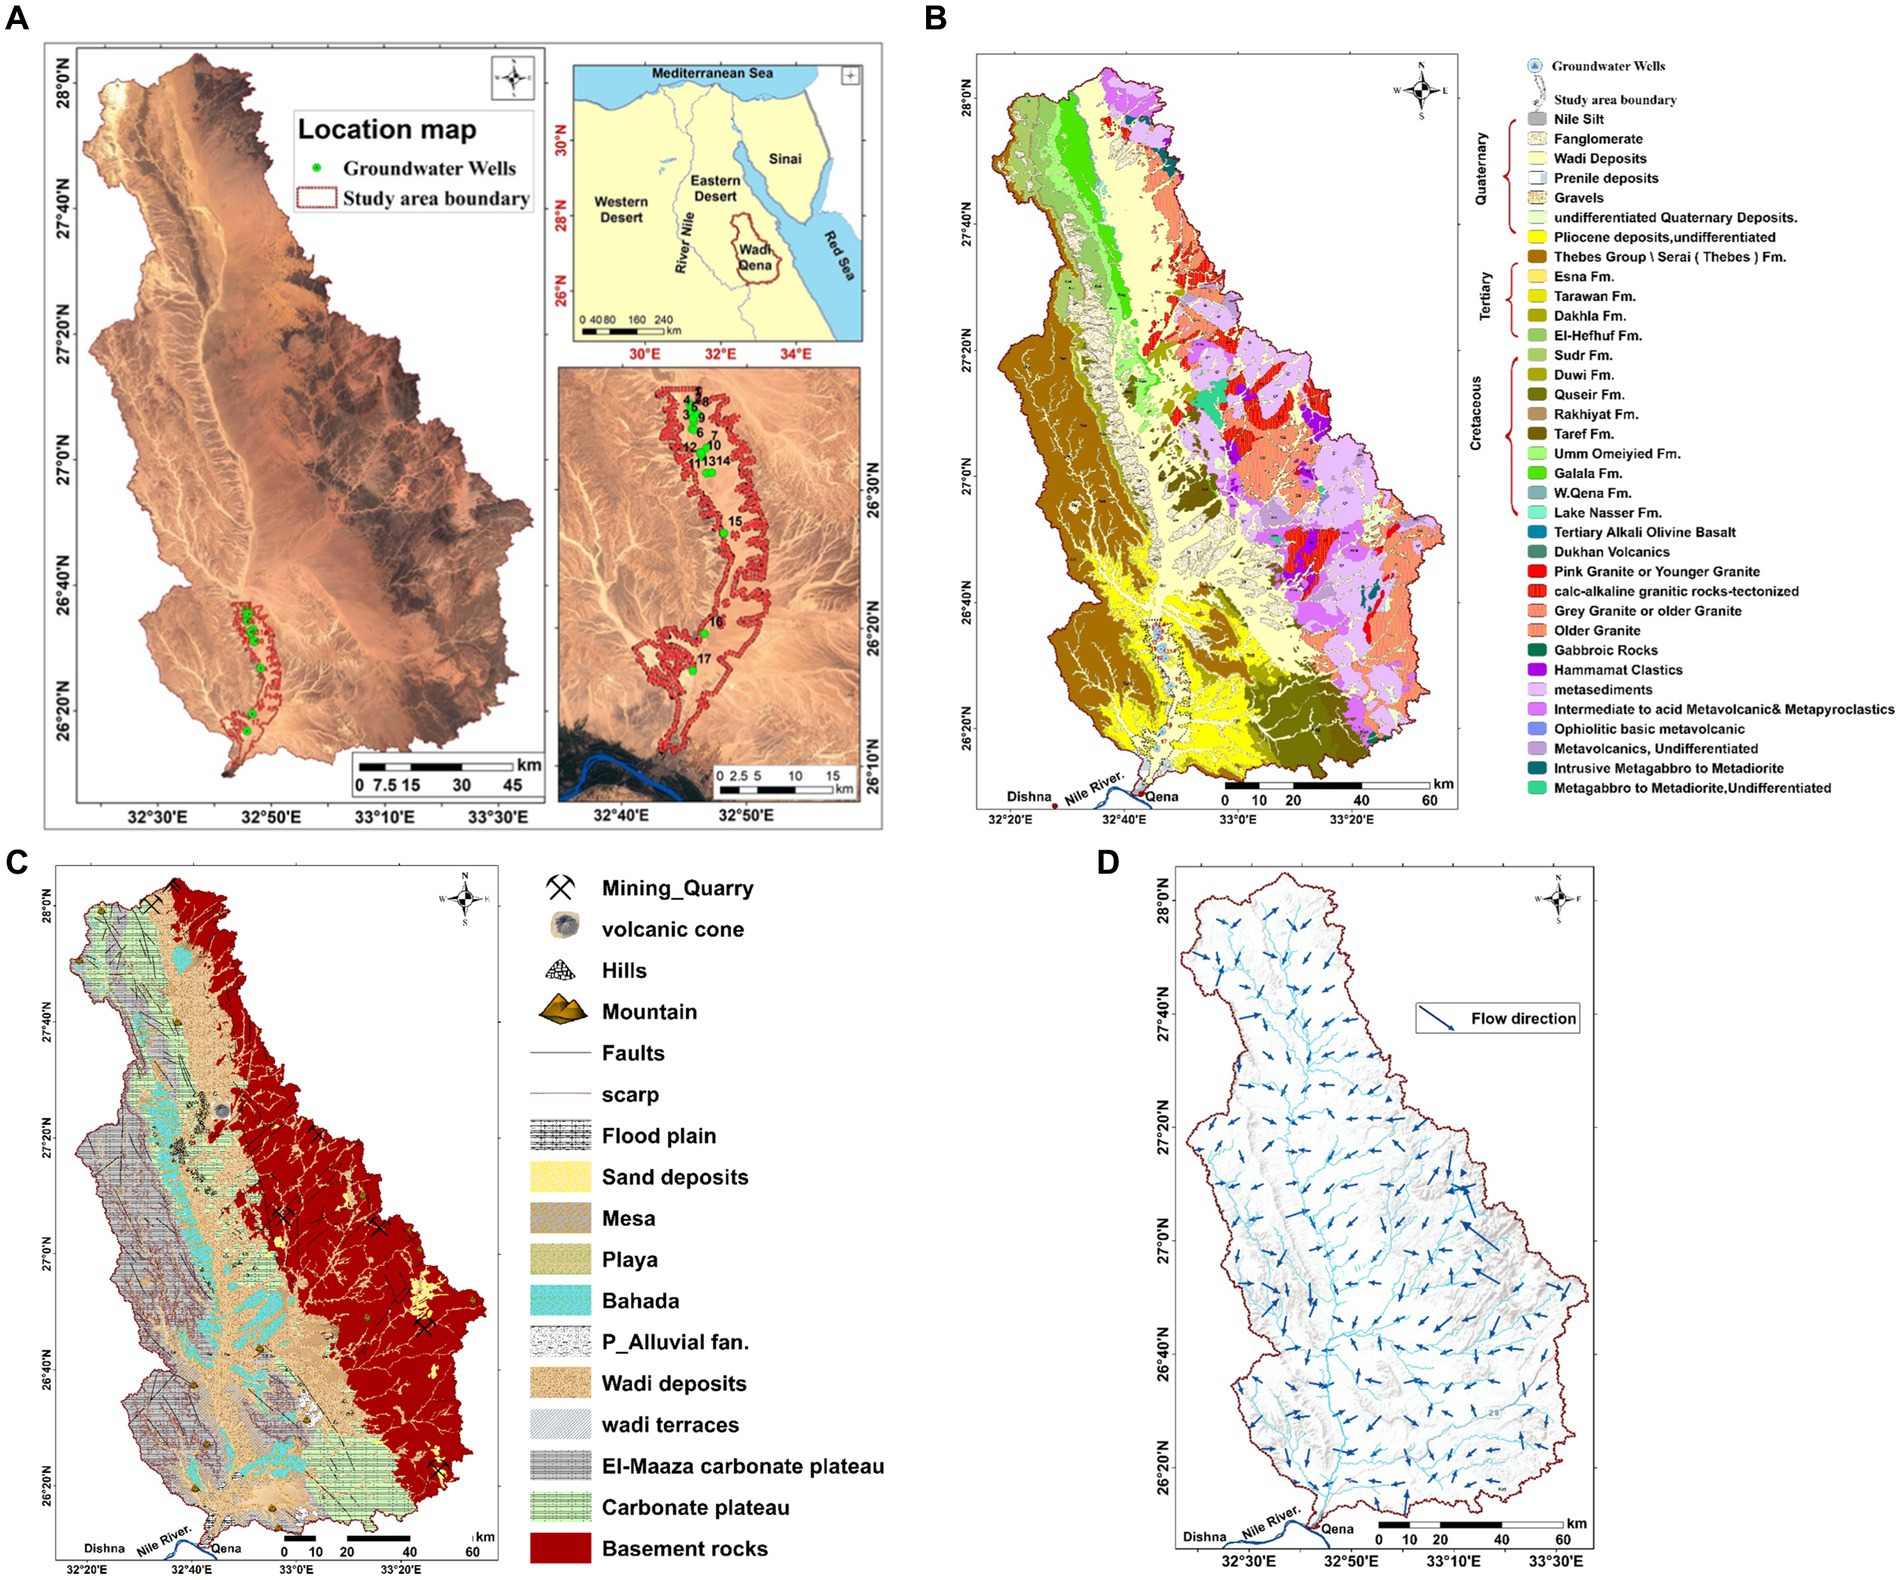
Figure 1. (A) Location map with monitoring wells. (B) Geological map [Modified after (Conoco, 1987; Egyptian Geological Survey and Mining Authority (EGSMA), 1983; Egyptian Geological Survey and Mining Authority (EGSMA), 2006)]. (C) Geomorphological units (derived from topographic map 1:500,000 and Google Earth). (D) Slope map indicating groundwater flow direction (derived from DEM, 30 m) of Wadi Qena.
Geologically, the area of study from Wadi Qena is formed of a sedimentary succession from base to top: Nubia Sandstone (Pre-Campanian), Quseir Shale (Campanian-Maestrichtian), Duwi Formation (Maestrichtian), Dakhla Shale (Maestrichtian-Landenian), Tarawan Chalk (Landenian), and Esna Shale (Landenian Early Ypresian) (Figure 1B). The age of different formations was assigned after (Abd El Razik and Razvaliaev, 1972; Faris, 1974). The Nubia Sandstone is overlain by a shaly sequence of Quseir Shale, which is intercalated in its lower part with two phosphorites. The Duwi Formation was composed of three phosphorite beds intercalated with shale, marl, and sandstone, a succession of siliciclastics from Dakhla Shale and Esna Shale divided by the Tarawan Chalk. The Lower Eocene limestone represents the upper part of Esna Shale, which forms the surface of the plateau (Ahmed, 1983). Overall, the study area encompasses the Quaternary in its northwestern part, as well as the Nubian sandstone aquifers, each with different conditions. The shallow Quaternary aquifer, mainly composed of sand and gravel, is very susceptible to contamination because it is quite shallow and well permeable. Groundwater from the deeper Nubian aquifer, mainly composed of sandstone with interbedded shales, causes higher mineralization due to a longer water-rock contact.
The Wadi Qena area has an overall geomorphology comprising several key geomorphological units important in controlling groundwater distribution and quality (Figure 1C). These include the wadi channel and bed, which are predominantly alluvial in nature, consisting of sand, gravel and silt, which serve as a reservoir for the alluvial aquifer recharged by seasonal runoff. Alluvial fans form at the mouths of the tributary channels, where sediments are deposited, contributing to the recharge of the shallow aquifer and providing fertile land for agriculture. The floodplains, covered with fine sediments such as clay and silt, are periodically inundated by the overflow of the wadi, temporarily storing surface water but with limited contribution to groundwater recharge. The Red Sea Mountains are composed of granite and metamorphic rocks, forming a major watershed. It influences drainage patterns and contributes its weathering products to groundwater chemistry. Beneath the alluvial deposits of the southern part of the wadi, the Nubian Sandstone forms a confined aquifer. This is a major source of groundwater for agricultural and drinking purposes, mainly in the deeper layers. All these geomorphic units together contribute to the groundwater dynamics in Wadi Qena; changes in sediment types, permeability, and recharge potential control water quality and quantity. Topography in relation to the elevation gradient and underlying geological structures is one of the major controlling factors that can influence the direction of groundwater flow. Geomorphology and surface features have contributed greatly to groundwater movement in this region. They generally occur downstream from mountainous recharge areas through wadi channels and alluvial fans to discharge areas at lower elevations. The slope map shown in Figure 1D is a good way to visualize the direction of groundwater flow because it graphically represents the gradient of the land surface to which groundwater movement is directly related. The slope map was obtained from DEM data in the study area using GIS techniques. Water generally flows to lower elevation areas and gradually accumulates in aquifers or flows into surface water systems.
Hydrogeologically, Wadi Qena’s can be divided into four aquifers: a Quaternary aquifer (QAS), a Nubian sandstone aquifer (NSAS), a fractured limestone aquifer; and a fractured crystalline (basement) aquifer. The QAS and NSAS are considered the most water-bearing aquifers in terms of their thickness and water quantity (Abdel Moneim, 2005). The thickness of the QAS of alluvial deposits varies from place to place in the area; it is formed of sand, gravel, and boulders with depths ranging from a few meters to more than 80 m; the average thickness of the NSAS varies by location and is about 350 m, with a depth reaching 300–500 m underground. The groundwater in this aquifer occurs under confined conditions overlying the impermeable Quseir Shale, and the flow of the groundwater in the NSAS in Wadi Qena is defined to be from the northeast to the southeast (Abdel Moneim et al., 2015). As for the structural area in Wadi Qena, it is preferable to connect the QAS with the NSAS below it (Elewa and Abu El Ella, 2011; Elewa et al., 2000; Elewa et al., 2006).
The research analyzes the hydrogeological situation in the study area using field observations and data. GPS and GIS techniques are used to convert field data into a set of maps that depict groundwater conditions. Rockwork and EXCEL were used to represent hydrochemical data. Seventeen Quaternary and Nubian aquifer samples were collected from water wells scattered throughout the study area. Stakeholders drilled these wells, and their abundance grew in tandem with agricultural activity in the region.
All collection equipment was thoroughly washed with deionized water before and after each collection. Samples were stored in high-density polyethylene bottles that had been previously rinsed with the groundwater to be collected. For consistency, duplicate samples will be collected at each location in June 2024. The variation between each set of duplicates was compared to verify accuracy. Field measurements of pH, electrical conductivity, and temperature were performed using field-calibrated meters to ensure real-time accuracy. Samples were rapidly cooled to 4°C to minimize chemical changes before transport to the laboratory. Chemical analyses were performed in an ISO-certified laboratory using conventional titrimetric, gravimetric, and spectrophotometric methods. Standard solutions were used for this purpose and equipment was calibrated regularly to ensure accuracy. Groundwater samples, as well as blanks, standards and spiked samples, were analyzed to monitor for possible contamination or analytical errors. The IBE was calculated to verify the analytical precision to ensure that it was within the acceptable limit of ±5%. To prevent a change in the partial pressure of CO2, the samples were packed in clean plastic bottles that were filled with water and contained no air. In Assiut’s Regional Soil Fertility Laboratory, water samples were analyzed. CL−, HCO3−, Ca2+, and Mg2+ were measured by titration, while SO42− was estimated by turbidity, and Na+ and K+ were analyzed by flame photometer.
Sodium adsorption ratio (SAR), sodium percentage (Na%), residual sodium carbonate (RSC), soluble sodium percentage (SSP), permeability index (PI), Kelly’s ratio (KR), magnesium hazard (MH), and total hardness (TH) are the quality parameters of irrigation (Table 1). By comparing the results and based on the physicochemical analyses with water guideline values, the acceptability of groundwater sources for drinking and agricultural applications will be assessed.
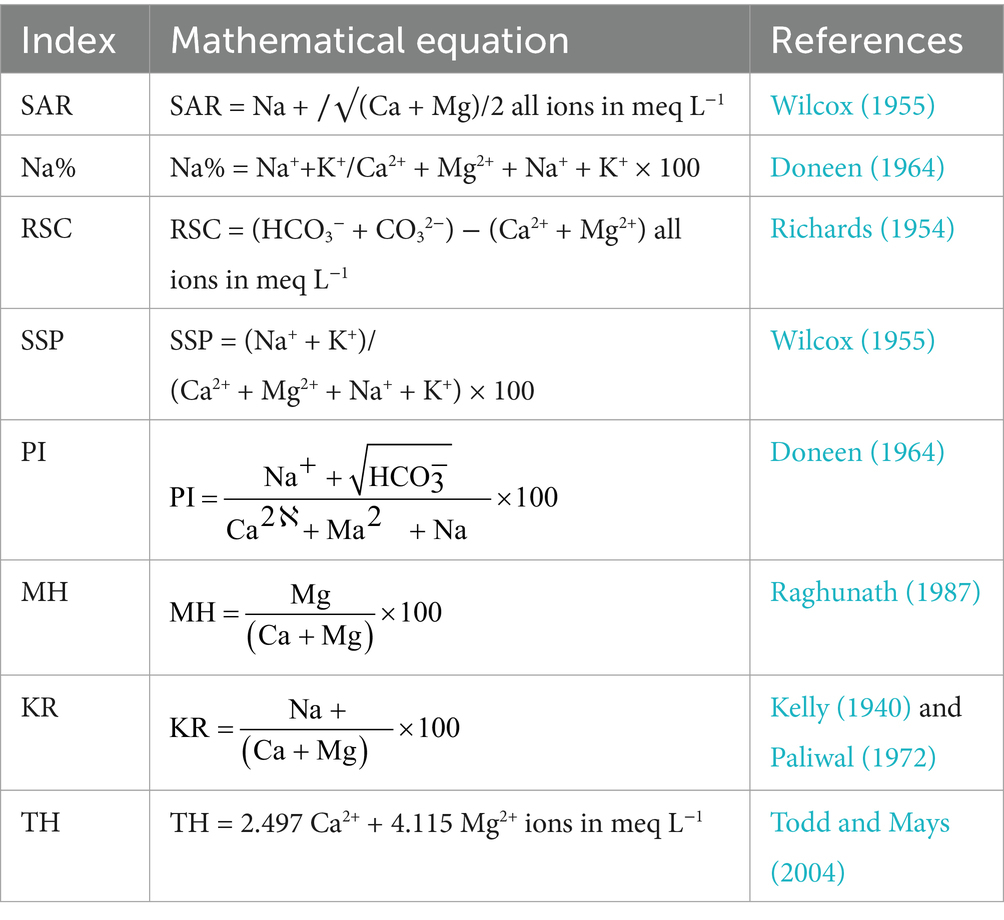
Table 1. Groundwater quality indices for irrigation.
Accordingly, GIS modeling integrated the AHP results using the weighted overlay method to spatially analyze and visualize groundwater quality in the study area. In addition, individual layers were created for each hydrochemical parameter and quality index; therefore, a spatial interpolation technique was applied to fill the gaps in data coverage. The geospatial database built in ArcGIS 9.1 included layers for hydrochemical parameters and quality indices that allowed generating detailed groundwater adequacy maps. These maps are useful for identifying spatial patterns of areas most and least suitable for consumption and irrigation.
According to the methods adopted by Rainwater and Thatcher (1960) and Fishman and Friedman (1989), pH, electrical conductivity (EC), and temperature were measured in situ using a portable field kit. Collection of the geological and hydrogeological data of the study area from previous works and internal reports is done. Using a topographic map (scale 1: 100,000) for the preparation of the base map of the studied area, all the graphical representations and maps for the analytical results through creating a geospatial database was built using Arc GIS 9.1 (ESRI, 2006) and Surfer 8 for Windows for analysis the hydrochemical data and visualization of the results.
2.2 Groundwater quality assessment
Various factors were evaluated to assess the suitability of groundwater in the research area for both human consumption and irrigation. The water quality was verified by analyzing its chemical properties against the guidelines set by the Egyptian High-Water Committee (Egypt Standard, 2007) and the World Health Organization (WHO Guidelines, 2004), as shown in Table 2. Other classifications of groundwater suitability for drinking are based on total dissolved solids (TDS) (College of Agricultural Sciences, 2002; Hem, 1970), as listed in Tables 3, 4.
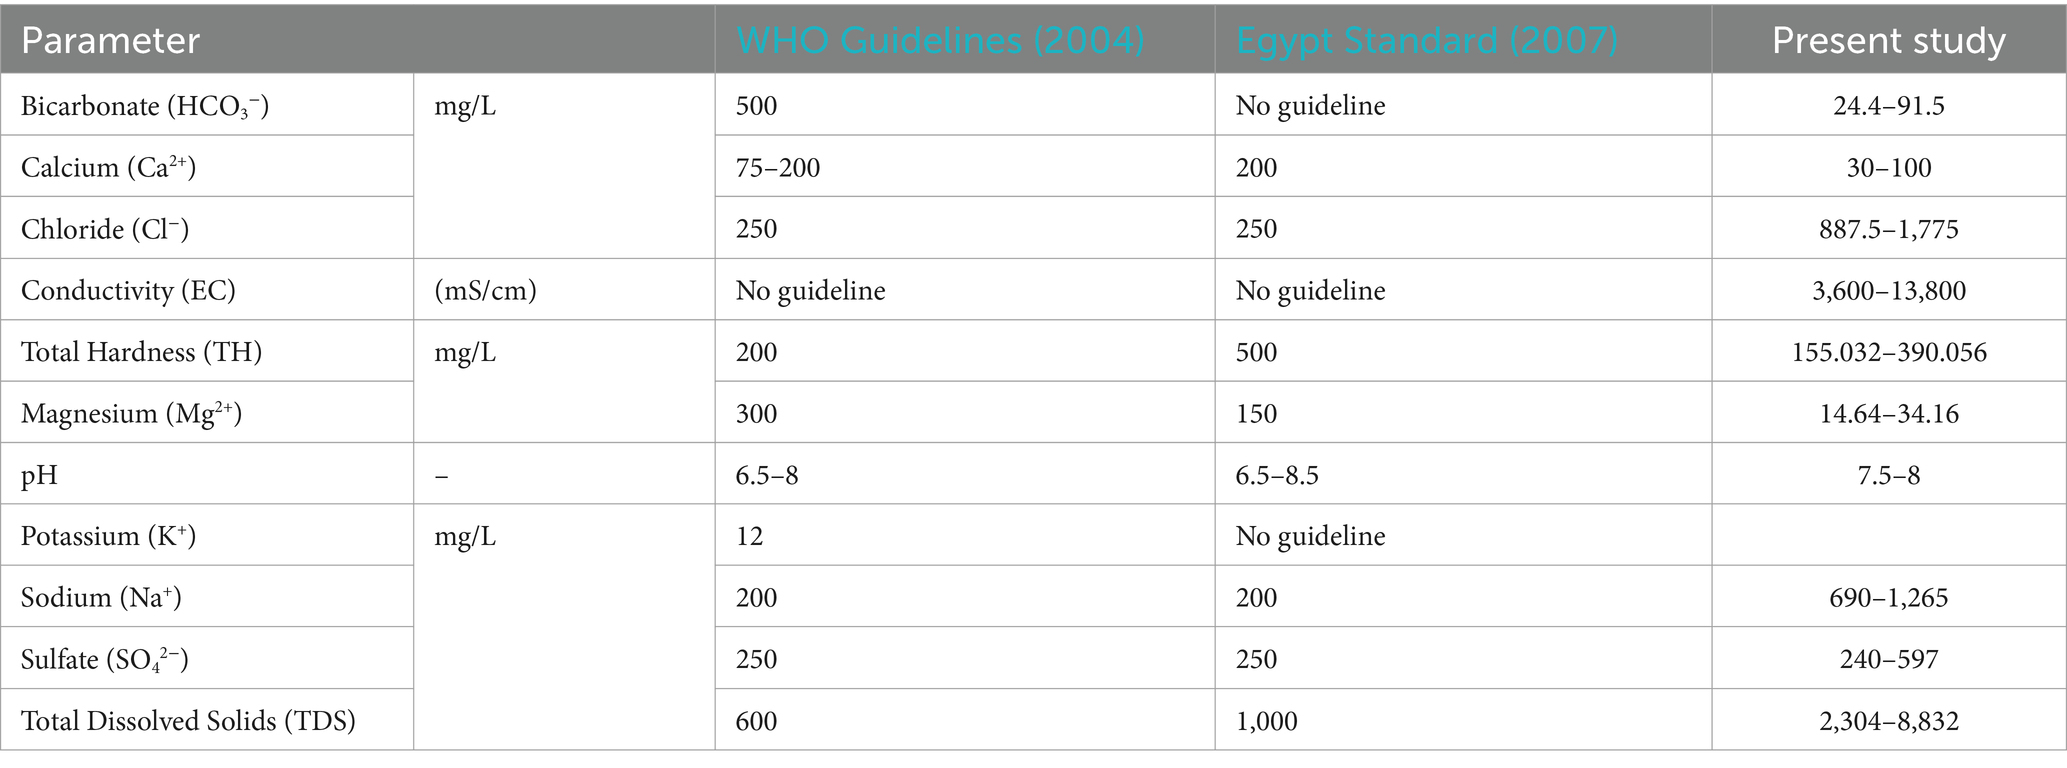
Table 2. WHO Guidelines (2004) and Egypt Standard (2007) for drinking water quality.
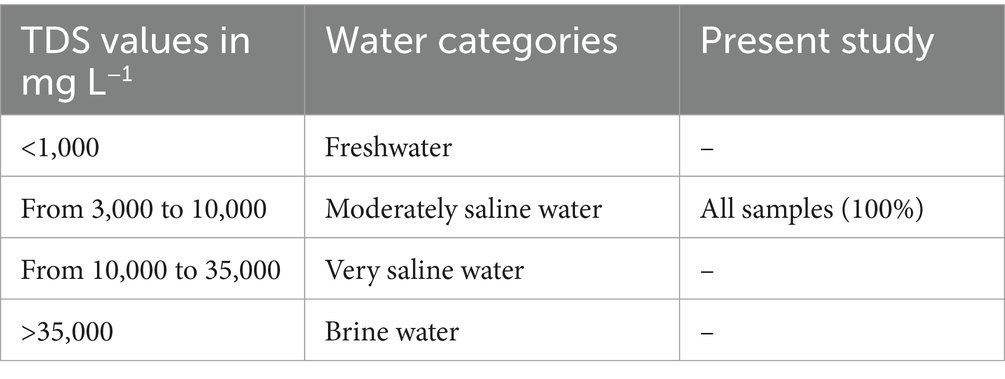
Table 3. Classification of water according to its TDS value (Hem, 1985).
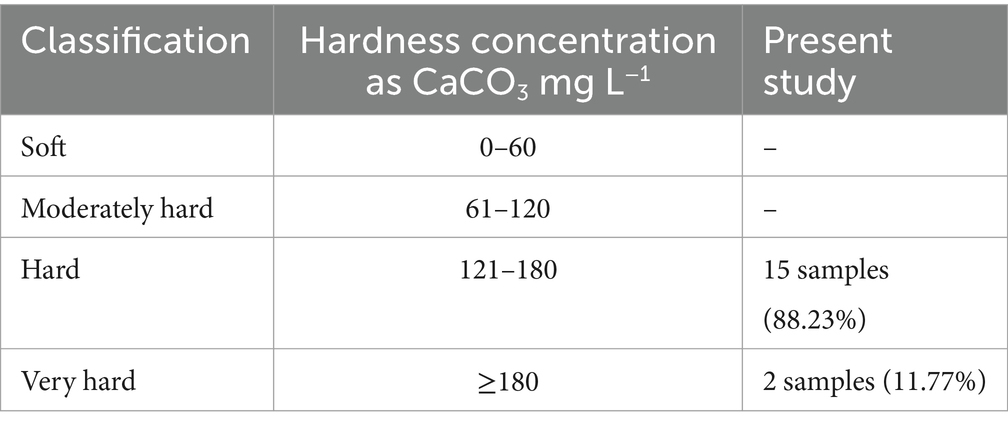
Table 4. Classification of water according to hardness (Hem, 1970).
Also, the suitability of water for agriculture depends upon many factors, such as effective salinity hazard, sodium adsorption ratio (SAR) (College of Agricultural Sciences, 2002; US Salinity Laboratory Staff (USSL), 1954), residual sodium carbonate (RSC) (Eaton, 1950), as listed in Tables 5, 6.

Table 5. Classification of irrigation water based on SAR values, College of Agricultural Sciences (2002) and US Salinity Laboratory Staff (USSL) (1954).
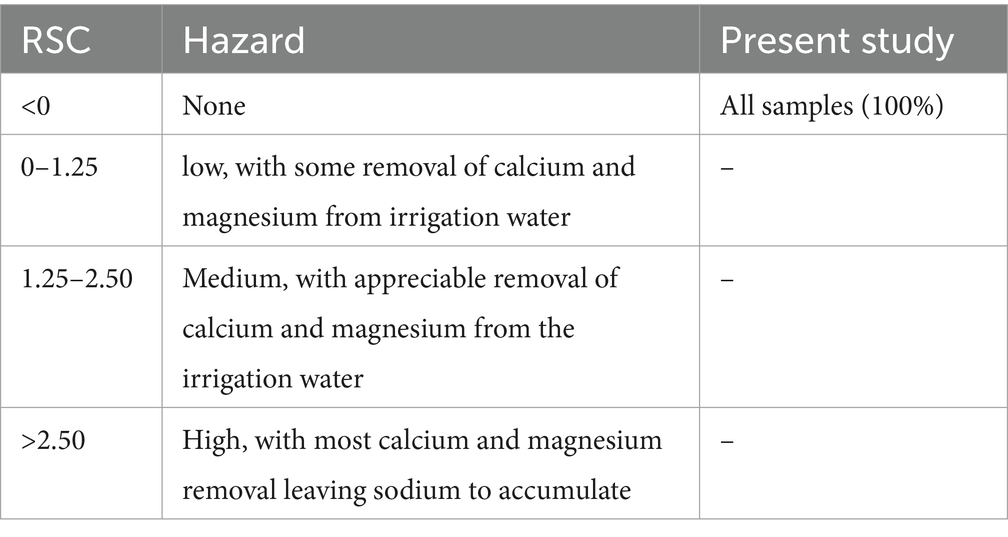
Table 6. Classification of irrigation water based on RSC values (Eaton, 1950).
3 Results
3.1 Hydrochemical classification
Rockwork and Excel programs are used to examine the chemical composition of collected samples, with the aim of understanding their hydrochemical properties. The diagram provides a visual representation of the results (Piper, 1944; Stiff, 1951; Schoeller, 1962). The chemical composition of the groundwater in the area was examined using the Schoeller diagram, constructed using Excel software version 2016. By plotting the data on this diagram, a comparison of the major ion analyses, especially for groundwater samples with high salinity, can be facilitated. The resulting chemical data are shown in Figure 2A, with the chemical analysis of the groundwater samples represented in equivalents per million (meq/L). One of the advantages of this diagram over the more commonly used trilinear diagram is that it provides the actual concentrations of the parameters. Major ions are represented on the graph by straight lines connecting the different ions, and if these lines have approximately equal slopes, this indicates an identical relationship between the correlated analyses. According to this diagram, the following general patterns were recognized: Na+ > Cl− > SO42− > Ca2+ > Mg2+ > HCO3−, this reflects a high concentration of sodium, chloride, and sulfate ions, indicating that the dominant salts are sodium chloride and sodium sulfate. Several factors can be attributed to these high concentrations of sodium, calcium, magnesium, potassium and other ions in the groundwater of the study area. From a geological perspective, the high ion concentrations in the groundwater could be caused by the dissolution of minerals such as halite, gypsum, calcite, dolomite, feldspars and micas. Long-term water-rock interaction, especially for deeper aquifers such as the Nubian Sandstone, increases the dissolution of minerals and increases the ion concentration. High evaporation rates in this low-precipitation region tend to further concentrate dissolved ions, mainly sodium and chloride. Anthropogenic activities such as agricultural runoff containing fertilizers and improper disposal of industrial and domestic wastewater add large amounts of potassium and magnesium. The hydrochemical processes involved include cation exchange, whereby sodium replaces calcium and magnesium in the aquifer matrix, reshaping the chemical composition of this groundwater. All these factors therefore combine to explain the variations in ion concentrations observed in the study area.
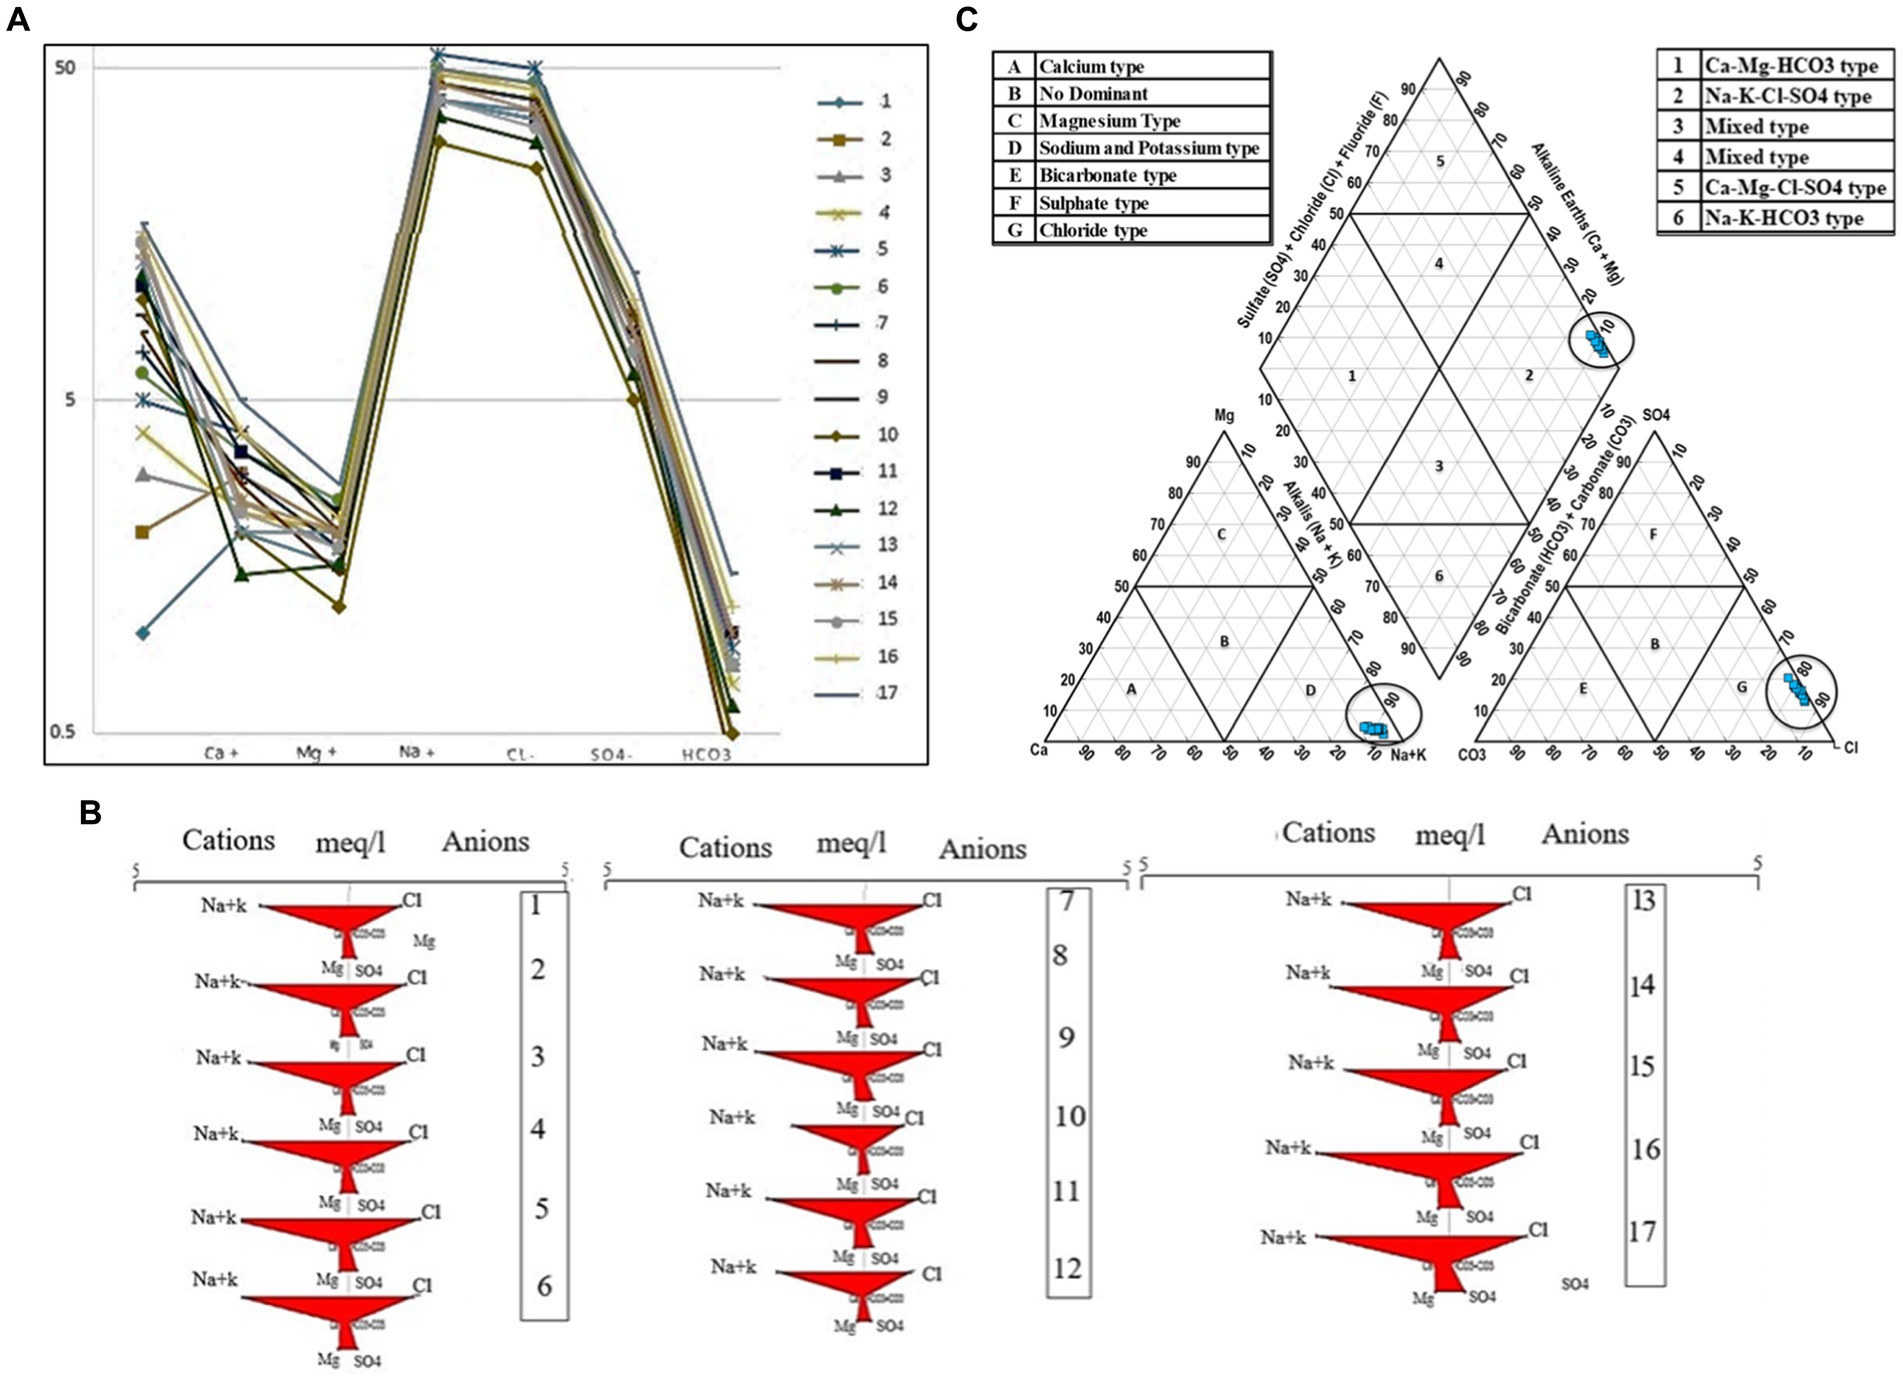
Figure 2. (A) Semi-logarithmic representation (Schoeller Diagram). (B) Stiff Diagram. (C) Piper triangle diagram of groundwater samples in the study area.
In the Stiff plot, TDS values of groundwater samples are plotted on the horizontal axes at constant intervals. The plotted dots form a distinctive pattern that reflects the composition of the representative sample. By examining the resulting polygon, we can identify similarities or differences in overall water chemistry. The width of the polygon serves as an approximation of the total ion content. Based on the plotted results, it can be inferred that the proximity of groundwater samples is determined by the prevalence of sodium cations and chloride anions (Figure 2B).
Cations and anions are shown separately in ternary plots in the Piper diagram. The peaks of the anion plot represent sulfate, chloride, and carbonate anions as well as hydrogen carbonate anions, while the peaks of the cation plot represent calcium, magnesium, and sodium as well as potassium cations. These two ternary plots are then projected onto a diamond, which is a mathematical transformation of a graph representing anions (sulfate + chloride/total anions) and cations (sodium + potassium/total cations). Typically, water samples located in the upper triangle exhibit secondary salinity characteristics, where sulfate and chloride levels exceed those of sodium and potassium. Conversely, samples found in the lower triangle indicate primary alkalinity properties, with higher levels of calcium and magnesium than carbonates and bicarbonates. In the current investigation, the anion triangular zone in the Piper diagram reveals that approximately 100% of the groundwater samples are in the chloride zone. On the other hand, the cation triangular area of the Piper diagram shows that all the groundwater samples belong to the sodium and potassium categories. The data represented as a diamond of the Piper diagram indicates that all samples belong to the Sodium–Potassium–Chloride–Sulfate category in the specified area (Figure 2C). The diagrams indicate that the groundwater chemistry of the region is primarily influenced by the dissolution and alteration of silicate and sulfate minerals.
3.2 Hadrochemical facies and water types
Based on the levels of cations and anions found in groundwater samples from the research site, the predominant orders of ions and resulting chemical classifications are as follows. The hydrochemical composition indicates that sodium chloride is the main water type in the study area. In terms of cation and anion sequence, all groundwater samples are classified in the order Na+ > Ca2+ > Mg2+ > K+/Cl− > SO42− > HCO3−, as detailed in Table 7. In the study area, the main water type is sodium chloride, as indicated by the hydrochemical composition. The cations and anions in the groundwater samples follow a specific order, with Na+ > Ca2+ > Mg2+ > K+/Cl− > SO42− > HCO3− being the sequence observed in all samples, as presented in Table 7.

Table 7. Ion’s dominance sequences and groundwater type in the study area.
3.3 Groundwater quality
3.3.1 Groundwater quality for drinking purposes
Tables 8, 9 and Figures 3A–C, 4A–C present the results of the analysis performed on groundwater samples, including ion concentrations and distribution maps of the chemical analysis results. These results comply with the standards set by Egyptian regulations and the World Health Organization (WHO) for the quality of drinking water. pH levels are between 7.5 and 8, indicating a slightly acidic to slightly alkaline nature, which corresponds to the recommended pH range of 6.5–8.5 by Egyptian standards and those of the WHO. However, the range of electrical conductivity (EC) values recorded was between 3,600 and 13,800 μS/cm, exceeding the permissible limits for drinking water, as defined by WHO and Egyptian guidelines. The total dissolved solids (TDS) ranged from 2,304 mg/L at well sample no. 8 to 8,832 mg/L at well sample no. 17. The TDS distribution map in the area d of the study reveals an increase toward the southern part of the wadi, with the salinity of the QAS being higher than that of the NSAS. This southward increase in salinity can be attributed to the direction of groundwater flow in this area, indicating the influence of leaching effects from aquifers and potentially continued recharge by precipitation. By the standards set by Egyptian and WHO regulations, none of the groundwater samples analyzed meet acceptable TDS levels for drinking water. Additionally, the total hardness (TH) of groundwater samples exceeds 120 mg/L, making the groundwater unsuitable for drinking. Sodium levels in the area ranged between 690 and 1,265 mg/L (highest in Well 5), exceeding acceptable limits for drinking water. It should be noted that sodium concentrations increased downstream, indicating the presence of water-soluble alkalis. In the QAS, sodium levels steadily increased northward, while in the NSAS, they peaked further south. Calcium concentrations generally remained within drinking water limits, ranging from 40 to 100 mg/L (highest in well 17). Unlike sodium, calcium levels showed an increase from north to south in both aquifers, peaking at the southernmost point. The magnesium content, naturally present in groundwater due to interactions between clays and minerals, varied between 14.64 and 34.16 mg/L (highest in well 17). It is interesting to note that the distribution of magnesium followed the direction of the flow, increasing toward the north in the QAS and toward the south in the NSAS. Bicarbonate levels were within the acceptable range for drinking water, ranging from 24.4 to 91.5 mg/L (highest in Well 17), with a southward increase observed in both aquifers and a general decrease in the northern region. Chloride levels in the area ranged from 887.5 mg/L (well no. 10) to 1775 mg/L (well no. 5), while sulfate levels ranged from 240 mg/L (well no. 10) to 576 mg/L (well no. 17). Chloride concentrations showed a clear trend: increasing southward in the QAS and northward in the NSAS. Sulfate content followed a similar trend, reflecting the salinity levels of each aquifer. According to standard limits for drinking water, all groundwater samples from the study area are deemed unfit for consumption. Dissolution and weathering of silicate and sulfate minerals in the study area are the main processes that determine groundwater chemistry. Silicate minerals, mainly feldspar and quartz, and sulfate minerals such as gypsum are abundant in these geological formations: sandstone, shale, and carbonate rocks. Weathering of feldspar, a potassium and aluminum silicate, contributes K+, Ca2+, and Mg2+ ions to the groundwater, resulting in high concentrations of these elements and increased water hardness. Similarly, dissolution of gypsum (CaSO4) and other sulfate minerals in the Nubian aquifer leads to high levels of calcium (Ca2+) and sulfate (SO42−), further influencing water mineralization. These processes lead to higher TDS and hardness, making the water less suitable for drinking but possibly suitable for irrigation, particularly for salt-tolerant crops. Greater interaction of groundwater with these rocks in the deeper Nubian aquifer leads to higher mineral content compared to the shallower Quaternary aquifer; this explains the variation in groundwater quality across the region.
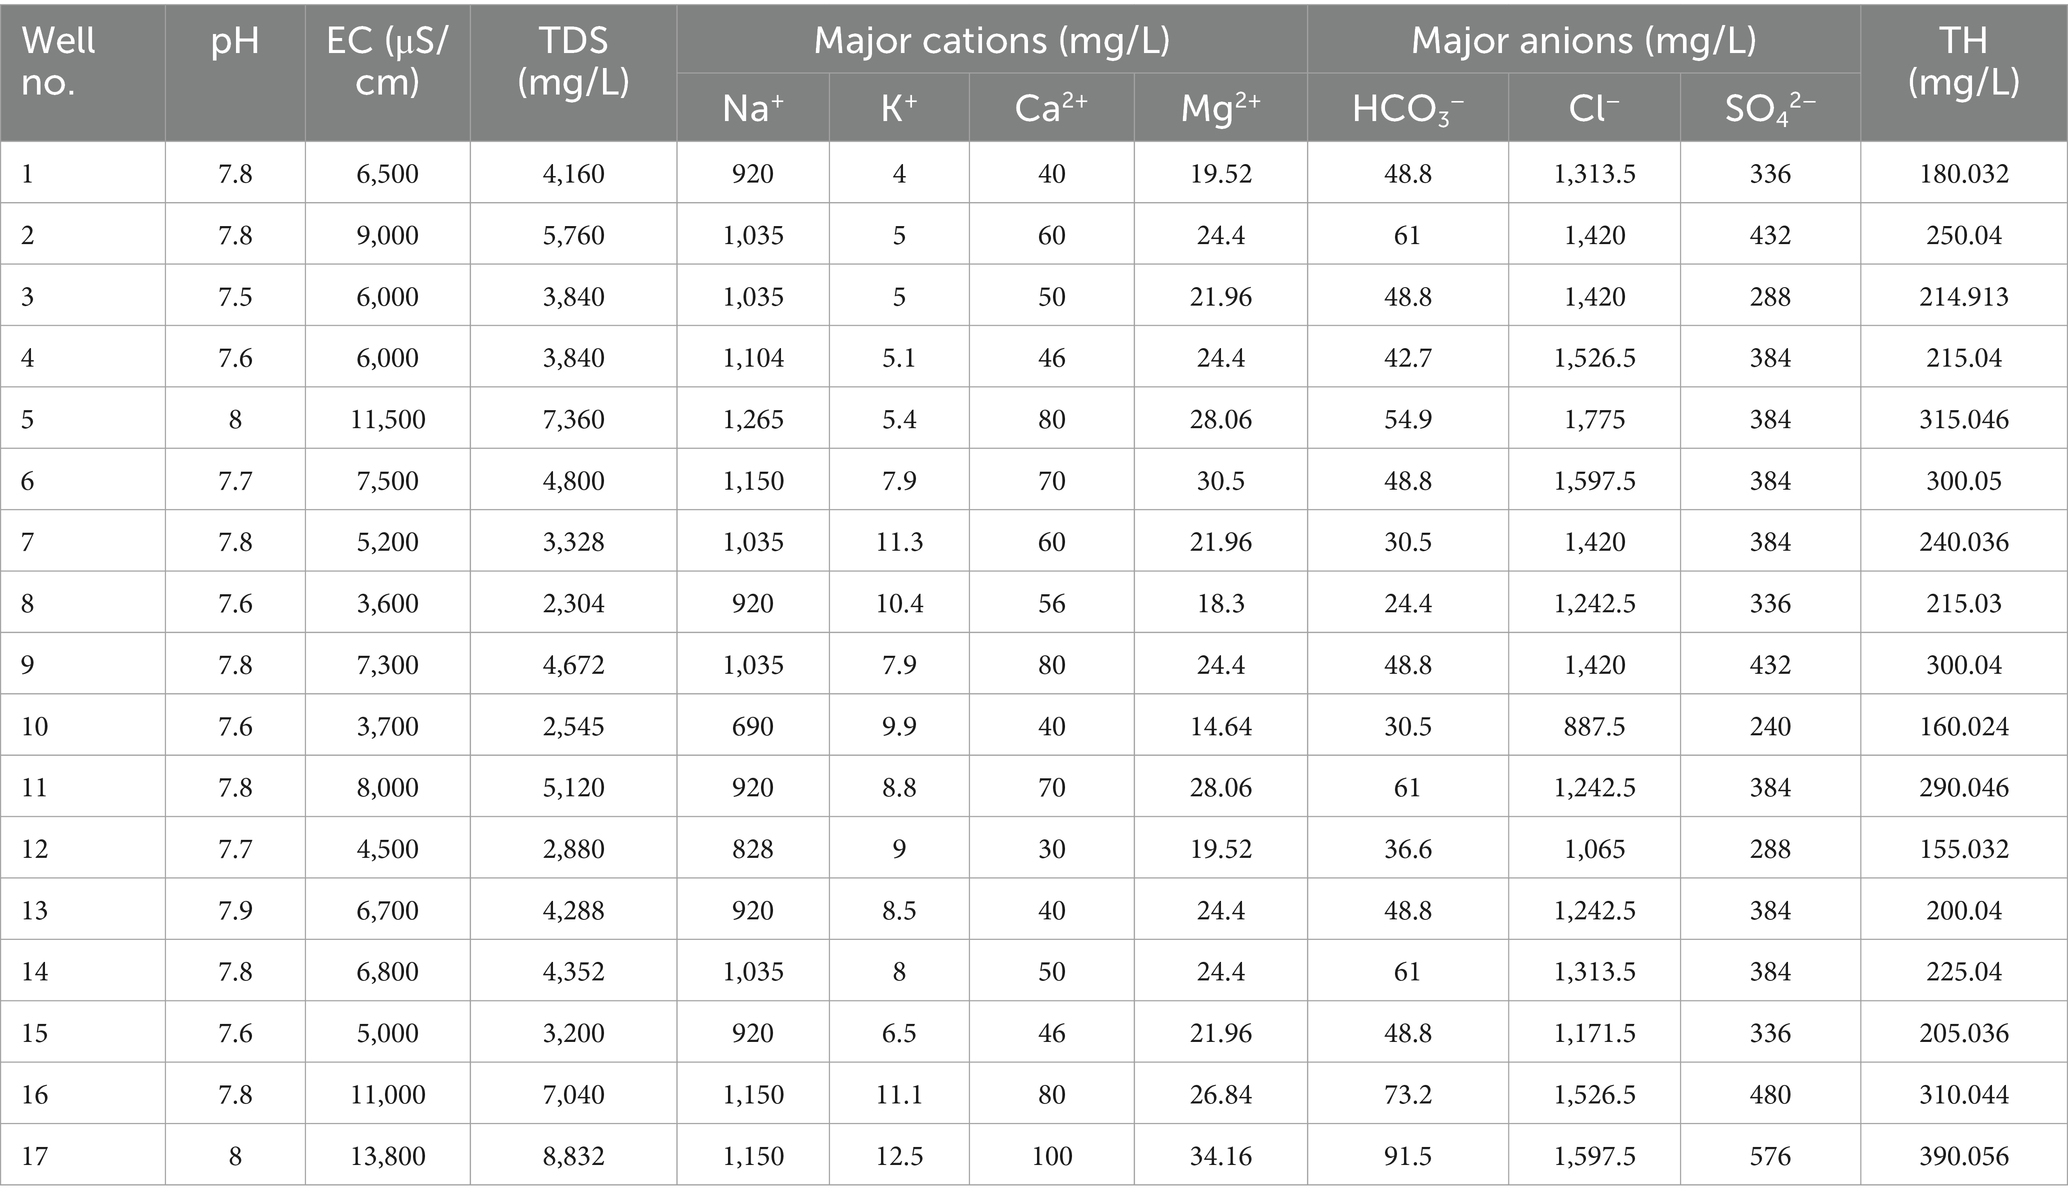
Table 8. Chemical analyses of the groundwater samples in the study area.
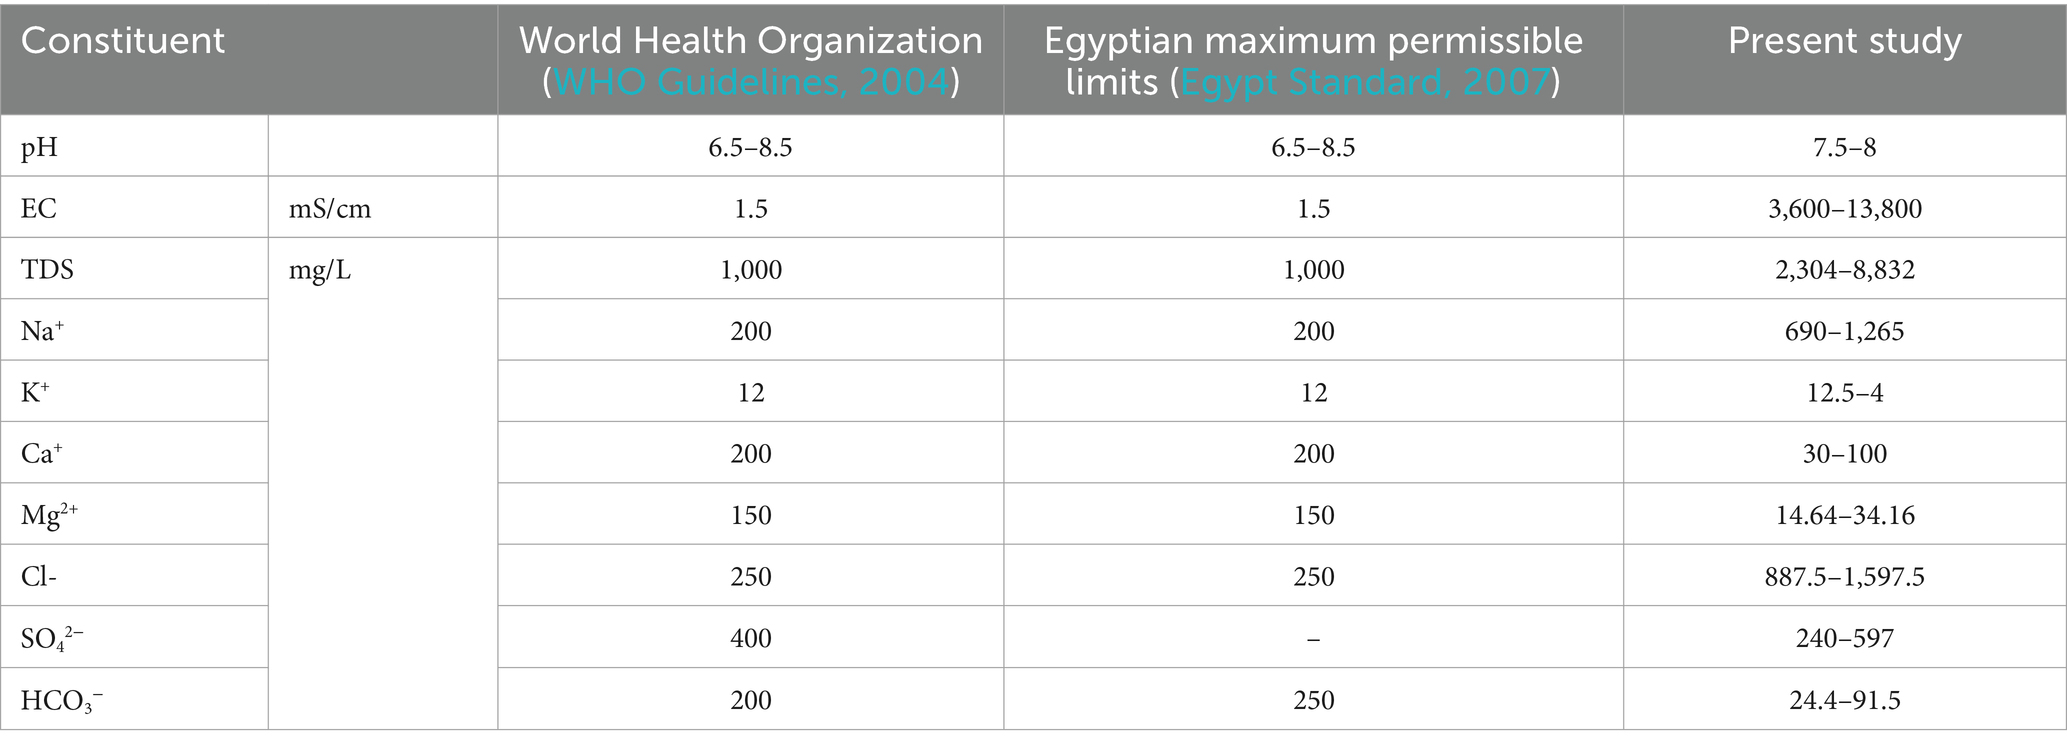
Table 9. The maximum acceptable concentration for drinking water according to WHO Guidelines (2004) and Egypt Standard (2007).
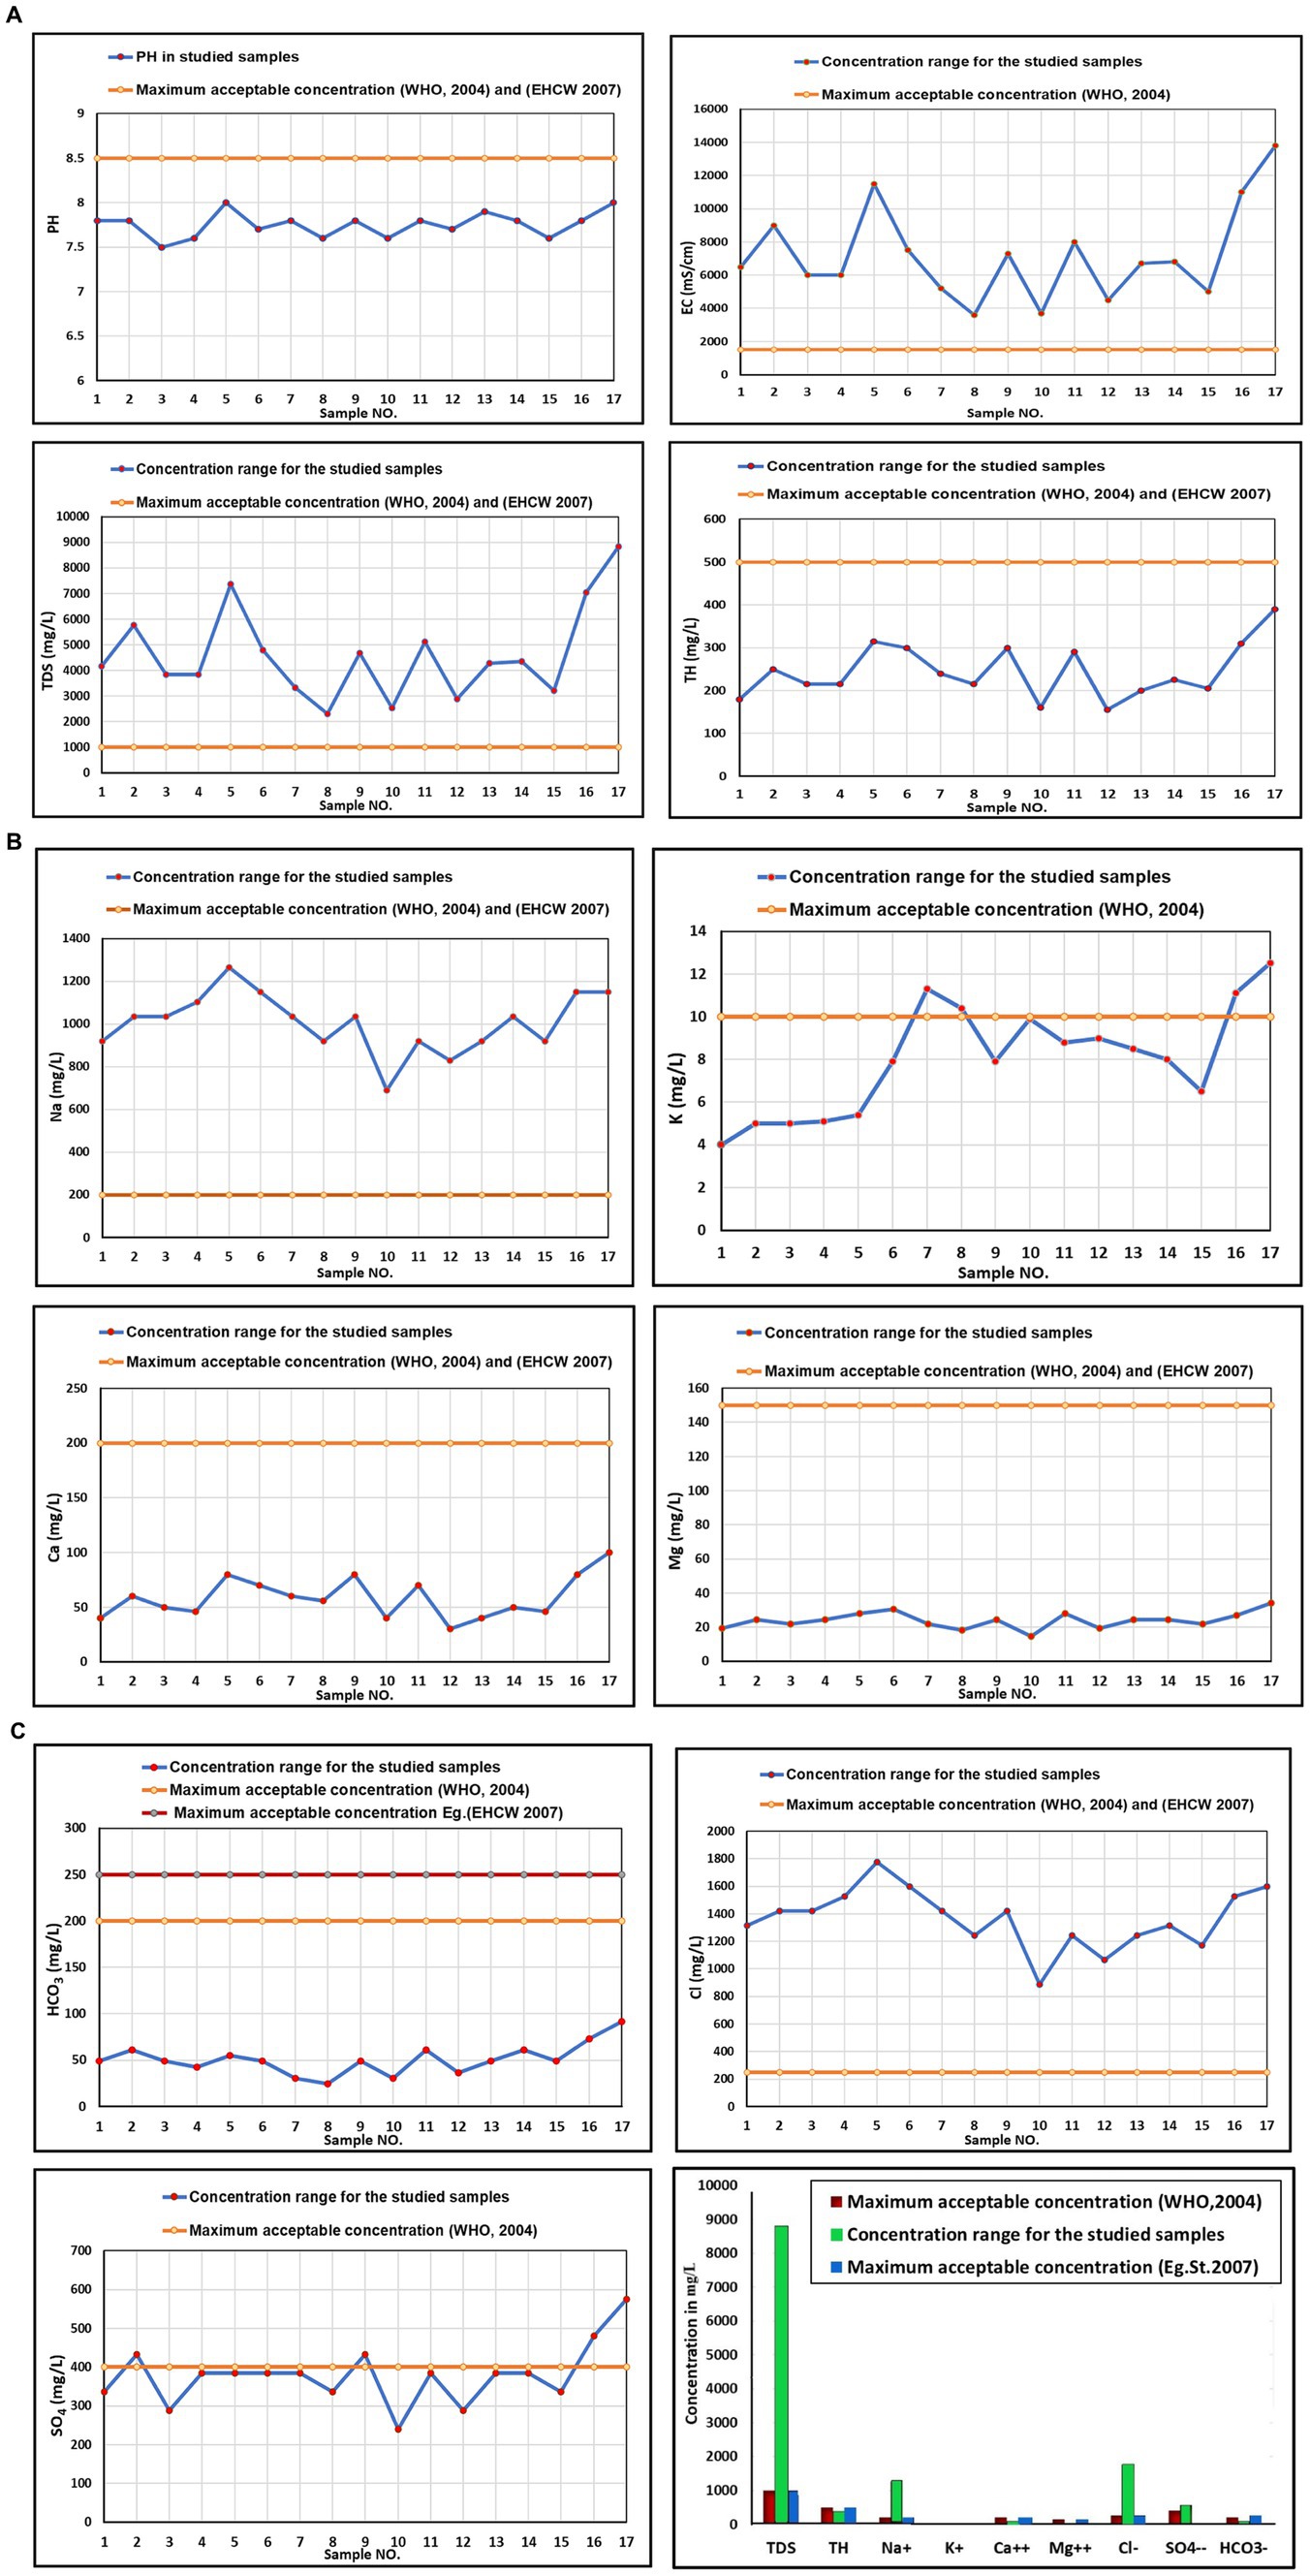
Figure 3. (A) pH, EC, TDS, and TH values. (B) Major ion (cations) concentrations. (C) Major ion (anions) concentrations in the groundwater samples, along with their comparison to WHO (WHO Guidelines, 2004) and EHCW (Egypt Standard, 2007) standards.
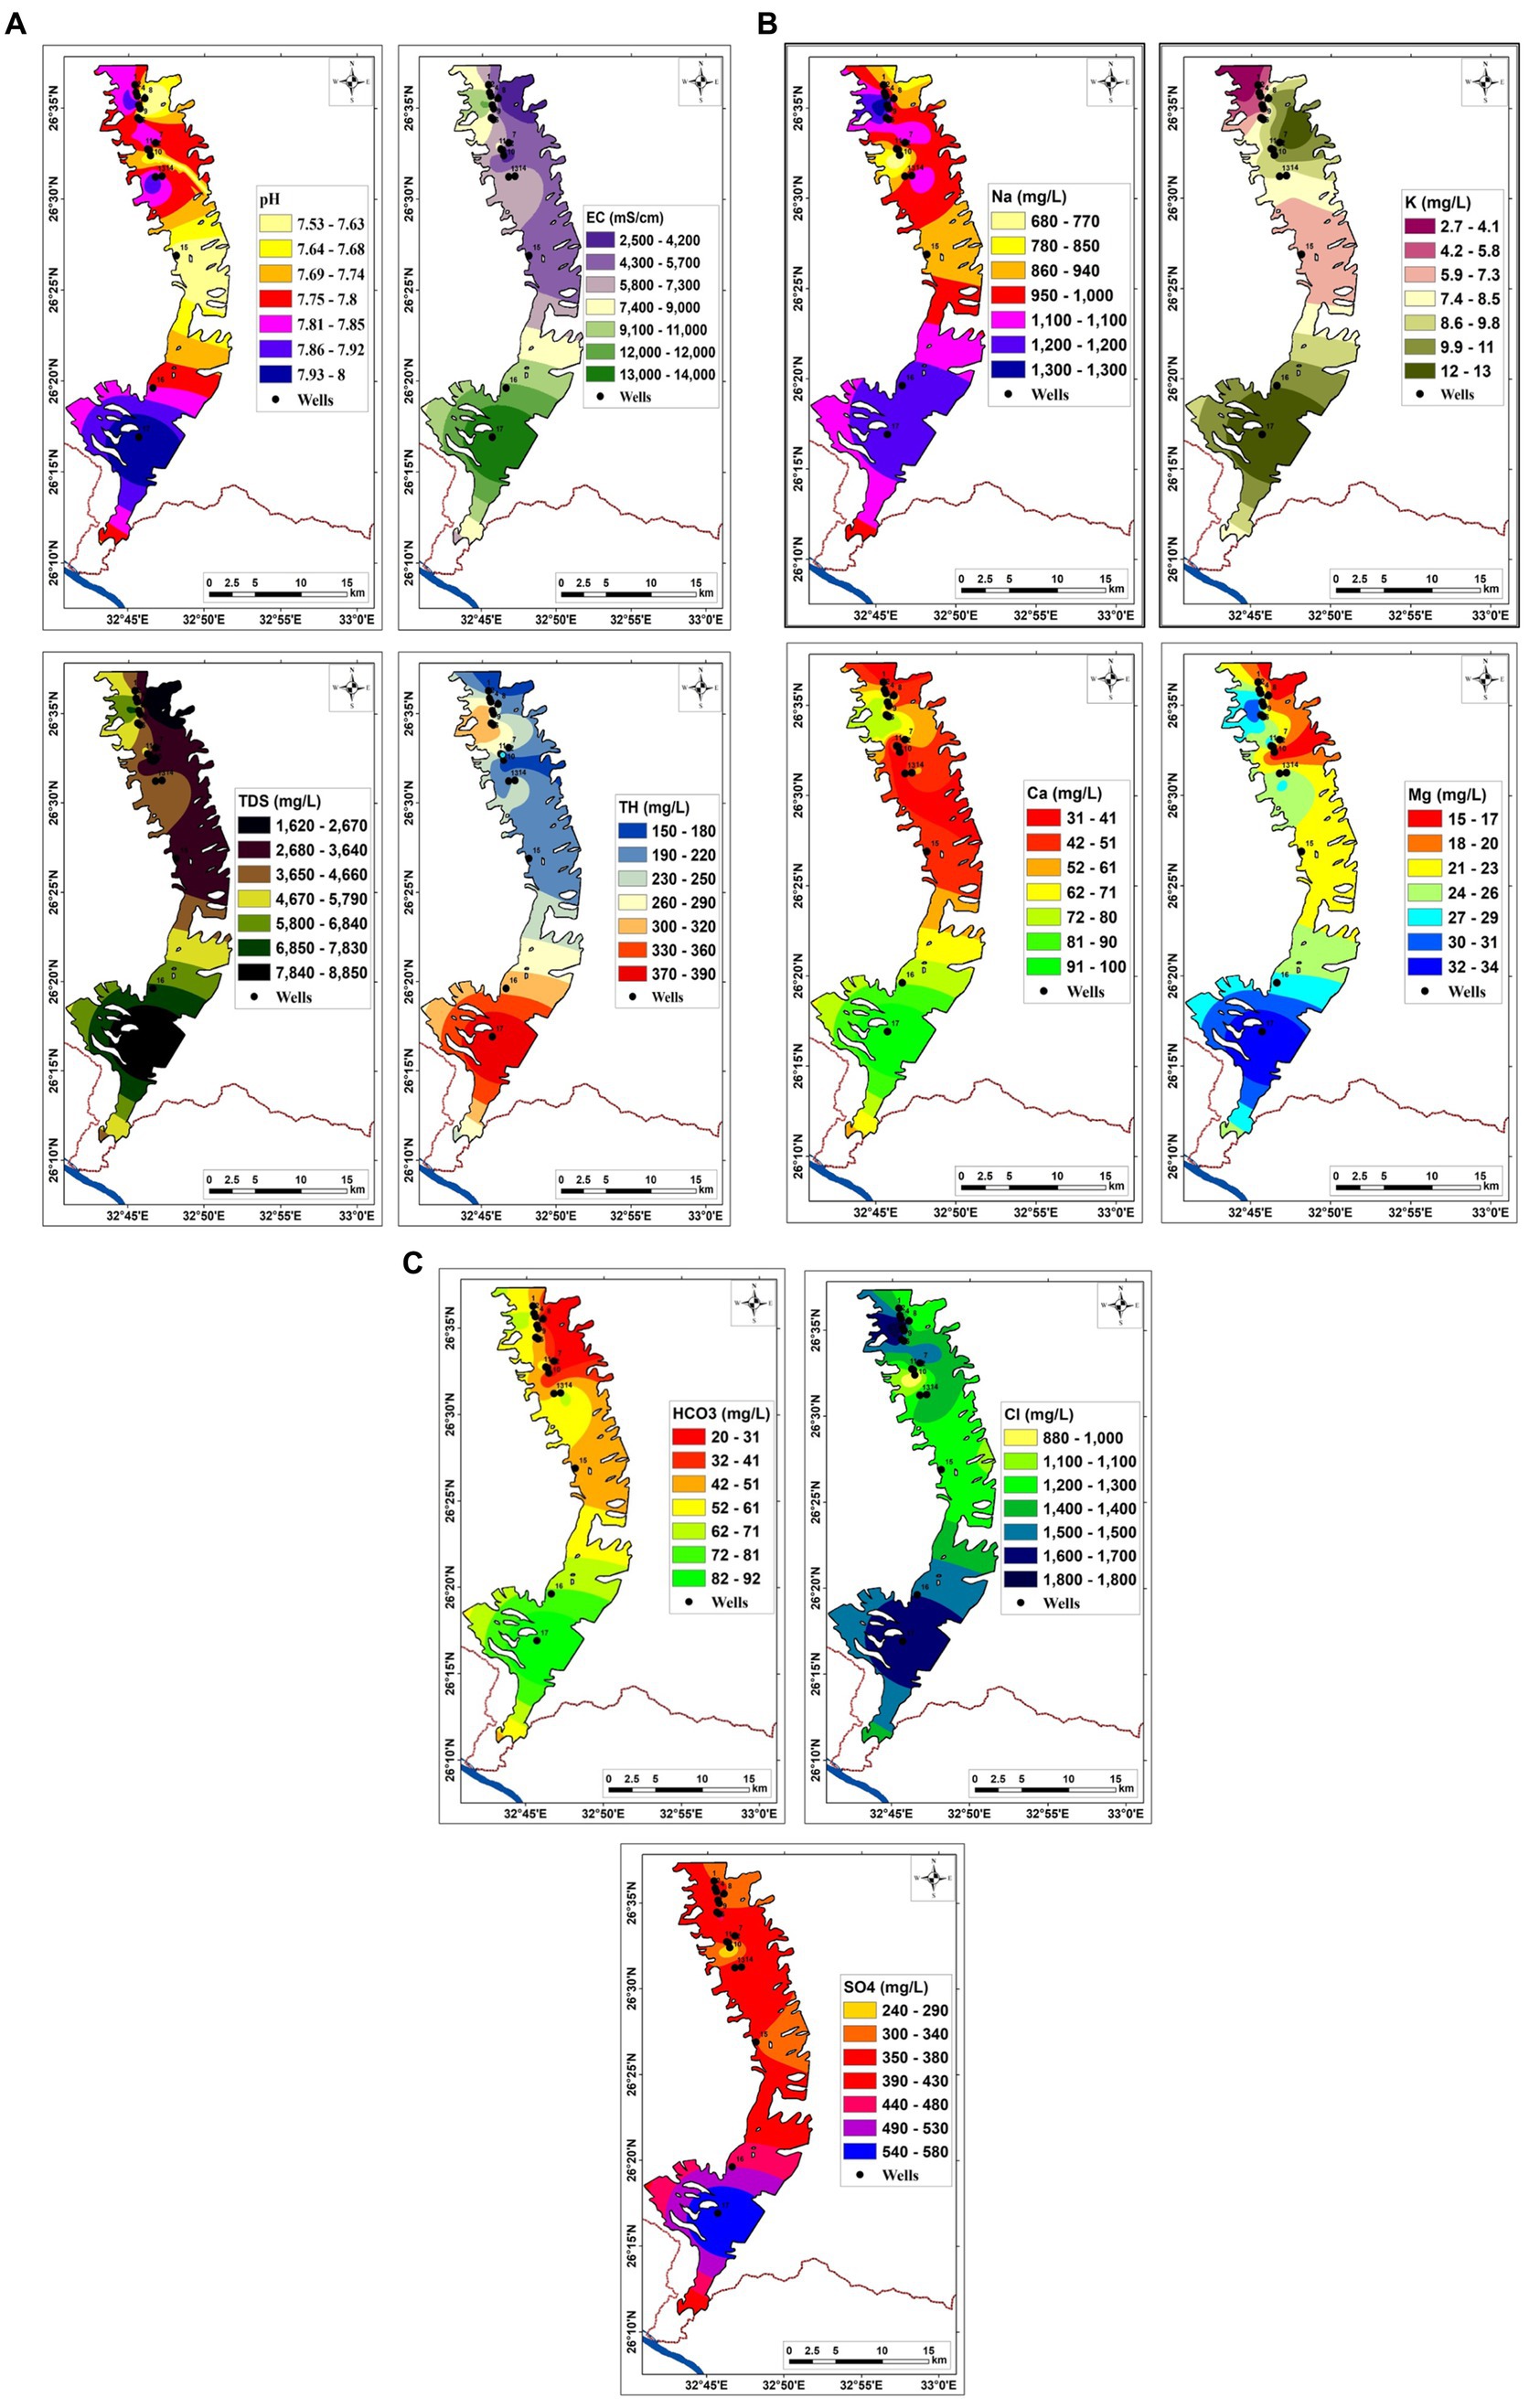
Figure 4. (A) Distribution maps of pH, EC, TDS, and TH. (B) Distribution maps of major ions (cations) concentrations. (C) Distribution maps of major ions (anions) concentrations of the groundwater samples in the study area.
3.3.2 Groundwater quality for irrigation purposes
3.3.2.1 Sodium adsorption rate (SAR)
The composition of minerals presents in water impacts soil structure and permeability, which has an indirect effect on plant growth. The suitability of groundwater for irrigation can be assessed using the sodium adsorption rate (SAR), which is determined by the concentration of dissolved solids in the groundwater. Table 10 classifies irrigation water into four main categories based on SAR values. In the case of the groundwater samples studied, the SAR values range from 23 to 32, as shown in Table 11. Figure 5 illustrates the spatial arrangement of the SAR and RSC values of the samples collected at the research site. According to the SAR index, most water samples are considered unsuitable for irrigation. The RSC index, which assesses soil alkalinity risk, was used for irrigation water and soil water assessments (Eaton, 1950; Das and Nag, 2015) categorized irrigation water based on its carbonate and bicarbonate content, introducing the residual value of sodium carbonate as a measure of the relationship between concentrations of bicarbonate, carbonate, calcium, and magnesium in water (meq/L).
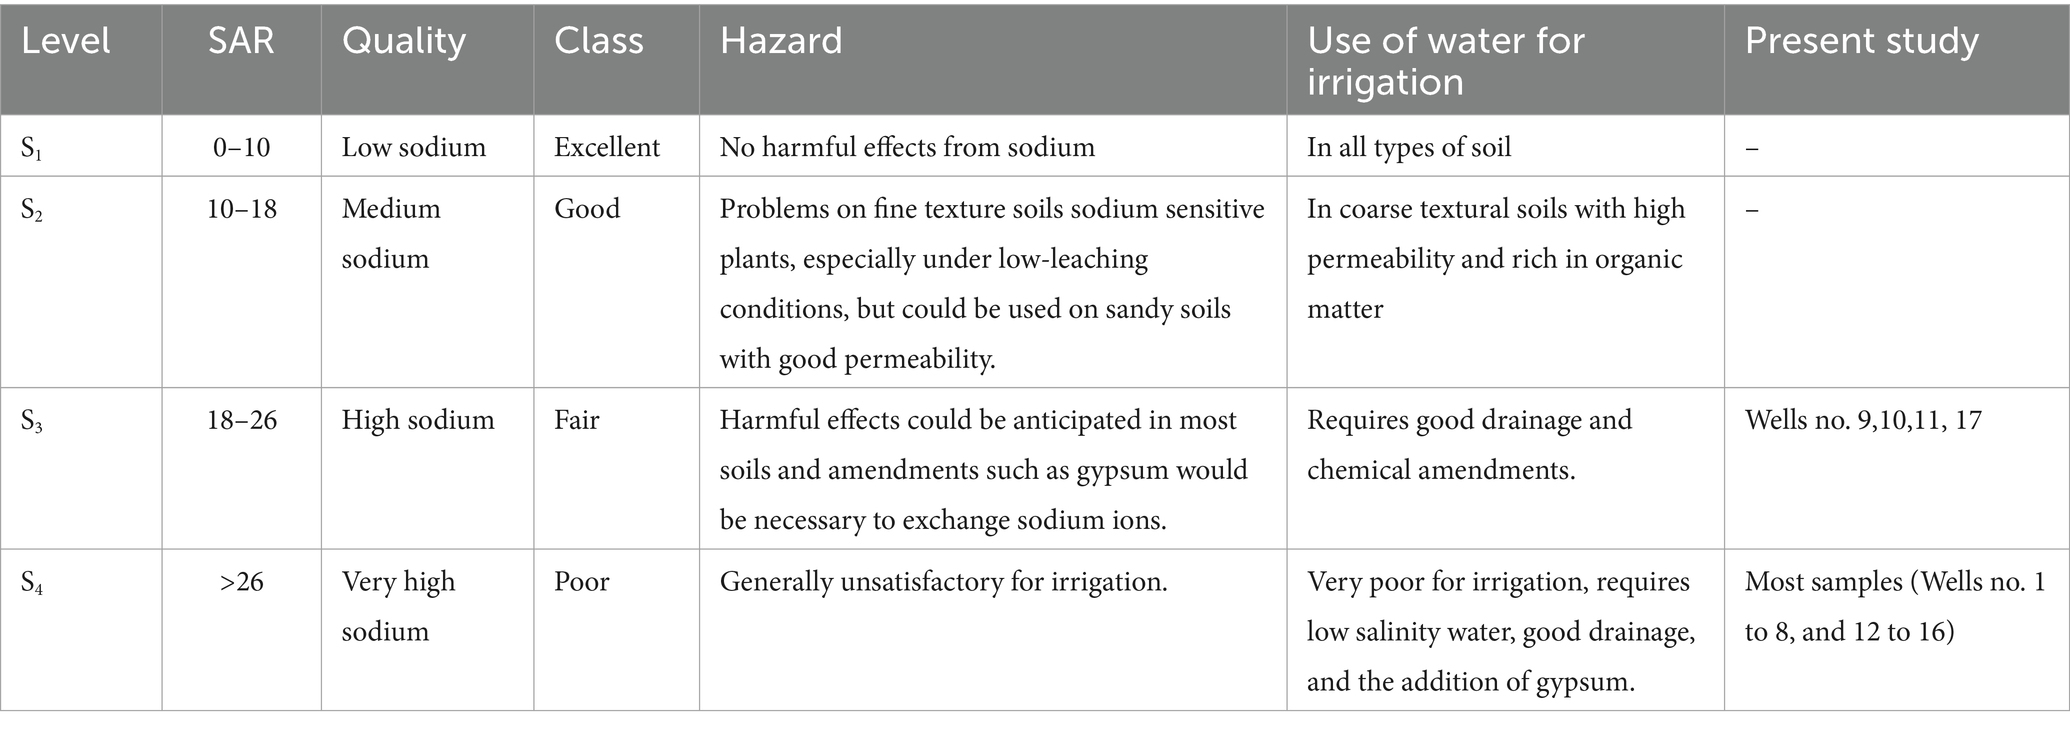
Table 10. Irrigation water classes according to SAR.
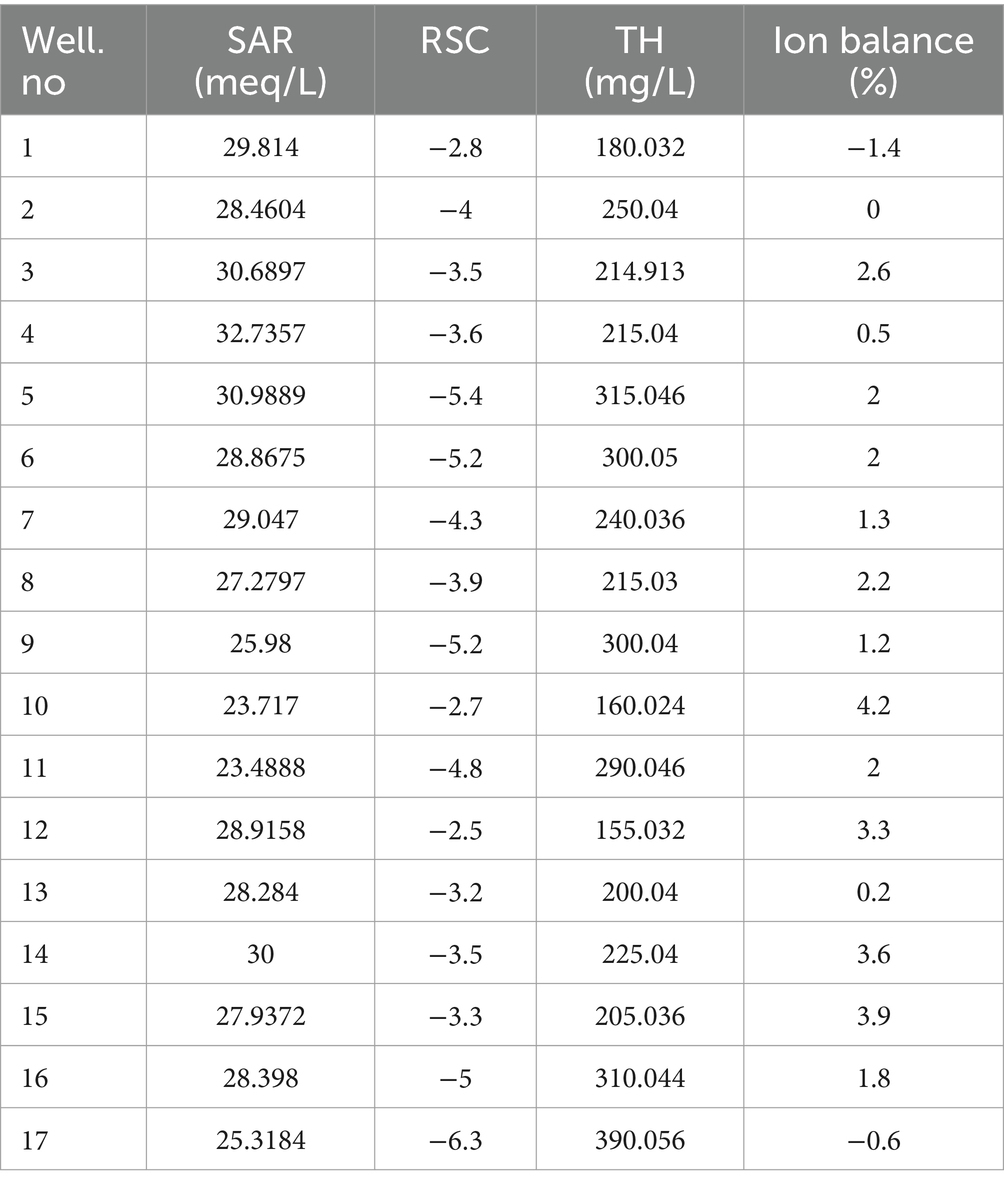
Table 11. SAR, RSC, and TH for groundwater samples in the study area.
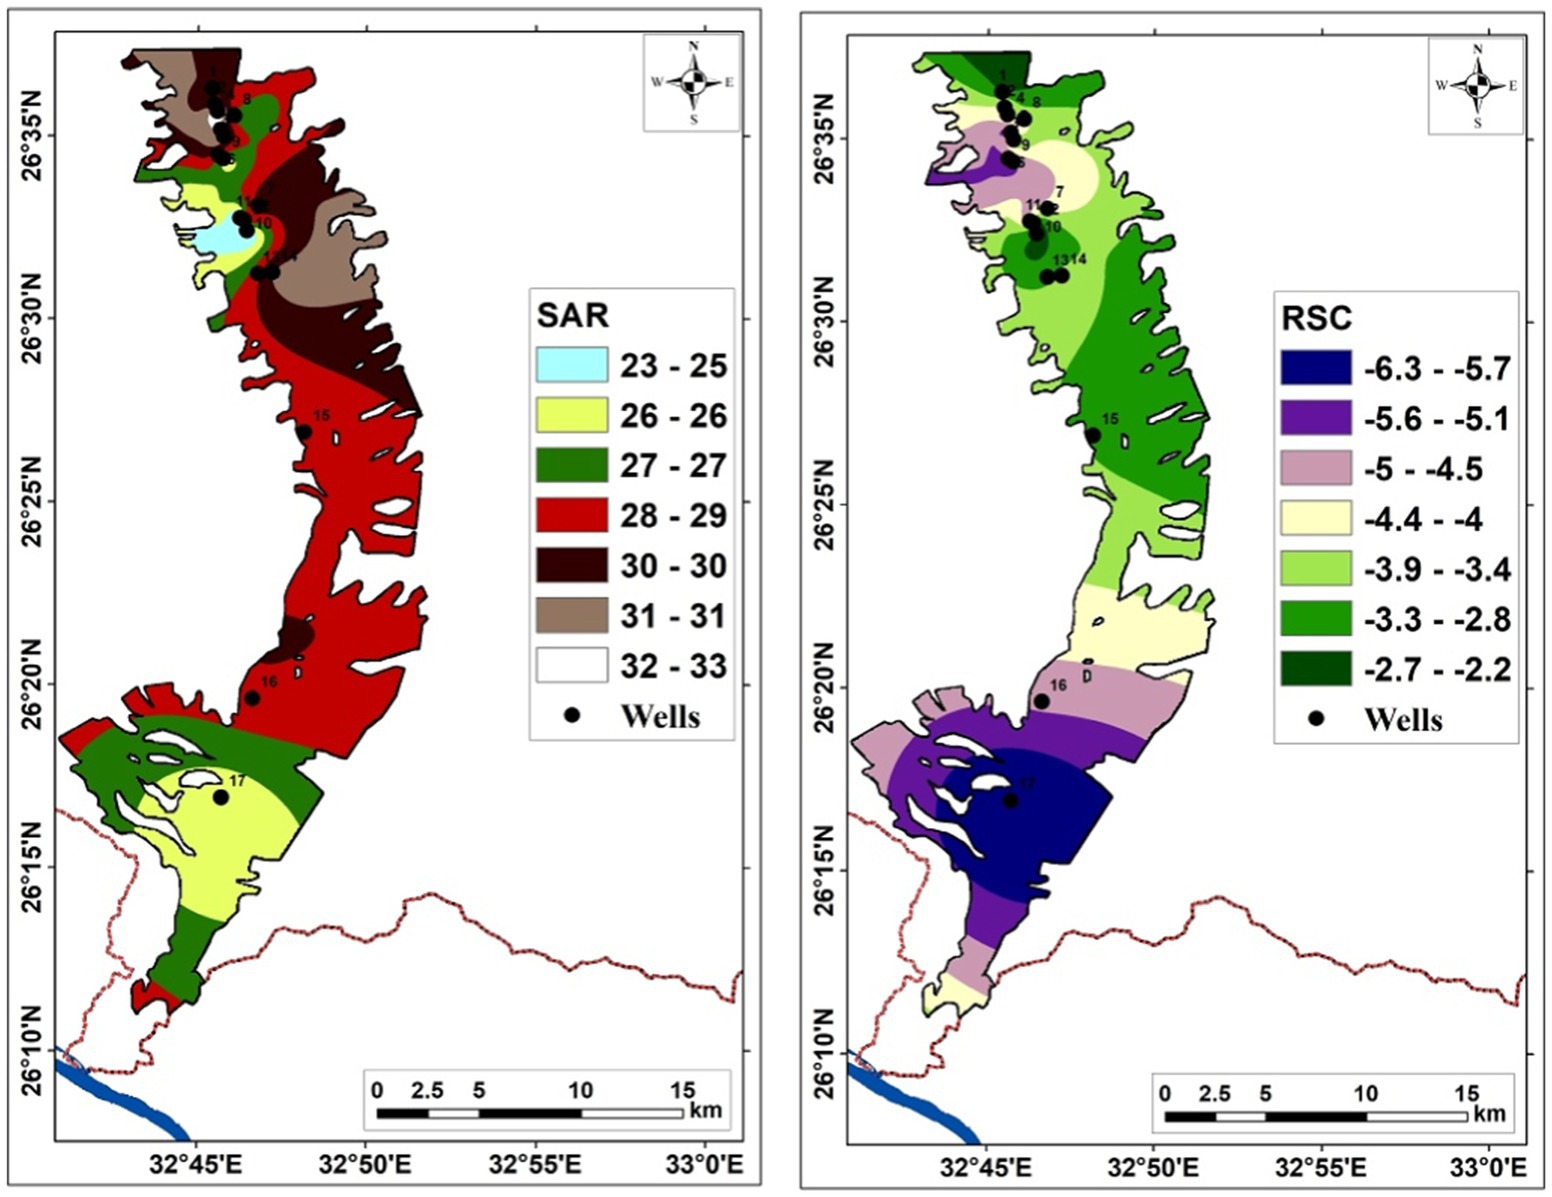
Figure 5. SAR, and RSC distribution maps in the study area.
3.3.2.2 Residual sodium carbonate (RSC)
The RSC values calculated for groundwater samples from the studied area vary from −2.5 to −6.3 meq/L (Table 11). This range suggests that the water quality is excellent, safe, and suitable for irrigation purposes, according to the RSC index. Irrigation water quality standards established by US Salinity Laboratory Staff (USSL) (1954) and Wilcox (1955) are used to assess water quality effectively and efficiently through graphical representation of irrigation water quality.
3.3.2.3 Chemical analysis
The EC and SAR values of the groundwater samples are plotted on the Wilcox plot using Excel 2016 software (Figure 6). The classification of groundwater samples belongs to category (S4C4), indicating that the water is generally unsuitable for irrigation under normal circumstances but can be used occasionally under specific conditions. To use this water source, the soil must be permeable, adequate drainage must be ensured, excessive irrigation must be applied to allow leaching, and crops with high salt tolerance must be selected.
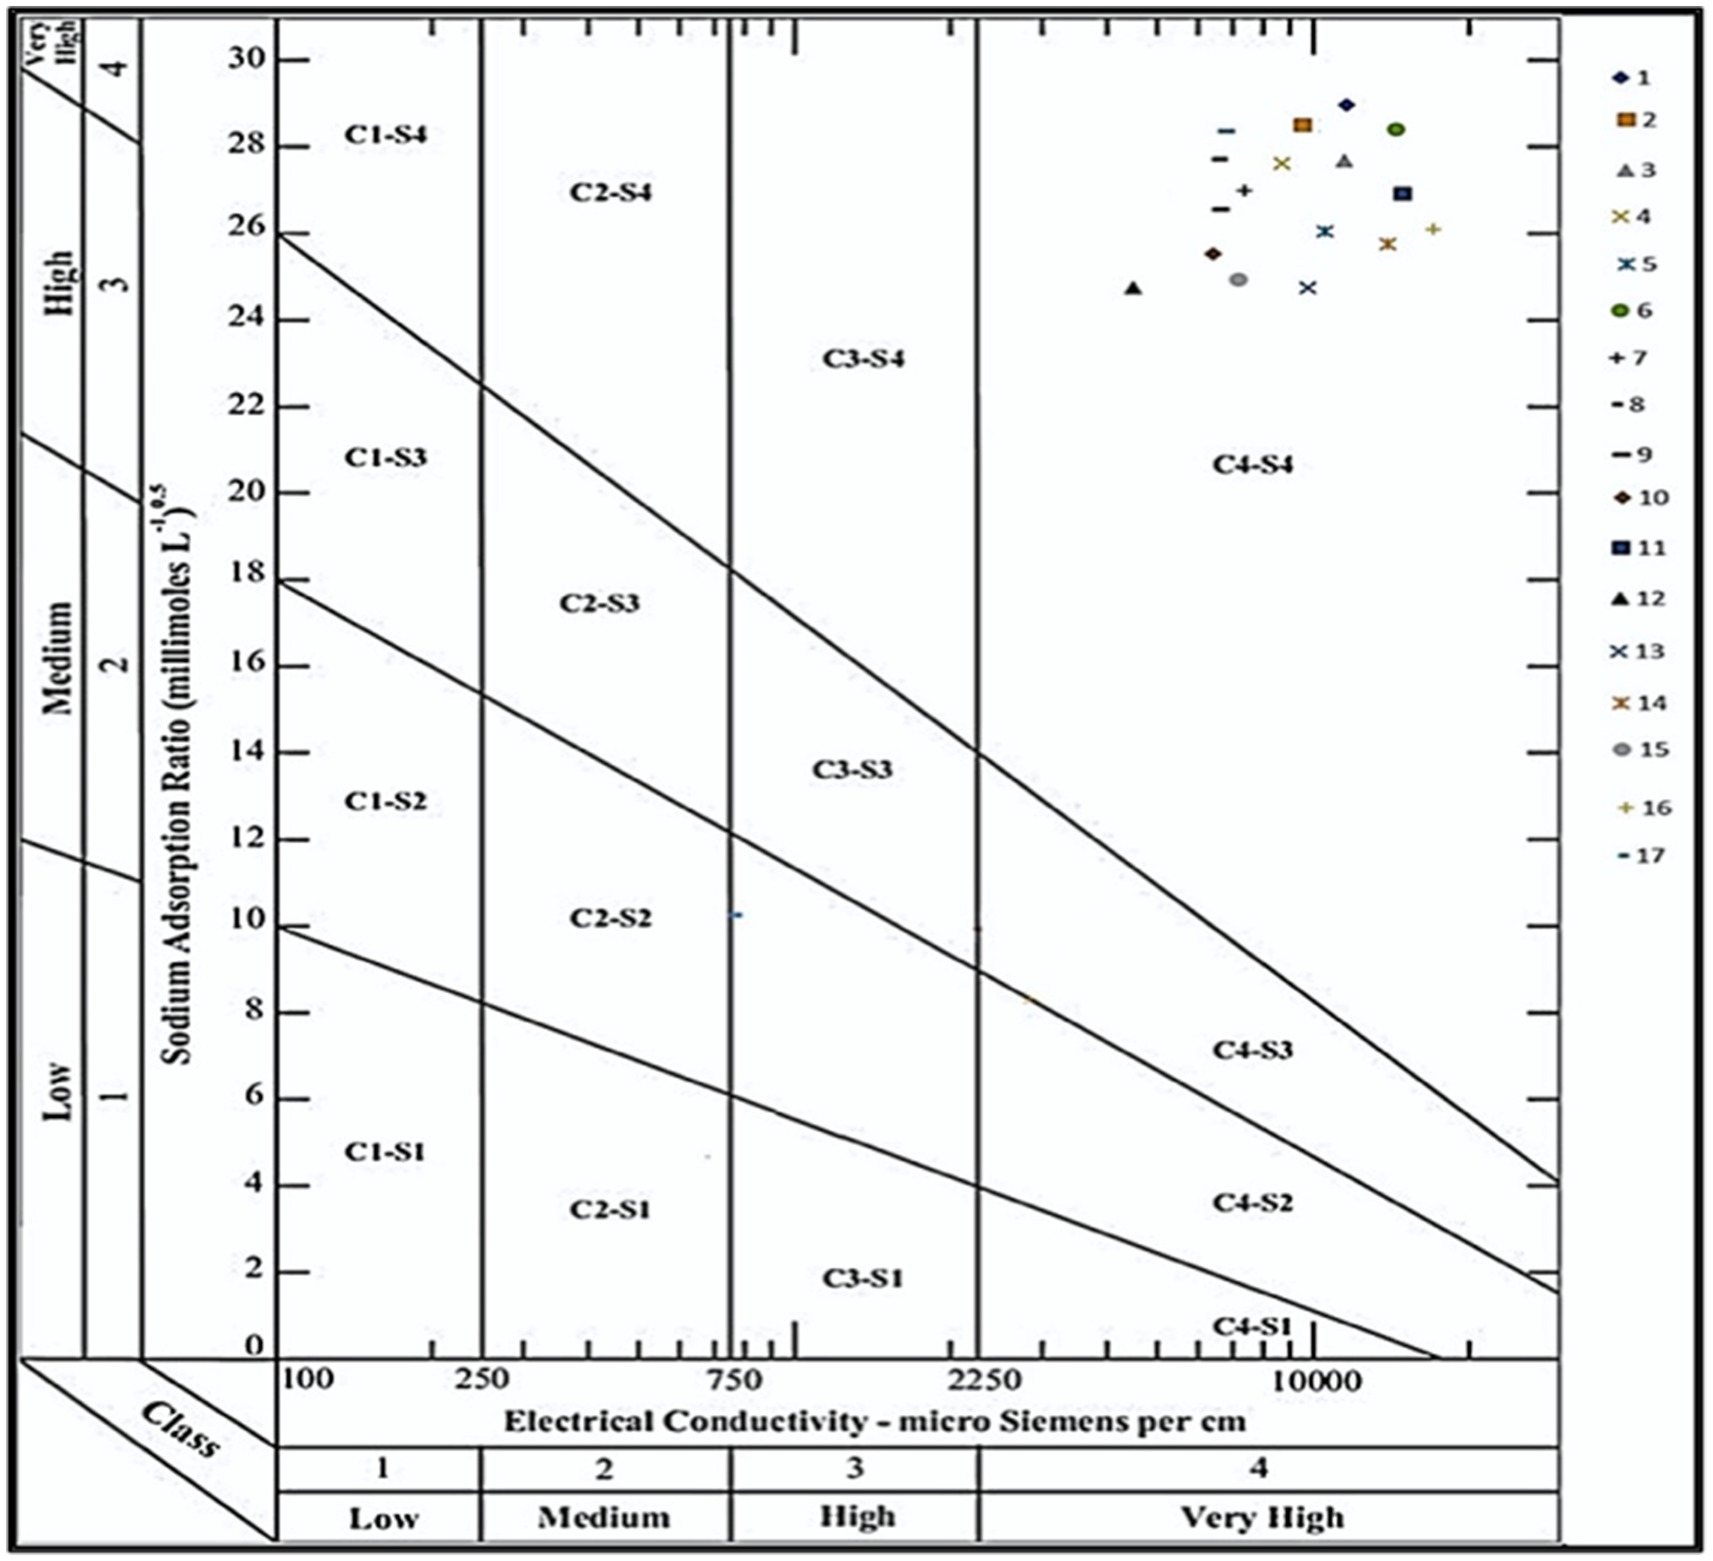
Figure 6. Groundwater suitability for irrigation for groundwater samples according to U.S. Lab. Classification.
3.3.2.4 Sodium percentage (Na%)
The soluble sodium content of water, denoted Na%, serves as a parameter that reveals sodium risk and determines the suitability of water for irrigation purposes. The interaction between soil and sodium results in a reduction in soil permeability (Wilcox, 1955). Soil alkalinity results from high levels of sodium present in irrigation water, causing calcium and magnesium to be displaced by sodium. As a result, soil permeability decreases, leading to poor drainage (Collins and Jenkins, 1996). If the concentration of Na% in water exceeds 60%, the physical characteristics of the soil will be compromised (Porter and Marek, 2006). The groundwater in this study has a sodium percentage ranging from 86.5 to 92%. Based on the sodium percentage and electrical conductivity values of the samples in the specified area (as presented in Table 12) and their representation in the Wilcox diagram (Figure 6), it is evident that all samples d of the groundwater in the study area are not suitable for irrigation purposes. High sodium concentrations in groundwater can lead to an exchange of sodium with calcium (Ca2+) and magnesium (Mg2+) in the soil, resulting in reduced permeability and poor soil drainage.
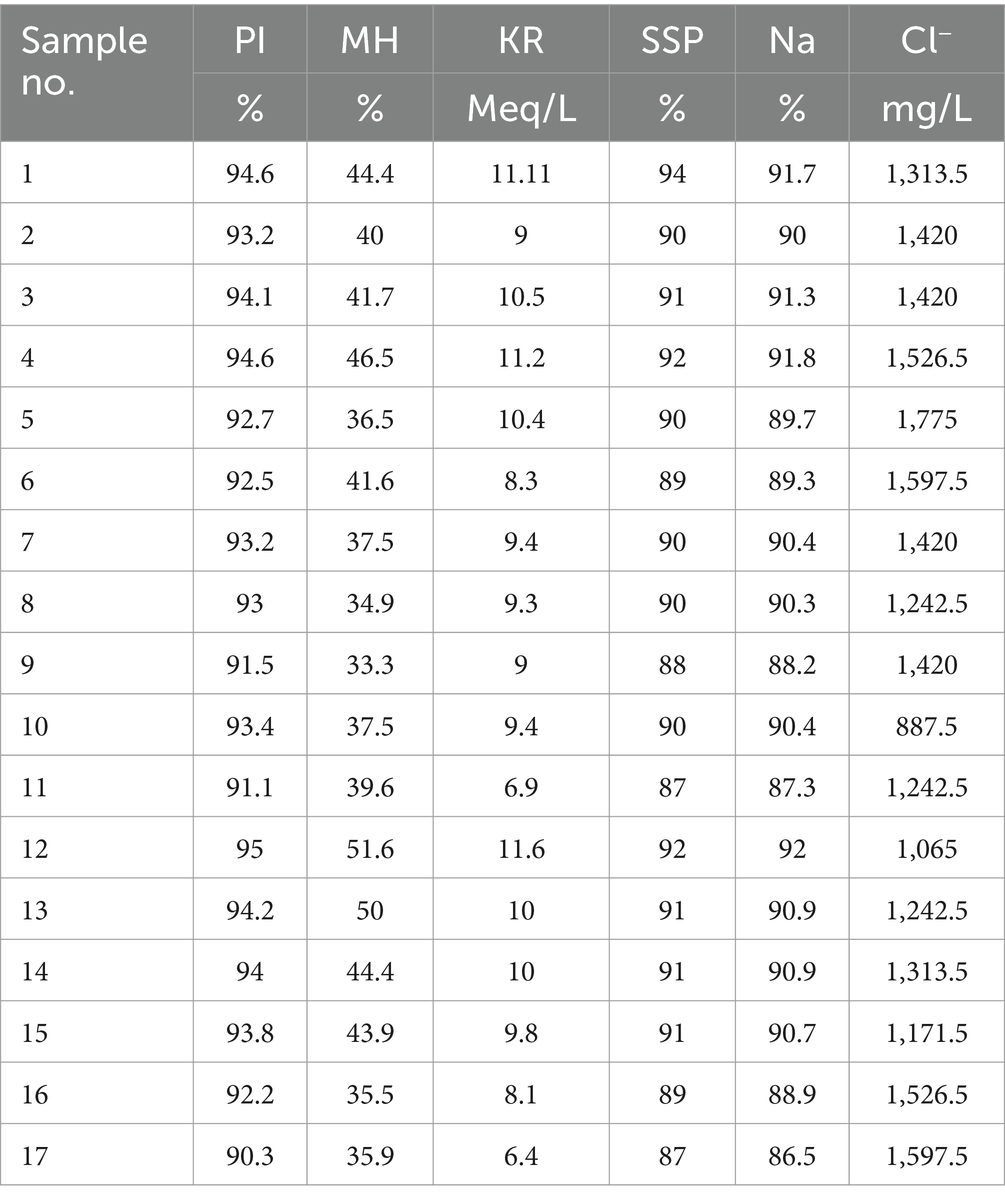
Table 12. Na%, PI, MH, KR, SSP, and Cl− parameters values in the study area.
3.3.2.5 Permeability index (PI)
Excessive levels of Na+, Ca2+, Mg2+, and HCO3− in irrigation water have been shown to impact soil permeability due to the widespread use of irrigation water (Gautam et al., 2015).
The groundwater in the present study has a PI percentage ranging from 90.3 to 95%. The classification of irrigation water is determined by the PI value, where a value greater than 75% is classified as class I, 25–75% as class II, and less than 25% as class III. This classification takes into account the soil contents of Na+, Ca2+, Mg2+, and HCO3−. IP values were observed in the study area range from 90.3 to 95%, as shown in Table 12. Based on these IP values in the study area, all samples fall under Class I, which indicates that the water is highly unsuitable for irrigation.
3.3.2.6 Magnesium hazard (MH)
A significant concentration of Mg2+ in irrigated soils can be attributed to the existence of exchangeable Na+. Paliwal (1972) proposed a crucial ratio that plays a key role in preserving the balance between calcium and magnesium in the majority of water sources, known as the balance risk index. Crop productivity is negatively affected as the soil becomes increasingly alkaline when the risk value of magnesium exceeds 50% (Raghunath, 1987; Gupta and Gupta, 1987). The groundwater values obtained in this study show a range of 33.3–51.6% for MH. It is clear from these values that the majority of groundwater samples, with the exception of sample 12, are below the 50% threshold. Therefore, these samples can be considered suitable for irrigation purposes, based on the MH values shown in Table 12.
3.3.2.7 Kelly’s ratio (KR)
Irrigation water quality is influenced by various factors, including the Kelly ratio (KR). This particular parameter is determined by the levels of Na+, Ca2+, and Mg2+ in the groundwater. When the KR value exceeds one (KR > 1), it indicates an excessive amount of sodium, making the water unsuitable for irrigation. Conversely, a KR value less than one means sodium deficiency (Kelly, 1940). In the present investigation, the KR values vary between 6.4 and 11.6 meq/L, which indicates that all groundwater samples possess values greater than 1. Therefore, this means an excessive presence of sodium, making the water unsuitable for irrigation (Table 12).
3.3.2.8 Soluble sodium percentage (SSP)
The presence of high concentrations of sodium, magnesium, calcium, and bicarbonate in the soil leads to a reduction in its permeability. The suitability of water for irrigation purposes can be determined using the sodium adsorption rate (SAR). The soil saturation percentage (SSP) values obtained in this study vary from 87 to 94% (Table 12). These high SSP values indicate that the soil has a high capacity to interact with sodium, resulting in a reduction in permeability. As a result, groundwater becomes unsuitable for irrigation.
3.3.2.9 Chloride (Cl−)
Plants need a certain level of chlorine for growth, but high concentrations can be harmful to sensitive crops. Chloride levels below 70 mg L−1 are generally safe for all plants, while levels between 70 and 140 mg/L can damage sensitive plants. Moderately tolerant plants can show damage at chloride concentrations ranging from 141 to 350 mg L−1, and levels exceeding 350 mg/L can cause serious problems (Bauder et al., 2011). The study area shows chloride concentrations between 887.5 and 1,775 mg L−1, indicating that most groundwater samples in the area have levels above 350 mg/L, making them unsuitable for irrigation (Table 12).
3.4 Groundwater suitability map
Different chemical quality standards have been established for evaluating the suitability of water for drinking and irrigation uses. The groundwater quality in the studied area can be distinguished from the concentration of the major constituents obtained from the results of chemical analysis of the groundwater samples, (TDS), (TH), (SAR), and (RSC). As well as from its physical properties such as (pH), and (EC), which are indicators of water salinity. Abd El Hameed et al. (2017) concluded that the groundwater in Wadi Qena is unsuitable for drinking and other domestic uses and could be used for irrigation under certain conditions.
3.4.1 Groundwater suitability map for drinking purposes
The groundwater suitability map was produced through the integration of raster maps depicting different parameters (such as pH, EC, TDS, Na+, Ca2+, Mg2+, Cl−, SO4−, and HCO3−) using a GIS spatial model used in Arc GIS 8.1 software. The model results classified the entire research area into the low relevance class (see Figure 7). This suggests that the quality of groundwater throughout the region is deemed unfit for drinking.

Figure 7. Groundwater suitability map for drinking purposes in the study area.
3.4.2 Groundwater suitability map for irrigation purposes
Agricultural viability of groundwater (GW) depends on various factors, including Na%, PI, MH, KR, SSP, and Cl−, SAR, RSC, Cl−, TH, and soil properties such as permeability, porosity, and texture. A spatial groundwater model was created to identify optimal areas for irrigation planning, taking these factors into account. The model results are divided into two relevance categories: low and moderately low (Figure 8). The groundwater quality suitability for irrigation map revealed that all groundwater samples were deemed unsuitable for irrigation due to their low quality for typical crops, but moderately low suitability for highly salt tolerant crops.
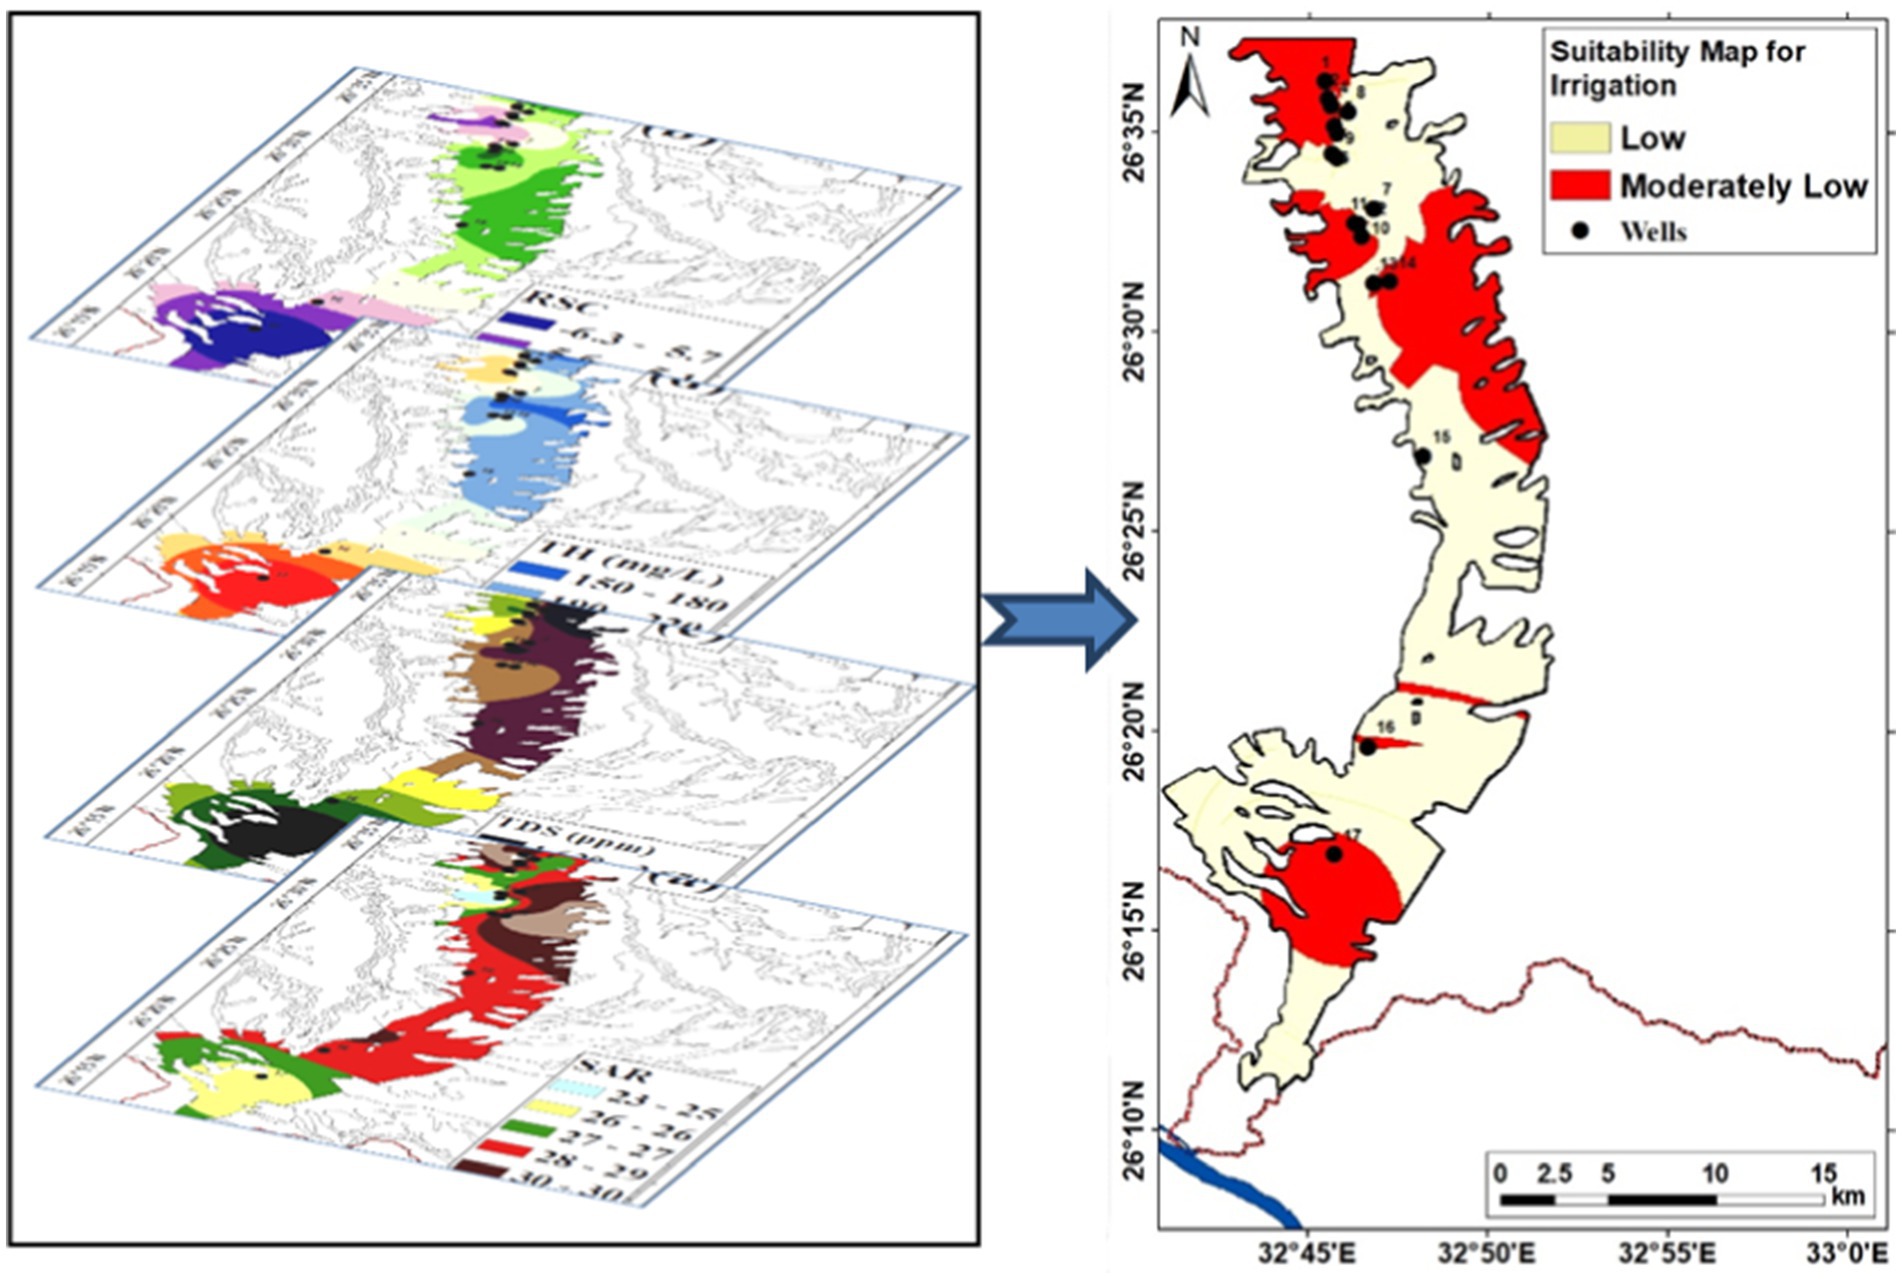
Figure 8. Groundwater suitability map for irrigation purposes.
4 Discussion
The hydrochemical classification of groundwater samples is analyzed using Rockwork and Excel programs. The Schoeller diagram, constructed using Excel version 2016 software, provides a visual representation of the results, allowing comparison of major ion analyses, especially for high salinity samples. The diagram identifies a high concentration of sodium, chloride and sulfate ions, indicating that the dominant salts are sodium chloride and sodium sulfate. The Stiff plot shows the TDS values of the groundwater samples, indicating similarities or differences in the overall water chemistry. Cations and anions are presented separately in ternary plots in the Piper diagram, with peaks representing sulfate, chloride, carbonate, hydrogen carbonate anions and calcium, magnesium, sodium and potassium cations. The diamond-shaped data in the Piper diagram indicate that all samples fall into the sodium–potassium–chloride–sulfate category within the specified area. The hydrochemical composition indicates that sodium chloride is the main type of water in the study area (Hamma et al., 2024; Nayak et al., 2023; Ali et al., 2024; Hou et al., 2023; Belkhiri and Mouni, 2012; Bu et al., 2020; Soltan, 1998).
The high salinity rate in general and chemical elements such as sodium, calcium, and other elements are due to two main factors, which are the nature and type of rocks not only in the study area but also all the rocks carrying groundwater from their source which is very far from the study area and it is the second main factor in the high salinity rates in the study area as these elements dissolve from the rocks they pass through. The study area is one of the desert areas and the only source of water is groundwater which includes a Quaternary aquifer (QAS), a Nubian sandstone aquifer (NSAS), a fractured limestone aquifer; and a fractured crystalline (basement) aquifer and the water source of these reservoirs in addition to the geological nature are the factors causing the high rates of various chemical elements in the study area.
The study analyzes groundwater samples, revealing pH levels between 7.5 and 8, which corresponds to the recommended pH range of 6.5–8.5 by Egyptian and WHO standards. However, the electrical conductivity range exceeds the permissible limits for drinking water, according to WHO and Egyptian guidelines. Total dissolved solids (TDS) range from 2,304 to 8,832 mg/L, with an increase toward the southern part of the wadi. The water is considered hard due to the presence of industrial waste (agricultural processing, textile industries, chemical manufacturing and salt production) and sewage, exceeding the permissible limits. Sodium levels range from 690 to 1,265 mg/L, with an increase in QAS and NSAS. Calcium concentrations remain within drinking water limits, while magnesium levels increase from north to south in both aquifers. Bicarbonate levels are within acceptable limits, while chloride and sulfate levels vary. All groundwater samples are considered unsafe for drinking, indicating that dissolution and weathering of silicate and sulfate minerals are having a significant impact on the groundwater chemistry of the region (Chegbeleh et al., 2020; Al Saleh and Nehaba, 2024; Rawat et al., 2018; Soomro et al., 2024; S et al., 2022; Islam and Mostafa, 2022; El-Amier et al., 2021; Osman, 2018).
The suitability of groundwater for irrigation is determined by various factors including sodium adsorption rate (SAR), residual sodium carbonate (RSC), permeability index (PI), magnesium risk (MH), Kelly coefficient (KR) and soil saturation percentage (SSP). The SAR index classifies irrigation water into four main categories based on its dissolved solids concentration in groundwater. Most water samples are considered unsuitable for irrigation due to their high sodium content, which can lead to soil alkalinity and poor drainage (Shaaban, 2024; Yıldız and Karakuş, 2020).
The RSC index indicates that the water quality is excellent, safe and suitable for irrigation. However, soluble sodium (Na%), which is the interaction between soil and sodium, leads to reduced soil permeability, resulting in poor drainage. The Permeability Index (PI) classifies irrigation water based on its Na+, Ca2+, Mg2+, and HCO3− levels. PI values range from 90.3 to 95%, with all samples classified as Class I, indicating that the water is highly unsuitable for irrigation (Khan et al., 2022; Zaman et al., 2018; Badr et al., 2023; Megahed, 2020).
The Equilibrium Risk Index (MH) measures the concentration of exchangeable Na+ in irrigated soils, which negatively affects crop productivity when the risk value of magnesium exceeds 50%. The majority of groundwater samples, except sample 12, are below the 50% threshold, making them suitable for irrigation (Osman, 2018; Shaaban, 2024; Yıldız and Karakuş, 2020; Khan et al., 2022; Zaman et al., 2018; Badr et al., 2023; Megahed, 2020).
Another parameter influencing the quality of irrigation water is the Kelly coefficient (KR). When the KR value exceeds 1, it indicates excess sodium, making the water unsuitable for irrigation. Soil saturation percentage (SSP) values range from 87 to 94%, indicating that the soil has a high capacity to interact with sodium, resulting in reduced permeability. Chloride concentrations can be harmful to sensitive plants, and the study area has chloride concentrations greater than 350 mg/L, making most groundwater samples unsuitable for irrigation (Khan et al., 2022; Zaman et al., 2018; Badr et al., 2023; Megahed, 2020).
The groundwater suitability map for drinking and irrigation in Wadi Qena was created using a spatial GIS model. The map incorporated raster maps of various parameters including pH, electrical conductivity, TDS, Na+, Ca2+, Mg2+, Cl−, SO42−, and HCO3−. The results classified the entire research area into a low suitability class, indicating that the groundwater quality is not suitable for drinking. The model also identified suitable areas for irrigation planning, revealing that all groundwater samples were unsuitable for typical crops, but moderately low for highly salt-tolerant crops (Moubark and Abdelkareem, 2018; Yan et al., 2024; Worku et al., 2024; El Osta et al., 2022). In addition, the delineation of the potential groundwater recharge area is underway to improve the quality and quantity of water available in the Wadi Qena watershed. However, there are opportunities for further improvements through the introduction of sustainable agricultural practices and the modernization of wastewater treatment as well as water conservation and pollution control campaigns (El Osta et al., 2022; Saraswat et al., 2023; Kumar et al., 2022; Balaji et al., 2017). The Qena Governorate has developed an environmental action plan that includes environmental awareness raising for residents and government employees, and also includes plans for improving solid waste management, water supply, and water quality.
A GIS map produced classified the area into a low suitability class, and recommended sustainable agricultural practices (AbdelRahman and Arafat, 2020; AbdelRahman et al., 2018), installation of wastewater treatment facilities, as well as campaigns for public awareness on water conservation and prevention of pollution (Megahed et al., 2023).
5 Conclusion
The study area is entirely encompassed by sedimentary rocks ranging from the Precambrian to the Quaternary. The NSAS and QAS are the main sources of groundwater. Chemical analyses carried out on the groundwater samples reveal that they have an acidic to slightly alkaline character. Groundwater quality and suitability for drinking and agricultural uses were assessed using a spatial model and hydrochemical analysis of existing groundwater wells. The results indicated high values of total dissolved solids (TDS) in the north–south section of the Quaternary aquifer in the study area, with sulfate content in the Quaternary aquifer samples increasing toward the south. Conversely, sulfate content increases northward in samples from the Nubian aquifer, which can be attributed to increased agricultural activities and pumping rates.
The quality of groundwater in the region is characterized by a range of values for various parameters. Total Dissolved Solids (TDS) range of 2,304–8,832 mg/L, Total Hardness (TH) of 155.03–390.06 mg/L, Electrical Conductivity (EC) of 3,600–13,800 μS/cm, sodium adsorption ratio (SAR) from 23.49 to 32.74 meq/L, sodium percentage (Na%) from 86.5 to 92%, residual sodium carbonate (RSC) from −2.5 to −5.4 meq/L, permeability index (PI) from 90.3 to 94.6%, magnesium risk (MH) from 33.3 to 51.6%, Kelly ratio (KR) from 6.4 to 11.6 meq/L, sodium saturation percentage (SSP) 87–94%, and chloride (Cl−) 887.5–1,775 mg/L. The results indicate that all groundwater samples from the study area are unsuitable for drinking and irrigation. The quality maps further confirm that groundwater is not suitable for these uses. The Schoeller, Stiff, and Piper diagrams suggest that NaCl is the dominant water type in the region. The sequence of cations and anions in groundwater samples shows a predominance of Na+ > Ca2+ > Mg2+/Cl− > SO42− > HCO3−. These plots, along with multi-analytical analysis, indicate that the dissolution and weathering of silicate and sulfate minerals play an important role in controlling groundwater chemistry in the region. The study highlights remedial measures for improving groundwater quality, such as establishing monitoring and GIS-based management systems to track groundwater quality, promoting efficient irrigation techniques to reduce soil salinity and prevent groundwater contamination, exploring localized desalination and treatment technologies for enhanced water quality, implementing artificial recharge projects using treated wastewater or surplus surface water to improve aquifer storage, and enforcing stricter policies on waste management, industrial effluents, and agricultural practices to minimize contamination sources. To improve groundwater management, it is recommended to stop their use for agricultural purposes due to their unsuitability and instead focus on their use for livestock or poultry farming depending on their quality. Groundwater from the Nubian aquifer can be used to grow crops compatible with its quality and the region’s soil conditions, using modern irrigation techniques to conserve this non-renewable resource. Regular monitoring and assessment of changes in water quality in the region is essential. An effective groundwater management plan is needed for the region, and the results of this study can provide valuable information to policy makers involved in managing groundwater quality in the region.
Data availability statement
The original contributions presented in the study are included in the article/supplementary material, further inquiries can be directed to the corresponding authors.
Author contributions
HM: Writing – original draft, Writing – review & editing, Conceptualization, Data curation, Formal analysis, Funding acquisition, Investigation, Methodology, Project administration, Resources, Software, Supervision, Validation, Visualization. AF: Conceptualization, Data curation, Formal analysis, Funding acquisition, Investigation, Methodology, Project administration, Resources, Software, Supervision, Validation, Visualization, Writing – original draft, Writing – review & editing. AM: Conceptualization, Data curation, Formal analysis, Funding acquisition, Investigation, Methodology, Project administration, Resources, Software, Supervision, Validation, Visualization, Writing – original draft, Writing – review & editing. MD: Conceptualization, Data curation, Formal analysis, Funding acquisition, Investigation, Methodology, Project administration, Resources, Software, Supervision, Validation, Visualization, Writing – original draft, Writing – review & editing. MA: Conceptualization, Data curation, Formal analysis, Funding acquisition, Investigation, Methodology, Project administration, Resources, Software, Supervision, Validation, Visualization, Writing – original draft, Writing – review & editing. HE-B: Data curation, Writing – original draft. PD'A: Conceptualization, Data curation, Funding acquisition, Methodology, Resources, Software, Validation, Visualization, Writing – original draft, Writing – review & editing. AS: Conceptualization, Data curation, Funding acquisition, Resources, Software, Validation, Visualization, Writing – original draft, Writing – review & editing. MS: Validation, Writing – original draft.
Funding
The author(s) declare that no financial support was received for the research, authorship, and/or publication of this article.
Acknowledgments
The authors acknowledge support given by National Authority for Remote Sensing and Space Sciences, Assiut University, Assiut, New Valley University, and Dipartimento di ScienzeAgrarie, Forestali, Alimentari ed. Ambientali (SAFE), Università degli Studi della Basilicata, which is not covered by the author contribution or funding sections.
Conflict of interest
The authors declare that the research was conducted in the absence of any commercial or financial relationships that could be construed as a potential conflict of interest.
Generative AI statement
The authors declare that no Generative AI was used in the creation of this manuscript.
Publisher’s note
All claims expressed in this article are solely those of the authors and do not necessarily represent those of their affiliated organizations, or those of the publisher, the editors and the reviewers. Any product that may be evaluated in this article, or claim that may be made by its manufacturer, is not guaranteed or endorsed by the publisher.
References
Abd El Hameed, A. G., El-Shayeb, H. M., El-Araby, N. A., and Hegab, M. G. (2017). Integrated geoelectrical and hydrogeological studies on Wadi Qena, Egypt. NRIAG J. Astron. Geophys. 6, 218–229. doi: 10.1016/j.nrjag.2017.03.003
Abd El Razik, T. M., and Razvaliaev, A. V. (1972). On the tectonic origin of the Nile Valley between Idfu and Qena, Egypt. Egypt. J. Geol. 16, 235–244.
Abdel Moneim, A. A. (2005). Overview of the geomorphological and hydrogeological characteristics of the eastern desert of Egypt. Hydrogeol. J. 13, 416–425. doi: 10.1007/s10040-004-0364-y
Abdel Moneim, A. A., Seleem, E. M., Zeid, S. A., Abdel Samie, S. G., Zaki, S., and Abu El-Fotoh, A. (2015). Hydrogeochemical characteristics and age dating of groundwater in the quaternary and Nubian aquifer systems in Wadi Qena, eastern desert, Egypt. Sustain. Water Resour. Manag. 1, 213–232. doi: 10.1007/s40899-015-0018-3
AbdelRahman, M. A. E., and Arafat, S. M. (2020). An approach of agricultural courses for soil conservation based on crop soil suitability using geomatics. Earth Syst. Environ. 4, 273–285. doi: 10.1007/s41748-020-00145-x
AbdelRahman, M. A. E., Shalaby, A., and Essa, E. F. (2018). Quantitative land evaluation based on fuzzy-multi-criteria spatial model for sustainable land-use planning. Model. Earth Syst. Environ. 4, 1341–1353. doi: 10.1007/s40808-018-0478-1
AbdelRahman, M. A. E., Shalaby, A., and Mohamed, E. S. (2018). Comparison of two soil quality indices using two methods based on geographic information system. Egypt. J. Remote Sens. Space Sci. 22, 127–136. doi: 10.1016/j.ejrs.2018.03.001
Abu Salem, H. S., Gemail, K. S., Junakova, N., Ibrahim, A., and Nosair, A. M. (2022). An integrated approach for deciphering hydrogeochemical processes during seawater intrusion in coastal aquifers. Water 14:1165. doi: 10.3390/w14071165
Ahmed, E. A. (1983). Sedimentology and tectonic evolution of Wadi Qena area, Egypt. (Ph.D thesis). Assiut, Egypt: Geology Dept., Assuit University, 136.
Al Saleh, H. A. A., and Nehaba, S. S. (2024). Evaluating groundwater vulnerability and assessing its quality for sustainable management. South African J. Chem. Eng. 50, 291–298. doi: 10.1016/j.sajce.2024.09.001
Ali, S., Verma, S., Agarwal, M. B., Islam, R., Mehrotra, M., Deolia, R. K., et al. (2024). Groundwater quality assessment using water quality index and principal component analysis in the Achnera block, Agra district, Uttar Pradesh, Northern India. Sci. Rep. 14:5381. doi: 10.1038/s41598-024-56056-8
Badr, E.-S. A., Tawfik, R. T., and Alomran, M. S. (2023). An assessment of irrigation water quality with respect to the reuse of treated wastewater in Al-Ahsa Oasis, Saudi Arabia. Water 15:2488. doi: 10.3390/w15132488
Balaji, E., Nagaraju, A., Sreedhar, Y., Thejaswi, A., and Sharifi, Z. (2017). Hydrochemical characterization of groundwater in around Tirupati area, Chittoor District, Andhra Pradesh, South India. Appl Water Sci 7, 1203–1212. doi: 10.1007/s13201-016-0448-6
Bauder, T. A., Waskom, R., Sutherland, P., Davis, J., Follett, R., and Soltanpour, P. (2011). Irrigation water quality criteria : Colorado State University Extension Publication, Crop series/irrigation. Fact sheet no. 0.506, Fort Collins, CO, USA. 4.
Belkhiri, L., Boudoukha, A., Mouni, L., and Baouz, T. (2010). Application of multivariate statistical methods and inverse geochemical modeling for characterization of groundwater - a case study: Ain Azel plain (Algeria). Geoderma 159, 390–398. doi: 10.1016/j.geoderma.2010.08.016
Belkhiri, L., and Mouni, L. (2012). Hydrochemical analysis and evaluation of groundwater quality in El Eulma area, Algeria. Appl. Water Sci. 2, 127–133. doi: 10.1007/s13201-012-0033-6
Bu, J., Liu, W., Pan, Z., and Ling, K. (2020). Comparative study of hydrochemical classification based on different hierarchical cluster analysis methods. Int. J. Environ. Res. Public Health 17:9515. doi: 10.3390/ijerph17249515
Chegbeleh, L. P., Akurugu, B. A., and Yidana, S. M. (2020). Assessment of groundwater quality in the Talensi District, northern Ghana. Sci. World J. :8450860:24. doi: 10.1155/2020/8450860
College of Agricultural Sciences (2002). Irrigation water quality. State College, USA: Pennsylvania State University.
Collins, R., and Jenkins, A. (1996). The impact of agricultural land use on stream chemistry in the Middle Hills of the Himalayas, Nepal. J. Hydrol. 185, 71–86. doi: 10.1016/0022-1694(95)03008-5
Conoco (1987). Geological map of Egypt, scale 1:500,000, sheet NG36NE Quseir, NG36NW Asyut. Cairo, Egypt: The Egyptian General Petroleum Corporation.
Darwish, M. H., and Galal, W. F. (2020). Spatiotemporal effects of wastewater ponds from a geoenvironmental perspective in the Kharga region, Egypt. Prog. Phys. Geogr. Earth Environ. 44, 376–397. doi: 10.1177/0309133319879321
Darwish, M. H., Sayed, A. G., and Hassan, S. H. (2023). Assessment of water for different uses at some localities of the Dakhla Oasis, Western Desert, Egypt. Water Air Soil Pollut. 234:516. doi: 10.1007/s11270-023-06458-7
Das, S., and Nag, S. K. (2015). Deciphering groundwater quality for irrigation and domestic purposes - a case study in Suri I and II blocks, Birbhum District, West Bengal, India. J. Earth Syst. Sci. 124, 965–992. doi: 10.1007/s12040-015-0583-8
Doneen, L. (1964). Notes on water quality in agriculture, water science and engineering paper 4001. Davis, USA: Dept. of Water. Science and Engineering, Univ. of California.
Eaton, F. M. (1950). Significance of carbonates in irrigation waters. Soil Sci. 69, 123–134. doi: 10.1097/00010694-195002000-00004
Egypt Standard. (2007). Higher committee for water Egyptian standers for drinking water and domestic uses (in Arabic).
Egyptian Geological Survey and Mining Authority (EGSMA) (1983). Geological Map of Egypt, Scale 1: 2,000,000. Cairo, Egypt: Egyptian Geological Survey and Mineral Authority.
Egyptian Geological Survey and Mining Authority (EGSMA) (2006). Geological map of Abu had quadrangle. Egypt, Scale 1:100,000. Cairo, Egypt: Egyptian Geological Survey and Mineral Authority.
El Osta, M., Masoud, M., Alqarawy, A., Elsayed, S., and Gad, M. (2022). Groundwater suitability for drinking and irrigation using water quality indices and multivariate modeling in Makkah Al-Mukarramah Province, Saudi Arabia. Water 14:483. doi: 10.3390/w14030483
El-Amier, Y. A., Kotb, W. K., Bonanomi, G., Fakhry, H., Marraiki, N. A., and Abd-ElGawad, A. M. (2021). Hydrochemical assessment of the irrigation water quality of the El-Salam Canal, Egypt. Water 13:2428. doi: 10.3390/w13172428
Elewa, H. H., and Abu El Ella, E. M. (2011). Numerical modeling for the Nubian aquifer development in Wadi Qena, eastern desert, Egypt. Egypt. J. Geol. 55, 105–125. Available at: http://scholar.google.com/scholar_lookup?&title=Groundwater%20potential%20of%20the%20southern%20part%20of%20Wadi%20Qena%20basin%2C%20Eastern%20Desert%20of%20Egypt%20using%20remote%20sensing%20techniques&journal=Egypt%20J%20Remote%20Sens%20Space%20Sci&volume=3&pages=135-152&publication_year=2000&author=Elewa%2CHH&author=Fathy%2CRG&author=Zaghloul%2CEA
Elewa, H. H., Fath, R. G., and Zaghloul, E. A. (2006). Possibility of the agricultural expansion based on land and water resources potentialities at the southern part of Wadi Qena, central Eastern Desert, Egypt. Egypt. J. Soil Sci. 46, 153–174. Available at: http://scholar.google.com/scholar_lookup?&title=Possibility%20of%20the%20agricultural%20expansion%20based%20on%20land%20and%20water%20resources%20potentialities%20at%20the%20Southern%20Part%20of%20Wadi%20Qena%2C%20Central%20Eastern%20Desert%2C%20Egypt&journal=Egypt%20J%20Soil%20Sci&volume=46&issue=2&pages=153-174&publication_year=2006&author=Elewa%2CHH&author=Fath%2CRG&author=Zaghloul%2CEA
Elewa, H. H., Fathy, R. G., and Zaghloul, E. A. (2000). Groundwater potential of the southern part of Wadi Qena basin, eastern desert of Egypt using remote sensing techniques. Egypt. J. Remote Sens. Space Sci. 3, 135–152. Available at: http://scholar.google.com/scholar_lookup?&title=Groundwater%20potential%20of%20the%20southern%20part%20of%20Wadi%20Qena%20basin%2C%20Eastern%20Desert%20of%20Egypt%20using%20remote%20sensing%20techniques&journal=Egypt%20J%20Remote%20Sens%20Space%20Sci&volume=3&pages=135-152&publication_year=2000&author=Elewa%2CHH&author=Fathy%2CRG&author=Zaghloul%2CEA
El-Rawi, M., AbdelRahman, M. A. E., and Ismail, E. (2020). Integrated use of pollution indices and geomatics to assess soil contamination and identify soil pollution source in El-Minia governorate, upper Egypt. J. Eng. Sci. Technol. 15, 2223–2238. Available at: https://jestec.taylors.edu.my/Vol%2015%20issue%204%20August%202020/15_4_7.pdf
ESRI. (2006). ArcGIS 9.1, GIS, and mapping software. Redlands, CA: Environmental Systems Research Institute.
Faris, M. (1974). The contact of the cretaceous and Eocene rocks in Tramsa-Tukh areal Qena, upper Egypt. Bull. Inst. Oceanogr. Fish. 28, 73–85. doi: 10.3406/bie.1945.3774
Ferreira dos Santos, C., and Cunha-Santino, M. B. (2015). Monitoramento da qualidade da água do rio monjolinho: a limnologia como uma ferramenta para a gestão ambiental. Revista de Estudos Ambientais 16, 27–37. doi: 10.7867/1983-1501.2014V16N1P27-37
Fishman, M. J., and Friedman, L. C. (1989). Methods for determination of inorganic substances in water and fluvial sediments. Reston, VA, USA: US Department of the Interior, Geological Survey.
Galal, W. F., and Darwish, M. H. (2022). Geoenvironmental assessment of the Mut wastewater ponds in the Dakhla Oasis, Egypt. Geocarto Int. 37, 3293–3311. doi: 10.1080/10106049.2020.1856197
Gautam, S. K., Maharana, C., Sharma, D., Singh, A. K., Tripathi, J. K., and Singh, S. K. (2015). Evaluation of groundwater quality in the Chotanagpur plateau region of the Subarnarekha River basin, Jharkhand state, India. Sustain. Water Qual. Ecol. 6, 57–74. doi: 10.1016/j.swaqe.2015.06.001
Giri, S., Mahato, M. K., Singh, P. K., and Singh, A. K. (2021). Non-carcinogenic health risk assessment for fluoride and nitrate in the groundwater of the Mica Belt of Jharkhand, India. Hum. Ecol. Risk Assess. 27, 1939–1953. doi: 10.1080/10807039.2021.1934814
Gong, Z., Tian, X., Fu, L., Niu, H., Xia, Z., Ma, Z., et al. (2023). Chemical characteristics and controlling factors of groundwater in Chahannur Basin. Water 15:1524. doi: 10.3390/w15081524
Gupta, S. K., and Gupta, I. (1987). Management of saline soils and waters. New Delhi, India: Oxford & IBH Publishing Co., 399.
Haghizadeh, A., Moghaddam, D. D., and Pourghasemi, H. R. (2017). GIS-based bivariate statistical techniques for groundwater potential analysis (an example of Iran). J. Earth Syst. Sci. 126, 1–17. doi: 10.1007/s12040-017-0888-x
Hamma, B., Alodah, A., Bouaicha, F., Bekkouche, M. F., Barkat, A., and Hussein, E. E. (2024). Hydrochemical assessment of groundwater using multivariate statistical methods and water quality indices (WQIs). Appl Water Sci 14:33. doi: 10.1007/s13201-023-02084-0
Han, D., and Currell, M. J. (2017). Persistent organic pollutants in China's surface water systems. Sci. Total Environ. 580, 602–625. doi: 10.1016/j.scitotenv.2016.12.007
Han, X., Tang, F., and Liu, A.-L. (2024). Drinking water quality evaluation in supply systems in Wuhan, China: application of entropy weight water quality index and multivariate statistical analysis. Environ. Sci. Pollut. Res. 31, 280–292. doi: 10.1007/s11356-023-31212-1
Hem, J. D. (1970). Study and interpretation of the chemical characteristics of natural water. 2nd Edn: U. S. Geological survey. Water supply, papers 1473, 363.
Hem, J. D. (1985). Study and interpretation of the chemical characteristics of natural water. United States Geol. Survey/water supply, paper 2254. Washington DC., USA: United States Geol. Survey.
Honarbakhsh, A., Azma, A., Nikseresht, F., Mousazadeh, M., Eftekhari, M., and Ostovari, Y. (2019). Hydro-chemical assessment and GIS-mapping of groundwater quality parameters in semi-arid regions. J. Water Supply Res. Technol. Aqua 68, 509–522. doi: 10.2166/aqua.2019.009
Hou, Q., Pan, Y., Zeng, M., Wang, S., Shi, H., Huang, C., et al. (2023). Assessment of groundwater hydrochemistry, water quality, and health risk in Hainan Island, China. Sci. Rep. 13:12104. doi: 10.1038/s41598-023-36621-3
Islam, M. S., and Mostafa, M. G. (2022). Comparison of classical and developed indexing methods for assessing the groundwater suitability for irrigation. J. Sustain. Agric. Environ. 1, 226–239. doi: 10.1002/sae2.12027
Jiang, L., Yao, Z., Liu, Z., Wang, R., and Wu, S. (2015). Hydrochemistry and its controlling factors of rivers in the source region of the Yangtze River on the Tibetan plateau. J. Geochem. Explor. 155, 76–83. doi: 10.1016/j.gexplo.2015.04.009
Kelly, W. (1940). Permissible composition and concentration of irrigated waters. Proc. ASCF 66:607. doi: 10.1055/s-0028-1121592
Khan, A., Khan, M. S., Egozcue, J. J., Shafique, M. A., Nadeem, S., and Saddiq, G. (2022). Irrigation suitability, health risk assessment and source apportionment of heavy metals in surface water used for irrigation near marble industry in Malakand, Pakistan. PLoS One 17:e0279083. doi: 10.1371/journal.pone.0279083
Kreins, P., Henseler, M., Anter, J., Herrmann, F., and Wendland, F. (2015). Quantification of climate change impact on regional agricultural irrigation and groundwater demand. Water Resour. Manag. 29, 3585–3600. doi: 10.1007/s11269-015-1017-8
Kumar, S., Kumar, A., Prashant Jha, V. N., Sahoo, S. K., and Ranjan, R. K. (2022). Groundwater quality and its suitability for drinking and irrigational purpose in Bhojpur district: middle Gangetic plain of Bihar, India. Water Supply 22, 7072–7084. doi: 10.2166/ws.2022.317
Megahed, H. A. (2020). GIS-based assessment of groundwater quality and suitability for drinking and irrigation purposes in the outlet and central parts of Wadi El-Assiuti, Assiut governorate, Egypt. Bull. Natl. Res. Cent. 44:187. doi: 10.1186/s42269-020-00428-3
Megahed, H. A., Farrag, A. E.-H. A., Mohamed, A. A., D’Antonio, P., Scopa, A., and AbdelRahman, M. A. E. (2023). Groundwater recharge potentiality mapping in Wadi Qena, eastern desert basins of Egypt for sustainable agriculture base using geomatics approaches. Hydrology 10:237. doi: 10.3390/hydrology10120237
Megahed, H. A., GabAllah, H. M., AbdelRahman, M. A. E., D’Antonio, P., Scopa, A., and Darwish, M. H. (2022). Geomatics-based modeling and hydrochemical analysis for groundwater quality mapping in the Egyptian Western Desert: a case study of El-Dakhla Oasis. Water 14:4018. doi: 10.3390/w14244018
Megahed, H. A., GabAllah, H. M., Ramadan, R. H., AbdelRahman, M. A. E., D’Antonio, P., Scopa, A., et al. (2023). Groundwater quality assessment using multi-criteria GIS modeling in drylands: a case study at El-Farafra oasis, Egyptian Western Desert. Water 15:1376. doi: 10.3390/w15071376
Mester, T., Szabo, G., Sajtos, Z., Baranyai, E., Szabo, G., and Balla, D. (2022). Environmental hazards of an unrecultivated liquid waste disposal site on soil and groundwater. Water 14:226. doi: 10.3390/w14020226
Metwaly, M. M., AbdelRahman, M. A. E., and Abdellatif, B. (2022). Heavy metals and micronutrients assessment in soil and groundwater using geospatial analyses under agricultural exploitation in dry areas. Acta Geophys. 71, 1937–1965. doi: 10.1007/s11600-022-00979-1
Mohamaden, M., Araffa, S. A. S., Taha, A., AbdelRahman, M. A. E., El-Sayed, H. M., and Sharkawy, M. S. (2024). Geophysical techniques and geomatics-based mapping for groundwater exploration and sustainable development at Sidi Barrani area, Egypt. Egypt. J. Aquatic Res. 50, 36–51. doi: 10.1016/j.ejar.2023.12.001
Moubark, K., and Abdelkareem, M. (2018). Characterization and assessment of groundwater resources using hydrogeochemical analysis, GIS, and field data in southern Wadi Qena, Egypt. Arab. J. Geosci. 11:598. doi: 10.1007/s12517-018-3931-6
Nayak, A., Matta, G., and Uniyal, D. P. (2023). Hydrochemical characterization of groundwater quality using chemometric analysis and water quality indices in the foothills of Himalayas. Environ. Dev. Sustain. 25, 14229–14260. doi: 10.1007/s10668-022-02661-4
Paliwal, K. V. (1972). Irrigation with saline water. New Delhi, India: Water Technology Centre, Indian Agriculture Research Institute, 198.
Pazand, K., Khosravi, D., Ghaderi, M. R., and Rezvanianzadeh, M. R. (2018). Identification of the hydrogeochemical processes and assessment of groundwater in a semi-arid region using major ion chemistry: a case study of Ardestan basin in Central Iran. Groundw. Sustain. Dev. 6, 245–254. doi: 10.1016/j.gsd.2018.01.008
Piper, A. M. (1944). A graphic procedure in the geochemical interpretation of water- analyses. EOS Trans. Am. Geophys. Union 25, 914–928. doi: 10.1029/TR025i006p00914
Porter, D. O., and Marek, T. (2006). “Irrigation management with saline water” in Proceedings of the 2006 central plains irrigation conference (Colby, KS, USA: Colorado State University), 21–22.
Raghunath, H. M. (1987). Ground water: Hydrogeology, ground water survey and pumping tests, rural water supply and irrigation systems. New York, NY, USA: John Wiley & Sons Ltd.
Rainwater, F. H., and Thatcher, L. L. (1960). Methods for collection and analysis of water samples (No. 1454-1458). Washington, DC, USA: US Government Printing Office.
Rawat, K. S., Singh, S. K., and Gautam, S. K. (2018). Assessment of groundwater quality for irrigation use: a peninsular case study. Appl Water Sci 8:233. doi: 10.1007/s13201-018-0866-8
Ren, C., and Zhang, Q. (2020). Groundwater chemical characteristics and controlling factors in a region of northern China with intensive human activity. Int. J. Environ. Res. Public Health 17:9126. doi: 10.3390/ijerph17239126
Richards, L. A. (1954). Diagnosis and improvement of saline alkali soils, agriculture, 160, handbook 60. Washington DC, USA: US Department of Agriculture.
S, C., M, V. P., S, V., M, N., K, P., Panda, B., et al. (2022). Groundwater quality assessment for irrigation by adopting new suitability plot and spatial analysis based on fuzzy logic technique. Environ. Res. 204:111729. doi: 10.1016/j.envres.2021.111729
Sanaullah, M., Wang, X., Ahmad, S. R., Mirza, K., Mahmood, M. Q., and Kamran, M. (2023). Optimized irrigated water management using numerical flow modeling coupled with finite element model: a case study of Rechna doab, Pakistan. Water 15:4193. doi: 10.3390/w15234193
Saraswat, A., Nath, T., Omeka, M. E., Unigwe, C. O., Anyanwu, I. E., Ugar, S. I., et al. (2023). Irrigation suitability and health risk assessment of groundwater resources in the Firozabad industrial area of north-Central India: an integrated indexical, statistical, and geospatial approach. Front. Environ. Sci. 11:1116220. doi: 10.3389/fenvs.2023.1116220
Shaaban, M. (2024). “Salt-affected soils” in Frontier studies in soil science. ed. A. Núñez-Delgado (Cham: Springer).
Simonetti, V. C., da Cunha, D. C., and Rosa, A. H. (2019). Análise da influência das atividades antrópicas sobre a qualidade da água da APA Itupararanga (SP), Brasil. Geosul 34, 01–27. doi: 10.5007/1982-5153.2019v34n72p01
Soltan, M. E. (1998). Characterisation, classification, and evaluation of some ground water samples in upper Egypt. Chemosphere, 37, 735–745. doi: 10.1016/S0045-6535(98)00079-4
Soomro, S. A., Hao, L., Memon, G. A., Junejo, A. R., Niu, W., Channa, Z. A., et al. (2024). Comprehensive analysis of groundwater suitability for irrigation in rural Hyderabad, Sindh, Pakistan. Agronomy 14:1072. doi: 10.3390/agronomy14051072
Srivastav, A. L., Patel, N., and Chaudhary, V. K. (2020). Disinfection by-products in drinking water: occurrence, toxicity and abatement. Environ. Pollut. 267:115474. doi: 10.1016/j.envpol.2020.115474
Stiff, H. A. (1951). The interpretation of chemical water analysis by means of patterns. J. Pet. Technol. 3, 15–13. doi: 10.2118/951376-G
Todd, D. K., and Mays, L. W. (2004). Groundwater hydrology. New York, NY, USA: John Wiley & Sons Ltd.
US Salinity Laboratory Staff (USSL) (1954). Diagnosis and improvement of saline and alkali soils, Agric, handbook 60, USDA. Washington, DC, USA: US Government Printing Office.
Wali, S. U., Alias, N. B., Harun, S. B., Umar, K. J., Gada, M. A., Dankani, I. M., et al. (2022). Water quality indices and multivariate statistical analysis of urban groundwater in semi-arid Sokoto Basin, Northwestern Nigeria. Groundwater Sustain. Dev. 18:100779. doi: 10.1016/j.gsd.2022.100779
Wang, S., Shao, J., Song, X., Zhang, Y., Huo, Z., and Zhou, X. (2008). Application of MODFLOW and geographic information system to groundwater flow simulation in North China plain, China. Environ. Geol. 55, 1449–1462. doi: 10.1007/s00254-007-1095-x
WHO Guidelines (2004). “Global drinking water index development and sensitivity analysis report” in United Nations Environment Programme (UNEP)/Global Environment Monitoring System (GEMS)/Water Programme. eds. C. Rickwood and G. Curr, Burlington, Ontario, Canada: NEP GEMS/Water Programme. 8–101.
Wilcox, L. (1955). The quality of water for irrigation use. Washington, DC, USA: US Department of Agriculture, Technical Bulletin No. 962, 1–40.
Worku, D., Boja, A., and Fantu, A. (2024). Evaluation of land suitability areas for irrigation using GIS and AHP-based tools in the case of Zenti River catchment, Gofa district, Ethiopia. Cogent Eng. 11. doi: 10.1080/23311916.2024.2345519
Xiao, Y., Zhang, J., Long, A., Xu, S., Guo, T., Gu, X., et al. (2023). Hydrochemical characteristics and formation mechanism of quaternary groundwater in Baoshan basin, western Yunnan, China. Water 15:2736. doi: 10.3390/w15152736
Yan, Y., Zhang, Y., Yao, R., Wei, C., Luo, M., Yang, C., et al. (2024). Groundwater suitability assessment for irrigation and drinking purposes by integrating spatial analysis, machine learning, water quality index, and health risk model. Environ. Sci. Pollut. Res. 31, 39155–39176. doi: 10.1007/s11356-024-33768-y
Yidana, S. M., Bawoyobie, P., Sakyi, P., and Fynn, O. F. (2018). Evolutionary analysis of groundwater flow: application of multivariate statistical analysis to hydrochemical data in the Densu Basin, Ghana. J. African Earth Sci. 138, 167–176. doi: 10.1016/j.jafrearsci.2017.10.026
Yıldız, S., and Karakuş, C. B. (2020). Estimation of irrigation water quality index with development of an optimum model: a case study. Environ. Dev. Sustain. 22, 4771–4786. doi: 10.1007/s10668-019-00405-5
Yuan, Z., Jian, Y., Chen, Z., Jin, P., Gao, S., Wang, Q., et al. (2024). Distribution of groundwater hydrochemistry and quality assessment in Hutuo River drinking water source area of Shijiazhuang (North China plain). Water 16:175. doi: 10.3390/w16010175
Zaman, M., Shahid, S. A., and Heng, L. (2018). “Irrigation water quality” in Guideline for salinity assessment, mitigation and adaptation using nuclear and related techniques (Cham: Springer).
Keywords: hydrogeochemistry, modeling, groundwater assessment, GIS, Wadi Qena, Egypt
Citation: Megahed HA, Farrag AE-HA, Mohamed AA, Darwish MH, AbdelRahman MAE, El-Bagoury H, D’Antonio P, Scopa A and Saad MAA (2025) GIS-based modeling and analytical approaches for groundwater quality suitability for different purposes in the Egyptian Nile Valley, a case study in Wadi Qena. Front. Water. 7:1502169. doi: 10.3389/frwa.2025.1502169
Edited by:
Jahangeer Jahangeer, University of Nebraska-Lincoln, United StatesReviewed by:
Balaji Etikala, Yogi Vemana University, IndiaSunitha Vangala, Yogi Vemana University, India
Copyright © 2025 Megahed, Farrag, Mohamed, Darwish, AbdelRahman, El-Bagoury, D’Antonio, Scopa and Saad. This is an open-access article distributed under the terms of the Creative Commons Attribution License (CC BY). The use, distribution or reproduction in other forums is permitted, provided the original author(s) and the copyright owner(s) are credited and that the original publication in this journal is cited, in accordance with accepted academic practice. No use, distribution or reproduction is permitted which does not comply with these terms.
*Correspondence: Hanaa A. Megahed, aGFuYWEuYWhtZWRAbmFyc3Muc2NpLmVn; aGFuYWFuYXJzc0B5YWhvby5jb20=; Antonio Scopa, YW50b25pby5zY29wYUB1bmliYXMuaXQ=