
94% of researchers rate our articles as excellent or good
Learn more about the work of our research integrity team to safeguard the quality of each article we publish.
Find out more
ORIGINAL RESEARCH article
Front. Water, 07 April 2025
Sec. Water and Human Health
Volume 7 - 2025 | https://doi.org/10.3389/frwa.2025.1487795
 Gelila Yitageasu1*
 Kassaw Chekole Adane2
 Amensisa Hailu Tesfaye1,3
 Zemichael Gizaw1Tigist Kifle4
 Lidetu Demoze1
Background: Limited access to water caused by its scarcity is becoming one of the most serious problems facing several developing countries including East Africa. For this, understanding the spatial distribution of limited access to water source service is more pertinent. The purpose of this study is to analyze the spatial distribution of limited access to water source services in East Africa countries and seeks to inform the development and implementation of targeted interventions and policies in East Africa.
Methods: This study analyzed data from recent demographic and health surveys conducted in 12 East African nations between 2012 and 2023. Data were gathered from 206,748 households. Global spatial autocorrelation was performed to analyze whether the pattern of limited access to drinking water service is clustered, dispersed, or random across the study areas. Once a positive global autocorrelation was confirmed, a local spatial autocorrelation analysis (Getis-OrdGi* statistics) was employed to detect local clusters. ArcGIS Pro 2.8.0 was used to map the clusters and Kulldorff SaTScan version 10.0.2 software using Bernoulli model were used for spatial scan statistical tests. The geostatistical ordinary kriging spatial interpolation technique was used to predict for unsampled areas based on sampled clusters.
Result: Limited access to drinking water service were spatially clustered in the study area (Moran’s I: 0.16) (p < 0.0000). 40 significant clusters of which, one primary cluster and 39 secondary clusters were identified. The first spatial window which contains primary clusters was located in Uganda and Rwanda. The other 39 secondary spatial clusters were observed in Malawi, Mozambique, Kenya, Ethiopia and small part of Madagascar. Cold spot clusters were identified Madagascar, Zimbabwe, Tanzania, Comoros, Zambia and some parts of Kenya.
Conclusion: The result of this study revealed the existence of spatial variation of limited access to drinking water services in East Africa. The variation was observed both within and across the countries. Engaging practitioners, researchers, policymakers, and local communities through multi-stakeholder platforms will establish effective management strategy, which will increase water access to the community.
Despite the fact that access to safe drinking water is a top priority worldwide, many people in developing countries do not have sufficient and safe drinking water (Gizaw et al., 2022). In 2010, the United Nations General Assembly (UNGA) (2010) declared that everyone has the human right to access to safe, clean, affordable and accessible drinking water and sanitation and urged governments to step up their efforts. In addition to monitoring safely managed drinking water, the WHO/UNICEF JMP also used a 30-min threshold for water service levels within countries (World Health Organization, 2017). Off-site improved water sources within 30 min of the point of use are considered to provide basic service. If the source more than 30 min from the point of use, the level of service is classified as limited (World Health Organization, 2017). Improved water sources include piped water, boreholes or tube wells, protected dug wells, protected springs, and packaged or delivered water (World Bank, 2024). Ensuring people’s access to safe drinking water and adequate sanitation and promoting personal, household and community hygiene, will improve the quality of life for millions of peoples (Liu et al., 2015).
Even though the proportion of the global population using improved drinking water services s stood at 91% in 2015 (a Millennium Development Goal (MDG) target achieved by the year 2010), 785 million people still lacked basic drinking water services in 2017 (United Nations, 2019). In 2022 according to WHO report globally 1.5 billion people have basic access to water services, and 292 million people with limited access to water services (World Health Organization, 2023). Sub-Saharan Africa recorded notable gains, with 328 million people gaining access to basic drinking water and 400 million people in the region still lack access to basic drinking water (World Health Organization, 2019).
According to the World Health Organization (WHO), inadequate access to Water, Sanitation and Hygiene (WASH) services is responsible for nearly 2 million deaths annually worldwide, most of them children (Pruss-Ustun et al., 2019). Sub-Saharan Africa still has the largest burden of morbidity and mortality due to inadequate WASH facilities (60 and 53% of all DALYs and deaths attributable to inadequate WASH facilities, respectively) (Pruss-Ustun et al., 2019). Almost one tenth of the global disease burden could be prevented by improving water supply, sanitation, hygiene and management of water resources (Liu et al., 2015).
It is well known that inadequate access to water and sanitation has a detrimental effect on both human and environmental health. It can lead to cholera, acute diarrhea, dysentery, typhoid, and hepatitis A, schistosomiasis, infections of the respiratory systems, skin and eye as well as malnourishment (Mara et al., 2010; Montgomery and Elimelech, 2007; Bartram et al., 2005; Ezeh et al., 2014; Saxena et al., 2018). Infections such as helminthiasis, scabies, and trachoma can also emerge when there is a lack of access to clean water (Prüss-Ustün et al., 2014). The health of the entire family especially the kids can be impacted by water collection. The act of transporting and storing water that is not readily available at home, even if it comes from a safe source, raises the possibility that it will get polluted by excrement by the time it is consumed. As a result, there is a higher chance of diarrheal illness, which is the fourth largest cause of death for children under five (UNICEF, 2016).
As many nations work towards meeting target 6.1 of Goal 6 of the Sustainable Development Goals (SDGs), aiming to provide everyone with equitable and universal access to clean, reasonably priced drinking water by 2030 (United Nations, 2015). To achieve these universal access targets by 2030, substantial progress will need to be made in improving access to unserved populations (Grady et al., 2018). To make that it is important to document limited access to improved drinking water services to identify key areas and disparities that nations still need to address as they strive to meet this target.
Even though there was a multilevel analysis that has been conducted in this study area about factors for limited access to drinking water service there is a scarcity of study about the spatial distribution of limited access to drinking water services in East Africa. Therefore, this study aimed to fill this gap and show the spatial distribution of limited access to drinking water services water in East Africa countries. This study includes recent demographic health survey (DHS) data of countries in East Africa in order to generate and provide information for all concerning bodies like government officials, policy makers, NGO, and local stakeholders. Also, it is methodologically rigorous and provides a comprehensive understanding and it uses SaTScan which has greater power than other available methods for detecting local clusters.
The most recent demographic and health survey (DHS) dataset, which includes East African countries from 2012 to 2023, was used. The Horn of Africa, the islands in the Indian Ocean, and the Great Lakes region are home to the 14 countries that make up Eastern Africa (Figure 1). “East Africa is the portion of the African continent that includes the eastern Sahara Desert and the Horn of Africa with a population estimated at 486,766,759 and an area of 6,667,493 square kilometers (2,574,332 square miles), it accounts for 6.03% of the world’s total population (Terefe et al., 2024). The region’s climate and eco-regions are very variable both spatially and temporally (Himeidan and Kweka, 2012; Zhou et al., 2004). These regions have comparatively mild temperatures compared to other tropical regions because of their generally high altitude with higher temperatures in the humid coastal areas and lower temperatures in the highlands (maximum of approximately 25°C and lowest of 15°C at an altitude of 1,500 m). Global and regional climate change has resulted in rising temperatures as well as a rise in the frequency and intensity of extreme weather events throughout the region (Stocker et al., 2014). Household supplies of water come from a wide range of different sources including wells, springs, borehole, rivers, rainfall, bottled water and piped water supplies, depending on local/seasonal availability, hydrogeological conditions and the level of investment in water infrastructure (WHO/UNICEF Joint Water Supply and Sanitation Monitoring Programme, 2015). East Africa’s water availability is closely tied to its seasonal rainfall patterns, during the wet seasons, communities primarily rely on surface water sources and in dry seasons, when surface water becomes scarce, there is a heightened dependence on groundwater (Earth Observatory, 2021; IGAD Climate Prediction and Applications Centre, 2022). National and local governments in East Africa are primarily responsible for the provision of water services, development and maintenance of water infrastructure, regulation of water quality, and ensure equitable access to water resources. The private sector complements government efforts by bringing in investment, technical expertise, and efficient management practices (Adloff et al., 2022; Mologni et al., 2024; World Bank, 1996).
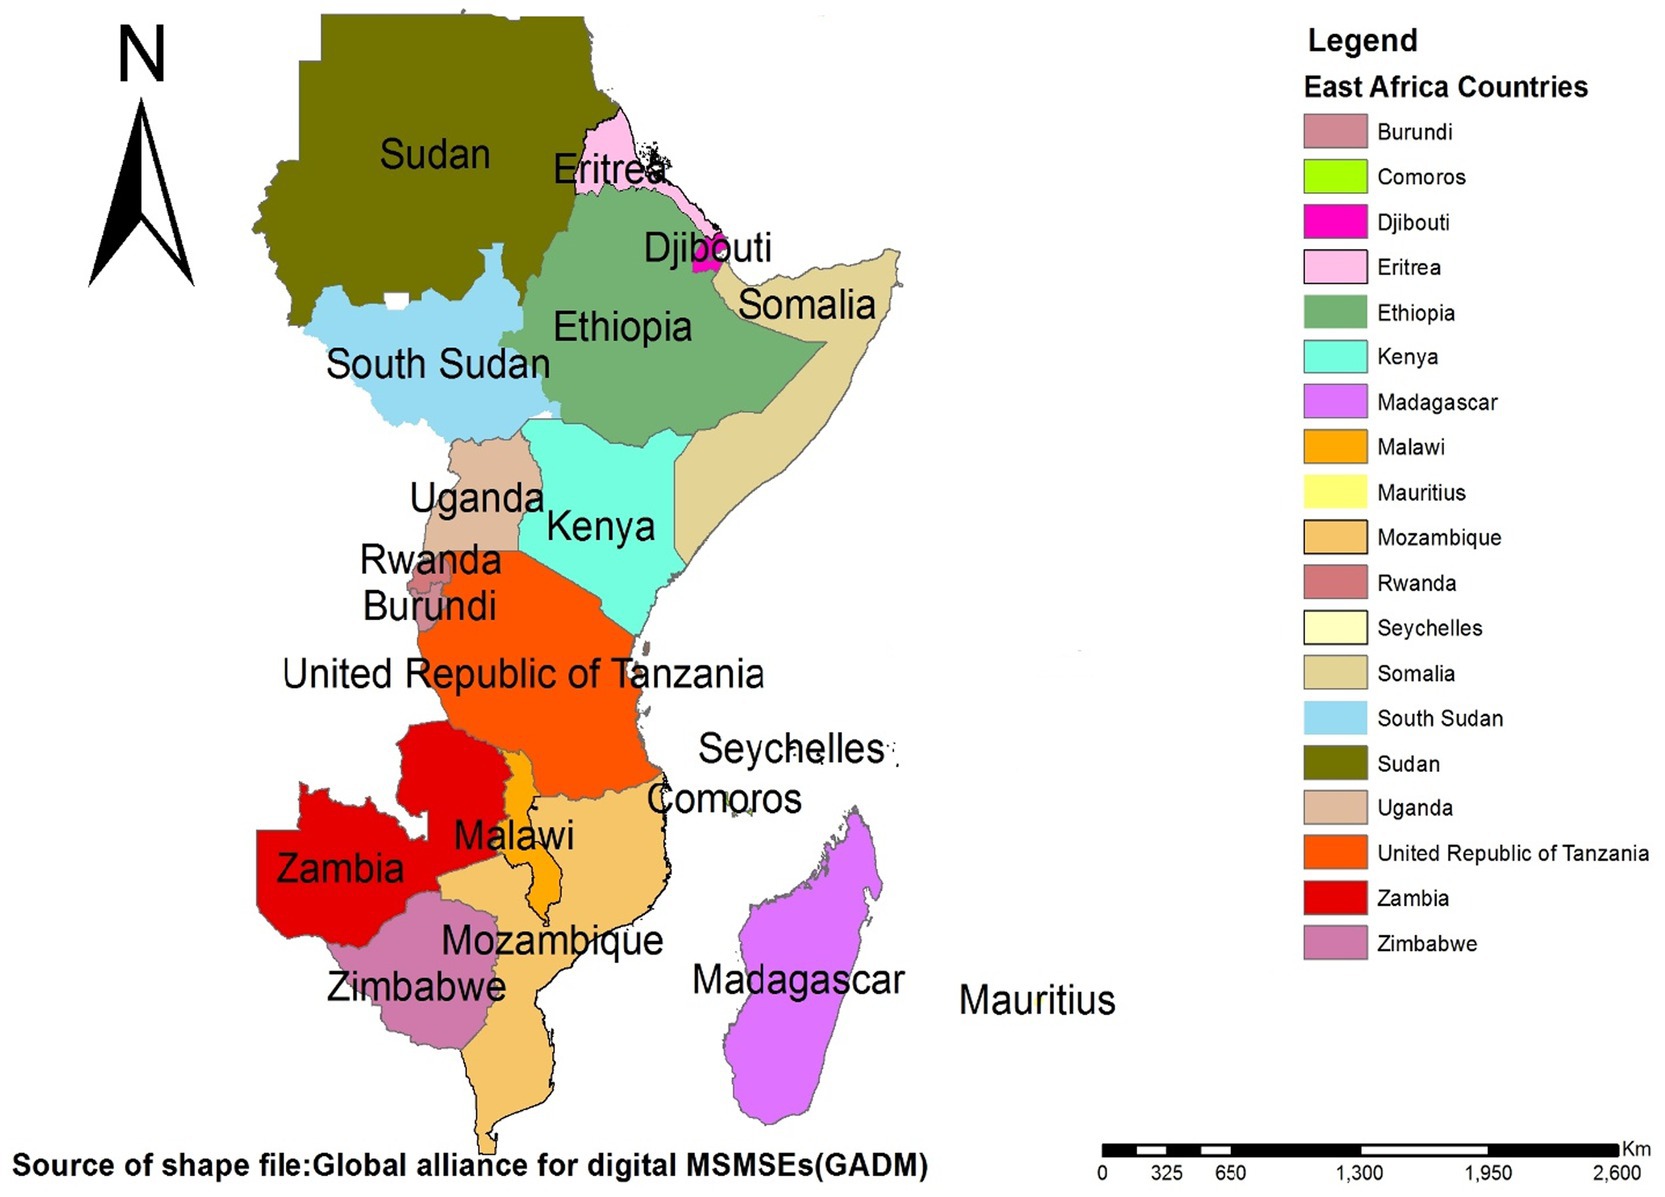
Figure 1. Map of East Africa, shapefile for the study area map was taken from GADM and plotted using ArcGIS Pro 2.8.0 software.
The data was obtained from the measure DHS program at www.dhsprogram.com after prepared concept notes about the project. A standardized dataset was employed (Croft et al., 2018). The purpose of demographic and health surveys (DHSs) is to collect a large, representative sample size from the source population while accounting for all relevant factors. To get comparable data on a global scale, these surveys use large sample sizes that are nationally representative and based on the population for each nation (Croft et al., 2018). There were 20 countries in WHO regions of East Africa. In history, only 14 countries had DHS data. For this study 12 countries with standard dataset between 2012 to 2023 were included. The 12 East Africa Countries in which data extracted include Burundi, Ethiopia, Kenya, Comoros, Madagascar, Malawi, Mozambique, Rwanda, Tanzania, Uganda, Zambia, and Zimbabwe. Following the integration of data from each country, 206,748 households in total were surveyed regarding their access to drinking water services, which served as a variable in our investigation (Table 1).
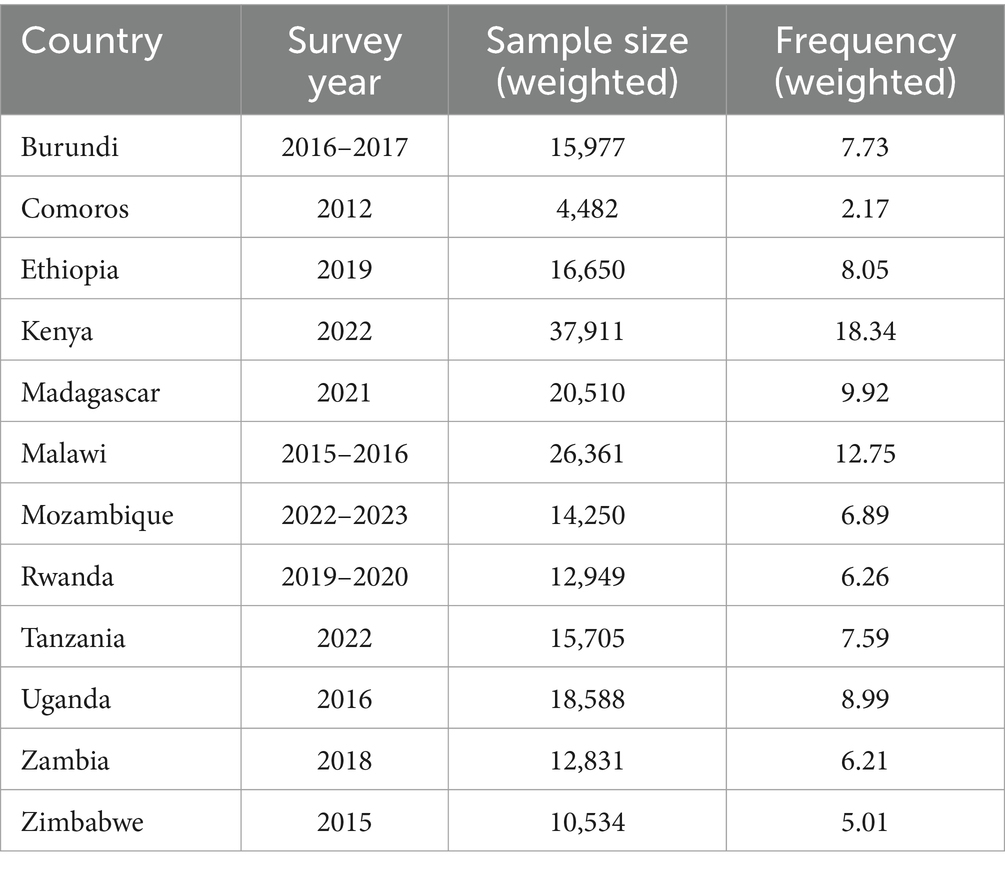
Table 1. 12 East African countries’ demographic and health surveys (DHS) with their respective sample size, and survey year.
The standard dataset of DHS reports were available for 12 countries in East Africa. The most recent census frame was used for each country. Within each administrative geographic region, the samples used for health and demographic surveys are usually separated into rural and urban regions. Enumeration areas (EAs) were selected in the first sample round using a probability corresponding to their size within each stratum. In the second step of sampling, a predetermined number of homes from the targeted EAs were chosen using the systematic sampling approach. Equal probability systematic sampling was used after the household listing to choose a specific number of homes from the designated cluster (Rutstein and Rojas, 2006).
The outcome variable in this study was limited access to drinking water services among households in East Africa. The access to drinking water services s were categorized into two groups: Basic access and Limited access to drinking water services. Basic access to drinking water is defined as drinking water from an improved source, provided collection time is not more than 30 min for a round trip (World Bank, 2024; Graham et al., 2016). The variable was then re-categorized as “Yes” (coded as “0”) if the household have basic access to drinking water, and the outcome variable “No” (coded as “1”) if the household have limited access to drinking water. This classification and analysis were done according to the guide to DHS statistics book (Croft et al., 2020).
Basic drinking water services is defined as drinking water from an improved source, provided collection time is not more than 30 min for a round trip (World Bank, 2024).
Limited drinking water services is defined as drinking water from an improved source for which collection time takes more than 30 min for a round trip, including queuing (WHO and UNICEF, 2017).
Data cleaning, analysis, recording, and weighting were all done using STATA version 14. The data set utilized was “Household Record (HR).” In order to enhance representativeness and produce more accurate outcomes, the sample were weighted. We used the household sample weight (hv005), which is the household weight (hv005) multiplied by the inverse of the household response rate for a household in the stratum, based on the four sampling weighting techniques specified by the DHS guidelines. To approximate the number of cases, household sample weights are created by dividing (hv005) by 1,000,000 before being used (Croft et al., 2018). Maps were developed for limited access to drinking water services s using ArcGIS Pro 2.8.0, which was also used for visualization and exploration. SaTScan version 10.0.2 was utilized to investigate notable spatial clusters using limited access to drinking water.
In order to determine the geographic position of limited access to drinking water services clusters and investigate the possibility of clustering in the area, spatial autocorrelation analysis was employed. The geographic clustering across the study area was measured using the Global Moran’s I Index. A statistical technique called global spatial autocorrelation, or Moran’s I, is used to quantify the degree to which the data are clustered and to display the pattern and strength of spatial autocorrelation (Pfeiffer et al., 2008). The Moran’s I value range from 1 to −1. The event is scattered when the Moran’s I value is close to −1; however, it indicates that the event is clustered when it is close to 1, and a score of zero indicates no clustering. The presence of spatial autocorrelation is confirmed by a statistically significant Moran’s I (p < 0.05) (Ord and Getis, 1995).
Getis-OrdGi* statistics were used to quantify the variation in spatial autocorrelation in East African countries (Ord and Getis, 1995). The Gi(d) statistic finds “hot spots” in spatial data by comparing local estimates of spatial autocorrelation with global averages (Pfeiffer et al., 2008). The Z-score was computed to confirm the statistical significance of limited access to drinking water services clustering at p-value<0.05 with 95% CI. The high/low clustering analysis results were interpreted within the context of a null hypothesis, i.e., “there is no spatial clustering of limited access to drinking water services.” When the absolute value of the z-score was large and the p-value was very small, the null hypothesis was rejected. The sign of the z-score was considered when the null hypothesis was rejected. A positive z-score value indicated that there was high clustering and a negative z- score value indicated that there was a low clustering in the study area. Statistical output with a high GI* indicates a hot spot, while a low GI* indicates a cold spot.
To investigate the potential statistically significant high rate clusters with limited access to drinking water services, a spatial scan statistical analysis was performed using the Bernoulli model by Kulldorff SaTScan version 10.0.2. Household with limited access to drinking water services were considered as cases and Household with basic access to drinking water services were considered as controls. We used spatial cluster size 50% of the population as a higher boundary to detect both large and small clusters. Both the primary and secondary clusters were found, and the log-likelihood ratio (LLR) test, whose p-value is produced by Monte Carlo replications, determines the significance of these identified clusters. The p value of LLR was estimated through 999 Monte Carlo simulations and clusters with less than 0.05 p-value was regarded as statistically significant (Alemayehu et al., 2020). We used ArcGIS Pro 2.8.0 to map the clusters.
Based on sampled clusters, geo-statistical ordinary kriging spatial interpolation approach was utilized to forecast households’ with limited access to drinking water services for un-sampled areas (Kulldorff, 1997).
This is a secondary analysis of previously collected and published household survey data, and as such ethical approval was not required for this work. Review boards in each country provided ethical clearance for each included survey, with informed consent provided by all participants. Details of this process vary by survey.
Spatial distribution of limited access to drinking water services among households showed significant non-random spatial variation among countries with Global Moran’s I value 0.16 (p < 0.0000) (Figure 2).
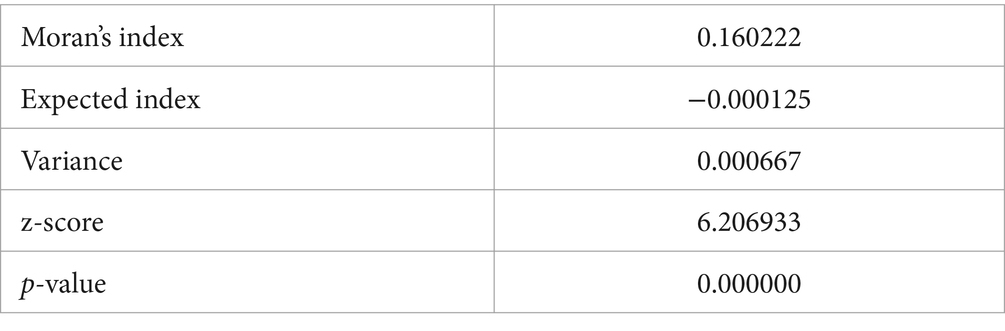
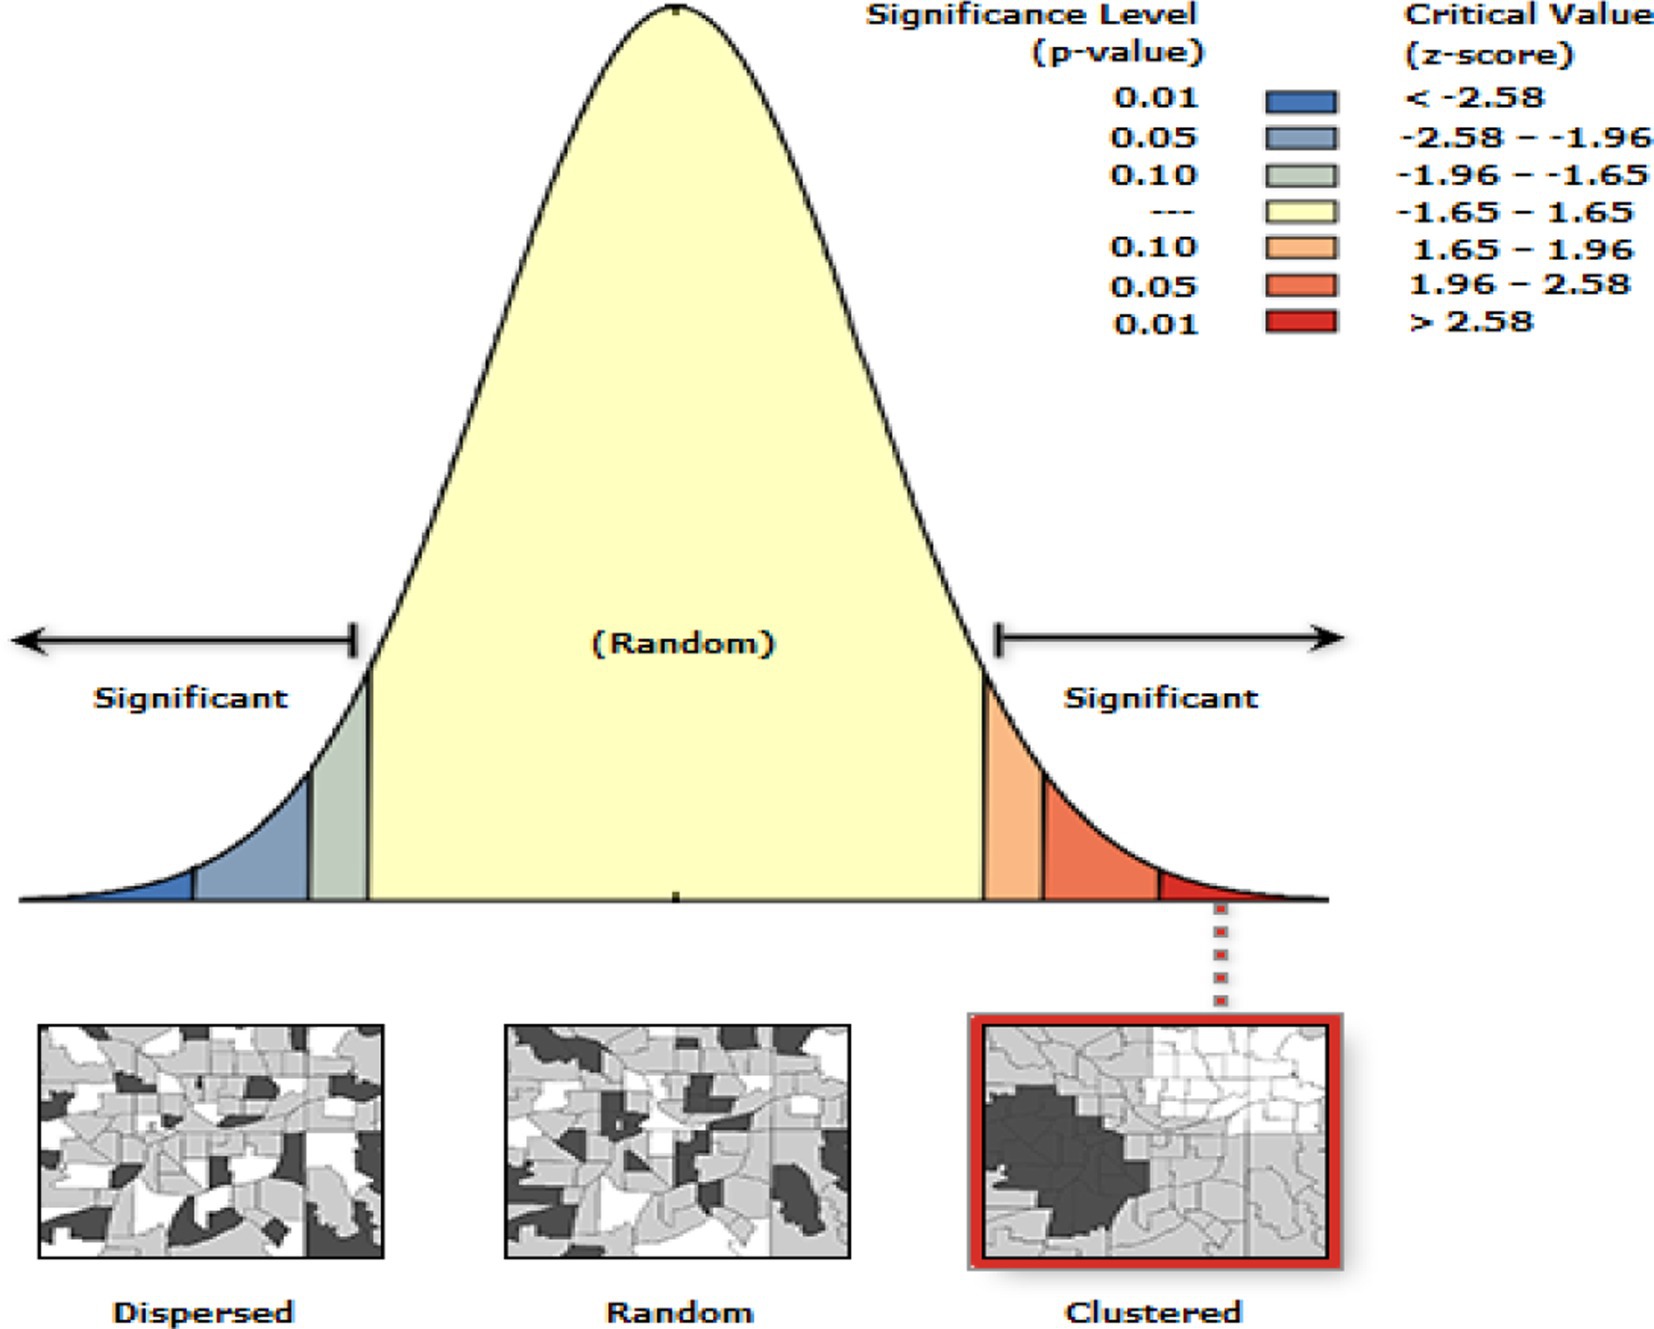
Figure 2. Spatial autocorrelation of limited access to water service among households in East Africa, DHS 2012–2023.
Red color in this graduated color map indicates areas with high proportion of limited access to drinking water services ranging from 0.706–1. These points are comparably dense in Ethiopia and Kenya. The next proportion ranging from 0.467–0.705 was indicated by orange color. The smallest proportion was indicated by white color (Figure 3).
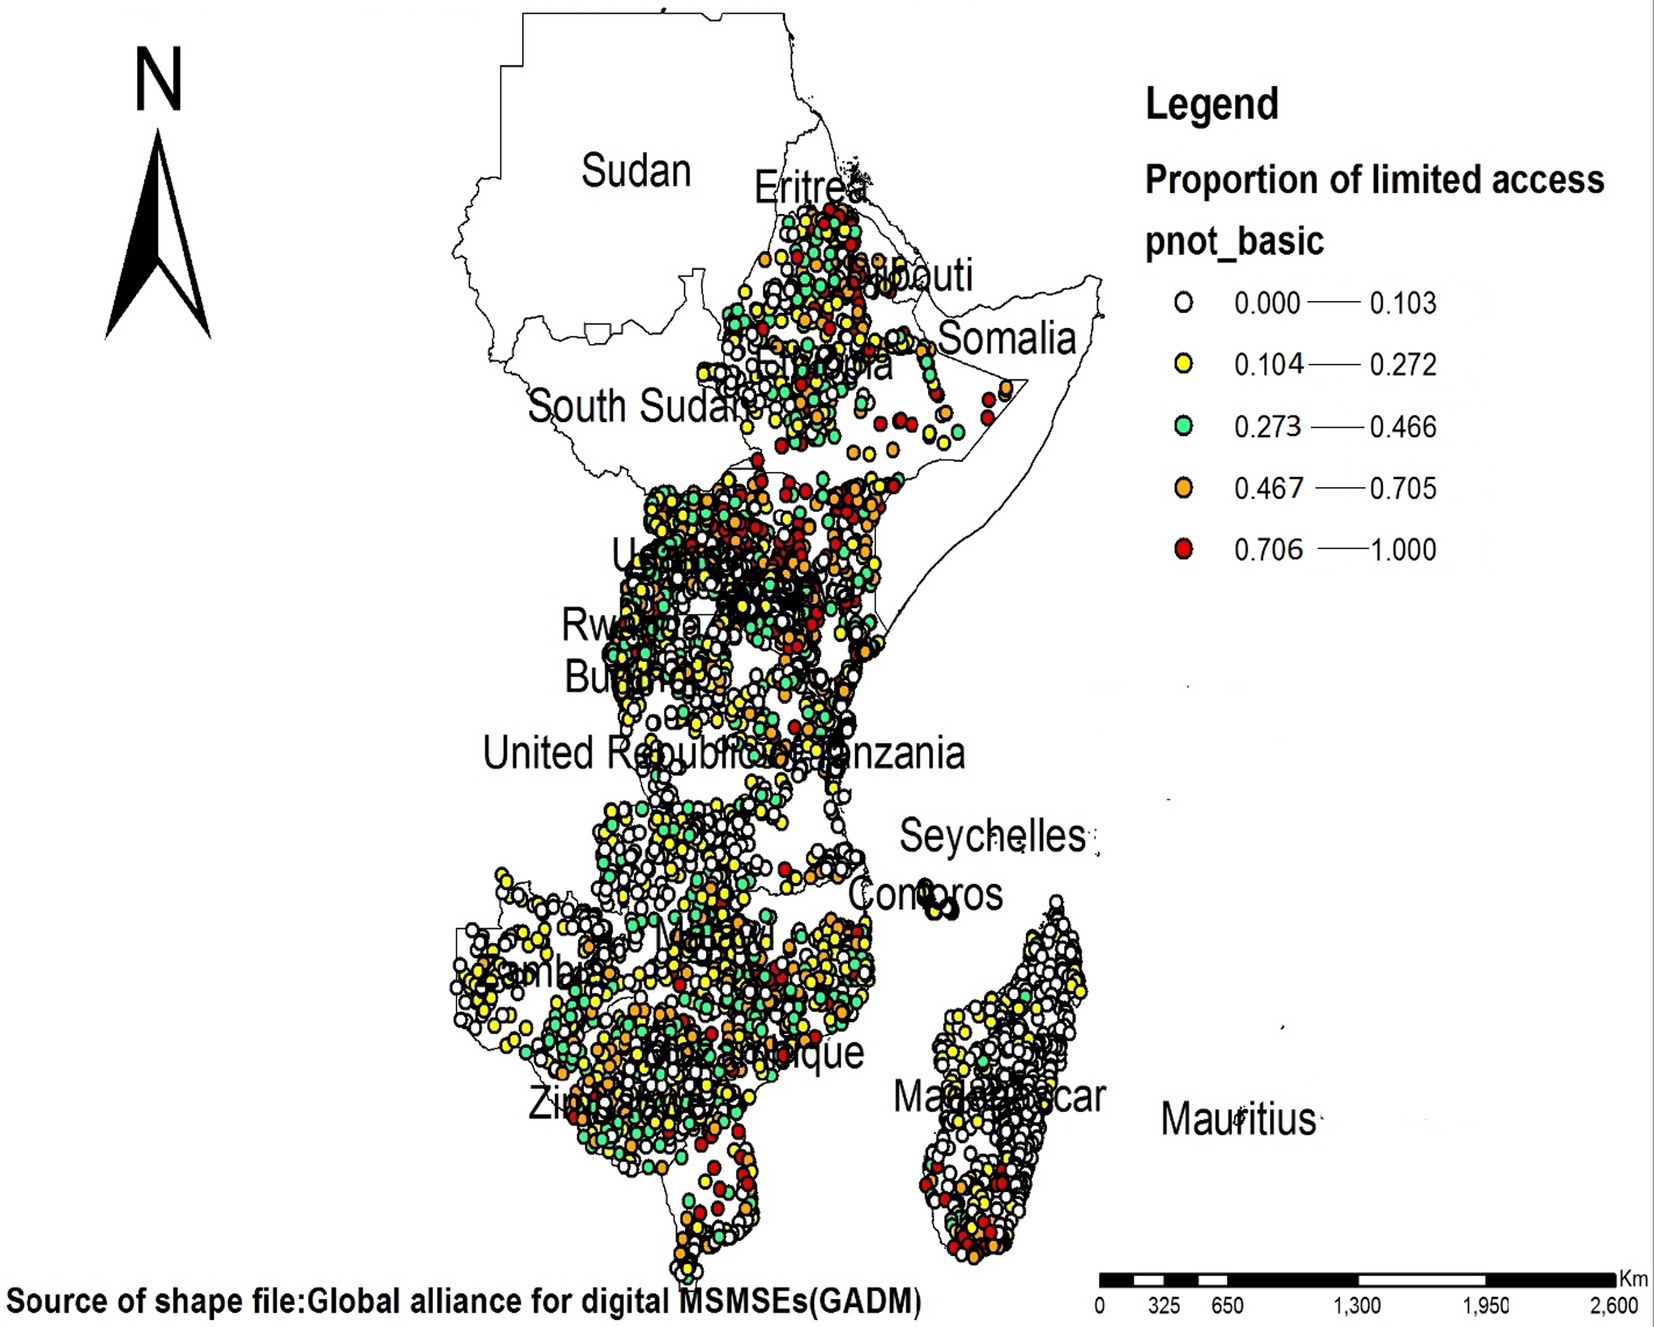
Figure 3. Graduated color (choropleth) map that depicts density based on the proportion of household with limited access to drinking water services in East Africa, DHS 2012–2023.
Hotspot analysis identified both hotspot and cold spot areas. Hotspot areas with high-rate clusters at 99 and 95% confidence were found in Uganda, Rwanda, Ethiopia, Kenya, Malawi, Mozambique and some part of Madagascar. While cold spot areas with low-rate clusters at 99% confidence were identified in Madagascar, Zimbabwe, Tanzania, Kenya, Comoros and Zambia. The maximum peak, where spatial clustering was highly pronounced was at 122269.8626 Meters with a corresponding Z score of 6.206933 (p-value = 0.000000). This distance band was used for the analysis of hotspot clusters (Figure 4).
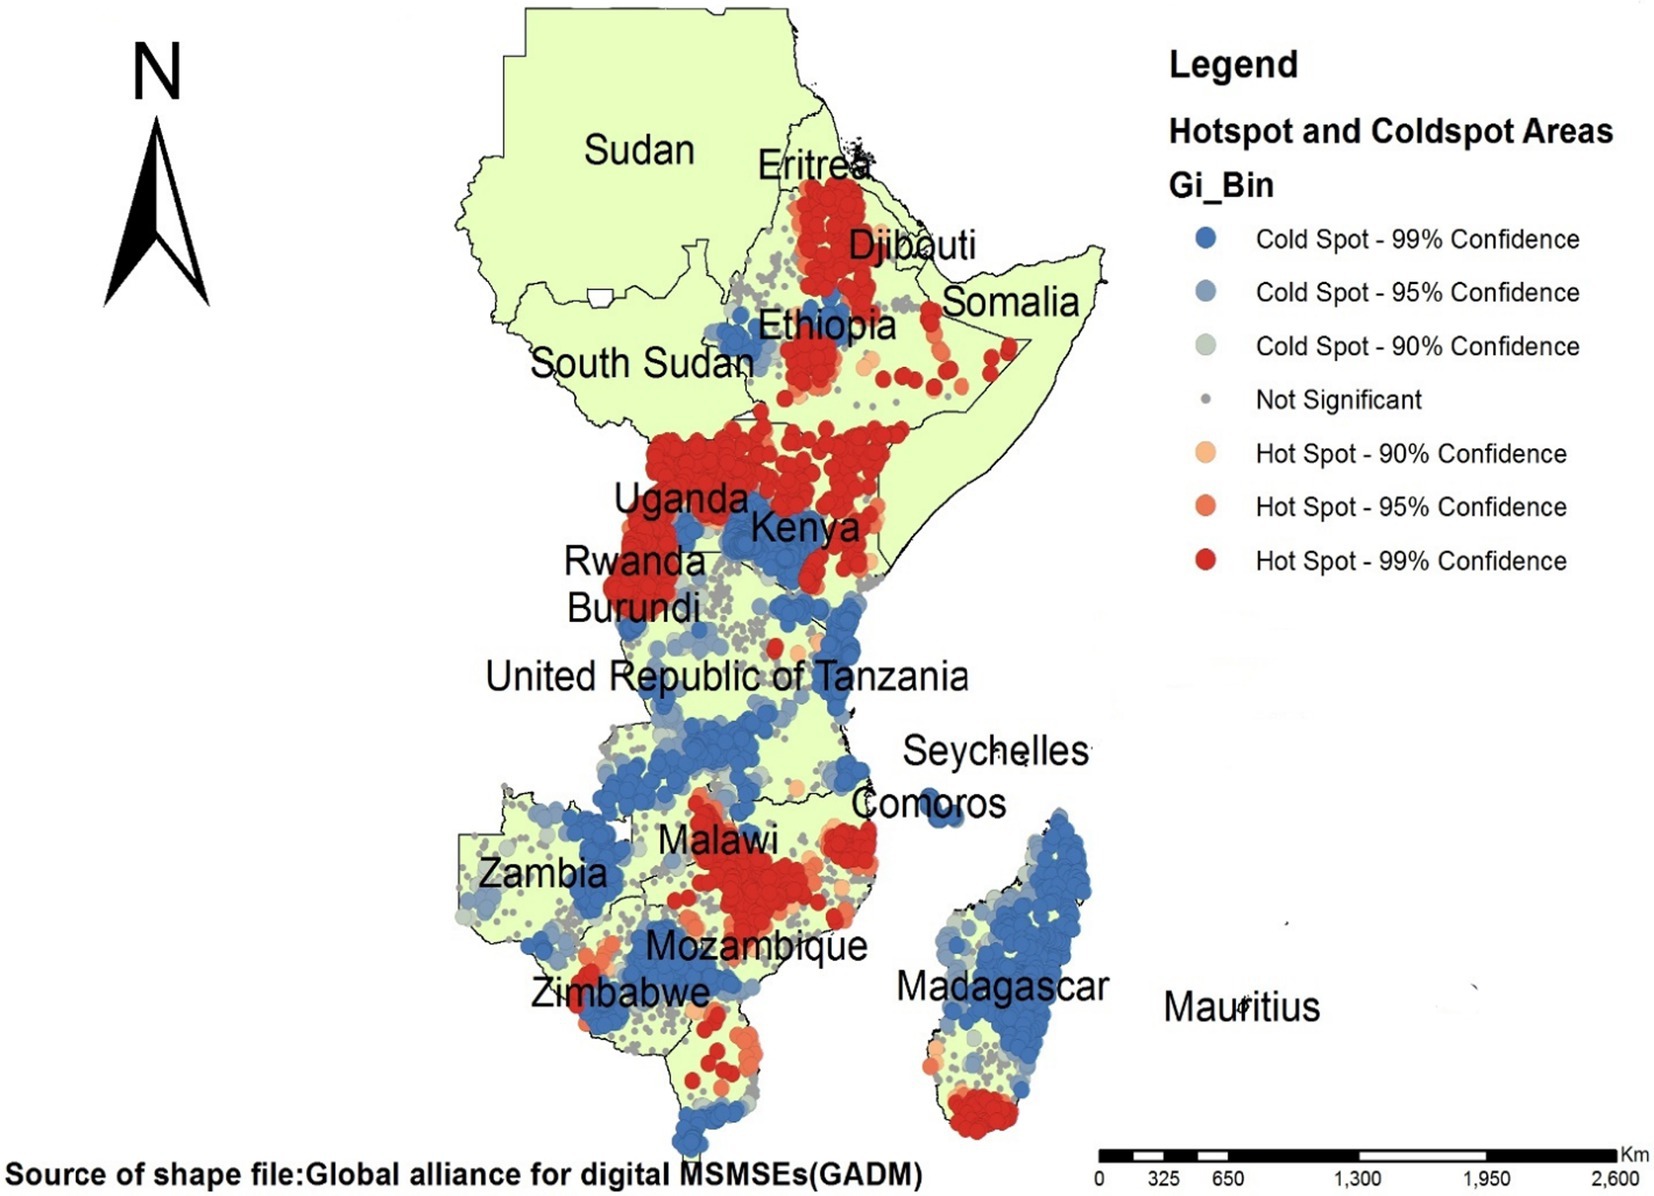
Figure 4. Hotspot and cold spot area detection of households with limited access to drinking water services in East Africa, DHS 2012–2023, shapefile from GADM and plotted using ArcGIS Pro 2.8.0 software.
Based on the outlier analysis mainly High-Low outlier and Low-High outlier was identified. High-Low outlier was observed in Kenya, Zambia, Zimbabwe, Tanzania and some parts of Madagascar. Low-High outlier was observed in Rwanda, Uganda, Ethiopia, Kenya, Malawi and Mozambique (Figure 5).
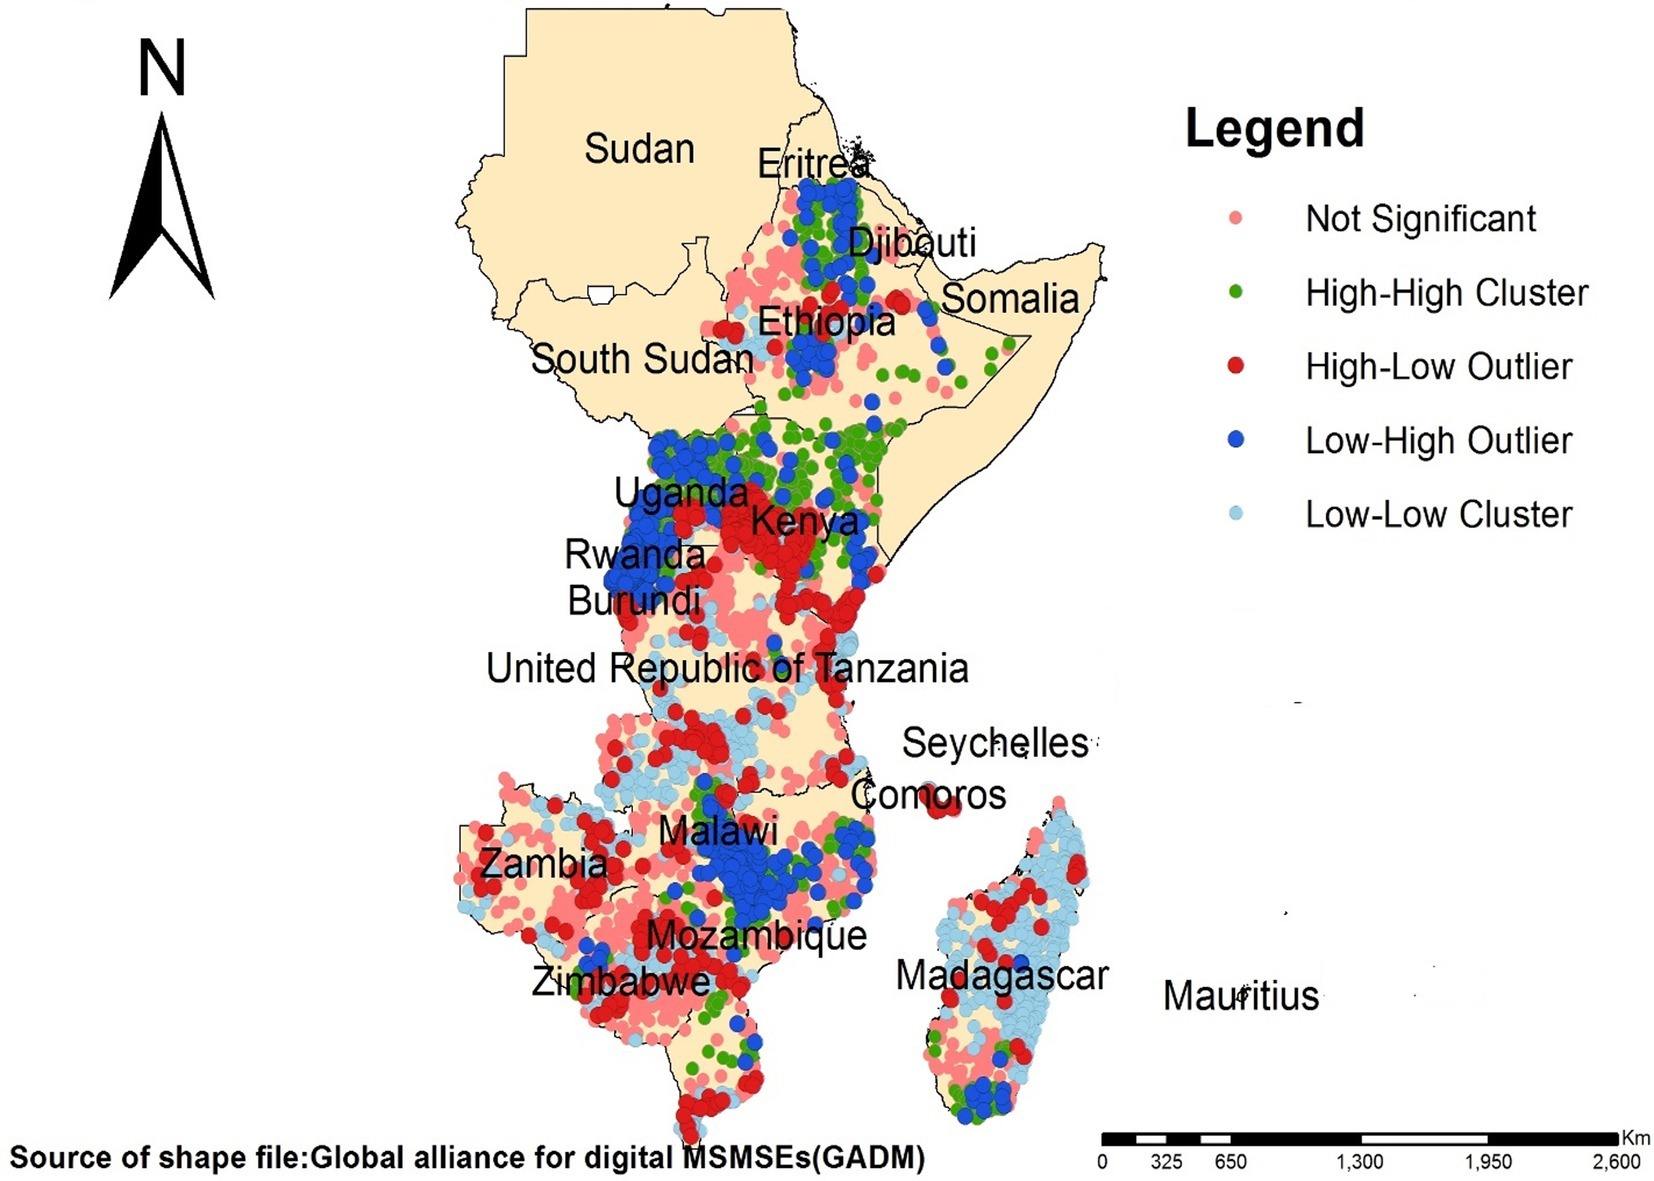
Figure 5. Outlier analysis of households with limited access to drinking water services in East Africa, DHS 2012–2023.
An interpolation that has been conducted using ordinary kriging predicted for an area that has not been sampled. The kriging interpolation revealed that Ethiopia, Kenya and Uganda predicted more limited access to drinking water services as compared to the other areas with a proportion ranging from 0.463 to 0.881 as it has been shown using dark red and orange color (Figure 6).
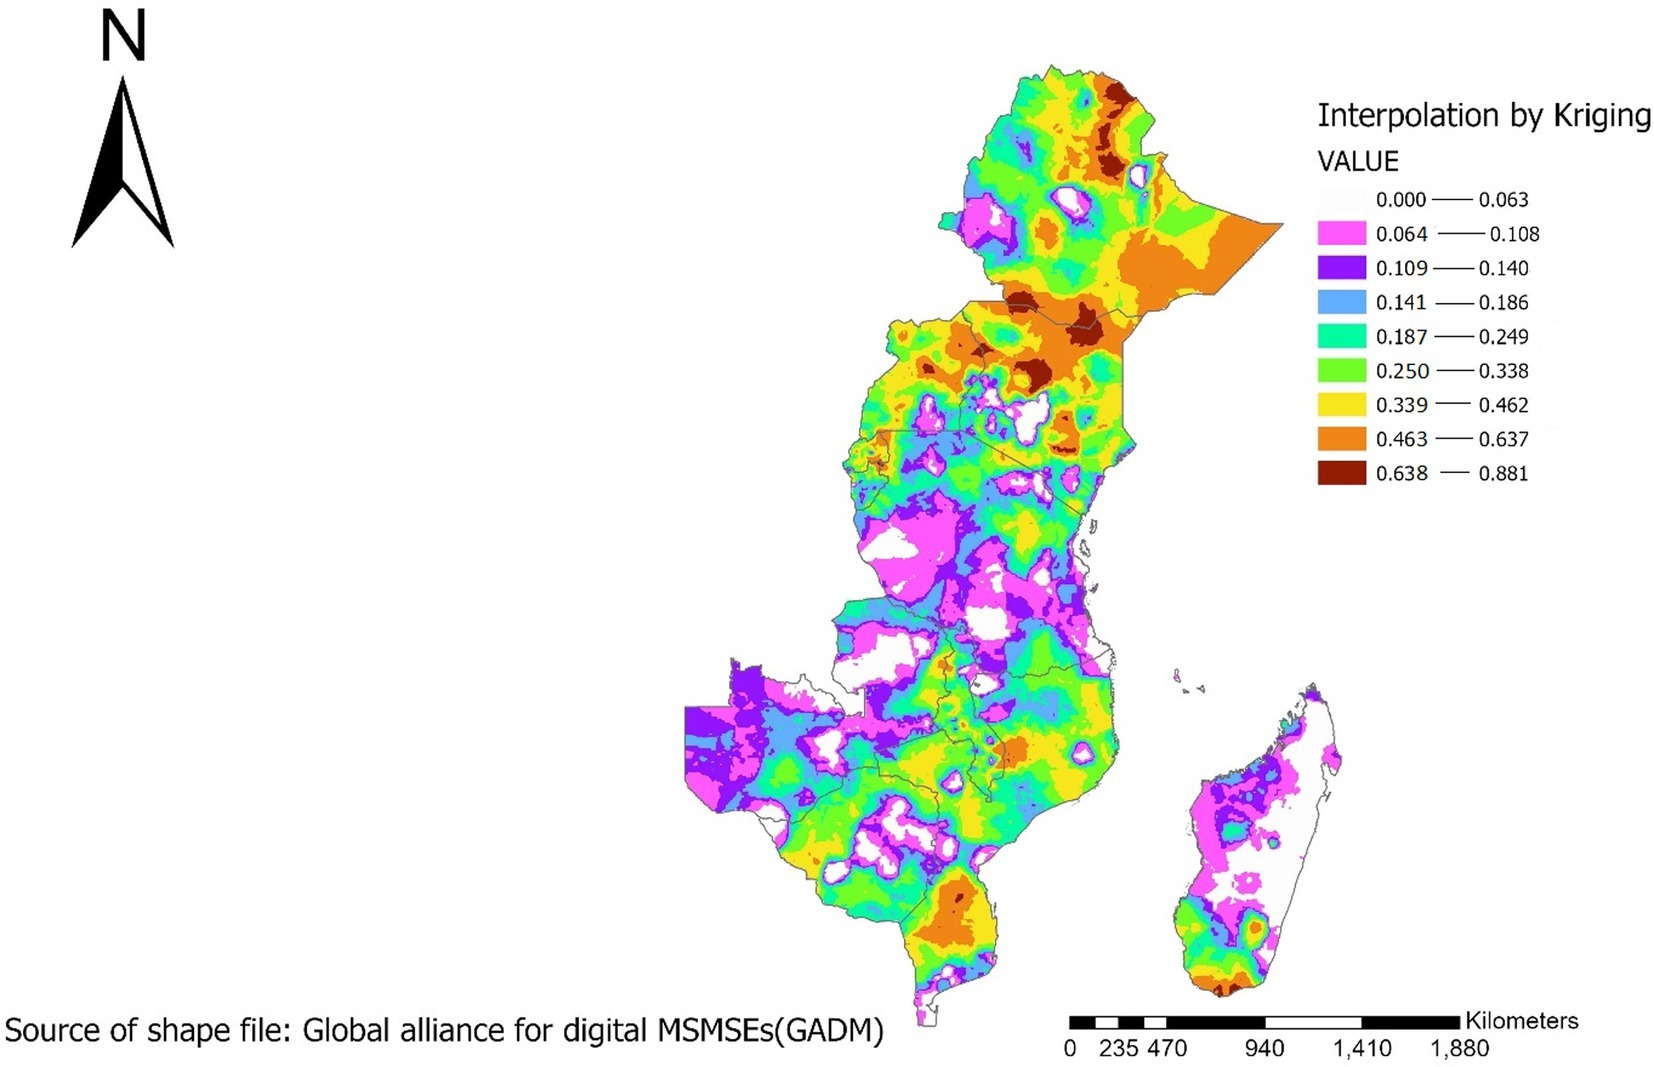
Figure 6. Kriging interpolation for households with limited access to drinking water services in East Africa, DHS 2012–2023.
The SaTScan spatial analysis identified significant 1 primary cluster and 39 secondary clusters (Supplementary File 1). The SaTScan purely cluster analysis identified different color windows based on the LLR values. The higher LLR clusters were represented by red window, and it was in the Uganda and Rwanda. The next window was represented by orange color, and it is in Ethiopia, Kenya, Malawi, Mozambique and Madagascar. clusters with small LLR were represented pink color (Figure 7).
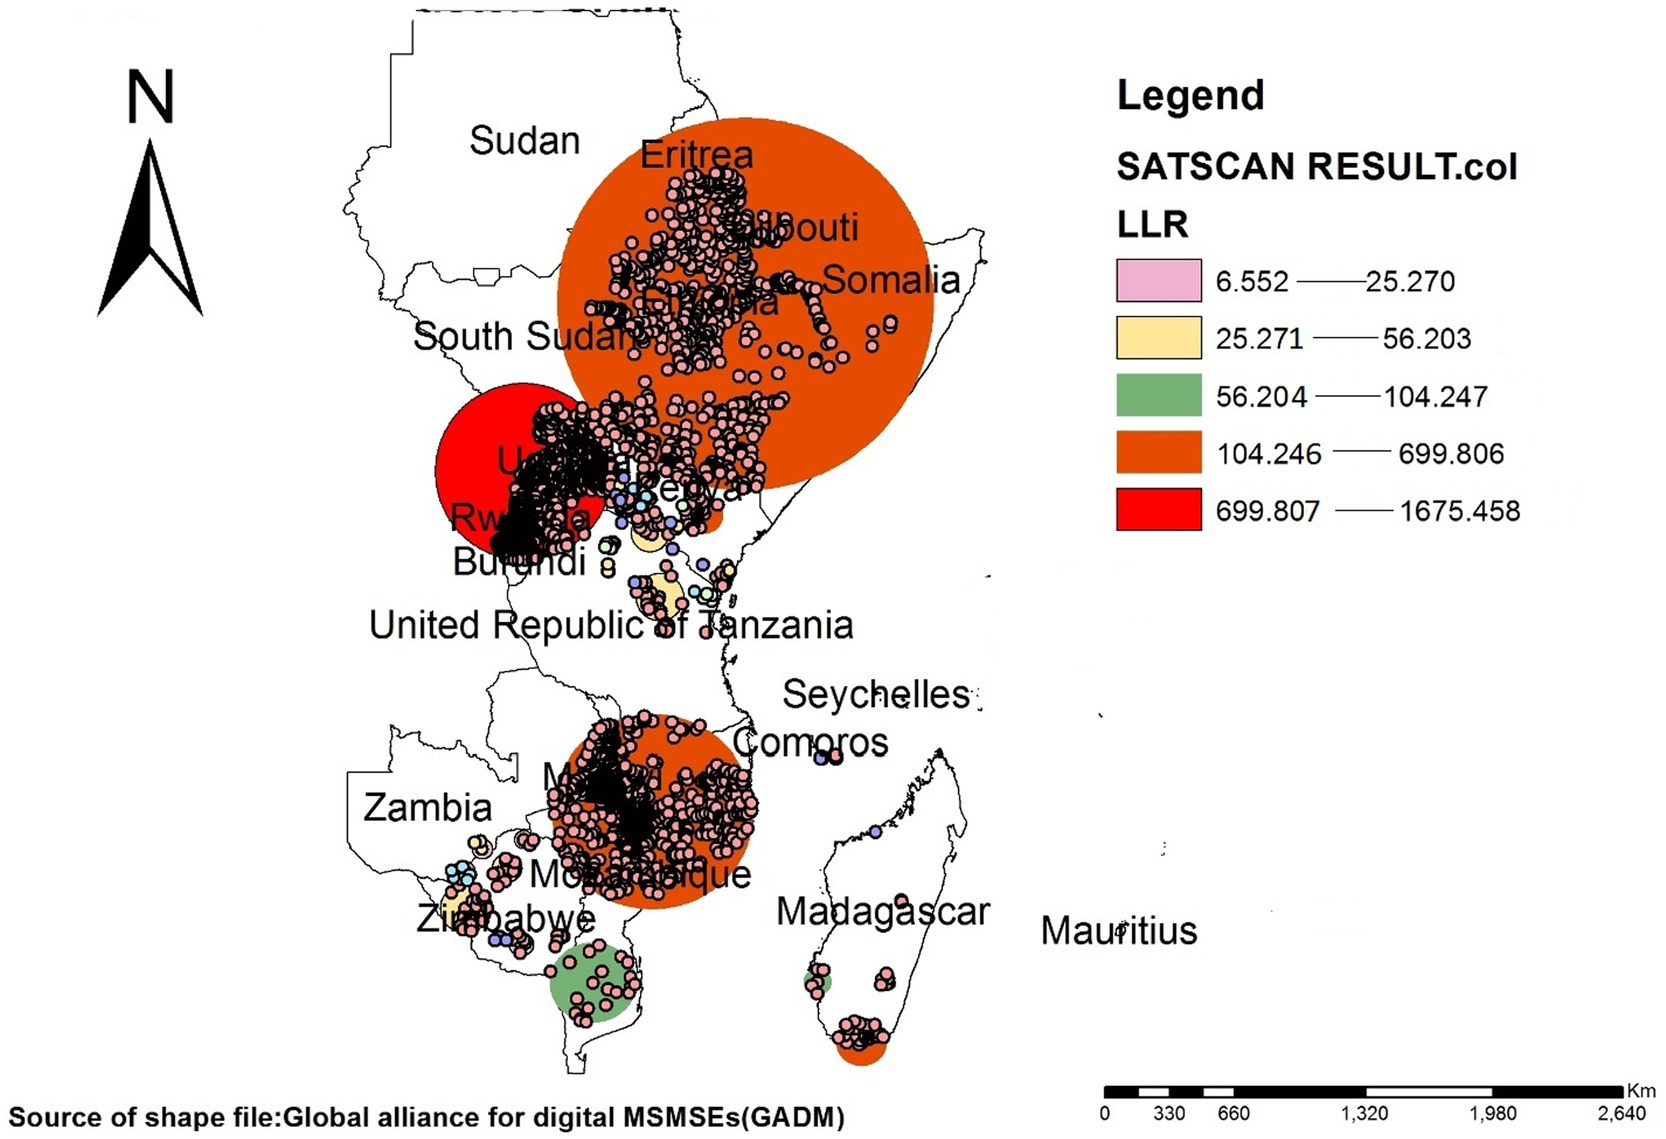
Figure 7. SaTScan high-rate clusters of limited access to drinking water services in East Africa classified by LLR, DHS 2012–2023.
This spatial analysis included 12 countries DHS data namely Burundi, Ethiopia, Kenya, Comoros, Madagascar, Malawi, Mozambique, Rwanda, Tanzania, Uganda, Zambia, and Zimbabwe to identify spatial clusters. To make the analysis methodologically rigorous and provides a comprehensive understanding of the spatial clusters both ARCGIS Pro and SaTScan analysis have been conducted. Hotspot and cold spot analysis, outlier cluster analysis, interpolation and SaTScan spatial analysis have been conducted.
This study identified a significantly high cluster in Uganda. According to a review conducted in Uganda nation the population who has access to improved water services were 61.3% in 2006, 65% in 2009, 64% in 2012. It also indicates that the national target of 77% in 2015 were not met (Asaba et al., 2014). The water source maintenance funding and functionality of community based management system also influence water access (Kamya et al., 2020). In Uganda, water scarcity due to drought poses the greatest threat to the rural population mainly in the south-eastern and north-eastern regions of Uganda (Tian and Liu, 2014).
The other spatial cluster identified were found in Rwanda. This could be due to population development, growth and irrigation needs for agriculture reasons, water usage increased significantly in the last 60 years which caused the limited access (Rheingans and Moe, 2006). The increased demands for commercial agriculture will also place significant pressures on water resource management (MINECOFIN, 2013). The water usage by the energy sector is increasing rapidly, as Rwandan authorities aim to increase energy capacity from 35 MW to 563 MW between 2000 and 2017 (Hakorimana, 2014). Insufficient management of water resources, unsustainable policies and programs, rapid population growth, industrialization, urbanization and insufficient education among others (Mukanyandwi et al., 2018).
The SaTScan spatial cluster analysis generally identified significant one primary cluster and 39 secondary clusters in East Africa. These clusters may be attributed by different factors. Population increases in rapidly growing urban and peri-urban areas. It is putting enormous pressure on land and water resources and has resulted in serious water stresses, poor waste management and severe diffuse pollution (Bahri, 2016).
This study identified non-random clusters and hotspots of limited access to drinking water services in different regions of East Africa. The variation was observed both within and across the countries. High-rate spatial cluster were observed in Uganda and Rwanda. The spatial variation and inequality in coverage of access to drinking water service should be dealt to address basic human rights and achieve sustainable development goals. Policymakers, researchers, and stakeholders such as non-governmental organizations (NGOs) and community-based organizations can join forces to tackle the challenges at hand. These stakeholders can create and carry out comprehensive plans to improve access to clean drinking water in various East African regions by combining their resources and expertise. Involving the community in the decision-making process is essential. Stakeholders can create interventions that are suited to the local community by having a thorough awareness of the particular requirements, worries, and preferences of the communities with relation to drinking water sources. This strategy improves the chances that these interventions will be sustained and accepted by the communities in which they are implemented. Finally, Special attention should be given to areas with high-rate spatial cluster in order to mitigate the negative consequences of limited access to drinking water sources.
This study has several merits. Firstly, this study “Geospatial analysis of limited access to drinking water source service in East Africa” is the first attempt in this study setting. Therefore, this study will serve as a baseline for developing targeted interventions and evaluating the progression of these intervention towards accessibility of water source services. Secondly, it used a large, weighted national representative dataset, which improved the findings’ generalizability. Thirdly, this study is methodologically rigorous and provides a comprehensive understanding of the spatial clusters in East Africa. It also serves as a starting point to explore factors that contributes for hot spot and cold spot areas.
Household accessibility of drinking water source service information was taken based on the respondent’s response and there was no confirmatory measurement for accessibility by time and distance.
The datasets presented in this study can be found in online repositories. The names of the repository/repositories and accession number(s) can be found in the article/Supplementary material.
Ethical approval was not required for the studies involving humans because Secondary data from East Africa DHS served as the basis for this investigation. The DHS office already handles issues pertaining to informed consent, confidentiality, anonymity, and privacy of study participants in an ethical manner. The studies were conducted in accordance with the local legislation and institutional requirements. Written informed consent for participation was not required from the participants or the participants’ legal guardians/next of kin in accordance with the national legislation and institutional requirements because Secondary data from East Africa DHS served as the basis for this investigation. The DHS office already handles issues pertaining to informed consent, confidentiality, anonymity, and privacy of study participants in an ethical manner.
GY: Conceptualization, Formal analysis, Investigation, Methodology, Project administration, Resources, Software, Supervision, Validation, Visualization, Writing – original draft, Writing – review & editing. KC: Methodology, Software, Writing – review & editing. AT: Conceptualization, Methodology, Writing – review & editing. ZG: Formal analysis, Methodology, Writing – review & editing. TK: Formal analysis, Methodology, Writing – review & editing. LD: Formal analysis, Methodology, Writing – review & editing.
The author(s) declare that no financial support was received for the research and/or publication of this article.
The authors are grateful to the DHS program for granting permission to conduct this study in accordance with research ethics.
The authors declare that the research was conducted in the absence of any commercial or financial relationships that could be construed as a potential conflict of interest.
All claims expressed in this article are solely those of the authors and do not necessarily represent those of their affiliated organizations, or those of the publisher, the editors and the reviewers. Any product that may be evaluated in this article, or claim that may be made by its manufacturer, is not guaranteed or endorsed by the publisher.
The Supplementary material for this article can befound online at: https://www.frontiersin.org/articles/10.3389/frwa.2025.1487795/full#supplementary-material
DALY, Disability-adjusted life years; DHS, Demographic and health survey; EA, Enumeration area; JMP, Joint monitoring program; LLR, Log Likelihood ratio; MDG, Millennium Development Goal; SDG, Sustainable Development Goal; STATA, Statistical software for data science; UNGA, United Nations General Assembly; UNICEF, United Nations International Children’s Emergency Fund; WASH, Water, Sanitation and Hygiene; WHO, World Health Organization.
Adloff, M., Singer, M. B., MacLeod, D. A., Michaelides, K., Mehrnegar, N., Hansford, E., et al. (2022). Sustained water storage in horn of Africa drylands dominated by seasonal rainfall extremes. Geophys. Res. Lett. 49:e2022GL099299. doi: 10.1029/2022GL099299
Alemayehu, B., Ayele, B. T., Valsangiacomo, C., and Ambelu, A. (2020). Spatiotemporal and hotspot detection of U5-children diarrhea in resource-limited areas of Ethiopia. Sci. Rep. 10:10997. doi: 10.1038/s41598-020-67623-0
Asaba, R. B., Fagan, H., Kabonesa, C., and Mugumya, F. (2014). Women and access to water in rural Uganda: a review. wH2O J. Gender Water 3, 7–13. Available at: https://mural.maynoothuniversity.ie/id/eprint/4808
Bartram, J., Lewis, K., Lenton, R., and Wright, A. (2005). Focusing on improved water and sanitation for health. Lancet 365, 810–812. doi: 10.1016/S0140-6736(05)17991-4
Croft, T. N., Marshall, A. M., Allen, C. K., Arnold, F., Assaf, S., and Balian, S. (2018). Guide to DHS statistics, vol. 645. Rockville: ICF, 292–303.
Croft, T., Marshall, A., Allen, C. K., Arnold, F., Assaf, S., Balian, S., et al. (2020). Guide to DHS statistics: DHS-7 (version 2). Rockville, MD: ICF.
Earth Observatory. “Failed rainy seasons create food emergency in eastern Africa,” (2021). Available at: https://earthobservatory.nasa.gov/images/149294/failed-rainy-seasons-create-food-emergency-in-eastern-africa
Ezeh, O. K., Agho, K. E., Dibley, M. J., Hall, J., and Page, A. N. (2014). The impact of water and sanitation on childhood mortality in Nigeria: evidence from demographic and health surveys, 2003–2013. Int. J. Environ. Res. Public Health 11, 9256–9272. doi: 10.3390/ijerph110909256
Gizaw, Z., Gebrehiwot, M., Destaw, B., and Nigusie, A. (2022). Access to basic drinking water services, safe water storage, and household water treatment practice in rural communities of Northwest Ethiopia. Sci. Rep. 12:20623. doi: 10.1038/s41598-022-25001-y
Grady, C. A., Van Nguyen, K., Van Nguyen, T., and Blatchley, E. R. (2018). Who is being left behind? An analysis of improved drinking water and basic sanitation access in the Vietnamese Mekong Delta. J. Water Sanit. Hyg. Dev. 8, 508–519. doi: 10.2166/washdev.2018.005
Graham, J. P., Hirai, M., and Kim, S.-S. (2016). An analysis of water collection labor among women and children in 24 sub-Saharan African countries. PLoS One 11:e0155981. doi: 10.1371/journal.pone.0155981
Hakorimana, C. (2014). Role of environmental impact assessment in decision making for hydropower projects in Rwanda: Case study of Rugezi and Mukungwa II hydropower projects. Delft: UNESCO-IHE.
Himeidan, Y. E., and Kweka, E. J. (2012). Malaria in east African highlands during the past 30 years: impact of environmental changes. Front. Physiol. 3:315. doi: 10.3389/fphys.2012.00315
IGAD Climate Prediction and Applications Centre: Eastern Africa’s invisible resource: Groundwater (2022). IGAD Climate Prediction and Applications Centre (ICPAC). Available at https://www.icpac.net/news/eastern-africas-invisible-resource-groundwater/?utm_source
Kamya, I. R., Asingwire, N., and Waiswa, D. B. (2020). Besides physical scarcity: an analysis of domestic water access in rural Rakai, Uganda. East. Afr. Soc. Sci. Res. Rev. 36, 115–131. doi: 10.1353/eas.2020.0008
Kulldorff, M. (1997). A spatial scan statistic. Commun. Stat. Theor. Methods 26, 1481–1496. doi: 10.1080/03610929708831995
Liu, L., Oza, S., Hogan, D., Perin, J., Rudan, I., Lawn, J. E., et al. (2015). Global, regional, and national causes of child mortality in 2000–13, with projections to inform post-2015 priorities: an updated systematic analysis. Lancet 385, 430–440. doi: 10.1016/S0140-6736(14)61698-6
Mara, D., Lane, J., Scott, B., and Trouba, D. (2010). Sanitation and health. PLoS Med. 7:e1000363. doi: 10.1371/journal.pmed.1000363
MINECOFIN (2013). Economic Development and Poverty Reduction Strategy II, 2013 -2018: Shaping Our Development. Ministry of Finance and Economic Planning (MINECOFIN) of Rwanda.
Mologni, C., Revel, M., Chaumillon, E., Malet, E., Coulombier, T., Sabatier, P., et al. (2024). 50-year seasonal variability in east African droughts and floods recorded in Central Afar lake sediments (Ethiopia) and their connections with the El Niño–southern oscillation. Clim. Past 20, 1837–1860. doi: 10.5194/cp-20-1837-2024
Montgomery, M. A., and Elimelech, M. (2007). Water and sanitation in developing countries: including health in the equation. Environ. Sci. Technol. 41, 17–24. doi: 10.1021/es072435t
Mukanyandwi, V., Nahayo, L., Hakorimana, E., Gasirabo, A., and Otgon, S. (2018). Review on water resources management and key threats in Rwanda, East Africa. J. Water Secur. 4, 1–8. doi: 10.15544/jws.2018.003
Ord, J. K., and Getis, A. (1995). Local spatial autocorrelation statistics: distributional issues and an application. Geogr. Anal. 27, 286–306. doi: 10.1111/j.1538-4632.1995.tb00912.x
Pfeiffer, D., Robinson, T. P., Stevenson, M., Stevens, K. B., Rogers, D. J., and Clements, A. C. (2008). Spatial analysis in epidemiology vol. 142. USA: Oxford university press Oxford.
Prüss-Ustün, A., Bartram, J., Clasen, T., Colford, J. M. Jr., Cumming, O., Curtis, V., et al. (2014). Burden of disease from inadequate water, sanitation and hygiene in low-and middle-income settings: a retrospective analysis of data from 145 countries. Trop. Med. Int. Health 19, 894–905. doi: 10.1111/tmi.12329
Pruss-Ustun, A., Bos, R., Gore, F., and Bartram, J. (2019). Safer water, better health: Costs, benefits and sustainability of interventions to protect and promote health. USA: World Health Organization.
Rheingans, C., and Moe, C. (2006). Global challenges in water, sanitation and health. J. Water Health 4, 41–57. doi: 10.2166/wh.2006.0043
Rutstein, S. O., and Rojas, G. (2006). Guide to DHS statistics, vol. 38. Calverton, MD: ORC Macro, 78.
Saxena, S. K., Kumar, S., Haikerwal, A., and Bhatt, M. (2018). Introductory chapter: neglected tropical waterborne infectious diseases-strategies for mitigation. Water Challeng. Urban. World 1. doi: 10.5772/intechopen.74322
Stocker, T., Qin, D., Plattner, G.-K., Tignor, M., Allen, S., Boschung, J., et al., "Summary for policymakers," (2014). Intergovernmental Panel on Climate Change (IPCC).
Terefe, B., Jembere, M. M., and Assimamaw, N. T. (2024). Access to drinking safe water and its associated factors among households in East Africa: a mixed effect analysis using 12 east African countries recent national health survey. J. Health Popul. Nutr. 43:72. doi: 10.1186/s41043-024-00562-y
Tian, H., and Liu, Y. (2014). “Air pollution Indicator: PM10” in Human Green Development Report 2014. ed. X. Li, vol. 2014 (Berlin, Heidelberg: Springer Berlin Heidelberg), 133–153.
UNICEF (2016). Collecting water is often a colossal waste of time for women and girls. New York, USA: Press release. Available at: https://www.unicef.org/press-releases/unicef-collecting-water-often-colossal-waste-time-women-and-girls (Accessed April 4, 2025)
United Nations (2015). Transforming our world: the 2030 agenda for sustainable development, vol. 1. New York: United Nations, Department of Economic and Social Affairs, 41.
United Nations (2019). The sustainable development goals report 2019. New York: Bertelsmann Stiftung and Sustainable Development Solutions Network (SDSN).
United Nations General Assembly (UNGA) (2010). "The human right to water and sanitation: Resolution/adopted by the general assembly, 3 august 2010," A/RES/64/292. Available online at: http://www.refworld.org/docid/4cc926b02.html2010
WHO and UNICEF (2017). Safely managed drinking water-thematic report on drinking water. Geneva: World Health Organisation (WHO) and the United Nations Children’s Fund (UNICEF).
WHO/UNICEF Joint Water Supply and Sanitation Monitoring Programme (2015). Progress on sanitation and drinking water: 2015 update and MDG assessment. Geneva, Switzerland and New York, USA: World Health Organization.
World Bank (1996). “Decision makers’ workshop: private sector participation,” in Water supply and sanitation services in sub-Saharan Africa (Vol. 1 of 2): Summary proceedings and outline for a roadmap. Washington, DC, USA: World Bank Group. Available at: https://documents.worldbank.org/en/publication/documents-reports/documentdetail/693131468009012380/335110v10priva1icipation00711912002 (Accessed April 4, 2025)
World Bank (2024). Health: disease prevention. Washington, DC, USA: World Bank Group. Available at: https://www.worldbank.org/en/topic/health/overview (Accessed April 4, 2025)
World Health Organization (2017). Progress on drinking water, sanitation and hygiene: 2017 update and SDG baselines. Geneva, Switzerland: World Health Organization. Available at: https://www.who.int/publications/i/item/9789241512893?utm_source (Accessed April 4, 2025)
World Health Organization (2019). Progress on household drinking water, sanitation and hygiene 2000–2017: Special focus on inequalities. Geneva, Switzerland: World Health Organization.
World Health Organization (2023). Drinking-water. Geneva, Switzerland: World Health Organization. Available at: https://www.who.int/news-room/fact-sheets/detail/drinking-water?utm_source (Accessed April 4, 2025)
Keywords: spatial distribution, drinking water access, water scarcity, East Africa, water services
Citation: Yitageasu G, Chekole Adane K, Tesfaye AH, Gizaw Z, Kifle T and Demoze L (2025) Geospatial analysis of limited access to drinking water services in East African countries: insights from recent demographic and health surveys. Front. Water. 7:1487795. doi: 10.3389/frwa.2025.1487795
Edited by:
Xubo Gao, China University of Geosciences Wuhan, ChinaReviewed by:
Mili Lala, Birla Institute of Technology, Mesra, IndiaCopyright © 2025 Yitageasu, Chekole Adane, Tesfaye, Gizaw, Kifle and Demoze. This is an open-access article distributed under the terms of the Creative Commons Attribution License (CC BY). The use, distribution or reproduction in other forums is permitted, provided the original author(s) and the copyright owner(s) are credited and that the original publication in this journal is cited, in accordance with accepted academic practice. No use, distribution or reproduction is permitted which does not comply with these terms.
*Correspondence: Gelila Yitageasu, Z2VsaWxheWl0YWdlYXN1MUBnbWFpbC5jb20=
Disclaimer: All claims expressed in this article are solely those of the authors and do not necessarily represent those of their affiliated organizations, or those of the publisher, the editors and the reviewers. Any product that may be evaluated in this article or claim that may be made by its manufacturer is not guaranteed or endorsed by the publisher.
Research integrity at Frontiers
Learn more about the work of our research integrity team to safeguard the quality of each article we publish.