
94% of researchers rate our articles as excellent or good
Learn more about the work of our research integrity team to safeguard the quality of each article we publish.
Find out more
ORIGINAL RESEARCH article
Front. Water, 26 March 2025
Sec. Water and Critical Zone
Volume 7 - 2025 | https://doi.org/10.3389/frwa.2025.1465505
This article is part of the Research TopicGroundwater Vulnerability Assessments: Integrating Experimental, Modeling, and Mapping TechniquesView all 5 articles
 Tauheed Ullah Khan1
 Ghulam Nabi2Sana Ullah3Ali Akbar4James Kehinde Omifolaji1Jahangir Khan Achakzai5
 Arshad Iqbal4*
Flood is the most frequent and destructive natural disaster, causing significant negative impacts on humans and built and natural ecosystems. While it is extremely challenging to prevent floods, their associated hazards can be mitigated through well-planned and appropriate measures. The present study combined the analytical hierarchy process (AHP) analysis and an ArcGIS-based multi-criteria decision-making (MCDM) approach to assess, categorize, quantify, and map the flood-prone areas in Khyber Pakhtunkhwa, Pakistan, a region particularly vulnerable to recurrent flooding. Eight key factors including precipitation, rivers/streams, slope, elevation, soil, normalized difference vegetation index, and land use were used for flood susceptibility modeling. The weighted sum overlay tool in global positioning system ArcGIS was utilized to give weightage to each raster layer, based on the AHP ranking to produce a flood susceptibility map for the study area. According to the AHP analysis, the most impactful factors defining the flood susceptibility in our study area were streams (0.29%), precipitation (0.23%), slope of the area (14%), and LST (10%). Our flood model achieved excellent accuracy, with Area Under the Curve (AUC) value of 0.911. The model predicted that 9% of the total area is classified as very high risk, while 14% is identified as high risk, covering approximately 923,257 hectares and 1,419,480 hectares, respectively. These high-risk zones are predominantly concentrated in the central and lower northern, densely populated districts of the province. Our flood susceptibility results would assist policymakers, concerned departments, and local communities in assessing flood risk in a timely manner and designing effective mitigation and response strategies.
As the most prevalent and destructive natural disaster, floods negatively impact both human populations and built and natural ecosystems (Kia et al., 2012; Mehravar et al., 2023; Samanta et al., 2018). It causes a significant damage to human lives, agricultural lands, infrastructure, properties, and the overall economy (Charlton et al., 2006; Dang and Kumar, 2017; Scheuer et al., 2017). Alarming statistics revealed that floods result in over 2000 human casualties annually, and affecting over 75 million people worldwide either directly or indirectly (Calil et al., 2015; Gain et al., 2015). This catastrophe is the outcome of several correlated natural “climate driven irregular rainfall and excessive snowmelts” and human-caused events including rapid urbanization, deforestation excessive use of greenhouse gases (Rao, 2001; Scheuer et al., 2017; Xu et al., 2023).
As the risk of floods and associated damages have intensified in recent decades (Alfieri et al., 2015; Arnell and Gosling, 2016; Zhao et al., 2022), effective flood susceptibility assessment modeling is required to minimize the floods hazards (Jamali et al., 2022; Otieno, 2004). Although floods are incredibly difficult to prevent entirely, with well-planned strategies and implementation of appropriate mitigation measures, the inherent risks related to flooding can be significantly reduced. To address these risks and enhance flood management, researchers have developed different method to assess, map, and manage the flood susceptibility for an area (Das and Gupta, 2021; Dou et al., 2018; Khosravi et al., 2016a). Accurate flood susceptibility assessment needs a thorough understanding of an area’s topographical and climatic variables, as some parameters are detrimental in defining an area’s vulnerability to flood hazards.
For instant, elevation is a major factor affecting the water depth and flow direction (Gigović et al., 2017). Higher-elevation areas having steep slopes are less vulnerable to floods in comparison to lower-elevation and flat areas (Das, 2019; Kazakis et al., 2015; Liuzzo et al., 2019). Similarly, the slope measures the extent to which an object is inclined either steeply or obliquely in relation to a horizontal plane and is considered one of the crucial variables in flooding (Gigović et al., 2017). The duration and water flow rate are greatly impacted by the slope (Islam and Sado, 2000). Compared to steeper terrains, flat surfaces are more flood-prone because the water flow is slower and it accumulates there for longer periods of time (Gigović et al., 2017; Rimba et al., 2017). Precipitation is also an important factor, as intense and heavy rainfall over a short period could increase the chances of flooding in an area (Gao et al., 2023; Santato et al., 2013). Moreover, the rainfall-runoff process is determined directly by the soil properties and type of the area, like the thickness, infiltration rate, permeability, and wetness before the rainfall (Ouma and Tateishi, 2014; Zhiyu et al., 2013). Different soil types have varying resistance and absorption capacities of water (Ouma and Tateishi, 2014; Zhiyu et al., 2013). Consequently, the water-holding capacity and infiltration properties of different soils also influence flood susceptibility (Sugianto et al., 2022; Hill et al., 2010; Shen and Chui, 2023). Many flood hazard management experts highlighted the importance of land use-land cover (LULC) in determining the rainfall-runoff process (Fernández and Lutz, 2010). Another variable that is a key indicator of flood hazards and flood risk zones is the distance of a location from streams and river (Fernández and Lutz, 2010). Areas closer to waterbodies like rivers and streams are more prone to flooding compared to those located away from riverbeds. Similarly, normalized difference of vegetation index (NDVI) is one of the crucial variables to determine the flood susceptibility of an area (Ali et al., 2020). Dense vegetation can reduce the effect of floods (Ali et al., 2020). Finally, land surface temperature (LST) is a basic component of a regional climate and impacts ecosystems both locally and globally. LST is the measure and a good indicator of the thermal radiation emission from the land surface, which determine air flow temperature and its flow, consequentially effecting floods (Xue et al., 2018).
Flood management is crucial component in understanding flood and the formulation of risk-curtailing strategies to minimize the associated threats (Abbaszadeh, 2016; Dandapat and Panda, 2017). Numerous studies have highlighted the importance of identifying and mapping flood-risk areas to lower flood-related losses (Calil et al., 2015; Gain et al., 2015; Rao, 2001; Samanta et al., 2018; Zou et al., 2013). Flood hazard mapping is a pivotal tool, as it plays a critical role in planning, early warning systems, appropriate response efforts, and risk mitigation (Gain et al., 2015; Siahkamari et al., 2018). Advanced experimental and modeling analyses are crucial for the prediction and monitoring of natural variables and their impacts on flood susceptibility. For example, the use of UAV-acquired multispectral images has been shown to effectively assess the biomass of riparian plants and its influence on the hydrodynamics of vegetated streams (Crimaldi and Lama, 2021). Moreover, understanding the flow resistance of floodplain vegetation mixtures plays a significant role in modeling river flows, with vegetation cover directly affecting water movement and flood behavior (Box et al., 2021). Similarly, the validation of global flow resistance models in experimental drainage channels can improve predictions related to flow dynamics in vegetated waterways (Errico et al., 2019). However, the significance of flood hazard mapping cannot be overstated, as it encompasses crucial elements such as flood awareness, early warning systems, and the development of initiatives to reduce flood hazards (Dang and Kumar, 2017; Das and Gupta, 2021).
Innumerable attempts have been made to estimate and illustrate the areas susceptible to flooding (Hong et al., 2018; Shafapour Tehrany et al., 2017; Zhao et al., 2018). A variety of techniques and statistical models have been developed for a precise flood assessment (Abbaszadeh, 2016; Dandapat and Panda, 2017; Naulin et al., 2013). However, conventional flood hazard mapping techniques have various shortcomings (Guo et al., 2014). Traditional flood hazard mapping relies on historical flood records, simple hydrological models, or static inundation maps, which fail to account for dynamic factors like urbanization, deforestation, or climate change. While useful for baseline data, these methods lack the precision and spatial accuracy needed for detailed risk assessments, especially in rapidly changing environments. They are also less effective in predicting extreme weather or compound flood hazards, which require advanced, multi-criteria decision-making models. Moreover, in developing countries with limited resources, the traditional methods pose additional obstacles due to their resource-intensive nature, thus making them inappropriate in such regions.
Since traditional approaches may not provide an extensive understanding of river and flood dynamics, this emphasizes the need for alternative and innovative approaches (Mahmood and Ullah, 2016; Ozdemir and Altural, 2013). In recent years, researchers have developed various models and methods, often in combination with geospatial technologies, to identify and delineate flood hazard areas (Ali et al., 2020; Shafapour Tehrany et al., 2017; Yariyan et al., 2020). This study integrates global positioning system ArcGIS 10.5 (hereafter GIS), remote sensing, and multi-criteria decision analysis (MCDA) using the analytical hierarchy process (AHP) analysis to model flood susceptibility, due to the high accuracy, efficiency and convenience of this approach (Ajibade et al., 2021; Allafta and Opp, 2021; Aydin and Sevgi Birincioğlu, 2022; Das and Gupta, 2021; Karymbalis et al., 2021). Recently, this method has been used in many studies to track down and depict flood-prone zones (Ali et al., 2020; Hagos et al., 2022; Hong et al., 2018; Khosravi et al., 2016b; Mahmood and Rahman, 2019; Negese et al., 2022).
Pakistan has been impacted by floods on every front (Hussain et al., 2020), experiencing 21 major floods between 1950 and 2011, averaging one major flood every three years (Shah et al., 2017). These floods claimed 8,887 lives, caused an estimated economic loss of 19 billion US dollars, and destroyed more than 100,000 villages (Ali, 2013). Prior to 2022 flood, the country faced one of the biggest floods in 2010, which affected over 14–20 million people and caused 1,700 fatalities and caused economic damage worth US$9.7 billion by effecting almost every sector of the country (Floods, 2010). However, Pakistan was hit by an even more catastrophic event in 2022, often referred to as the “monster” flood, which simultaneously affected all four provinces (Nanditha et al., 2023). By October 11, 2022, a total of 94 districts of all four provinces of the country, were proclaimed flood afflicted. Alone in Khyber Pakhtunkhwa (KP) province, 17 districts were affected by the 2022 flood. It affected a population of around 4,350,490, resulting in 306 human casualties [males 149 (49%), females 41 (13%), and children 116 (38%)] and 21,328 livestock losses. Furthermore, 91,463 households (HHs) were fully or partially damaged due to the floods. Additionally, 107 bridges crumbled, and 1,275 kilometers (km) of roads were damaged. Crops, being no exception, as about 107,220 hectares of agricultural land was hit by the 2022 flood. Given KP’s vulnerability to recurring floods (Mahmood and Ullah, 2016; Ullah et al., 2018), this study focuses on assessing, categorizing, mapping, and quantifying the flood susceptibility of the province. The region’s complex topography and sensitive climate have aggravated flood susceptibility (Rahman et al., 2023; Ullah et al., 2018). Moreover, the study area is the first impact zone for most of the flood events in the country. This study aims to asses, categorize, map, and quantify the flood susceptibility of the Khyber Pakhtunkhwa province.
Our study area is the Pakistan’s northernmost province, Khyber Pakhtunkhwa (KP) (34° 036.20 N, 71° 35′9.53E) (Figures 1A–D). It spreads across 10,174,100 hectares with an elevation range of 149–7,371 meters above sea level (Figure 1C). According to the most recent national census (https://www.pbs.gov.pk/), he province has experienced a growth rate of 2.38% since 2017, bringing the total population to 40.8 million (with a population density of 401.6 people/km2). The majority of the population resides in the central and lower northern regions of the province (Figure 1D). The KP is the third-most populous province in Pakistan, yet smallest by land area and second-most underdeveloped within the country (Zaidi et al., 2013). The province’s terrain consists of landforms, ranging from forest-covered and snow-capped mountain ranges in the north to undulating submontane areas and plains surrounded by hills in the south. The snow-caped northern mountains serve as a source of water for different rivers and streams that emerge from these mountains and run down toward the lower southern parts of the area. The climate of the province generally changes with elevation. The province experiences varying amounts of precipitation, with an average of 16 inches per year with highest from January to April. During the winters, the northern zone is snowy and cold and receives heavy rainfall, while the summer season is pleasant with moderate rainfall, except in the capital Peshawar, which is hot in the summer and has comparatively cold winters with less rainfall. The northern parts receive heavy rains and snowfall between the months of November and February as compared to the southern parts, where rainfall is lower. A variety of wildlife fauna is found in the province, including a few captivating wild mammals like the snow leopard (Panthera uncia), common leopard (Panthera pardus), Himalayan lynx (Lynx lynx isabellinus), Kashmir markhor (Capra falconeri cashmiriensis), Himalayan ibex (Capra ibex sibirica), and urial (Ovis vignei) (Molur, 2003; Roberts and Bernhard, 1977).
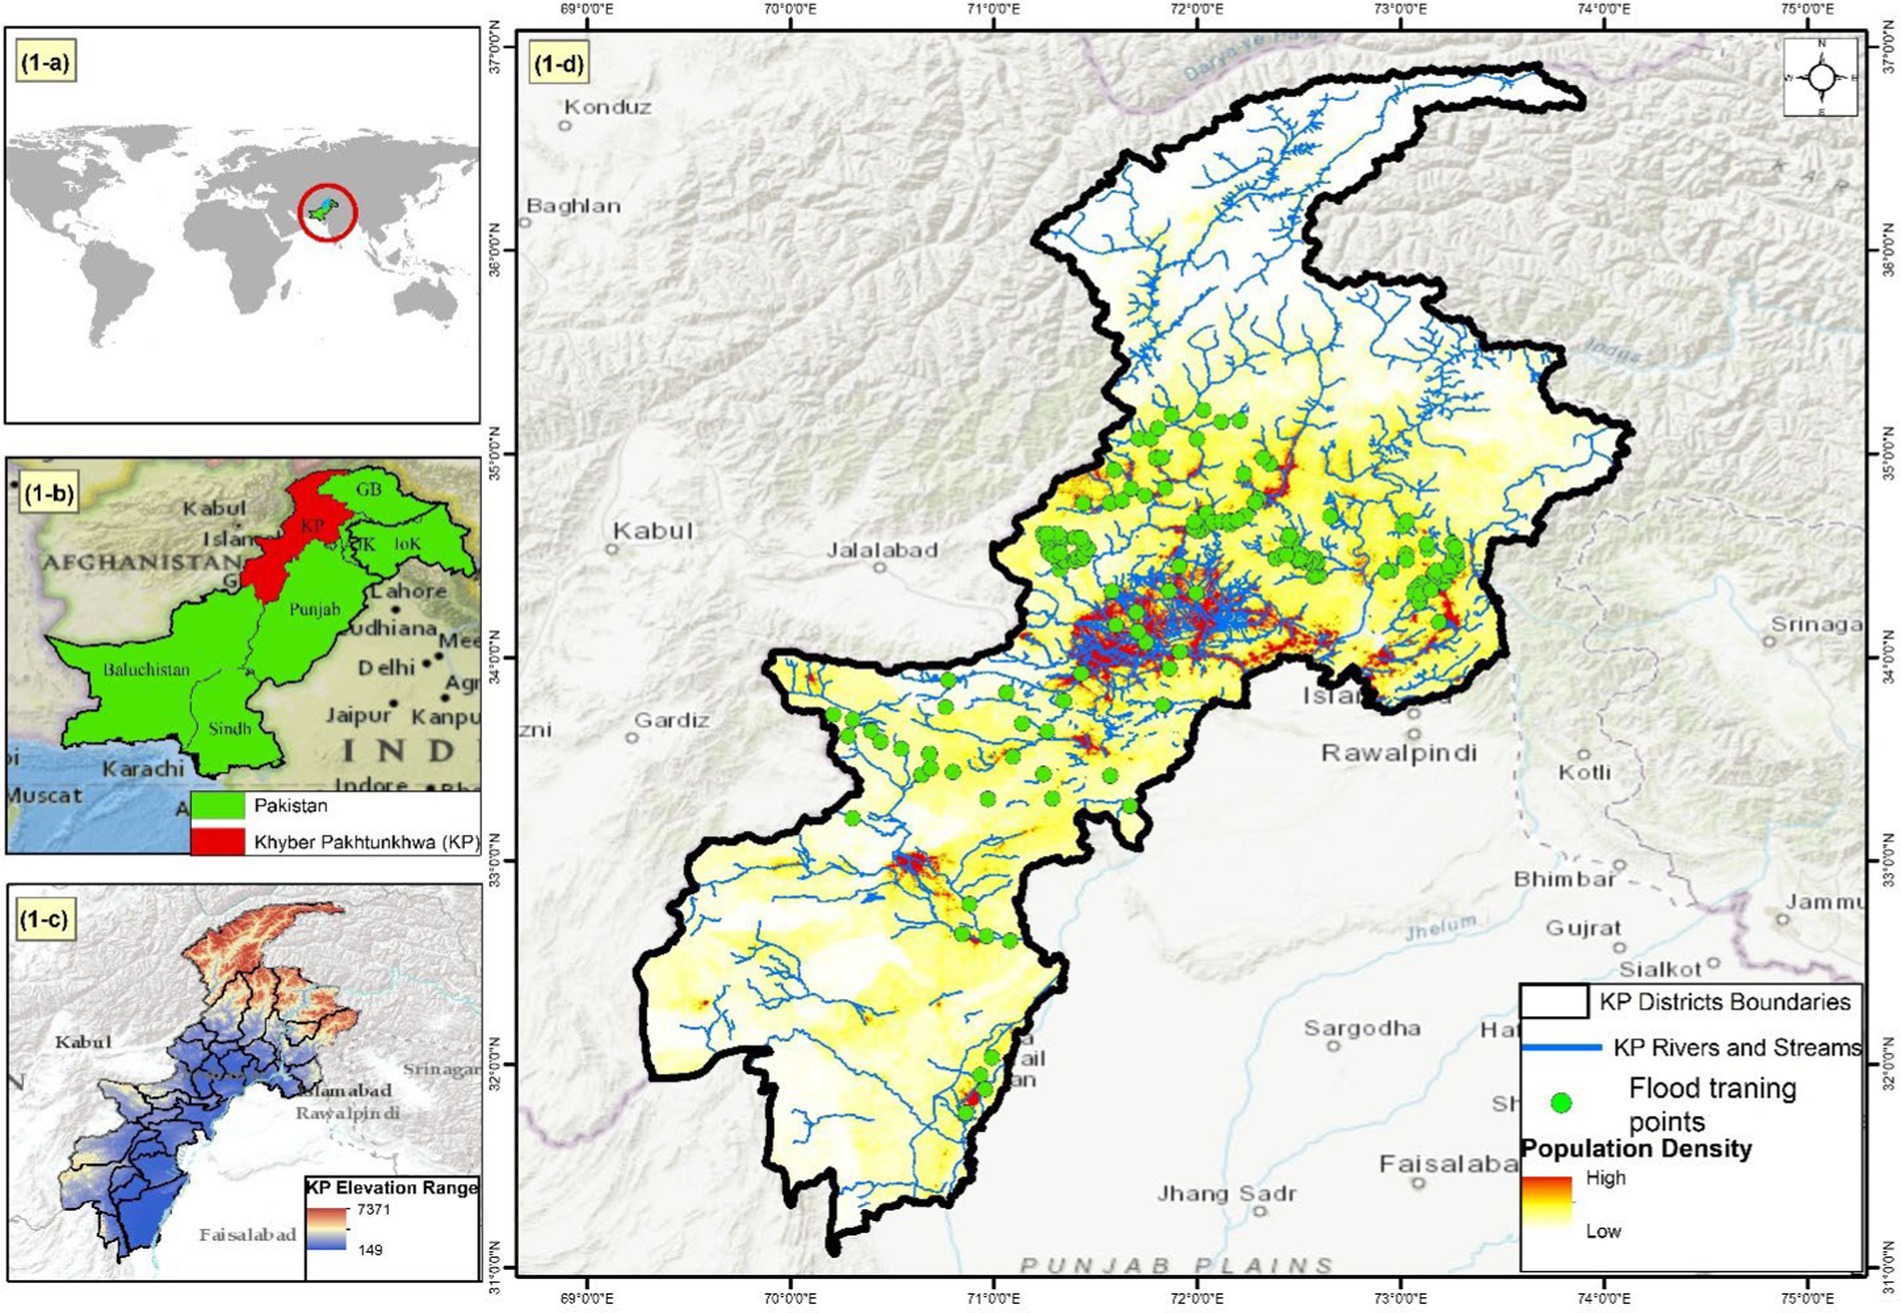
Figure 1. Location of the study area, (A) Location of Pakistan in the world, (B) Location of study area in Pakistan, (C) Elevation range of KP, (D) Human population density and location of 2002 flood extent.
In this study, the selection of eight factors—precipitation, streams/rivers density, slope, elevation, soil type, land use/land cover (LULC), NDVI, and LST—was based on their established relevance to flood susceptibility in the region. These factors were identified through a comprehensive literature review, which highlights their significant influence on flood dynamics in similar topographical and climatic settings (Khosravi et al., 2016a; Ali et al., 2020). Specifically, precipitation and streams/rivers density directly impact flood events, while slope and elevation influence water accumulation and flow. NDVI and LULC assess land cover’s role in flood mitigation, and soil type and LST provide insights into water retention and regional climate variations that exacerbate flood risk. Eight factors including streams/rivers, precipitation, slope, land surface temperature (LST), soil, land use and land cover (LULC), elevation (DEM), and normalized difference of vegetation index (NDVI) are expected to be impactful in defining the flood susceptibility in the study area (Figure 2; Table 1). These factors have been extensively used in previous literature with similar objectives (Alarifi et al., 2022; Almodayan, 2018; Ogato et al., 2020; Radwan et al., 2019). A detailed description of the factors used in our study is given in Table 1, while the complete methodological flowchart is shown in Figure 3.
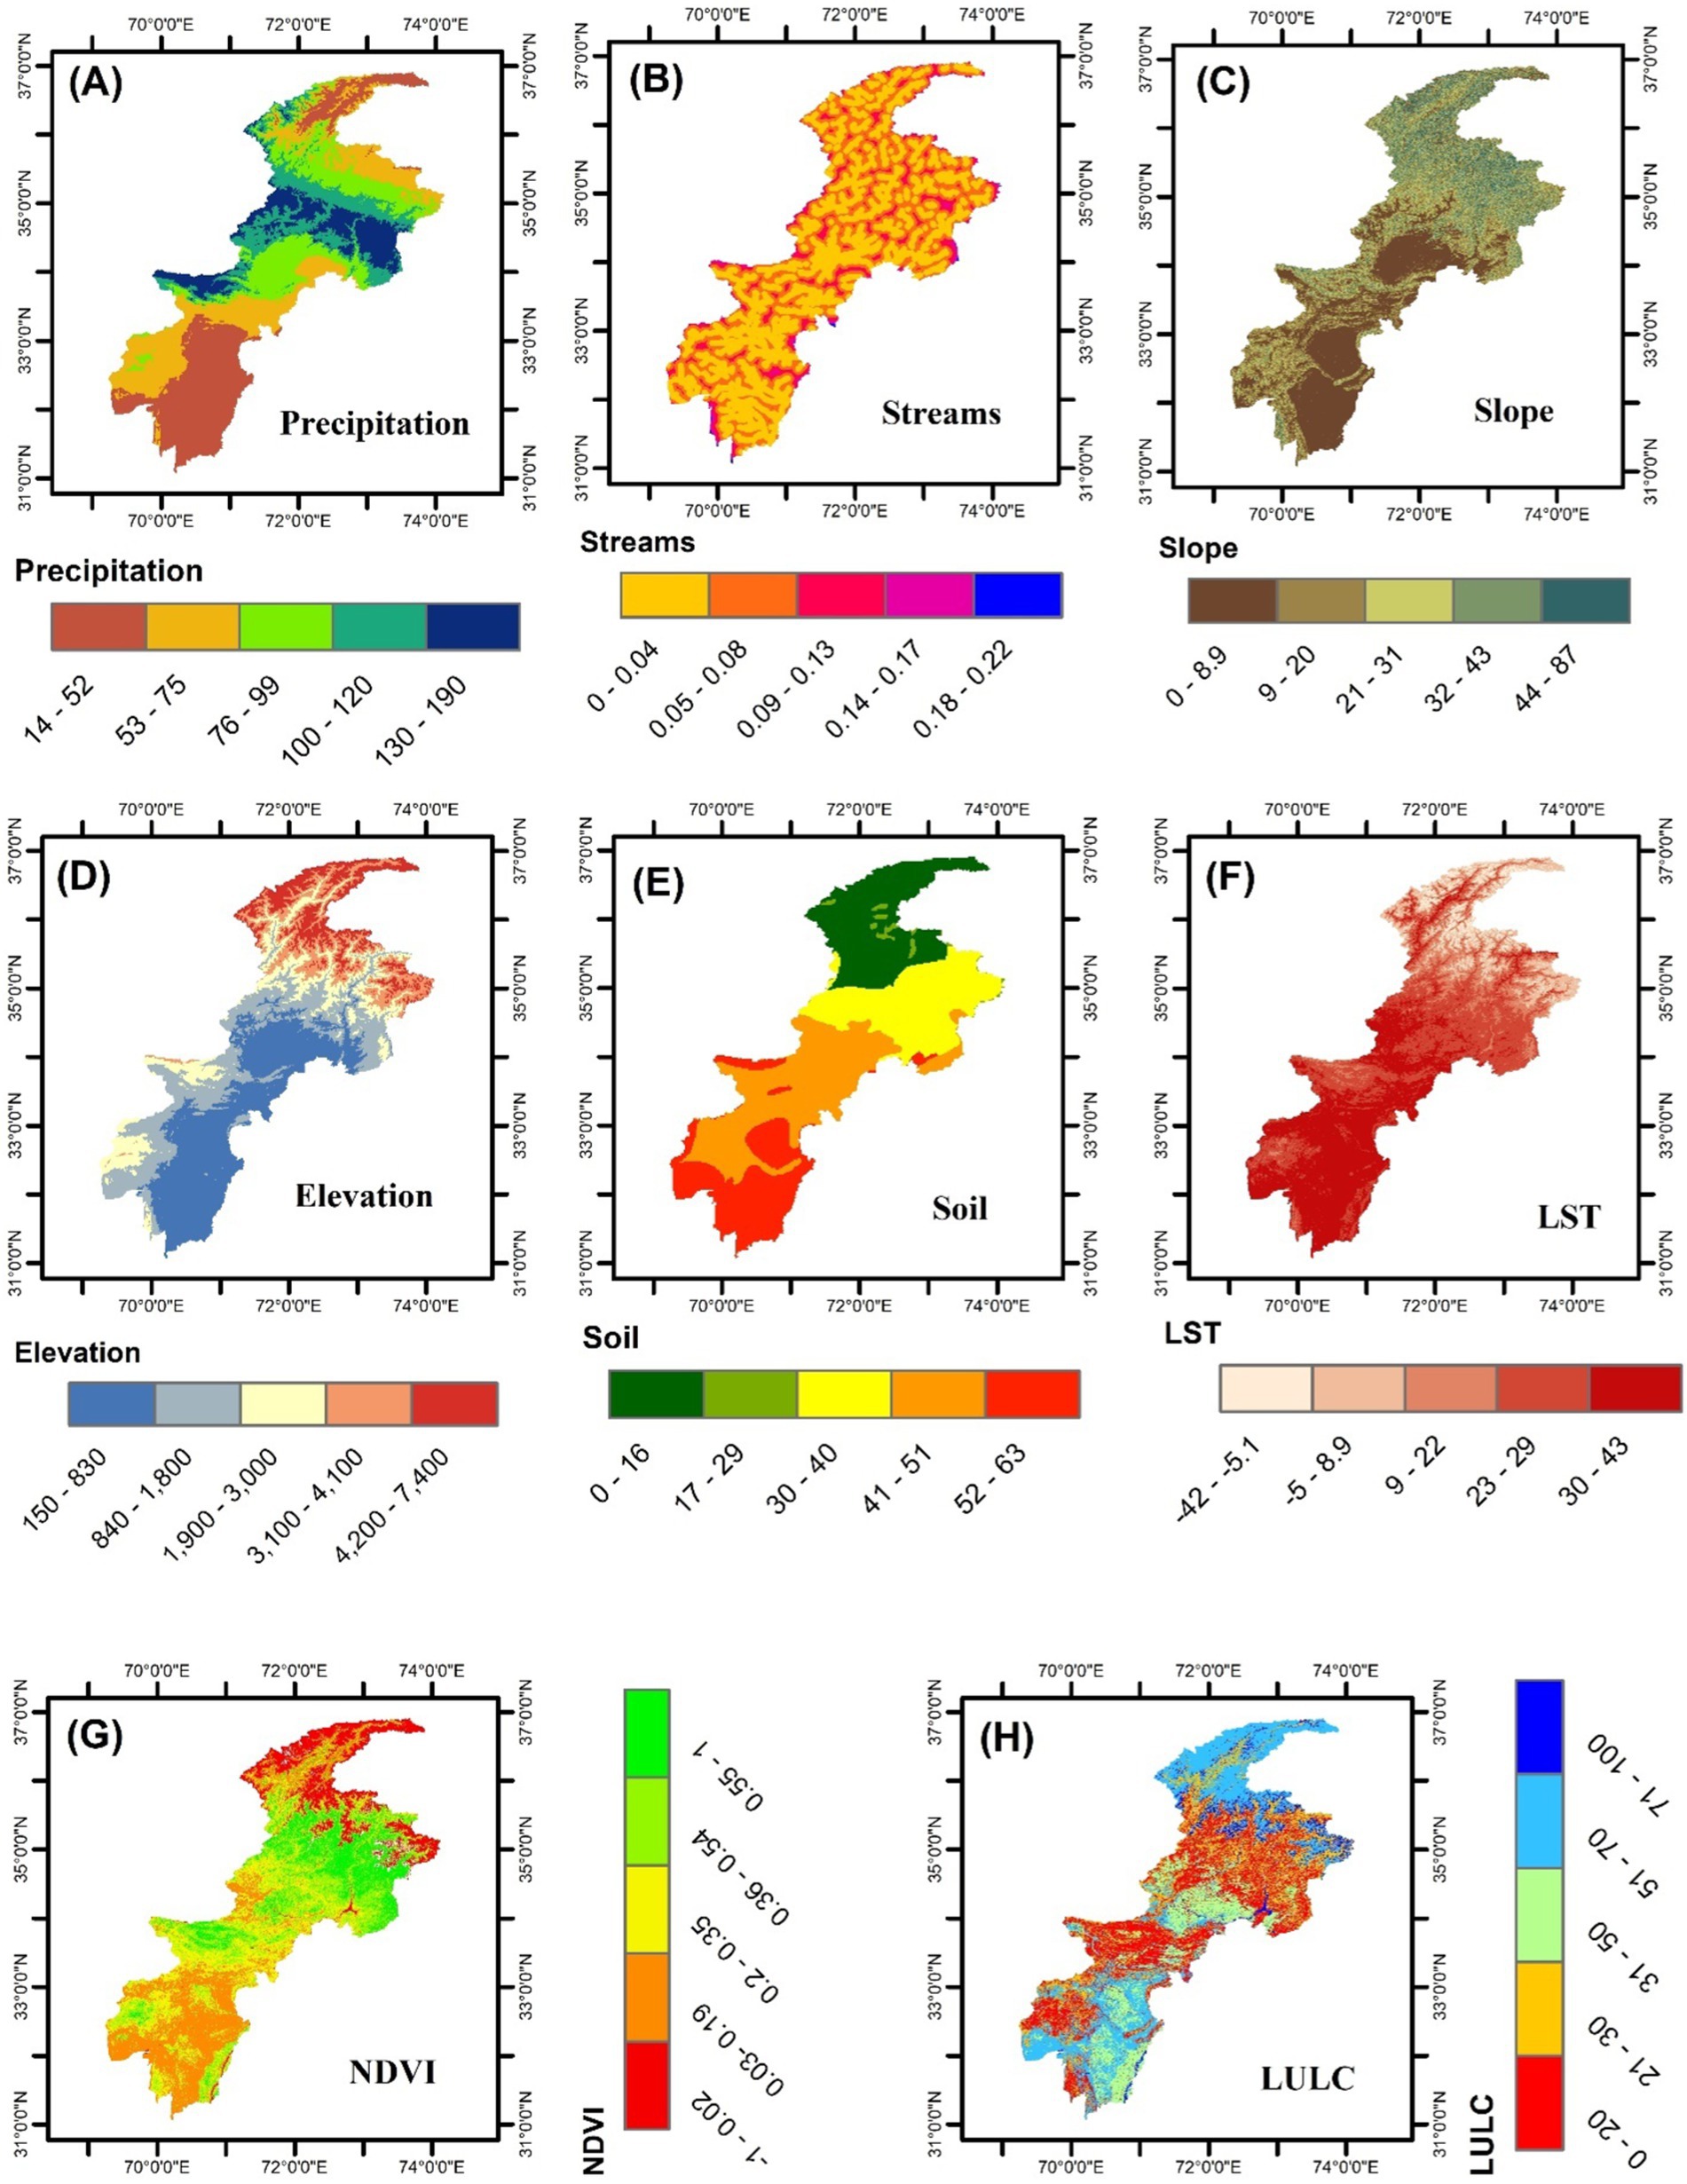
Figure 2. Presentation and range of the variables used for flood hazard assessment. The figure includes different environmental and topographic factors: (A) Precipitation, (B) Streams, (C) Slope, (D) Elevation, (E) Soil, (F) Land surface temperature (LST), (G) Normalized difference vegetation index (NDVI), and (H) Land use land cover (LULC).
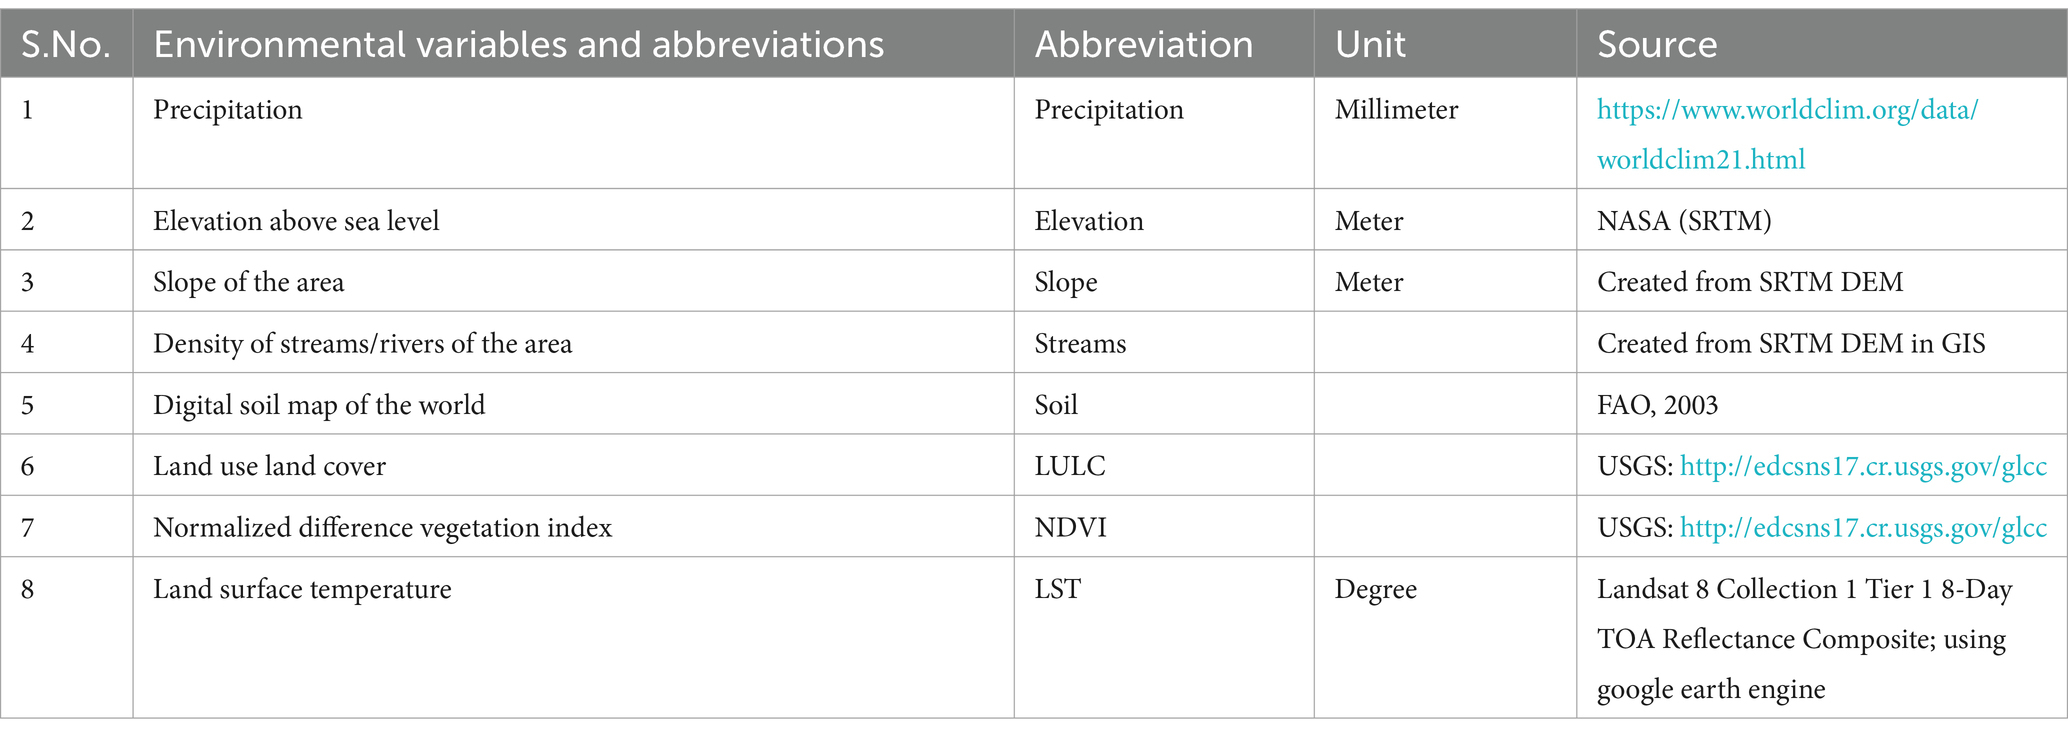
Table 1. Details of the factors used for flood susceptibility modeling.
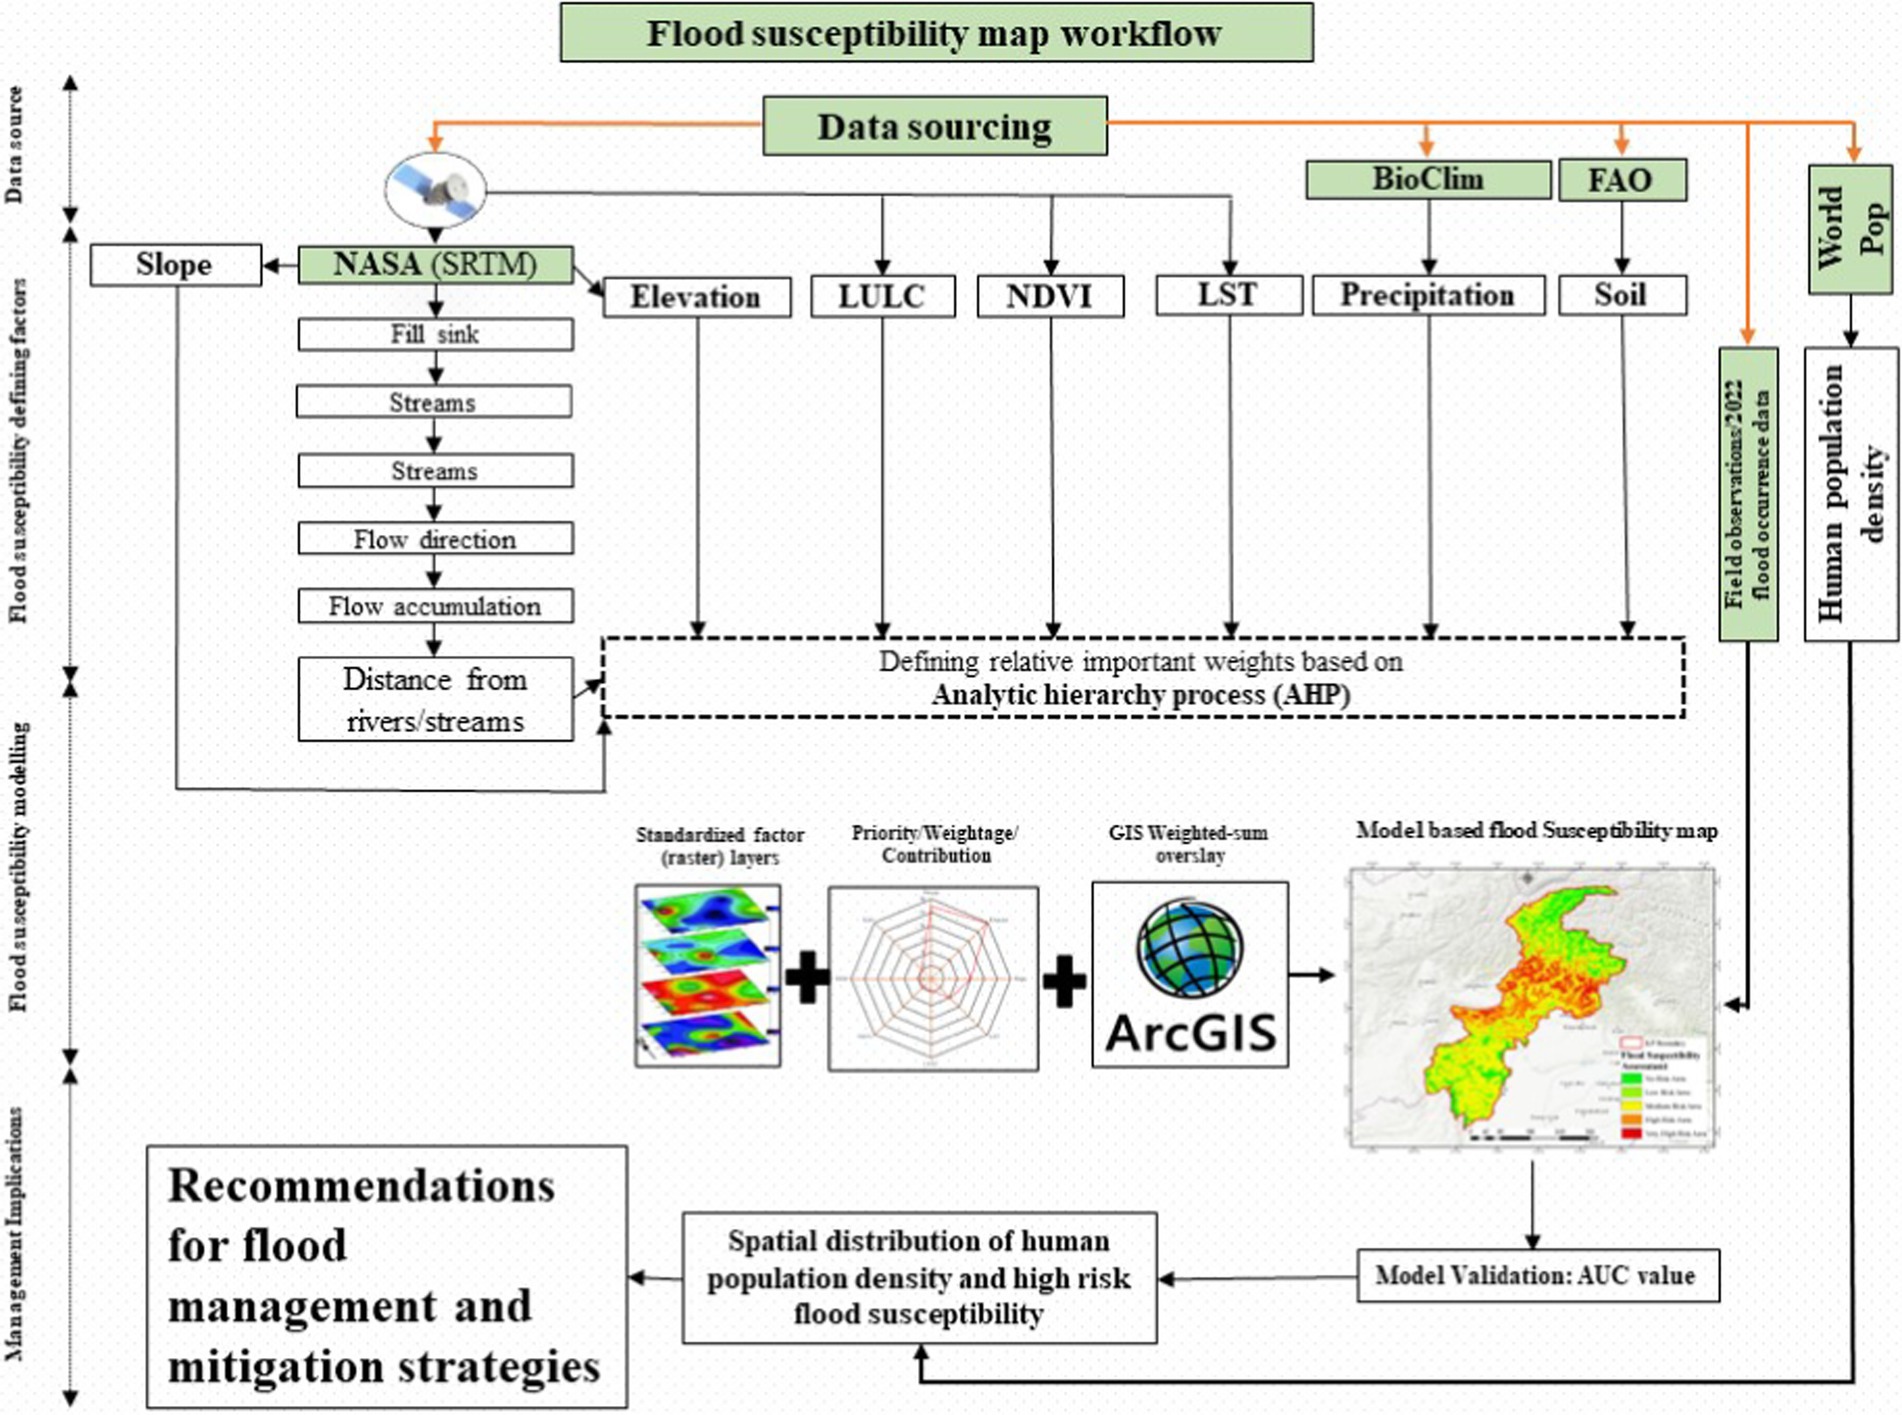
Figure 3. Stepwise methodological flowchart.
The distance from the river/streams network is a key indicator of flood hazards and flood risk (Fernández and Lutz, 2010). Areas in close proximity to rivers and streams, or those having higher density of rivers and streams, are more vulnerable to flooding compared to areas located farther from riverbeds, or with a lower density of waterbodies. From the elevation range of the region, the river/streams density map was made using GIS (Table 1; Figure 2A). The rivers/streams were reclassified into 5 different categories (Supplementary Figure S1A; Supplementary Table S2), with the index range from 2 to 10.
The study area receives heaviest rains in the month of July (usually called monsoon rains). We downloaded precipitation data for the said month from WorldClim (Table 1; Figure 2B). The precipitation map was generated with GIS. The precipitation of the area was reclassified into 5 classes considering the areas experiencing the heaviest rains have the highest flood susceptibility (Supplementary Figure S1B; Supplementary Table S2).
The slope raster layer was derived from the elevation layer (with a 10 meters resolution) using the surface tool in GIS (Table 1; Figure 2C). The slope was reclassified into five classes (ranging from 2 to 10) using the reclassify tool in GIS. Regions with the highest slope and the lowest flood susceptibility were assigned value of 2, while areas with the lowest slope and highest flood susceptibility were represented by 10 (Supplementary Figure S1C; Supplementary Table S2).
For this study, we downloaded NASA SRTM raster layer with a 10-meter resolution to acquire elevation (Table 1; Figure 2D). Since the lower elevation areas are more prone to flood hazards, the elevation of the area was reclassified (Supplementary Figure S1A; Supplementary Table S2) into five classes, where areas with the lowest risk of flooding (the highest elevation) are represented by 2 and areas with the highest flood risk (the lowest elevation) are represented by 10. GIS was used to prepare, present, and reclassify the elevation layer of the area (Supplementary Figure S1D; Supplementary Table S2).
The rainfall-runoff process is directly influence by the soil properties of the area, like the thickness, infiltration rate, permeability, and wetness before the rainfall (Ouma and Tateishi, 2014; Zhiyu et al., 2013). Different types of soil have varying resistance and absorption capacities of water (Ouma and Tateishi, 2014; Zhiyu et al., 2013). This water holding capacities and infiltration properties of different soil types effect the flood susceptibility of a region (Sugianto et al., 2022). Generally, as compared to sand, the runoff is greater and faster in loam and clay soils (Hill et al., 2010). The soil data (in raster format) was obtained from FAO, 2003 (Table 1; Figure 2E). The reclassification of soil is given in Supplementary Figure S1E; Supplementary Table S2.
Land surface temperature (LST) is a fundamental component of climate and biology, influencing organisms and ecosystems both locally and globally. LST is the measure and a good indicator of the thermal radiation emission from the land surface. Alternatively, LST describes how hot the land is to the touch. LST (Table 1; Figure 2F) and air temperature (the temperature given in weather reports) are two different parameters because, as compared to air, land heats and cools faster. Varied environmental irregularities can be caused by land surface temperature, flooding being one of them (Xue et al., 2018). Built-up areas typically have higher LST compared to forests and vegetation-covered regions (Supplementary Figure S1F; Supplementary Table S2).
NDVI is one of the crucial variables for flood susceptibility of an area (Ali et al., 2020). Densely vegetated areas are less likely to be impacted by flooding as compared to regions where there is less or no vegetation (Ali et al., 2020). On map, the higher NDVI (Table 1; Figure 2G) values indicate a lower risk of flooding, while lower values are an indicator of high flood susceptibility (Rehman et al., 2022; Ullah and Zhang, 2020). Additionally, the elevated, snow-capped northern regions are covered with sparse or unhealthy vegetation and thus have the lowest NDVI values (Shrestha et al., 2020; Ziwei et al., 2023). In short, flood susceptibility decreases with an increase in vegetation (Supplementary Figure S1G; Supplementary Table S2).
Many flood hazard experts highlighted the role of land use-land cover (LULC) in determining the rainfall-runoff process and flood vulnerability (Fernández and Lutz, 2010). In our study, the LULC (Table 1; Figure 2H) in raster format was obtained from USGS. The LULC of the area was reclassified (Supplementary Figure S1H; Supplementary Table S2) on the basis that the forest areas are less likely to be affected by floods as compared to the buildup areas and water bodies.
The flood susceptibility model integrated each factor based on its contribution to flood risk in Khyber Pakhtunkhwa (KP). We used the Analytical Hierarchy Process (AHP) to assign weights through expert judgment and empirical relevance. The AHP analysis ranked streams/rivers density and precipitation as the most influential, followed by slope and NDVI, validating the relevance and significance of all factors in the modeling process. After reclassification, relative weights for each factor were assigned using the Analytical Hierarchy Process (AHP) model, a method also used in similar studies across different countries (Ali et al., 2020; Allafta and Opp, 2021; Aydin and Sevgi Birincioğlu, 2022; Das and Gupta, 2021; Dash and Sar, 2020; Hadipour et al., 2020). The integration of GIS-based MCDM and AHP outputs was employed to assess, categorize, quantify, and map areas susceptible to flood hazards across the study region. To develop the final flood susceptibility map, the weighted sum overly tool in GIS was used to give weight to each raster based on the AHP confusion matrix (Supplementary Tables S3, S4; Supplementary Figure S5). The flood susceptibility output map was then reclassified into five distinct classes including very high-risk area, high-risk area, medium-risk area, low-risk area, and no-risk area using GIS. To ensure the robustness of the AHP weight assignment, we performed a consistency check on pairwise comparisons, yielding a CR value of 0.05, well within the acceptable threshold of 0.10 (Khosravi et al., 2016a; Ali et al., 2020). This confirms that the pairwise comparisons were consistent and logically aligned. Additionally, expert validation was crucial in confirming the relevance and accuracy of the factor weightings, with local experts providing insights based on their knowledge of regional flood dynamics, further supporting the model’s reliability.
Model accuracy and validation are crucial for ensuring the model reflects real flood occurrences (Hagos et al., 2022; Mahmoud and Gan, 2018; Ogato et al., 2020; Tadesse et al., 2022). This study used the ROC technique to validate the model, a widely recognized method for assessing flood susceptibility maps (Chung and Fabbri, 2003; Liuzzo et al., 2019; Tehrany et al., 2013). The model validation was based on flood occurrence points from the 2022 flood, collected during field surveys in affected areas. While historical data was also compiled, most points overlapped with the 2022 flood zones. Given this, we focused the validation on the 2022 data, ensuring its relevance and accuracy by cross-checking with government records and satellite imagery. These validated points were used to assess the model’s performance and validate the flood susceptibility map. The flood occurrence data was converted into a point shapefile using ArcCatalog 10.5, with training points used for the success rate and testing points for the prediction rate (Tayyab et al., 2021; Zhao et al., 2019). The ROC curve was generated using ArcSDM in GIS, and cross-validation was employed to fine-tune parameters and improve model accuracy. This iterative process achieved the highest AUC value, verifying model performance. The AUC (ranging from 0 to 1) indicated model accuracy, with values closer to 1 representing better fit (Li et al., 2020; Swets, 1988; Walden-Schreiner et al., 2017; Wang et al., 2020). Model classification and performance details are provided in Supplementary Table S4.
The AHP analysis was conducted to assign relative weights to each of the eight flood-influencing parameters. The pairwise confusion matrix allowed for a systematic comparison, ranking the parameters based on their contribution to flood susceptibility. The ranking and weightage of the factors was determined by the pairwise confusion matrix (Table 2). The ranking of factors ranged from 1 (least influential) to 8 (most influential). According to the AHP results the final criteria weight of factor is as follow: streams (0.29%), the precipitation (0.23%), slope of the area (14%), LST (10%), soil (0.047%), LULC (0.044%), DEM (0.044%), and NDVI (0.042%) (Figure 4; Table 2). A total of 28 comparisons were made, with a consistency ratio (CR) of 0.05 and a principal eigenvalue of 8.493. The principal eigenvector and eigen value provide a way to summarize the importance of each factor in the decision matrix. The iterative solution with a small delta indicates that after six iterations, the method used to find these values reached a stable solution.

Table 2. Weights for the factors/parameters based on pairwise comparisons in AHP analysis (comparative importance of the factors with respect to one another).
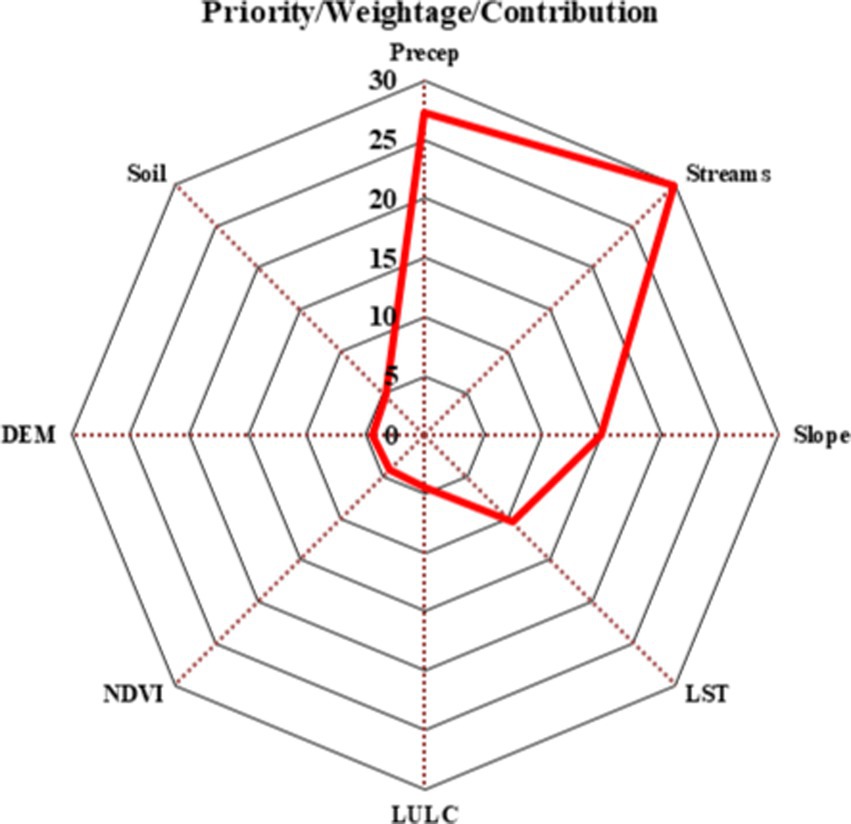
Figure 4. Parameters/factors weightage based on the APH analysis.
The study shows that the very high-risk area is spread across approximately 923,257 hectares which makes up 9% of the total area (Figure 5; Table 3). This zone primarily includes the lower northern and central districts, including Swat, Lower and Upper Dir, Swabi, Noshehra, Abbottabad, Manshera, Shangla, Buner, Orakzai, Kurram, Mohmand, and Khyber. A small patch in the very high-risk area category was identified in the DIK district too (Figure 6). The high-risk area, on the other hand, covers nearly 1,419,480 hectares (14% of the total area) (Supplementary Table S5) and is spanning in the central region of the study area.
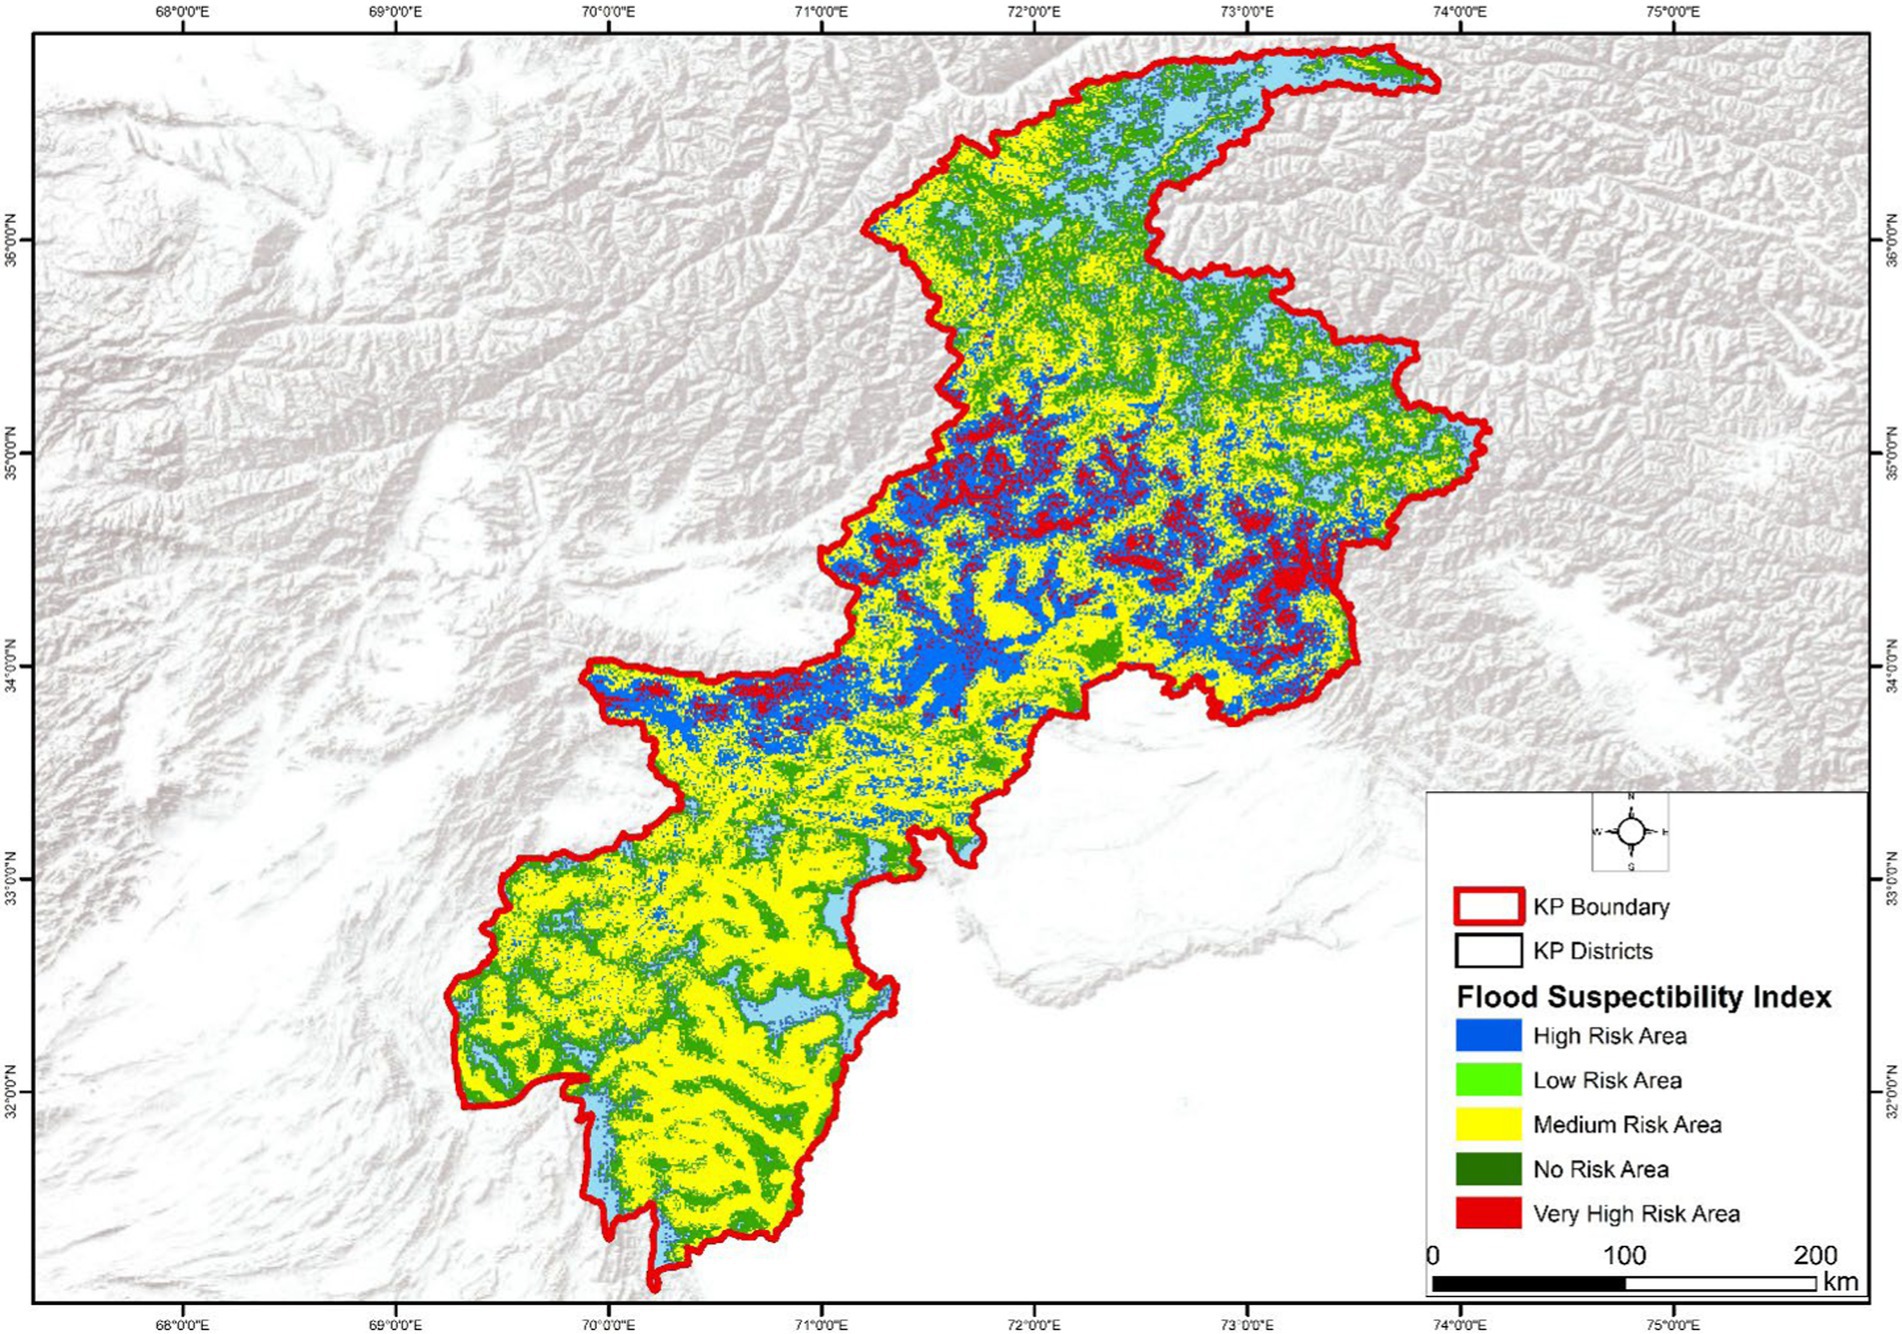
Figure 5. Model based flood susceptibility map of KP.
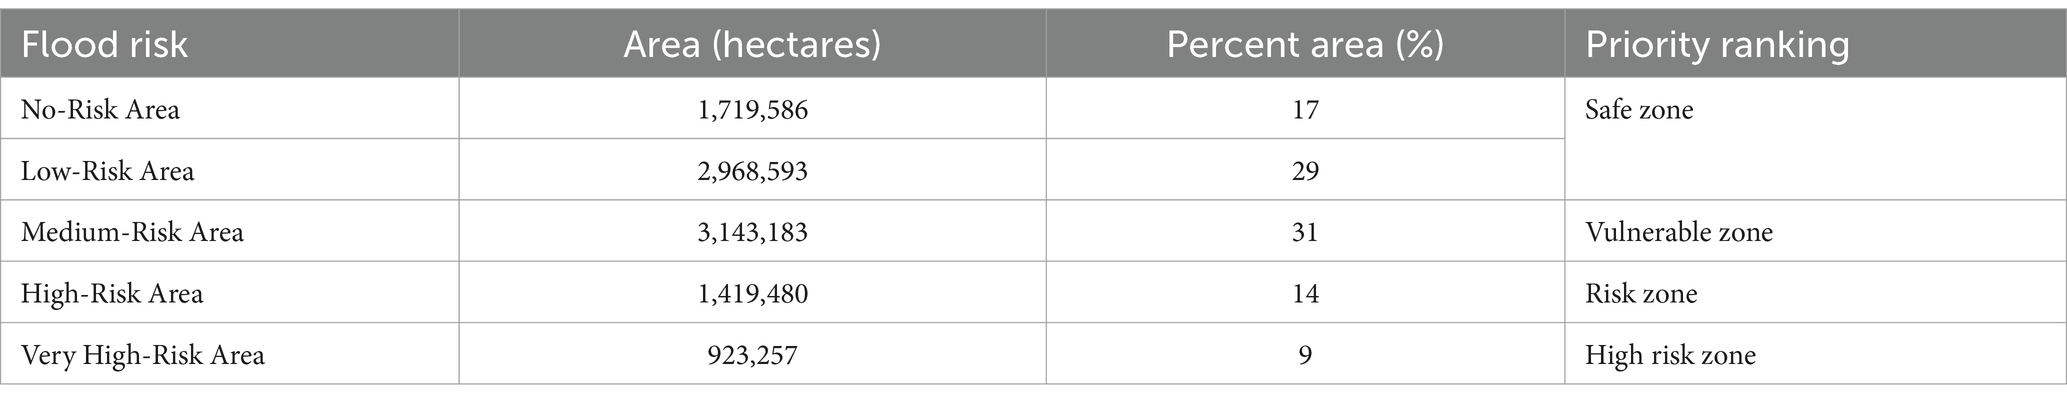
Table 3. Flood susceptibility categorization, quantification and risk priority ranking.
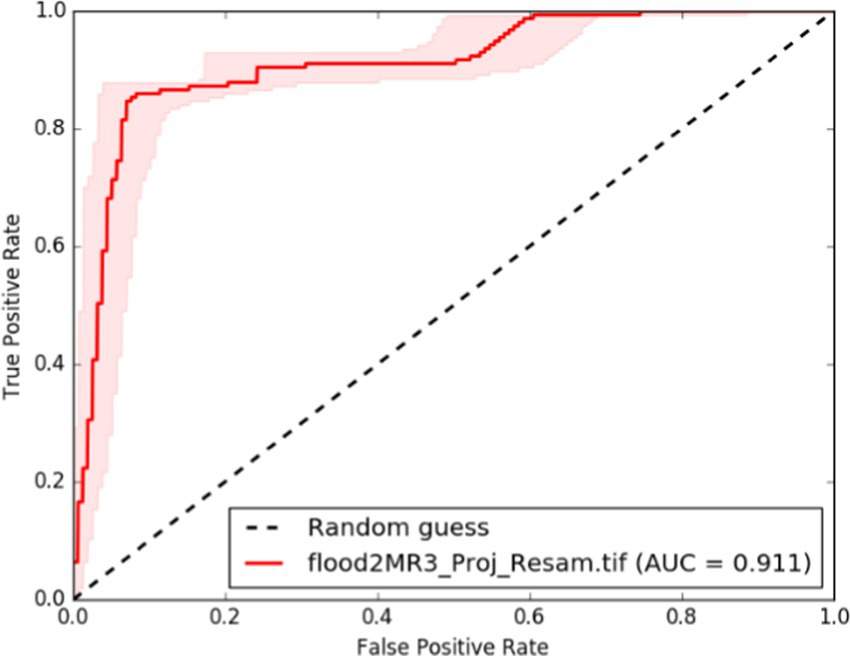
Figure 6. ROC curves and corresponding AUC values of the machine learning model.
Covering a wide area of approximately 3,143,183 hectares, the medium-risk areas account for 31% of the total area. These areas are distributed across the entire study zone, with a higher concentration observed in the southern parts.
The low-risk areas span an area of 2,968,593 hectares (29%), primarily covering the extreme northern and southern parts of the study region. The no-risk areas cover 1,719,586 hectares, which account for 17% of the total area and are also predominantly located in the extreme northern and southern sectors. According to our flood model outputs, these areas are considered safe zones. Complete detail and breakdown of flood categorization for all districts of KP is given in Supplementary Table S6.
A valid robust model was produced by the flood hazard analysis that combined GIS-based MCDM and the AHP analysis. To assess the accuracy of the flood susceptibility map, we used the Receiver Operating Characteristic (ROC) curve and Area Under the Curve (AUC) metrics. The AUC value of 0.911, as calculated from the 131 flood observation points, demonstrated the model’s excellent predictive performance (Figure 6).
In this study, we used GIS-based MCDM and AHP analysis to map flood-prone areas across Khyber Pakhtunkhwa, the country’s first impact zone for floods. This method has been widely employed in previous studies to identify and map flood-susceptible regions (Ali et al., 2020; Hagos et al., 2022). Due to its efficacy and precision, this technique, along with other contributing factors, has been widely used in various studies to assess and map flood-vulnerable areas (Abdelkarim et al., 2020; Ali et al., 2020; Allafta and Opp, 2021; Aydin and Sevgi Birincioğlu, 2022; Das and Gupta, 2021; Karymbalis et al., 2021).
In our case this method proved its efficiency, reliability and accuracy, as the AUC value was 0.911, indicating that the model performance was excellent (Sharif et al., 2016; Wang et al., 2023). To assess our model’s performance, we compared its AUC value (0.911) with other commonly applied models, such as those by Hagos et al. (2022) and Mahmoud and Gan (2018), which reported AUC values of 0.85 and 0.88, respectively. The higher AUC value indicates that our model, incorporating AHP and expert validation, more accurately captures the complex flood dynamics of Khyber Pakhtunkhwa. Additionally, the model’s integration of local knowledge and adaptability to dynamic environmental factors further enhances its reliability in predicting flood susceptibility in this rapidly changing region. A complete understanding of the flood hazards susceptibility for the area is provided by the flood susceptibility model categorization that are derived from the AHP analysis. The resulting map and classifications would be helpful for timely decision-making and efficient flood risk management. Understanding the probability and extent of flood occurrences provides the basis for effective management of flood hazards (Binns, 2022). Flood-prone area maps are vital for managing and mitigating flood hazards, providing key information to residents and stakeholders (Abdelkarim et al., 2020; Rahmati et al., 2016). Recently, sensitivity analysis and natural resource monitoring have gained importance in flood risk mitigation, particularly for ecohydrological systems and vegetated waterways (Lama and Crimaldi, 2021). Remote sensing techniques like NDVI and dNBR are effective for monitoring environmental changes that influence flood susceptibility (Mohammad et al., 2023). Additionally, flood-mitigation reservoir designs, with varied configurations, can significantly reduce peak discharge during floods (Pirone et al., 2024). These advanced methods enhance flood hazard understanding and improve mitigation strategies.
According to AHP analysis, four factors—rivers/streams, precipitation, slope, and LST—contribute 82% to the flood susceptibility map. Precipitation is particularly critical as heavy rainfall causes river overflow, leading to floods. Similar results were registered by Shahabi et al. (2021). Precipitation is a key factor that triggers flood occurrences, as heavy or prolonged rainfalls leads to large volumes of runoff water entering streams and rivers, causing flood inundation (Allafta and Opp, 2021; Feng et al., 2023; Xu et al., 2023).
Like the volume of water, its velocity, which is greatly influenced by slope, also determines the flood susceptibility of an area. Generally, water flows more slowly in areas with lower slope, causing water accumulation in lowlands or flatlands, thereby increasing the risk of flooding. In contrast, steeper slopes mountainous regions prevent water from accumulating (Das and Gupta, 2021; Mujib et al., 2021; Wang et al., 2015; Zzaman et al., 2021). Our findings showed a clear pattern: the extreme northern edges of the area, which are characterized by steep mountain ranges, correspond with the safe zone identified in our flood susceptibility results. The results have clearly shown that plain areas with a minimum slope are more vulnerable to floods compared to areas with steeper slope (Shahabi et al., 2021). The findings of this criterion are consistent with the findings of Khosravi et al. (2016b).
In addition to rainfall and slope, the occurrence, density, length, and proximity of streams and rivers also play an important role in influencing flooding. The flood vulnerability is higher in the areas that are near the streams or with a higher density of the streams than the areas situated away from the rivers and streams since heavy rainfall results in overbank flows, which cause flooding of adjoining lowland areas (Mahmoud and Gan, 2018; Termeh et al., 2018). Moreover, usually areas away from the rivers are at the higher elevation, which also adds to low flood risks (Kia et al., 2012; Lee and Rezaie, 2022; Zzaman et al., 2021). Our study’s results align with these findings, showing that areas nearer to rivers and streams indicate a greater susceptibility to flood hazards (Abdelkarim et al., 2020; Das and Gupta, 2021; Lee and Rezaie, 2022; Mahmoud and Gan, 2018; Zzaman et al., 2021).
Studies have also revealed an association between LST and flooding. The global warming and climate change are the reasons for an increase in the LST, causing ice caps in the Himalayan region to melt rapidly, leading rivers to flood (Jain et al., 2023). The relationship between rise in LST and flooding is indirect, as many studies have shown that LST varies considerably with the LULC and vegetation cover. With an increase in urban cover and barren land the LST values also increases while it decreases in areas with higher vegetation (Achmad and Muftiadi, 2019; Jamali et al., 2022; Rahaman and Shermin, 2022). Many studies have established a correlation between higher NDVI and lower flood vulnerability (Das, 2018; Tehrany et al., 2013). Vegetation cover affects climate and land surface fluxes both regionally and globally, while climate also plays a significant role in determining vegetation cover (Hussain et al., 2023). A positive relationship between the La Niña events and temperature has been established by depicting higher land surface temperatures with an increase in La Niña events (Eboy and Kemarau, 2023; Yan et al., 2020).
The intense monsoon rains in Pakistan were linked to strong La Niña events (Ju and Slingo, 1995; Safdar et al., 2019). Abnormally high temperatures during the spring and summer of 2022 enhanced a deep depression from the Arabian Sea, resulting in heavy rainfall across the country (Mallapaty, 2022; Otto et al., 2023). Temperatures rose to more than 50°C in few parts of the country in the months of March and April 2022, which is an atypical time of year to witness severe heat. The rise in temperature speeds up the melting of Pakistan’s around 7,000 glaciers in the northern parts, that feed the country’s rivers. Recent studies have highlighted that climate induced fluctuations in temperature and rainfall are the driving forces of repeated floods (Mahmood and Ullah, 2016; Qi et al., 2024; Ullah et al., 2018). Simultaneously, changes in land use pattern and excessive urbanization leads to an increase in impervious surfaces and a consequent increase in flow velocity (Sugianto et al., 2022) triggers flood disasters within a specific locale (Charlton et al., 2006). Pakistan is located in the south Asian monsoon region (Ahmed et al., 2019). Northern parts of Pakistan often receive heavy rainfall from June to September and approximately, about half a million people are affected by flooding every year (Baqir et al., 2012).
This study used raster layers with consistent spatial resolution and projection, a best practice for geospatial modeling (Hong et al., 2018; Khosravi et al., 2016a), ensuring spatial consistency and minimizing errors in flood susceptibility modeling (Zhao et al., 2022). The integration of GIS-based MCDM and AHP provides a robust framework for assigning weights to variables, which is widely recognized as reliable for flood assessments (Aydin and Sevgi Birincioğlu, 2022; Hagos et al., 2022). If these considerations—consistent data resolution, appropriate projection, and the use of MCDM with AHP—had not been addressed, model accuracy would have been compromised, undermining the results’ reliability in capturing flood risk dynamics in Khyber Pakhtunkhwa (Ali et al., 2020; Aydin and Sevgi Birincioğlu, 2022).
Pakistan is experiencing climate disasters, despite contributing less than 1% to the f global carbon emissions. In the recent past, rapid and heavy rains in Pakistan have triggered severe flooding, submerging one-third of Pakistan. In August 2022, Pakistan received 192.7 mm heavy rains against its normal of 56.2 mm causing the most devastation flood in the country’s history. The overall estimated damage due to the floods amounts to 14.9 billion US dollars. The housing sector incurred a substantial damage of 5.6 billion US dollars, while the agriculture and livestock were also adversely affected, resulting in a combine damage of 3.7 billion US dollars. The transportation and communications sectors also faced a damage of 3.3 billion US dollars. One of the major contributors to Pakistan’s flood susceptibility is the inadequate capacity of locals to respond effectively to disaster risks (Shah et al., 2022a). Poor socioeconomic conditions, absence of flood warning system, and low confidence in the local government institutions present significant challenges to effective flood warning and mitigation strategies (Rana et al., 2021). Climate change and increasing temperature would increase and occurrence and intensity of floods (Hall et al., 2014; Qi et al., 2024; Santato et al., 2013).
Based on our findings and the highly flood-prone nature of the study area, we recommend initiating an Early warning system (EWS), particularly in rural areas. As shown in our study area, northern rural areas are first to be hit by floods. In rural areas, people are usually not familiar with the early warning system, which makes it more difficult for them to deal with flood hazards (Mustafa et al., 2015; Shah et al., 2022b). EWS is helpful in providing substantial information for effective disaster management that enables people to protect their lives and property (Sufri et al., 2020). Social media is also a very valuable medium to disseminate flood related updates and information with the people (Jamali et al., 2022). We identified four hotspot areas that fall in the very high-risk category (Figure 7) by relating the spatial distribution of very high flood susceptibility areas and human population density across the study area. Two of those areas are vulnerable to urban flooding, including the districts of Abbottabad, Swabi, Nowshera, Peshawar (to some extent), Hazara, and Mansehra, while districts Swat, Lower and Upper Dir, Khyber, Buner, Mohmand, Shangla, and Orakzai are prone to rural flooding. Climate change and rapid urbanization would intensify the rate of urban flooding (Qi et al., 2024). Apart from this, the upper areas of Kohistan, Tank, and DIK are also susceptible to flooding. These districts were severely affected during the 2022 flood, and they have been consistently impacted during every minor and major flooding (Hamidi et al., 2022; Hussain et al., 2021; Khan et al., 2023; Nazeer and Bork, 2021; Qasim et al., 2017; Rana and Routray, 2018). Building upon the findings of this study and on ground experience, we have formulated few mitigation strategies aimed at reducing the flood hazards (Figure 8). This method has been successfully applied worldwide, with adjustments made for local topography, climate, and data availability (Ali et al., 2020; Hagos et al., 2022). Several studies in diverse regions further demonstrate the method’s versatility and replicability (Abdelkarim et al., 2020; Ali, 2013; Allafta and Opp, 2021; Aydin and Sevgi Birincioğlu, 2022; Das and Gupta, 2021; Karymbalis et al., 2021).
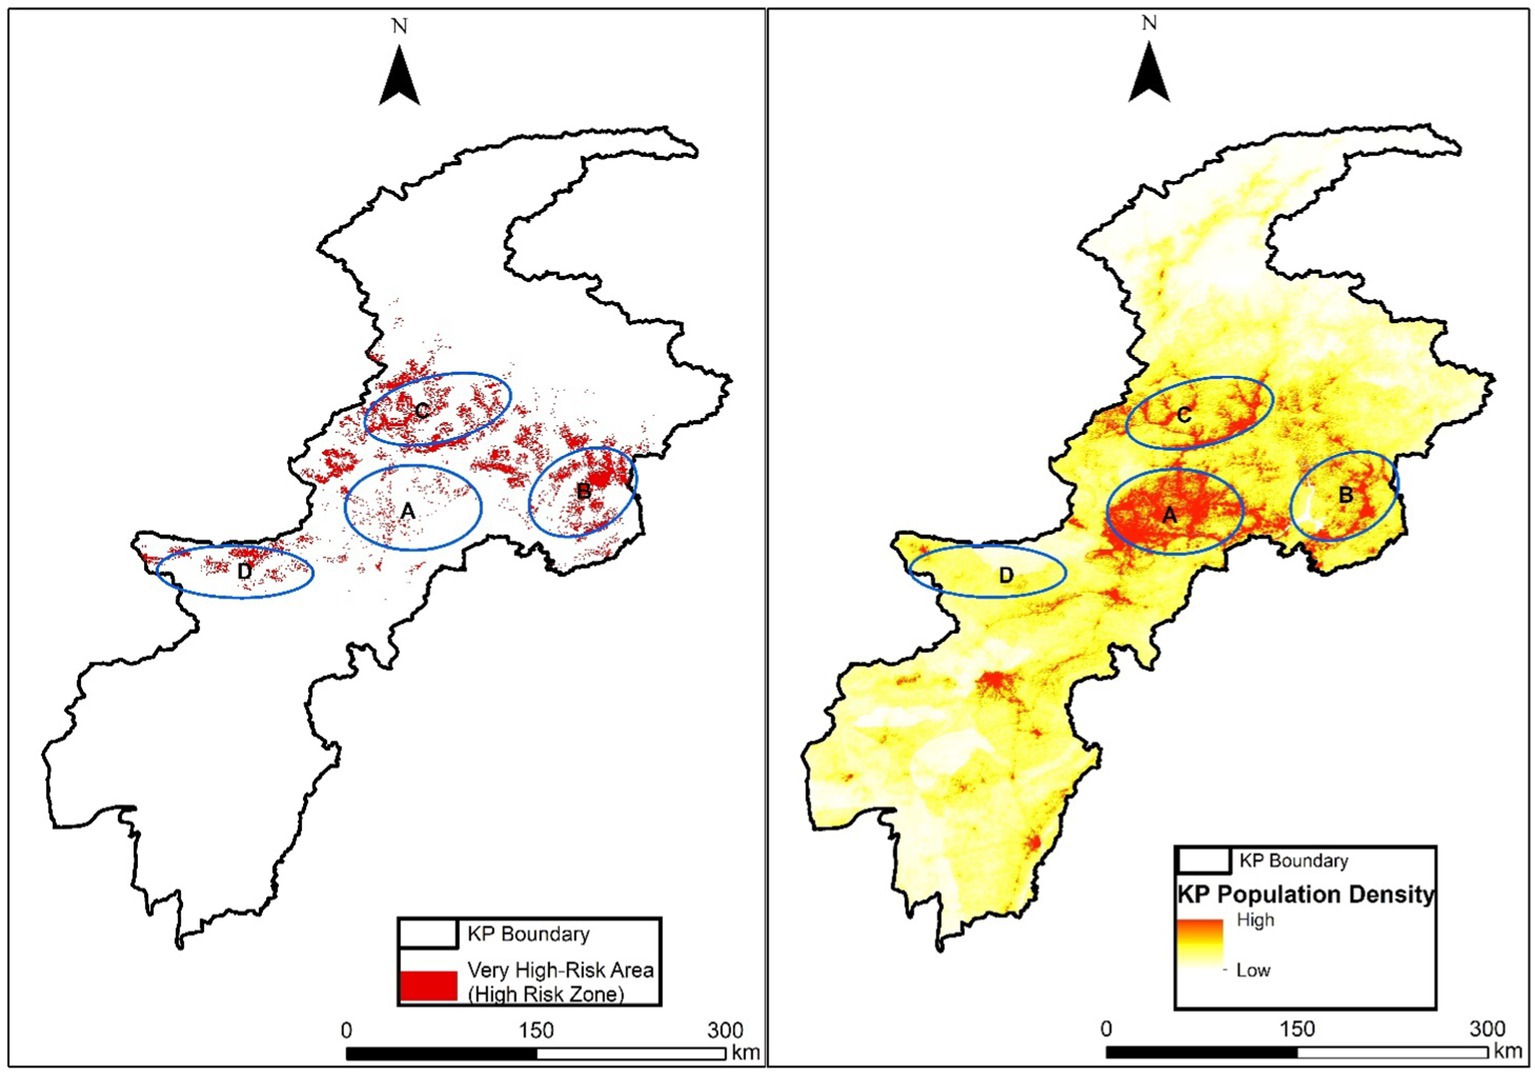
Figure 7. Spatial distribution of high-risk zone and human population density across KP.
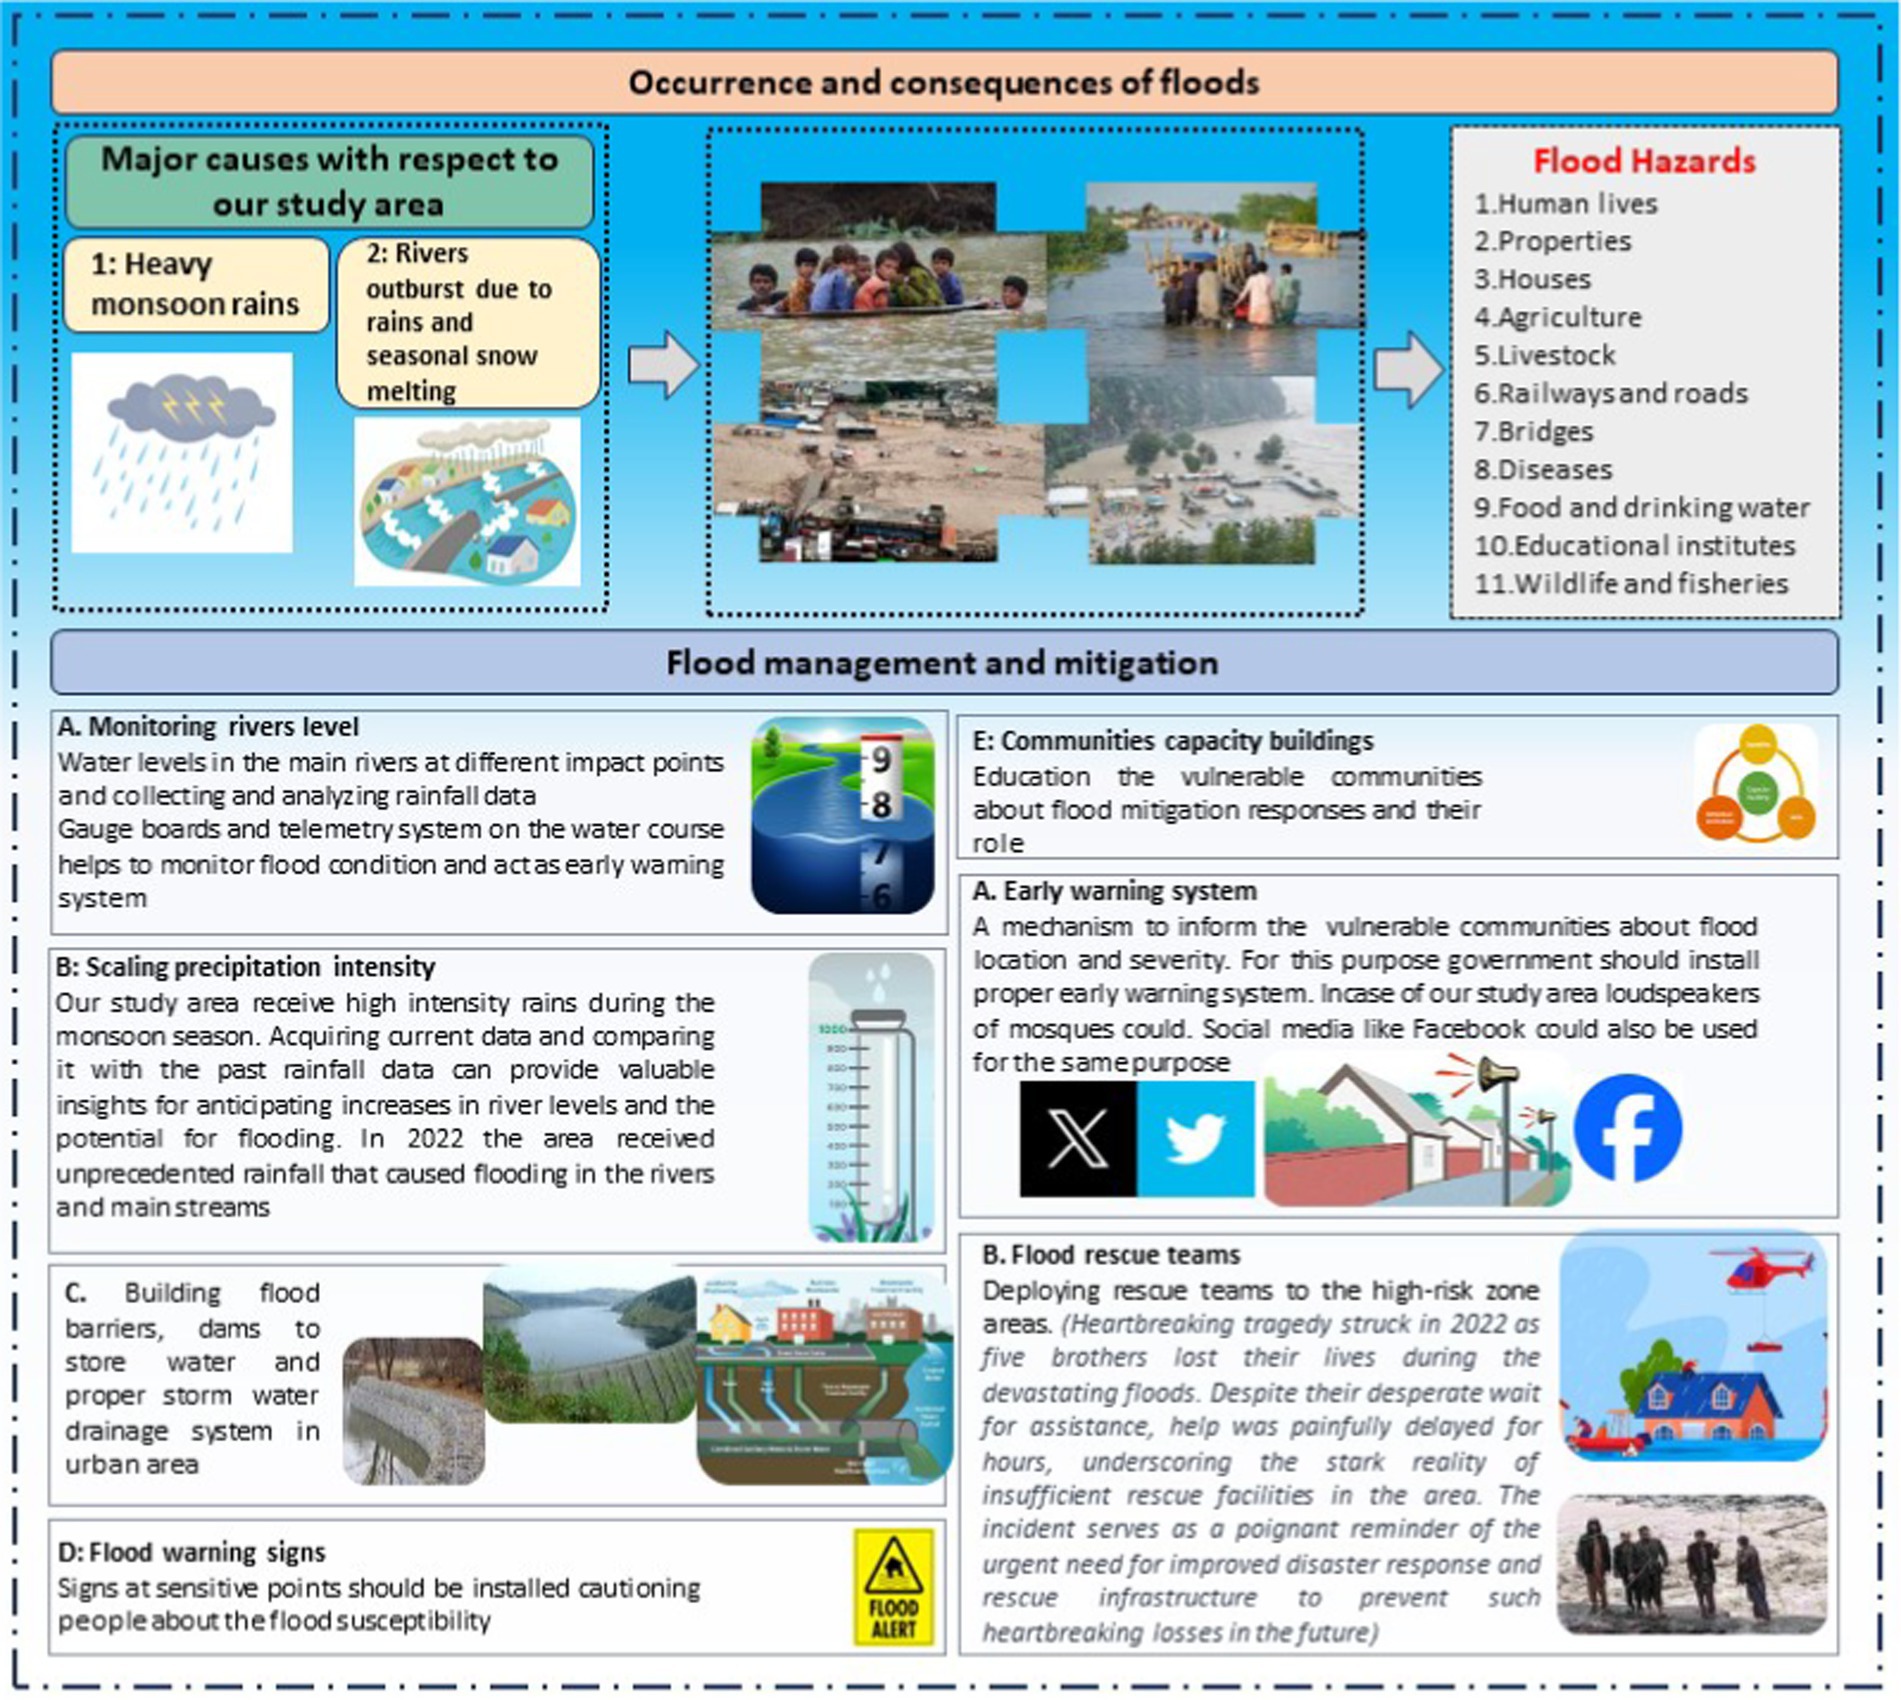
Figure 8. Proposed flood management strategies for the study area derived from the study results.
This study assessed, quantify, and map flood prone areas in the Khyber Pakhtunkhwa (KP), Pakistan, which is one of the most vulnerable and first impact points of floods in the country. The study concluded that 9% of the KP province fell into the very high-risk area, spanning over an area of 923,257 hectares while 14% (1,419,480 hectares) was categorized as high-risk area. These high-risk zones are predominantly concentrated in the lower northern, and central densely populated districts of the study area. Based on our results, we recommend strengthening the flood risk mitigation policies, focusing primarily on the high-risk zones. Additionally, an early warning system is needed to be established across the study area, which will help minimize economic loss, injuries, and deaths due to the floods. The findings of this study will be valuable to policymakers, concern departments, and local communities in implementing safety measures and developing effective flood risk mitigation strategies.
The original contributions presented in the study are included in the article/Supplementary material, further inquiries can be directed to the corresponding author/s.
TK: Conceptualization, Data curation, Formal analysis, Investigation, Methodology, Project administration, Software, Validation, Visualization, Writing – original draft, Writing – review & editing. GN: Methodology, Validation, Investigation, Writing – review & editing. SU: Methodology, Supervision, Validation, Writing – review & editing. AA: Validation, Investigation, Writing - review & editing. JO: Data curation, Investigation, Methodology, Project administration, Validation, Visualization, Writing – review & editing. JA: Validation, Investigation, Writing – review & editing. AI: Conceptualization, Funding acquisition, Investigation, Project administration, Resources, Supervision, Validation, Writing – review & editing.
The author(s) declare that no financial support was received for the research and/or publication of this article.
The authors are grateful to the relevant government departments for facilitating the field surveys. We are also thankful to the local communities for supporting our survey teams in collecting field data on flood occurrences.
The authors declare that the research was conducted in the absence of any commercial or financial relationships that could be construed as a potential conflict of interest.
All claims expressed in this article are solely those of the authors and do not necessarily represent those of their affiliated organizations, or those of the publisher, the editors and the reviewers. Any product that may be evaluated in this article, or claim that may be made by its manufacturer, is not guaranteed or endorsed by the publisher.
The Supplementary material for this article can be found online at: https://www.frontiersin.org/articles/10.3389/frwa.2025.1465505/full#supplementary-material
Abbaszadeh, P. (2016). Improving hydrological process modeling using optimized threshold-based wavelet de-noising technique. Water Resour. Manag. 30, 1701–1721. doi: 10.1007/s11269-016-1246-5
Abdelkarim, A., Al-Alola, S. S., Alogayell, H. M., Mohamed, S. A., Alkadi, I. I., and Ismail, I. Y. (2020). Integration of GIS-based multicriteria decision analysis and analytic hierarchy process to assess flood hazard on the Al-shamal train pathway in Al-Qurayyat Region, Kingdom of Saudi Arabia. Water 12:1702. doi: 10.3390/w12061702
Achmad, A., and Muftiadi, M. (2019). The relationship between land surface temperature and water index in the urban area of a tropical city. IOP Conference Series 365:012013. doi: 10.1088/1755-1315/365/1/012013
Ahmed, K., Shahid, S., Wang, X., Nawaz, N., and Khan, N. (2019). Spatiotemporal changes in aridity of Pakistan during 1901–2016. Hydrol. Earth Syst. Sci. 23, 3081–3096. doi: 10.5194/hess-23-3081-2019
Ajibade, F. O., Ajibade, T. F., Idowu, T. E., Nwogwu, N. A., Adelodun, B., Lasisi, K. H., et al. (2021). Flood-prone area mapping using GIS-based analytical hierarchy frameworks for Ibadan City, Nigeria. J. Multi-Criteria Decision Analysis 28, 283–295. doi: 10.1002/mcda.1759
Alarifi, S. S., Abdelkareem, M., Abdalla, F., and Alotaibi, M. (2022). Flash flood hazard mapping using remote sensing and GIS techniques in southwestern Saudi Arabia. Sustain. For. 14:14145. doi: 10.3390/su142114145
Alfieri, L., Burek, P., Feyen, L., and Forzieri, G. (2015). Global warming increases the frequency of river floods in Europe. Hydrol. Earth Syst. Sci. 19, 2247–2260. doi: 10.5194/hess-19-2247-2015
Ali, A. (2013). Indus basin floods: mechanisms, impacts, and management. Manila, Philippines: Asian Development Bank.
Ali, S., Khalid, B., Kiani, R. S., Babar, R., Nasir, S., Rehman, N., et al. (2020). Spatio-temporal variability of summer monsoon onset over Pakistan. Asia-Pac. J. Atmos. Sci. 56, 147–172. doi: 10.1007/s13143-019-00130-z
Ali, S. A., Parvin, F., Pham, Q. B., Vojtek, M., Vojteková, J., Costache, R., et al. (2020). GIS-based comparative assessment of flood susceptibility mapping using hybrid multi-criteria decision-making approach, naïve Bayes tree, bivariate statistics and logistic regression: a case of Topľa basin, Slovakia. Ecological Indicators 117:106620. doi: 10.1016/j.ecolind.2020.106620
Allafta, H., and Opp, C. (2021). GIS-based multi-criteria analysis for flood prone areas mapping in the trans-boundary Shatt Al-Arab basin, Iraq-Iran. Geomat. Nat. Haz. Risk 12, 2087–2116. doi: 10.1080/19475705.2021.1955755
Almodayan, A. (2018). Analytical hierarchy (AHP) process method for environmental hazard mapping for Jeddah City, Saudi Arabia. J. Geosci. Environ. Protection 6, 143–159. doi: 10.4236/gep.2018.66011
Arnell, N. W., and Gosling, S. N. (2016). The impacts of climate change on river flood risk at the global scale. Clim. Chang. 134, 387–401. doi: 10.1007/s10584-014-1084-5
Aydin, M. C., and Sevgi Birincioğlu, E. (2022). Flood risk analysis using gis-based analytical hierarchy process: a case study of Bitlis Province. Appl Water Sci 12:122. doi: 10.1007/s13201-022-01655-x
Baqir, M., Sobani, Z. A., Bhamani, A., Bham, N. S., Abid, S., Farook, J., et al. (2012). Infectious diseases in the aftermath of monsoon flooding in Pakistan. Asian Pac. J. Trop. Biomed. 2, 76–79. doi: 10.1016/S2221-1691(11)60194-9
Binns, A. D. (2022). “Sustainable development and flood risk management” in (New Jersey: Wiley Online Library), 15:e12807.
Box, W., Järvelä, J., and Västilä, K. (2021). Flow resistance of floodplain vegetation mixtures for modelling river flows. J. Hydrol. 601:126593. doi: 10.1016/j.jhydrol.2021.126593
Calil, J., Beck, M. W., Gleason, M., Merrifield, M., Klausmeyer, K., and Newkirk, S. (2015). Aligning natural resource conservation and flood hazard mitigation in California. PLoS One 10:e0132651. doi: 10.1371/journal.pone.0132651
Charlton, R., Fealy, R., Moore, S., Sweeney, J., and Murphy, C. (2006). Assessing the impact of climate change on water supply and flood hazard in Ireland using statistical downscaling and hydrological modelling techniques. Clim. Chang. 74, 475–491. doi: 10.1007/s10584-006-0472-x
Chung, C.-J. F., and Fabbri, A. G. (2003). Validation of spatial prediction models for landslide hazard mapping. Nat. Hazards 30, 451–472. doi: 10.1023/B:NHAZ.0000007172.62651.2b
Crimaldi, M., and Lama, G. (2021). Impacts of riparian plants biomass assessed by UAV-acquired multispectral images on the hydrodynamics of vegetated streams. Proceedings of the 29th European biomass conference and exhibition : ETA-Florence Renewable Energies.
Dandapat, K., and Panda, G. K. (2017). Flood vulnerability analysis and risk assessment using analytical hierarchy process. Model. Earth Syst. Environ. 3, 1627–1646. doi: 10.1007/s40808-017-0388-7
Dang, A. T. N., and Kumar, L. (2017). Application of remote sensing and GIS-based hydrological modelling for flood risk analysis: a case study of district 8, Ho Chi Minh City, Vietnam. Geomatics Natural Hazards Risk 8, 1792–1811. doi: 10.1080/19475705.2017.1388853
Das, S. (2018). Geographic information system and AHP-based flood hazard zonation of Vaitarna basin, Maharashtra, India. Arab. J. Geosci. 11:576. doi: 10.1007/s12517-018-3933-4
Das, S. (2019). Geospatial mapping of flood susceptibility and hydro-geomorphic response to the floods in Ulhas basin, India. Remote Sensing App. 14, 60–74. doi: 10.1016/j.rsase.2019.02.006
Das, S., and Gupta, A. (2021). Multi-criteria decision based geospatial mapping of flood susceptibility and temporal hydro-geomorphic changes in the Subarnarekha basin, India. Geosci. Front. 12:101206. doi: 10.1016/j.gsf.2021.101206
Dash, P., and Sar, J. (2020). Identification and validation of potential flood hazard area using GIS-based multi-criteria analysis and satellite data-derived water index. J. Flood Risk Manag. 13:e12620. doi: 10.1111/jfr3.12620
Dou, X., Song, J., Wang, L., Tang, B., Xu, S., Kong, F., et al. (2018). Flood risk assessment and mapping based on a modified multi-parameter flood hazard index model in the Guanzhong urban area, China. Stoch. Env. Res. Risk A. 32, 1131–1146. doi: 10.1007/s00477-017-1429-5
Eboy, O. V., and Kemarau, R. A. (2023). Study variability of the land surface temperature of land cover during El Niño southern oscillation (ENSO) in a Tropical City. Sustain. For. 15:8886. doi: 10.3390/su15118886
Errico, A., Lama, G. F. C., Francalanci, S., Chirico, G. B., Solari, L., and Preti, F. (2019). Validation of global flow resistance models in two experimental drainage channels covered by Phragmites australis (common reed). Proceedings of the 38th IAHR world congress-water connecting the world. The International Association for Hydro-Environment Engineering and Research (IAHR).
Feng, J., Li, D., Li, Y., and Zhao, L. (2023). Analysis of compound floods from storm surge and extreme precipitation in China. J. Hydrol. 627:130402. doi: 10.1016/j.jhydrol.2023.130402
Fernández, D., and Lutz, M. A. (2010). Urban flood hazard zoning in Tucumán Province, Argentina, using GIS and multicriteria decision analysis. Eng. Geol. 111, 90–98. doi: 10.1016/j.enggeo.2009.12.006
Floods, P. (2010). Preliminary damage and needs assessment. Asian Development Bank, government of Pakistan, World Bank Available at: http://reliefweb.int/sites/reliefweb.int/files/resources/64AE3DC5BEDA4E18492577DA001FBE55-Full_Report. pdf (Accessed December 24, 2011).
Gain, A. K., Mojtahed, V., Biscaro, C., Balbi, S., and Giupponi, C. (2015). An integrated approach of flood risk assessment in the eastern part of Dhaka City. Nat. Hazards 79, 1499–1530. doi: 10.1007/s11069-015-1911-7
Gao, L., Du, H., Huang, H., Zhang, L., and Zhang, P. (2023). Modelling the compound floods upon combined rainfall and storm surge events in a low-lying coastal city. J. Hydrol. 627:130476. doi: 10.1016/j.jhydrol.2023.130476
Gigović, L., Pamučar, D., Bajić, Z., and Drobnjak, S. (2017). Application of GIS-interval rough AHP methodology for flood hazard mapping in urban areas. Water 9:360. doi: 10.3390/w9060360
Guo, E., Zhang, J., Ren, X., Zhang, Q., and Sun, Z. (2014). Integrated risk assessment of flood disaster based on improved set pair analysis and the variable fuzzy set theory in Central Liaoning Province, China. Nat. Hazards 74, 947–965. doi: 10.1007/s11069-014-1238-9
Hadipour, V., Vafaie, F., and Deilami, K. (2020). Coastal flooding risk assessment using a GIS-based spatial multi-criteria decision analysis approach. Water 12:2379. doi: 10.3390/w12092379
Hagos, Y. G., Andualem, T. G., Yibeltal, M., and Mengie, M. A. (2022). Flood hazard assessment and mapping using GIS integrated with multi-criteria decision analysis in upper Awash River basin, Ethiopia. Appl. Water Sci. 12:148. doi: 10.1007/s13201-022-01674-8
Hall, J., Arheimer, B., Borga, M., Brázdil, R., Claps, P., Kiss, A., et al. (2014). Understanding flood regime changes in Europe: a state-of-the-art assessment. Hydrol. Earth Syst. Sci. 18, 2735–2772. doi: 10.5194/hess-18-2735-2014
Hamidi, A. R., Jing, L., Shahab, M., Azam, K., Atiq Ur Rehman Tariq, M., and Ng, A. W. (2022). Flood exposure and social vulnerability analysis in rural areas of developing countries: an empirical study of Charsadda District, Pakistan. Water 14:1176. doi: 10.3390/w14071176
Hill, C., Verjee, F., and Barrett, C. (2010). Flash flood early warning system reference guide. Boulder, CO: University Corporation for Atmospheric Research, 204.
Hong, H., Panahi, M., Shirzadi, A., Ma, T., Liu, J., Zhu, A.-X., et al. (2018). Flood susceptibility assessment in Hengfeng area coupling adaptive neuro-fuzzy inference system with genetic algorithm and differential evolution. Sci. Total Environ. 621, 1124–1141. doi: 10.1016/j.scitotenv.2017.10.114
Hussain, M., Butt, A. R., Uzma, F., Ahmed, R., Irshad, S., Rehman, A., et al. (2020). A comprehensive review of climate change impacts, adaptation, and mitigation on environmental and natural calamities in Pakistan. Environ. Monit. Assess. 192, 1–20. doi: 10.1007/s10661-019-7956-4
Hussain, S., Raza, A., Abdo, H. G., Mubeen, M., Tariq, A., Nasim, W., et al. (2023). Relation of land surface temperature with different vegetation indices using multi-temporal remote sensing data in Sahiwal region, Pakistan. Geoscience Letters 10:33. doi: 10.1186/s40562-023-00287-6
Hussain, M., Tayyab, M., Zhang, J., Shah, A. A., Ullah, K., Mehmood, U., et al. (2021). GIS-based multi-criteria approach for flood vulnerability assessment and mapping in district Shangla: Khyber Pakhtunkhwa, Pakistan. Sustainability 13:3126. doi: 10.3390/su13063126
Islam, M., and Sado, K. (2000). Flood hazard map and land development priority map developed using NOAA AVHRR and GIS data. Asian J. Geoinform 45, 605–620.
Jain, V., Dhingra, A., Gupta, E., Takkar, I., Jain, R., and Islam, S. M. (2023). Influence of land surface temperature and rainfall on surface water change: an innovative machine learning approach. Water Resour. Manag. 37, 3013–3035. doi: 10.1007/s11269-023-03476-2
Jamali, A. A., Kalkhajeh, R. G., Randhir, T. O., and He, S. (2022). Modeling relationship between land surface temperature anomaly and environmental factors using GEE and Giovanni. J. Environ. Manag. 302:113970. doi: 10.1016/j.jenvman.2021.113970
Ju, J., and Slingo, J. (1995). The Asian summer monsoon and ENSO. Q. J. R. Meteorol. Soc. 121, 1133–1168. doi: 10.1002/qj.49712152509
Karymbalis, E., Andreou, M., Batzakis, D.-V., Tsanakas, K., and Karalis, S. (2021). Integration of GIS-based multicriteria decision analysis and analytic hierarchy process for flood-hazard assessment in the Megalo Rema River catchment (East Attica, Greece). Sustain. For. 13:10232. doi: 10.3390/su131810232
Kazakis, N., Kougias, I., and Patsialis, T. (2015). Assessment of flood hazard areas at a regional scale using an index-based approach and analytical hierarchy process: application in Rhodope–Evros region, Greece. Sci. Total Environ. 538, 555–563. doi: 10.1016/j.scitotenv.2015.08.055
Khan, A., Gong, Z., Shah, A. A., and Haq, M. (2023). A multi-criteria decision-making approach to vulnerability assessment of rural flooding in Khyber Pakhtunkhwa Province, Pakistan. Environ. Sci. Pollution Res. 30, 56786–56801. doi: 10.1007/s11356-023-25609-1
Khosravi, K., Nohani, E., Maroufinia, E., and Pourghasemi, H. R. (2016a). A GIS-based flood susceptibility assessment and its mapping in Iran: a comparison between frequency ratio and weights-of-evidence bivariate statistical models with multi-criteria decision-making technique. Nat. Hazards 83, 947–987. doi: 10.1007/s11069-016-2357-2
Khosravi, K., Pourghasemi, H. R., Chapi, K., and Bahri, M. (2016b). Flash flood susceptibility analysis and its mapping using different bivariate models in Iran: a comparison between Shannon’s entropy, statistical index, and weighting factor models. Environ. Monit. Assess. 188, 1–21. doi: 10.1007/s10661-016-5665-9
Kia, M. B., Pirasteh, S., Pradhan, B., Mahmud, A. R., Sulaiman, W. N. A., and Moradi, A. (2012). An artificial neural network model for flood simulation using GIS: Johor River basin, Malaysia. Environ. Earth Sci. 67, 251–264. doi: 10.1007/s12665-011-1504-z
Lama, G. F. C., and Crimaldi, M. (2021). Remote sensing of ecohydrological, ecohydraulic, and ecohydrodynamic phenomena in vegetated waterways: The role of leaf area index (LAI). Biology and life sciences forum,
Lee, S., and Rezaie, F. (2022). Data used for GIS-based flood susceptibility mapping. Data Geol. Ecol. Oceanogr. Space Sci. Polar Sci. 4, 1–15. doi: 10.22761/DJ2022.4.1.001
Li, Y., Li, M., Li, C., and Liu, Z. (2020). Optimized maxent model predictions of climate change impacts on the suitable distribution of cunninghamia lanceolata in China. Forests 11:302. doi: 10.3390/f11030302
Liuzzo, L., Sammartano, V., and Freni, G. (2019). Comparison between different distributed methods for flood susceptibility mapping. Water Resour. Manag. 33, 3155–3173. doi: 10.1007/s11269-019-02293-w
Mahmood, S., and Rahman, A.-U. (2019). Flash flood susceptibility modeling using geo-morphometric and hydrological approaches in Panjkora Basin, eastern Hindu Kush, Pakistan. Environ. Earth Sci. 78, 1–16. doi: 10.1007/s12665-018-8041-y
Mahmood, S., and Ullah, S. (2016). Assessment of 2010 flash flood causes and associated damages in Dir Valley, Khyber Pakhtunkhwa Pakistan. Int. J. Disaster Risk Reduction 16, 215–223. doi: 10.1016/j.ijdrr.2016.02.009
Mahmoud, S. H., and Gan, T. Y. (2018). Multi-criteria approach to develop flood susceptibility maps in arid regions of Middle East. J. Clean. Prod. 196, 216–229. doi: 10.1016/j.jclepro.2018.06.047
Mallapaty, S. (2022). Why are Pakistan's floods so extreme this year? Nature. doi: 10.1038/d41586-022-02813-6
Mehravar, S., Razavi-Termeh, S. V., Moghimi, A., Ranjgar, B., Foroughnia, F., and Amani, M. (2023). Flood susceptibility mapping using multi-temporal SAR imagery and novel integration of nature-inspired algorithms into support vector regression. J. Hydrol. 617:129100. doi: 10.1016/j.jhydrol.2023.129100
Mohammad, L., Bandyopadhyay, J., Sk, R., Mondal, I., Nguyen, T. T., Lama, G. F. C., et al. (2023). Estimation of agricultural burned affected area using NDVI and dNBR satellite-based empirical models. J. Environ. Manag. 343:118226. doi: 10.1016/j.jenvman.2023.118226
Mujib, M. A., Apriyanto, B., Kurnianto, F. A., Ikhsan, F. A., Nurdin, E. A., Pangastuti, E. I., et al. (2021). Assessment of flood hazard mapping based on analytical hierarchy process (AHP) and GIS: application in kencong district, jember regency, Indonesia. Geosfera Indonesia 6, 353–376. doi: 10.19184/geosi.v6i3.21668
Mustafa, D., Gioli, G., Qazi, S., Waraich, R., Rehman, A., and Zahoor, R. (2015). Gendering flood early warning systems: the case of Pakistan. Environ. Hazards 14, 312–328. doi: 10.1080/17477891.2015.1075859
Nanditha, J., Kushwaha, A. P., Singh, R., Malik, I., Solanki, H., Chuphal, D. S., et al. (2023). The Pakistan flood of august 2022: causes and implications. Earth's. Future 11:e2022EF003230. doi: 10.1029/2022EF003230
Naulin, J.-P., Payrastre, O., and Gaume, E. (2013). Spatially distributed flood forecasting in flash flood prone areas: application to road network supervision in southern France. J. Hydrol. 486, 88–99. doi: 10.1016/j.jhydrol.2013.01.044
Nazeer, M., and Bork, H.-R. (2021). A local scale flood vulnerability assessment in the flood-prone area of Khyber Pakhtunkhwa, Pakistan. Nat. Hazards 105, 755–781. doi: 10.1007/s11069-020-04336-7
Negese, A., Worku, D., Shitaye, A., and Getnet, H. (2022). Potential flood-prone area identification and mapping using GIS-based multi-criteria decision-making and analytical hierarchy process in Dega Damot district, northwestern Ethiopia. Appl Water Sci 12:255. doi: 10.1007/s13201-022-01772-7
Ogato, G. S., Bantider, A., Abebe, K., and Geneletti, D. (2020). Geographic information system (GIS)-based multicriteria analysis of flooding hazard and risk in ambo town and its watershed, west shoa zone, Oromia regional state, Ethiopia. J. Hydrol. 27:100659. doi: 10.1016/j.ejrh.2019.100659
Otieno, J. A. (2004). Scenario study for flood Hazard assessment in the lower Bicol floodplain Philippine using a 2D flood model. Enschede, The Netherlands: International Institute for Geo-information Science and Earth Observation (ITC).
Otto, F. E., Zachariah, M., Saeed, F., Siddiqi, A., Kamil, S., Mushtaq, H., et al. (2023). Climate change increased extreme monsoon rainfall, flooding highly vulnerable communities in Pakistan. Environmental Research 2:025001. doi: 10.1088/2752-5295/acbfd5
Ouma, Y. O., and Tateishi, R. (2014). Urban flood vulnerability and risk mapping using integrated multi-parametric AHP and GIS: methodological overview and case study assessment. Water 6, 1515–1545. doi: 10.3390/w6061515
Ozdemir, A., and Altural, T. (2013). A comparative study of frequency ratio, weights of evidence and logistic regression methods for landslide susceptibility mapping: Sultan Mountains, SW Turkey. J. Asian Earth Sci. 64, 180–197. doi: 10.1016/j.jseaes.2012.12.014
Pirone, D., Cimorelli, L., and Pianese, D. (2024). The effect of flood-mitigation reservoir configuration on peak-discharge reduction during preliminary design. Journal of Hydrol. 52:101676. doi: 10.1016/j.ejrh.2024.101676
Qasim, S., Qasim, M., Shrestha, R. P., and Khan, A. N. (2017). An assessment of flood vulnerability in Khyber Pukhtunkhwa province of Pakistan. AIMS Environ. Sci. 4, 206–216. doi: 10.3934/environsci.2017.2.206
Qi, W., Ma, C., Xu, H., Lian, J., Xu, K., and Yao, Y. (2024). An exploratory framework to urban flood collaborative mitigation strategy considering synergistic effect of inundation volume. J. Hydrol. 628:130555. doi: 10.1016/j.jhydrol.2023.130555
Radwan, F., Alazba, A., and Mossad, A. (2019). Flood risk assessment and mapping using AHP in arid and semiarid regions. Acta Geophys. 67, 215–229. doi: 10.1007/s11600-018-0233-z
Rahaman, S. N., and Shermin, N. (2022). Identifying the effect of monsoon floods on vegetation and land surface temperature by using Google earth engine. Urban Clim. 43:101162. doi: 10.1016/j.uclim.2022.101162
Rahman, Z. U., Ullah, W., Bai, S., Ullah, S., Jan, M. A., Khan, M., et al. (2023). GIS-based flood susceptibility mapping using bivariate statistical model in Swat River basin, Eastern Hindukush region, Pakistan. Front. Environ. Sci. 11. doi: 10.3389/fenvs.2023.1178540
Rahmati, O., Zeinivand, H., and Besharat, M. (2016). Flood hazard zoning in Yasooj region, Iran, using GIS and multi-criteria decision analysis. Geomat. Nat. Haz. Risk 7, 1000–1017. doi: 10.1080/19475705.2015.1045043
Rana, I. A., Bhatti, S. S., and Jamshed, A. (2021). Effectiveness of flood early warning system from the perspective of experts and three affected communities in urban areas of Pakistan. Environmental Hazards 20, 209–228. doi: 10.1080/17477891.2020.1751031
Rana, I. A., and Routray, J. K. (2018). Multidimensional model for vulnerability assessment of urban flooding: an empirical study in Pakistan. Int. J. Disaster Risk Sci. 9, 359–375. doi: 10.1007/s13753-018-0179-4
Rao, G. N. (2001). Occurrence of heavy rainfall around the confluence line in monsoon disturbances and its importance in causing floods. J Earth Syst. Sci. 110, 87–94. doi: 10.1007/BF02702232
Rehman, A., Song, J., Haq, F., Mahmood, S., Ahamad, M. I., Basharat, M., et al. (2022). Multi-hazard susceptibility assessment using the analytical hierarchy process and frequency ratio techniques in the Northwest Himalayas, Pakistan. Remote Sensing 14:554. doi: 10.3390/rs14030554
Rimba, A. B., Setiawati, M. D., Sambah, A. B., and Miura, F. (2017). Physical flood vulnerability mapping applying geospatial techniques in Okazaki City, Aichi prefecture. Japan. Urban Science 1:7. doi: 10.3390/urbansci1010007
Safdar, F., Khokhar, M. F., Arshad, M., and Adil, I. H. (2019). Climate change indicators and spatiotemporal shift in monsoon patterns in Pakistan. Adv. Meteorol. 2019, 1–14. doi: 10.1155/2019/8281201
Samanta, R. K., Bhunia, G. S., Shit, P. K., and Pourghasemi, H. R. (2018). Flood susceptibility mapping using geospatial frequency ratio technique: a case study of Subarnarekha River basin, India. Modeling Earth Systems Environ. 4, 395–408. doi: 10.1007/s40808-018-0427-z
Santato, S., Bender, S., and Schaller, M. (2013). The European floods directive and opportunities offered by land use planning. CSC report 12.
Scheuer, S., Haase, D., and Volk, M. (2017). Integrative assessment of climate change for fast-growing urban areas: measurement and recommendations for future research. PLoS One 12:e0189451. doi: 10.1371/journal.pone.0189451
Shafapour Tehrany, M., Shabani, F., Neamah Jebur, M., Hong, H., Chen, W., and Xie, X. (2017). GIS-based spatial prediction of flood prone areas using standalone frequency ratio, logistic regression, weight of evidence and their ensemble techniques. Geomat. Nat. Haz. Risk 8, 1538–1561. doi: 10.1080/19475705.2017.1362038
Shah, A. A., Ajiang, C., Khan, N. A., Alotaibi, B. A., and Tariq, M. A. U. R. (2022a). Flood risk perception and its attributes among rural households under developing country conditions: the case of Pakistan. Water 14:992. doi: 10.3390/w14060992
Shah, A. A., Ullah, A., Khan, N. A., Pal, I., Alotaibi, B. A., and Traore, A. (2022b). Gender perspective of flood early warning systems: people-centered approach. Water 14:2261. doi: 10.3390/w14142261
Shah, A. A., Ye, J., Abid, M., and Ullah, R. (2017). Determinants of flood risk mitigation strategies at household level: a case of Khyber Pakhtunkhwa (KP) province, Pakistan. Nat. Hazards 88, 415–430. doi: 10.1007/s11069-017-2872-9
Shahabi, H., Shirzadi, A., Ronoud, S., Asadi, S., Pham, B. T., Mansouripour, F., et al. (2021). Flash flood susceptibility mapping using a novel deep learning model based on deep belief network, back propagation and genetic algorithm. Geosci. Front. 12:101100. doi: 10.1016/j.gsf.2020.10.007
Sharif, H. O., Al-Juaidi, F. H., Al-Othman, A., Al-Dousary, I., Fadda, E., Jamal-Uddeen, S., et al. (2016). Flood hazards in an urbanizing watershed in Riyadh, Saudi Arabia. Geomat. Nat. Haz. Risk 7, 702–720. doi: 10.1080/19475705.2014.945101
Shen, M., and Chui, T. F. M. (2023). Quantifying the relative contributions of different flood generating mechanisms to floods across CONUS. J. Hydrol. 626:130255. doi: 10.1016/j.jhydrol.2023.130255
Shrestha, S., Sattar, H., Khattak, M. S., Wang, G., and Babur, M. (2020). Evaluation of adaptation options for reducing soil erosion due to climate change in the Swat River basin of Pakistan. Ecol. Eng. 158:106017. doi: 10.1016/j.ecoleng.2020.106017
Siahkamari, S., Haghizadeh, A., Zeinivand, H., Tahmasebipour, N., and Rahmati, O. (2018). Spatial prediction of flood-susceptible areas using frequency ratio and maximum entropy models. Geocarto Int. 33, 927–941. doi: 10.1080/10106049.2017.1316780
Sufri, S., Dwirahmadi, F., Phung, D., and Rutherford, S. (2020). Enhancing community engagement in disaster early warning system in Aceh, Indonesia: opportunities and challenges. Nat. Hazards 103, 2691–2709. doi: 10.1007/s11069-020-04098-2
Swets, J. A. (1988). Measuring the accuracy of diagnostic systems. Science 240, 1285–1293. doi: 10.1126/science.3287615
Sugianto, S., Deli, A., Miswar, E., Rusdi, M., and Irham, M. (2022). The effect of land use and land cover changes on flood occurrence in Teunom Watershed. Aceh Jaya. Land 11, 1271. doi: 10.3390/land11081271
Tadesse, D., Suryabhagavan, K. V., Nedaw, D., and Hailu, B. T. (2022). A model-based flood hazard mapping in Itang District of the Gambella region, Ethiopia. Geol. Ecol. Landscapes, 8:8–25. doi: 10.1080/24749508.2021.2022833
Tayyab, M., Zhang, J., Hussain, M., Ullah, S., Liu, X., Khan, S. N., et al. (2021). Gis-based urban flood resilience assessment using urban flood resilience model: a case study of Peshawar city, khyber pakhtunkhwa, Pakistan. Remote Sens. 13:1864. doi: 10.3390/rs13101864
Tehrany, M. S., Pradhan, B., and Jebur, M. N. (2013). Spatial prediction of flood susceptible areas using rule based decision tree (DT) and a novel ensemble bivariate and multivariate statistical models in GIS. J. Hydrol. 504, 69–79. doi: 10.1016/j.jhydrol.2013.09.034
Termeh, S. V. R., Kornejady, A., Pourghasemi, H. R., and Keesstra, S. (2018). Flood susceptibility mapping using novel ensembles of adaptive neuro fuzzy inference system and metaheuristic algorithms. Sci. Total Environ. 615, 438–451. doi: 10.1016/j.scitotenv.2017.09.262
Ullah, S., You, Q., Ullah, W., and Ali, A. (2018). Observed changes in precipitation in China-Pakistan economic corridor during 1980–2016. Atmos. Res. 210, 1–14. doi: 10.1016/j.atmosres.2018.04.007
Ullah, K., and Zhang, J. (2020). GIS-based flood hazard mapping using relative frequency ratio method: a case study of Panjkora River basin, eastern Hindu Kush, Pakistan. Plos one 15:e0229153. doi: 10.1371/journal.pone.0229153
Walden-Schreiner, C., Leung, Y.-F., Kuhn, T., Newburger, T., and Tsai, W.-L. (2017). Environmental and managerial factors associated with pack stock distribution in high elevation meadows: case study from Yosemite National Park. J. Environ. Manag. 193, 52–63. doi: 10.1016/j.jenvman.2017.01.076
Wang, Z., Chen, X., Qi, Z., and Cui, C. (2023). Flood sensitivity assessment of super cities. Sci. Rep. 13:5582. doi: 10.1038/s41598-023-32149-8
Wang, Z., Lai, C., Chen, X., Yang, B., Zhao, S., and Bai, X. (2015). Flood hazard risk assessment model based on random forest. J. Hydrol. 527, 1130–1141. doi: 10.1016/j.jhydrol.2015.06.008
Wang, G., Wang, C., Guo, Z., Dai, L., Wu, Y., Liu, H., et al. (2020). Integrating Maxent model and landscape ecology theory for studying spatiotemporal dynamics of habitat: suggestions for conservation of endangered red-crowned crane. Ecol. Indic. 116:106472. doi: 10.1016/j.ecolind.2020.106472
Xu, K., Wang, C., Bin, L., Shen, R., and Zhuang, Y. (2023). Climate change impact on the compound flood risk in a coastal city. J. Hydrol. 626:130237. doi: 10.1016/j.jhydrol.2023.130237
Xue, Y., Diallo, I., Li, W., David Neelin, J., Chu, P. C., Vasic, R., et al. (2018). Spring land surface and subsurface temperature anomalies and subsequent downstream late spring-summer droughts/floods in North America and East Asia. J. Geophys. Res. Atmos. 123, 5001–5019. doi: 10.1029/2017JD028246
Yan, Y., Mao, K., Shi, J., Piao, S., Shen, X., Dozier, J., et al. (2020). Driving forces of land surface temperature anomalous changes in North America in 2002–2018. Sci. Rep. 10:6931. doi: 10.1038/s41598-020-63701-5
Yariyan, P., Avand, M., Abbaspour, R. A., Torabi Haghighi, A., Costache, R., Ghorbanzadeh, O., et al. (2020). Flood susceptibility mapping using an improved analytic network process with statistical models. Geomat. Nat. Haz. Risk 11, 2282–2314. doi: 10.1080/19475705.2020.1836036
Zaidi, S., Bhutta, Z. A., Wajid, A., Nawaz, G., Nazeer, K., Mohmand, S. K., et al. (2013). Nutrition political economy, Pakistan. Province Report: Khyber Pakhtunkhwa.
Zhao, J., He, S., and Wang, H. (2022). Historical and future runoff changes in the Yangtze River basin from CMIP6 models constrained by a weighting strategy. Environ. Res. Lett. 17:024015. doi: 10.1088/1748-9326/ac3f61
Zhao, G., Pang, B., Xu, Z., Peng, D., and Xu, L. (2019). Assessment of urban flood susceptibility using semi-supervised machine learning model. Sci. Total Environ. 659, 940–949. doi: 10.1016/j.scitotenv.2018.12.217
Zhao, G., Pang, B., Xu, Z., Yue, J., and Tu, T. (2018). Mapping flood susceptibility in mountainous areas on a national scale in China. Sci. Total Environ. 615, 1133–1142. doi: 10.1016/j.scitotenv.2017.10.037
Zhiyu, L., Xiaotao, C., Zuhua, C., Haotao, W., Li, Z., Lai, E., et al. (2013). Guidelines on urban flood risk management (UFRM). Macao, China: ESCAP/WMO Typhoon Committee Secretariat.
Ziwei, L., Xiangling, T., Liju, L., Yanqi, C., Xingming, W., and Dishan, Y. (2023). GIS-based risk assessment of flood disaster in the Lijiang River basin. Sci. Rep. 13:6160. doi: 10.1038/s41598-023-32829-5
Zou, Q., Zhou, J., Zhou, C., Song, L., and Guo, J. (2013). Comprehensive flood risk assessment based on set pair analysis-variable fuzzy sets model and fuzzy AHP. Stoch. Env. Res. Risk A. 27, 525–546. doi: 10.1007/s00477-012-0598-5
Keywords: flood susceptibility, AHP, MCDA, risk zones, management, Khyber Pakhtunkhwa, Pakistan
Citation: Khan TU, Nabi G, Ullah S, Akbar A, Omifolaji JK, Achakzai JK and Iqbal A (2025) Mapping flood resilience: a comprehensive geospatial insight into regional vulnerabilities. Front. Water. 7:1465505. doi: 10.3389/frwa.2025.1465505
Edited by:
Boris Faybishenko, Berkeley Lab (DOE), United StatesReviewed by:
Venkatramanan Senapathi, National College, Tiruchirappalli, IndiaCopyright © 2025 Khan, Nabi, Ullah, Akbar, Omifolaji, Achakzai and Iqbal. This is an open-access article distributed under the terms of the Creative Commons Attribution License (CC BY). The use, distribution or reproduction in other forums is permitted, provided the original author(s) and the copyright owner(s) are credited and that the original publication in this journal is cited, in accordance with accepted academic practice. No use, distribution or reproduction is permitted which does not comply with these terms.
*Correspondence: Arshad Iqbal, YXJzaGFkLmlxYmFsQHVzd2F0LmVkdS5waw==
Disclaimer: All claims expressed in this article are solely those of the authors and do not necessarily represent those of their affiliated organizations, or those of the publisher, the editors and the reviewers. Any product that may be evaluated in this article or claim that may be made by its manufacturer is not guaranteed or endorsed by the publisher.
Research integrity at Frontiers
Learn more about the work of our research integrity team to safeguard the quality of each article we publish.