 Desalegn Tegegne
 Petra Schmitter
 Abeyou W. Worqlul2
- 1International Water Management Institute (IWMI), Addis Ababa, Ethiopia
- 2International Center for Agricultural Research in the Dry Areas (ICARDA), Addis Ababa, Ethiopia
- 3The Norman Borlaug Institute for International Agriculture, Texas A&M AgriLife Research, College Station, TX, United States
Understanding current and future crop water demand is crucial for improving agricultural productivity and managing long-term water resources in a changing climate. This study aimed to estimate how the crop water demand will change under different water management practices and climate change scenarios. The field experiment using irrigation decision-making tools was carried out in 2016 and 2017 in Lemo, Ethiopia. Crop and water management data were collected on cabbage and carrot production. The field data were used to estimate the crop coefficient (Kc), and the results were compared with the simulated Kc with the Agricultural Policy Environmental eXtender (APEX) model. Predicted future climate data were used in APEX to evaluate the effect of climate change on future crop water requirements and Kc. The field data analysis indicated that, on average, farmer traditional practice (FTP) treatments used more water than wetting front detector (WFD) treatments. Using the soil water balance method, the average of the two treatments’ Kc values at the initial, mid, and late stages was 0.71, 1.21, and 0.8 for cabbage and 0.69, 1.27, and 0.86 for carrot, respectively. The APEX-simulated Kc has captured the FAO Kc pattern very well with the coefficient of determination (R-square) ranging between 0.5 and 0.74. The APEX simulation and the soil water balance estimated Kc also indicated a strong association with R-square ranging between 0.5 and 0.75 for cabbage and 0.66 and 0.96 for carrot. The projected climate change analysis indicated that the crop water demand is expected to increase in the future due to increasing temperatures. Under climate change scenarios, the growing season potential evapotranspiration will increase by 2.5, 5.1, and 6.0% in 2025, 2055, and 2085 compared to the baseline period, respectively. The simulated Kc indicated a higher coefficient of variation in 2085 with 19% for cabbage and 24% for carrot, while the 2025 period simulated Kc indicated the least coefficient of variation (16 and 21% for cabbage and carrot, respectively). The study shows that current irrigation planning with the available water resources should take into account higher crop water requirements in the region to reduce water scarcity risks.
1 Introduction
Agricultural production in East Africa, particularly Ethiopia, contributes to domestic food supplies and agricultural exports for foreign exchange. Agriculture is vital to Ethiopia’s economy, contributing 46% of the gross domestic product (GDP), 73% of employment, and 80% of foreign export earnings (Agricultural Transformation Agency [ATA], 2014). Although agriculture is the dominant economic sector in Ethiopia, the majority of the cropped land is rain-fed (Awulachew et al., 2007; Worqlul et al., 2017). Due to this, rainfall variability, frequent drought, and limited water resources jeopardize agricultural productivity and food security. When there is a shortage of rainfall to fulfill the crop water demand, supplying adequate water either through supplementary or full irrigation is crucial (Tiruye et al., 2022). For efficient on-farm water management, estimating crop evapotranspiration (ETc) is important to estimate crop water demand (Tegegne et al., 2024). However, Ethiopia’s crop coefficient and crop water demand predictions are not well-defined; previous studies have relied on regional values estimated in different environments (Shenkut et al., 2013).
Climate change adds to variations in crop performance and, therefore, the crop coefficient and crop water demand predictions. Climate change impacts climate variables, such as precipitation, temperature, wind speed, solar radiation, and humidity, which affect crop water demand (Chowdhury et al., 2016). Such changes can include long-term (30 years) alterations in the mean, variance, and distribution in values for temperature, precipitation, and wind speed (Sarker et al., 2023; NOAA, 2010). Shenkut et al. (2013) and Irmak (2009) indicated that the crop water demands affected by climate change, particularly changes in precipitation and temperature, are high. Hence, while a global phenomenon, climate change conditions vary by local context (Gregory et al., 2005; Patz et al., 2005). Brekke (2009) indicated that regional climate changes have an abundant impact on natural systems, particularly water resources.
In each river basin and/or watershed, climate change may have a significant impact on water resources (Brekke, 2009; Mekuria et al., 2024). The long-term recorded climate (precipitation and temperature) datum is also crucial to generate the stream and sediment data if there are important hydrometeorological gauge locations in each watershed (Mekuria and Tegegne, 2023). However, climate forecasting, on the other hand, is constrained by insufficient weather data observation (Brekke, 2009). Flooding and canal instability conditions will occur whenever there is a lack of long-term recorded climate data, unpredictability, and complexity of fluctuations related to discharge (Sarker et al., 2023). Climate change could be one of the external disruption agents for many river networks (Godard et al., 2013). Hence, identifying the right location for gauge stations is important for policymakers in collecting and managing hydrological data, managing water resources, and understanding how the future climate projection affects natural resources (Uusiku et al., 2010; Worqlul et al., 2019). The construction of dams may need attention, and the study by Gao et al. (2022) indicated that dam construction should consider the river flow and the eco-system function. This means that the climate data collected from gauges help to estimate future climate change and the policymakers may decide what type of infrastructure has to be done. Given that climate change is region-specific, regional-level studies are needed on the climate change effects on water resource needs for agriculture. Therefore, periodic evaluations are crucial to understand the impact of climate change in the future for better water resource management and planning (Acharjee et al., 2017).
Vegetable production in Ethiopia ranges from large state-owned farms producing for the domestic market and export to smallholder farms mainly producing for local markets. Cabbage and carrot are two of the major vegetable crops produced for local and export markets and are predominantly irrigated. These crops play a crucial role in increasing the farmer income, contributing significantly to food security and the livelihoods of smallholder farmers (Passarelli et al., 2018; Nunes and Celili, 2008; Desalegn et al., 2020). As these vegetables are increasingly integrated for nutrition security and agricultural economic development, their cultivation is promoted through improved agricultural practices and access to resources (Eyasu et al, 2015; Belew and Derbew, 2015).
This study aimed to evaluate water productivity using irrigation scheduling tools and farmers’ traditional practice of cabbage and carrot in Ethiopia. In addition, the study evaluated whether irrigation scheduling impacts the crop coefficients and uses a biophysical crop model to evaluate the potential effect of climate change on crop coefficients and crop water requirements.
2 Materials and methods
2.1 Location of the study area
The study was conducted in Lemo Gilgel Gibe, which is the sub-basin of the Omo-Gibe Basin, 1 of the 12 major river basins of Ethiopia, located in the Southern Nations, Nationalities, and Peoples’ Region (SNNPR) (Figure 1). The study watershed is located between 7°31′55″ and 7°33′54″ latitude and 37°40′48″ and 37°45′58″ longitude, and the elevation varies between 2,061 and 2,559 m above sea level (a.s.l.). The mean daily maximum and minimum temperatures range from 21.6°C to 24.6°C and 9.8°C to 12.1°C, respectively. The mean annual rainfall in Hossaena station is ~1,123 mm (2005–2018, source: National Meteorological Agency). In Lemo, the dry season extends from November to May and the rainy season from June to October. Enset, wheat, barley, faba bean, teff, and potato are the main crops grown in the area during the rainy season, while tomato, potato, cabbage, and beetroot are grown commonly as irrigated crops during the dry season (Kuria et al., 2014). The soil of the Lemo watershed is a Pellic Vertisol, black in color, and has relatively high water storage capacity in the root zone because of the high clay content and depth.
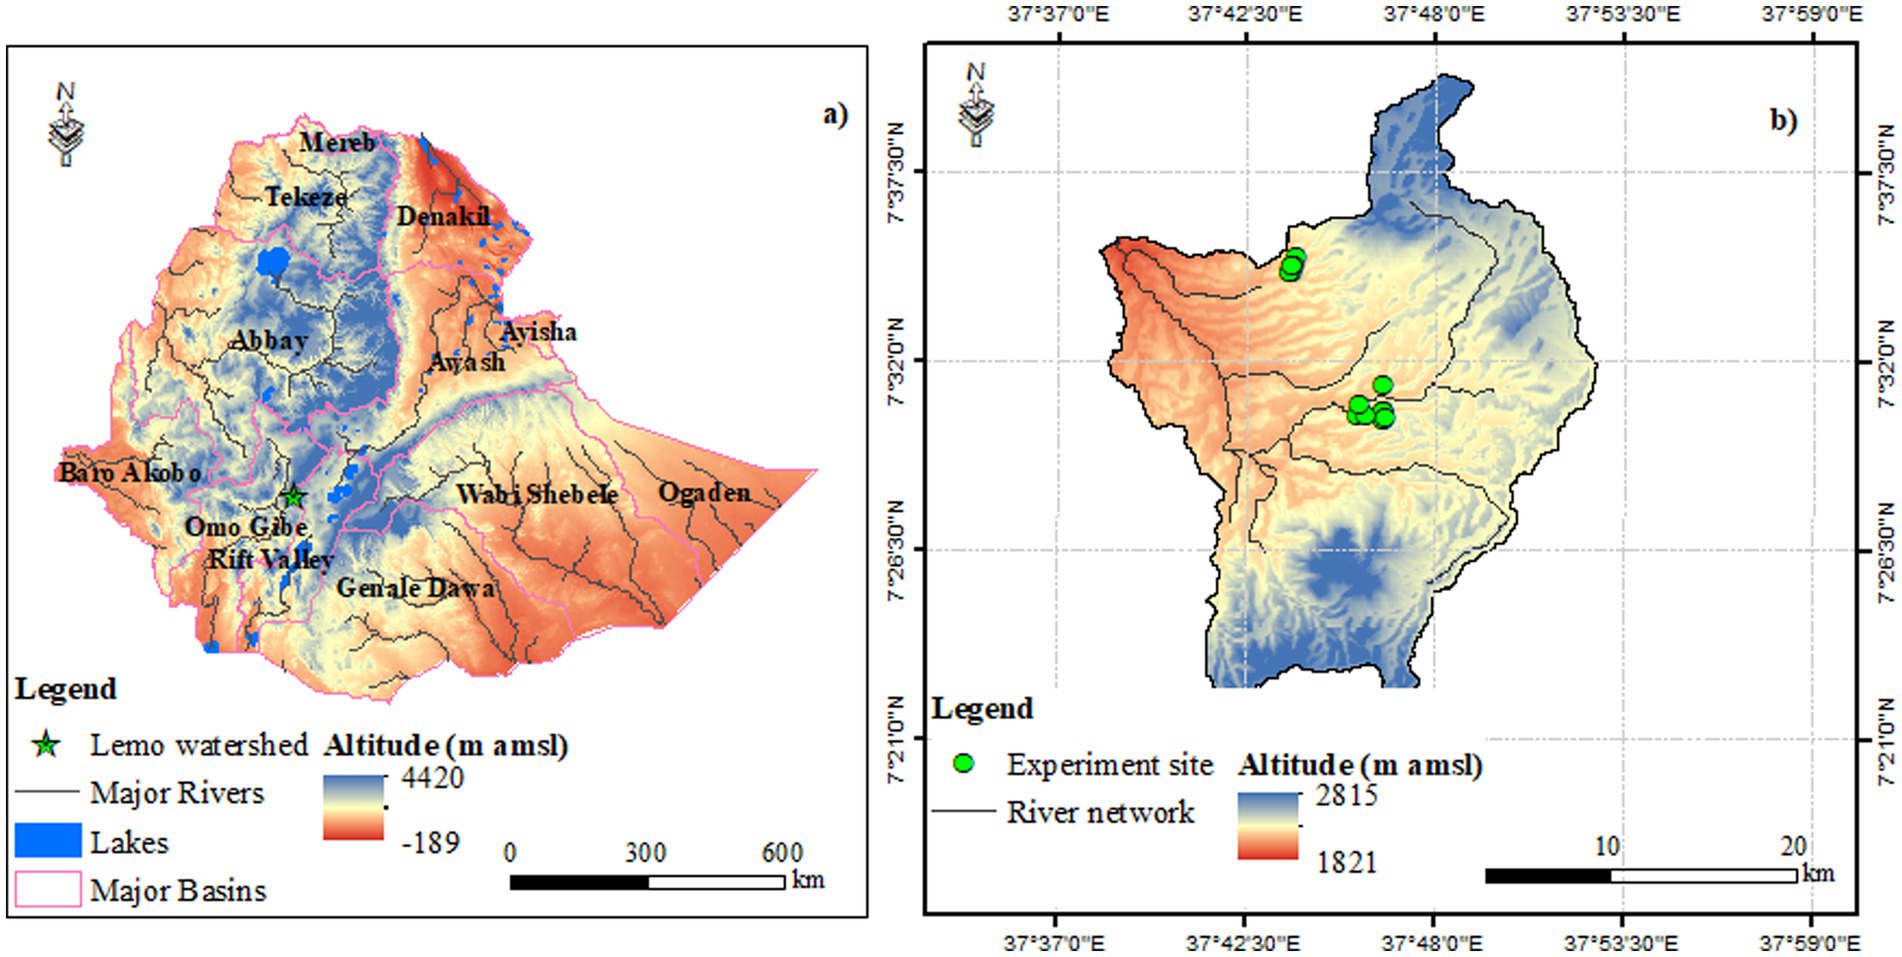
Figure 1. Location of the study site in Ethiopia. (A) Major river basins in Ethiopia with the major river network; the background is a 90-m digital elevation model. (B) Lemo watershed with major rivers showing the location of the experiment site.
This study was done in the Omo-Gibe Basin because in the Omo-Gibe Basin, agricultural water demand for irrigation is dominant, although the majority of the land is unsuitable due to undulating topography for irrigation development (Meshesha and Bekele, 2019; Awulachew et al., 2007). As a result, the Omo-Gibe River is not used for irrigation scheme development. However, Lemo Woreda, located in the Omo-Gibe Basin, is identified as a promising region for shallow groundwater development where farmers use manual (e.g., rope and washer) or motorized (e.g., fuel or solar) pumps to extract water for small home gardens or plots less than 1 hectare. Furthermore, limited information is available on the Omo-Gibe Basin for evaluating the effect of projected climate data on water resource availability for agricultural production. The magnitude of change in temperature and rainfall has been increasing throughout the basin, particularly since 1997, using data from 1981 to 2016 (Degefu and Bewket, 2014; Jaweso et al., 2019; Anose et al.,2021; Singhal et al., 2023). The agricultural potential of this area is underutilized due to a lack of knowledge about the water demands for agricultural production in a changing climate. Due to this, the site is considered for this study as a test case for comparing various agricultural water management technologies and their effect on the production of vegetables (Schmitter et al., 2017).
2.2 Methods
The study aimed to examine changes in crop water requirements following different water management practices under climate change using a combination of field monitoring and crop model simulations for small home gardens (i.e., fields smaller than 250 m2). In the field, traditional (i.e., current) farmer irrigation practices (FTPs) were compared to a treatment where farmers used the wetting front detector (WFD) to decide how much to irrigate (Stirzaker, 2003). Farmers who were willing to cultivate cabbage and carrot under the study were included and randomly assigned to one of the two treatments (i.e., FTP or WFD). The cabbage and carrot varieties grown were Hollande and Euro, respectively. The experiment was carried out over two seasons (2016 and 2017). Detailed field data on cabbage and carrot production, including information on cultural practices, agricultural inputs, irrigation applied, soil moisture, and production amounts, were collected from each farmer’s fields. The field data were used to estimate the crop coefficient by applying a soil water balance at different growing stages (initial, development, mid, and late seasons). The number of growing days for each stage was determined by following crop growth and canopy cover. The initial stage was considered when the plant covered 10% of the ground; the development stage was considered when there was an effective full cover, approximately 60–70% ground coverage; the yellow coloring of leaves indicated mid-stage, followed by leaf drop and browning of fruit; and the maturity or late season stage was considered when roots and leaves dried out before harvest. Furthermore, daily climate data and biophysical data of soil and agronomic management practices were used as input to the Agricultural Policy Environmental eXtender (APEX) model to estimate the crop coefficient. The APEX model was calibrated and validated to simulate the observed yield and estimate crop coefficients of carrot and cabbage. The estimated crop coefficients from APEX were compared with the regional Food and Agriculture Organization (FAO)-recommended regional crop coefficients (Allen et al., 1998). Predicted future climate data of rainfall and temperature were used as input for the APEX model to evaluate the effect of climate change on crop coefficients and crop water requirements (Figure 2).
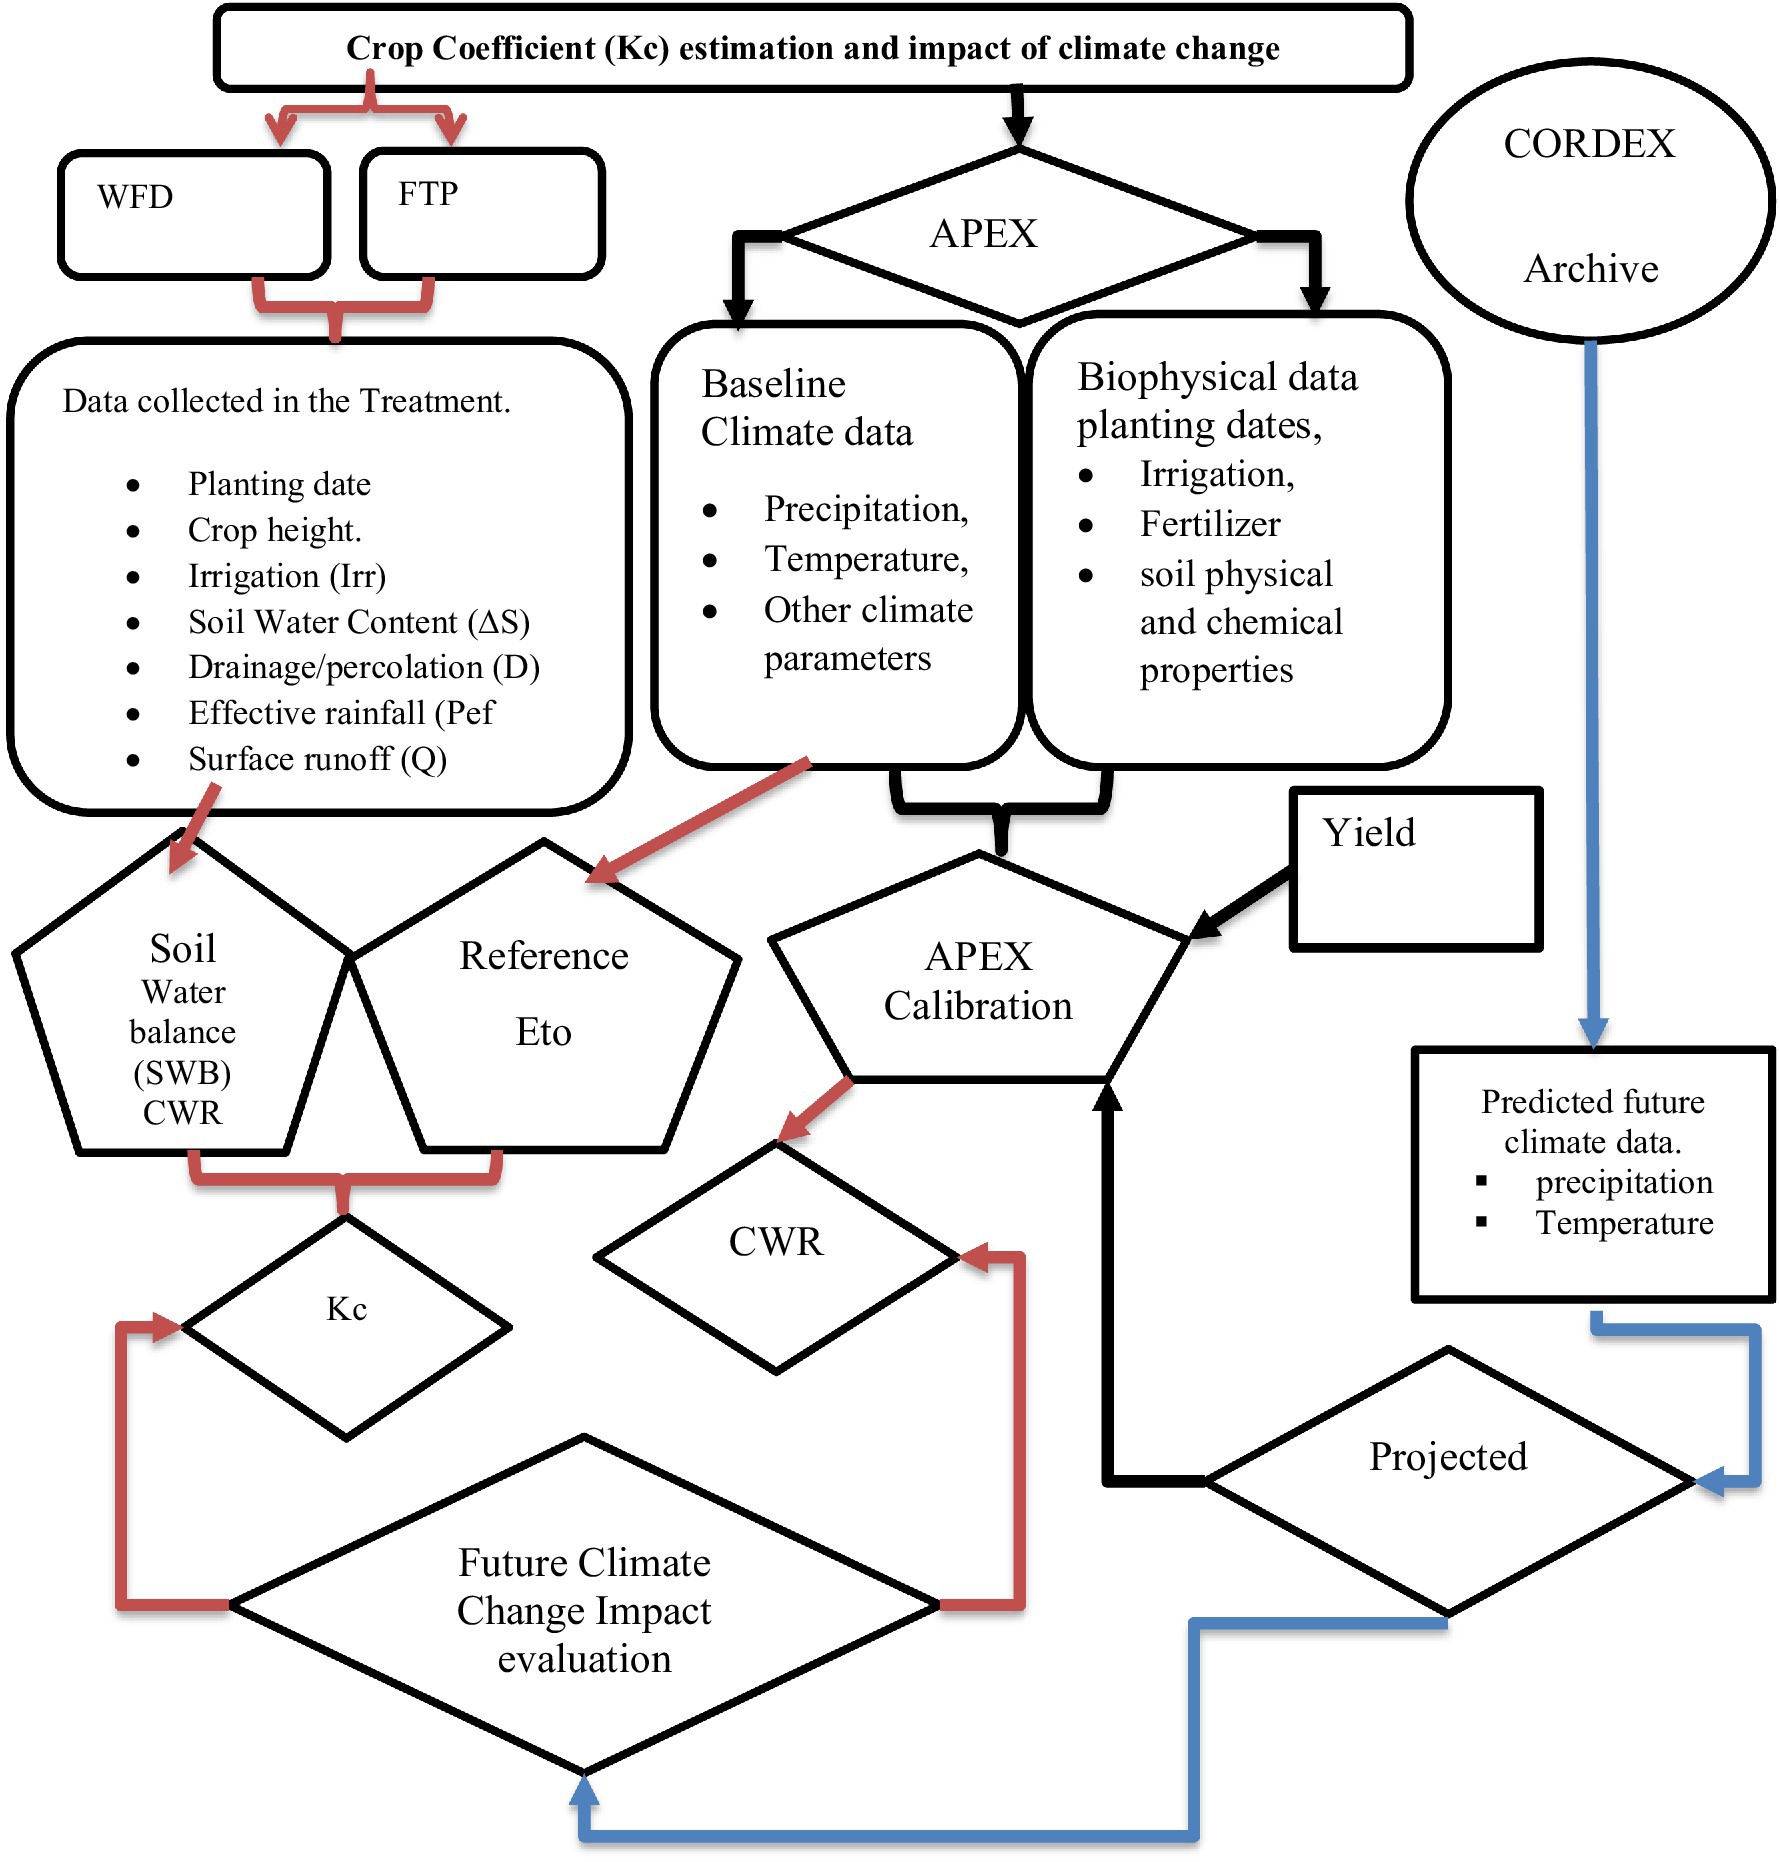
Figure 2. Methodology framework developed to address the research question.
2.2.1 Field experiment
The WFD tool was tested in farmers’ fields to improve farm-level irrigation decision-making and water use efficiency (Schmitter et al., 2016), which, in turn, could improve crop yields and therefore farm income. Farmers using the WFD irrigated depending on the response of the WFD indicators as these popped up when soils reached their field capacity at the depth of installation. The farmers under the FTP group used water based on their knowledge. To evaluate the effects of the irrigation scheduling tool (WFD) on crop and water productivity, farmers who did not have access to the tool were assigned to the FTP treatment. This study followed a complete randomized block design with replications for each crop and treatment. In 2016, 17 farmers (7 farmers under WFD treatment and 10 farmers under FTP) grew cabbage and carrots, whereas in 2017, only 12 farmers decided to continue (3 under WFD and 9 farmers under FTP) growing cabbage and carrot.
Cabbage was transplanted after a nursery period, 3 months earlier than the plantation time. The land size per crop varied between 50 and 100 m2. The fertilizer type used was diammonium phosphate (DAP) and urea at the time of planting and in a split application, respectively. The fertilizer amount and time of application are shown in Table 1.
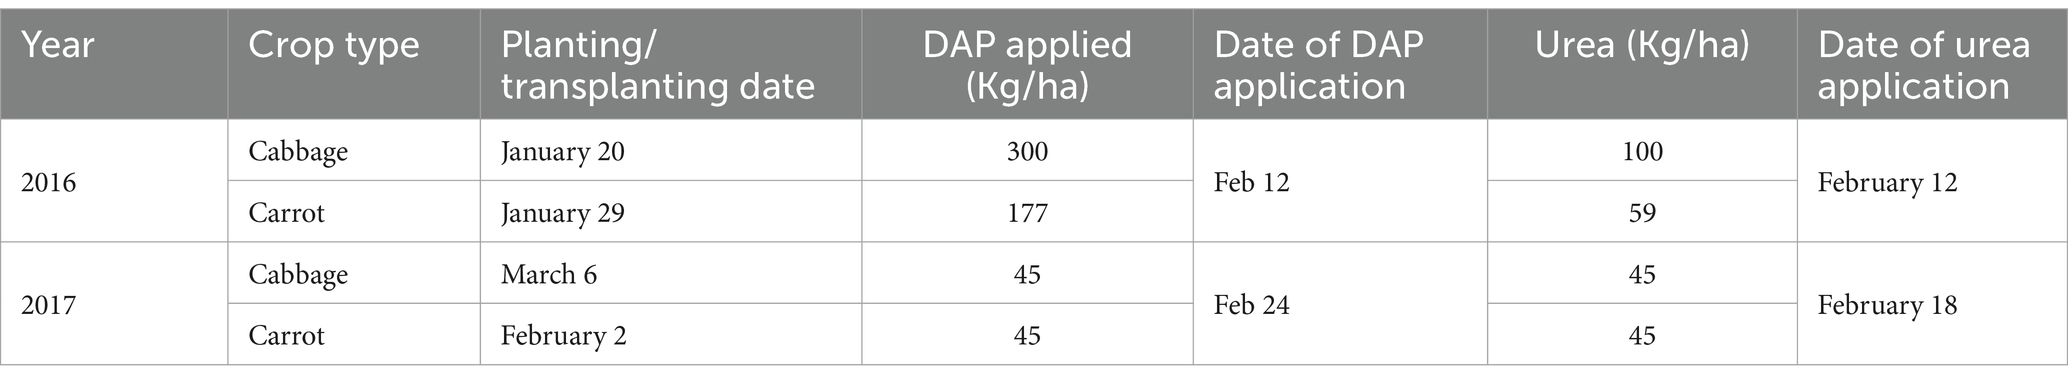
Table 1. Fertilizer amount used for both crop types in each growing season.
2.2.2 Field data collection
The data collected during the field experiment included planting dates, irrigation, fertilizer application dates and amounts, soil moisture content, crop height, and yields. In addition, detailed field information (area of the field, planting and/or transplanting date, and plant density) was collected. Soil samples were collected and analyzed to determine soil physical and chemical properties such as soil texture, field capacity, available organic matter, pH, total nitrogen, available phosphorus, and electric conductivity.
The soil texture ranged from sandy loam to clay loam (Table 2). The estimated field capacity and wilting point followed the variability in organic matter and textural differences between the fields. Field capacity (FC) ranged between 23 and 36%, whereas permanent wilting point (PWP) ranged between 11 and 23%.
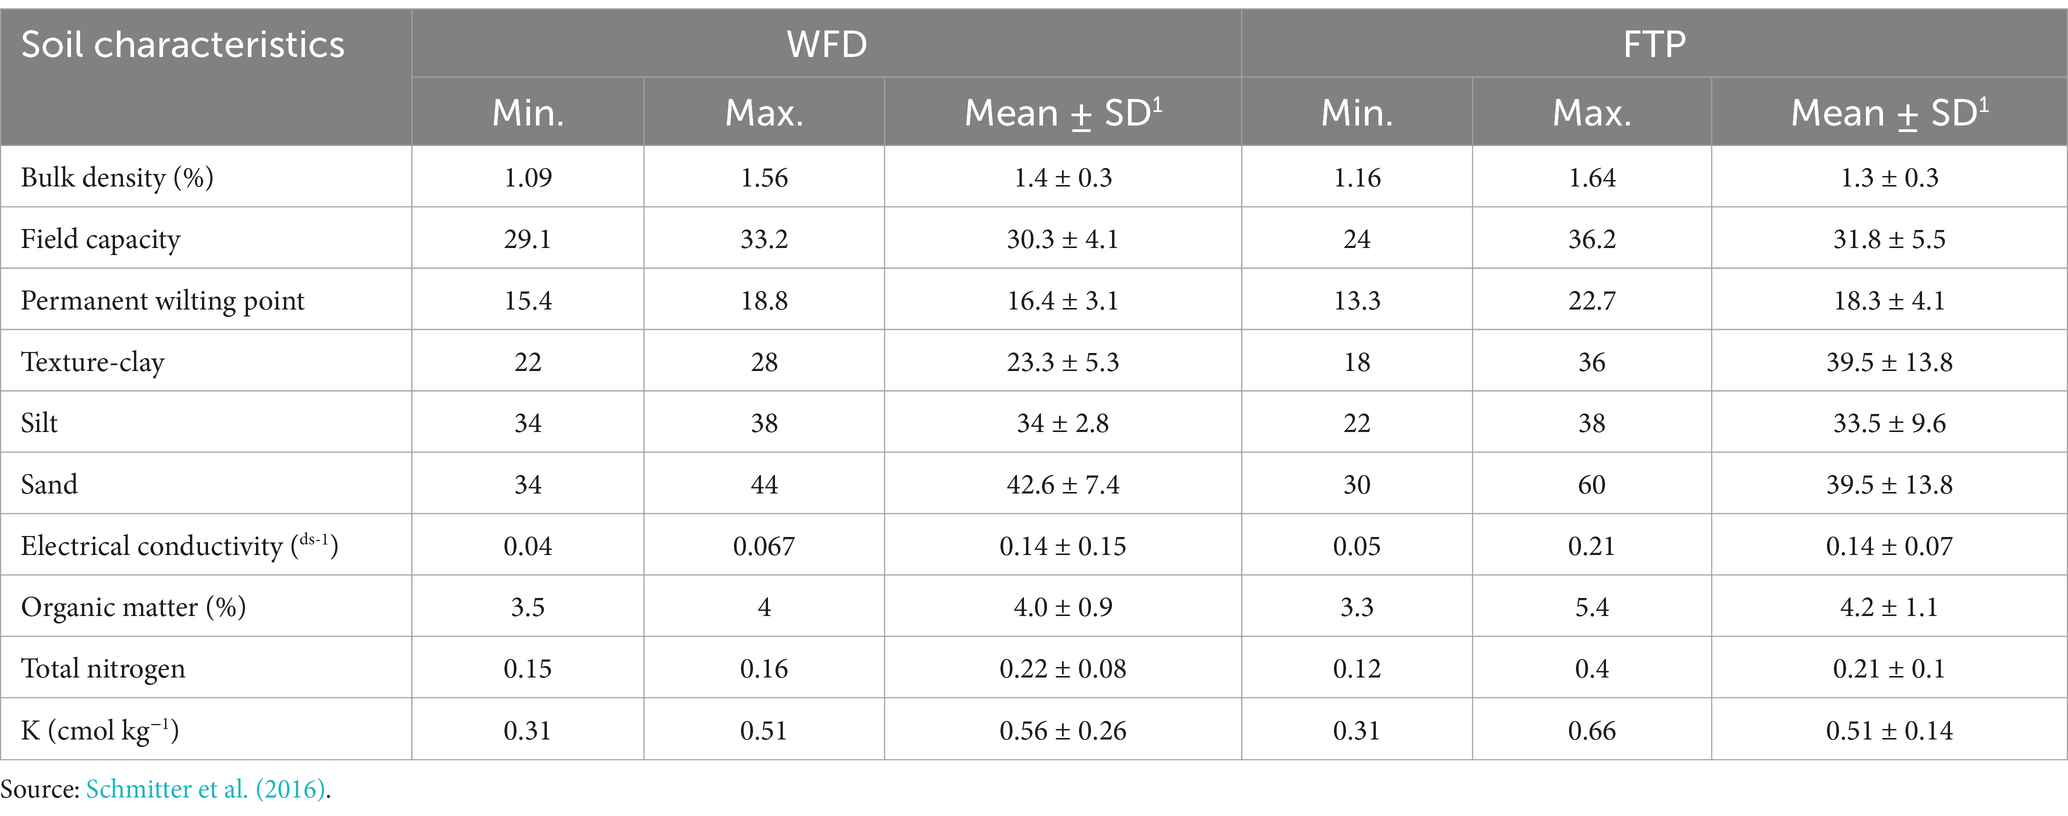
Table 2. Overview of soil physical and chemical properties.
Instruments such as WFD for managing the on-farm water and soil moisture access tubes to monitor the soil moisture content were installed in the experimental plots. The WFD was used to indicate when the wetting front had reached the end of the root zone, so farmers could improve their irrigation decision-making.
In both seasons, access tubes were installed in six farmer fields (three access tubes in each treatment) to measure the soil moisture content up to the depth of 1 m (i.e., 10, 20, 30, 40, 60, and 100 cm) for each crop using the PR2/4 profile probe, manufactured by Delta-T Devices Ltd. A portable/handheld HH2 display device/reader was used to obtain soil moisture readings at regular intervals throughout the production period. The probe is known for its high measurement accuracy and user-friendly design (Teferi et al., 2023). The soil moisture measurements were categorized into two groups: the effective root zone (0–60-cm depth) to estimate the change in soil moisture content within the effective root zone and the deeper soil (60–100 cm) to estimate the deep percolation portion. These measured values are used for the soil water balance equation (see below).
2.2.3 Computing the soil water balance
The soil water balance is computed based on the principle of conservation of mass and entails estimating the different components of the soil water balance. The general soil water balance equation is shown in Equation 1. The temporal scale of the SWB was based on the crop growth stage (initial, development, mid, and late season stages).
where Peff = effective rainfall (mm), Irr = irrigation (mm), ETc = crop evapotranspiration during the study period (mm), Q = surface runoff (mm), D = drainage (percolation, mm), S = variation in the soil water storage before and after in each crop stage (mm), Θ1 - Θ2 = volumetric water content from a soil horizon in each stage, in two consecutive crop stage measurements (cm3 cm−3), and Dzi = thickness of each depth in each stage (mm).
The different soil water balance components were measured at the experimental plots, including rainfall, irrigation, runoff, deep percolation, and change in soil moisture. After rewriting the equation, the crop evapotranspiration of the two vegetable crops (cabbage and carrot) was estimated using Equation 3.
2.2.3.1 Effective rainfall (Peff)
In this study, the rainfall data were collected from an automatic rain gauge station functioning between 2014 and 2016 installed within the study area. The nearby weather station in Hossaena (20 km from the experiment site) town, operated by the Ethiopian Meteorological Agency (MAE), was used for the 2017 period as the local automatic rain gauge station failed. Daily rainfall data collected at the study site were used to estimate the effective rainfall and reference potential evapotranspiration. The effective rainfall was estimated using the USDA Soil Conservation Service formula developed by USCS (Equations 4, 5) (Dastane, 1974).
2.2.3.2 Irrigation (Irr)
The rainfall amount during the planting season (January to July) was not sufficient to fulfill the crop water demand, and farmers used supplementary irrigation depending on their treatment group. The amount of water applied in each farmer’s field for each irrigation event was recorded and summed per crop stage.
2.2.3.3 Soil water content variation (∆S)
Soil water content was measured using a soil moisture profile probe. Based on the soil moisture readings obtained, the change in soil moisture content in the active root zone was estimated up to 60 cm for each growth stage using Equation 2.
2.2.3.4 Drainage/deep percolation (D)
Based on the profiler probe readings, the moisture readings taken below 0.6 m were considered deep percolation as the maximum rooting depth was estimated at 0.6 m for both vegetables. Hence, drainage or deep percolation was estimated from the soil water content changes between 0.6- and 1-m soil depths. The soil moisture content readings were evaluated during the crop development stages. In each crop stage, the reading was taken immediately before irrigation application. The summation of each reading in each stage of the cropping season is the total depth of drained water below the root zone at each growing stage.
2.2.3.5 Surface runoff (Q)
As irrigation was used manually using buckets, the observed runoff amount in the farmers’ fields was nil. Furthermore, during the rainfall periods, runoff was not observed during the growing seasons. As a result, the runoff was assumed to be zero while estimating the soil water balance.
2.2.4 Estimating crop coefficient using soil water balance
The crop coefficient (Kc) was estimated as the ratio of crop evapotranspiration (ETc) and reference evapotranspiration (ETo) for each cropping stage and treatment (Equation 6) (Allen et al., 1998). For each crop stage, ETc was calculated using the soil water balance equation (Equation 3). ETo refers to the potential evaporation (Allen et al., 1998). The FAO Penman–Monteith method was used to estimate ETo using daily climate data (sunshine hour, solar radiation, minimum and maximum temperatures, relative humidity, and wind speed).
The main reason for estimating Kc for each treatment was to evaluate whether improved management practices affected the crop coefficient. Finally, the Kc value estimated with the soil water balance method was compared with the FAO regional Kc values. This helps to check whether the FAO Kc regional values are representative of Ethiopian climate conditions.
2.2.5 Crop coefficient estimation applying a biophysical model
A digital elevation model (DEM) from the United States Geological Survey (USGS) Earth Explorer with a 30-m spatial resolution was used to set up the APEX model. The climate data for the APEX model (precipitation, temperature, humidity, wind speed, and solar radiation) were taken from the automatic weather station installed on the site.
The APEX model is a field or watershed scale distributed hydrological model (Arnold et al., 1994; Gassman et al., 1998; Williams et al., 1998). In the APEX model, the watershed is divided into multiple sub-watersheds of homogeneous land use, soil, and slope. The model operates on a daily time step, driven by climate data and agricultural management schedules. The model is capable of simulating detailed field conditions, including crop management and growth, as well as the hydrology of various agricultural management practices (Saleh and Gallego, 2007; Wang et al., 2011; Worqlul et al., 2018). In this study, the APEX model was used to estimate the actual and potential evaporation of the practices using the agricultural management practices as input to the model.
The APEX model provides five options to estimate the potential evaporation, namely, Penman–Monteith, Penman, Priestley–Taylor, Hargreaves, and Baier–Robertson. In this study, the Penman–Monteith method was adopted. The model estimates the actual evaporation from the soil and transpiration from the plant separately. Actual evaporation is estimated as a function of potential evaporation and leaf area index, while actual soil water evaporation is estimated as an exponential function of soil depth and water content (Williams et al., 2006).
In general, the crop coefficient is estimated as the ratio of actual evapotranspiration and reference evapotranspiration (Allen et al., 1998). In the study by Allen et al. (1998), the reference evapotranspiration is represented with a reference surface of hypothetical grass of a uniform height of 12 cm. There are some crops such as rice, which can have Kc values greater than one during maturity. However, in the APEX model, the crop coefficient was estimated as a fraction of actual and potential evaporation for both practices and vegetables after calibrating the model for observed cabbage and carrot yield. The performance of the APEX-simulated yield was compared with the observed yield, and the model performance was evaluated using root mean square error (RMSE) and percent bias (PBIAS).
The performance of the APEX-simulated yield was compared with the observed yield, and the model performance was evaluated using root mean square error (RMSE) and percent bias (PBIAS). Both model performance indicators measured the average difference between the APEX model predicted yield and the actual observed vegetable yield. In contrast, the APEX and soil water balance estimated crop coefficient was evaluated through the coefficient of determination, providing a quantitative measure of the goodness of fit for both the APEX and soil water balance estimated crop coefficient.
2.2.6 Climate change impact on Kc
Crop water demand and crop coefficient depend on the climate variables, mainly on rainfall and temperature. In the future, the presumed climate will have an immense effect on both the crop coefficient and the crop water requirements (CWR). To evaluate the effect of future climate on the CWR and Kc, predicted climate data were collected from the Coordinated Regional Downscaling Experiment (CORDEX) archive (Christensen et al., 2014). The CORDEX archive improves and reframes regional-scale climate projections, which help evaluate the impacts of climate change in the future. For all major inhabited areas of the world, the CORDEX-projected climate data are available at 25-km spatial resolution (Teichmann et al., 2020). For this study, the rainfall and minimum and maximum temperature data from the medium representative pathways 4.5 (RCP4.5) were used for the period 2006–2,100. The future projected climate data were evaluated for three time horizons representing a 30-year time window [2011–2040 (2025), 2041–2070 (2055), and 2071–2,100 (2085)]. The historical CORDEX data matching the observed climate data for the period 2008–2019 were used to evaluate the performance of the RCP4.5. Finally, the projected climate data were used as input to the calibrated APEX model to assess the effect of climate change on the crop coefficient and crop water requirement in the projected time horizons. The APEX model was also used to estimate climate change impact on the actual evapotranspiration and crop coefficient during the future time horizons using the projected climate data as input to the calibrated model (2025, 2055, and 2085).
3 Results and discussion
3.1 Farmers using irrigation learning tools increased crop yields
Supplementing the right amount of water at the right time reduced irrigation amounts and improved crop and water productivity of cabbage and carrot in both seasons. The WFD practice, on average, provided 6 and 14% higher yields than FTP for cabbage and carrots, respectively. Farmers usually perceive a direct association between more water and more yield. The tool enabled farmers to apply water more optimally throughout the stages. Farmers in the FTP treatment used more water than needed during the initial stages and lower amounts during the development and middle stages, reducing crop performance and, therefore, ETc (see Figure 3). Therefore, the results suggest that proper on-farm water management technologies can improve water use efficiency and crop growth.
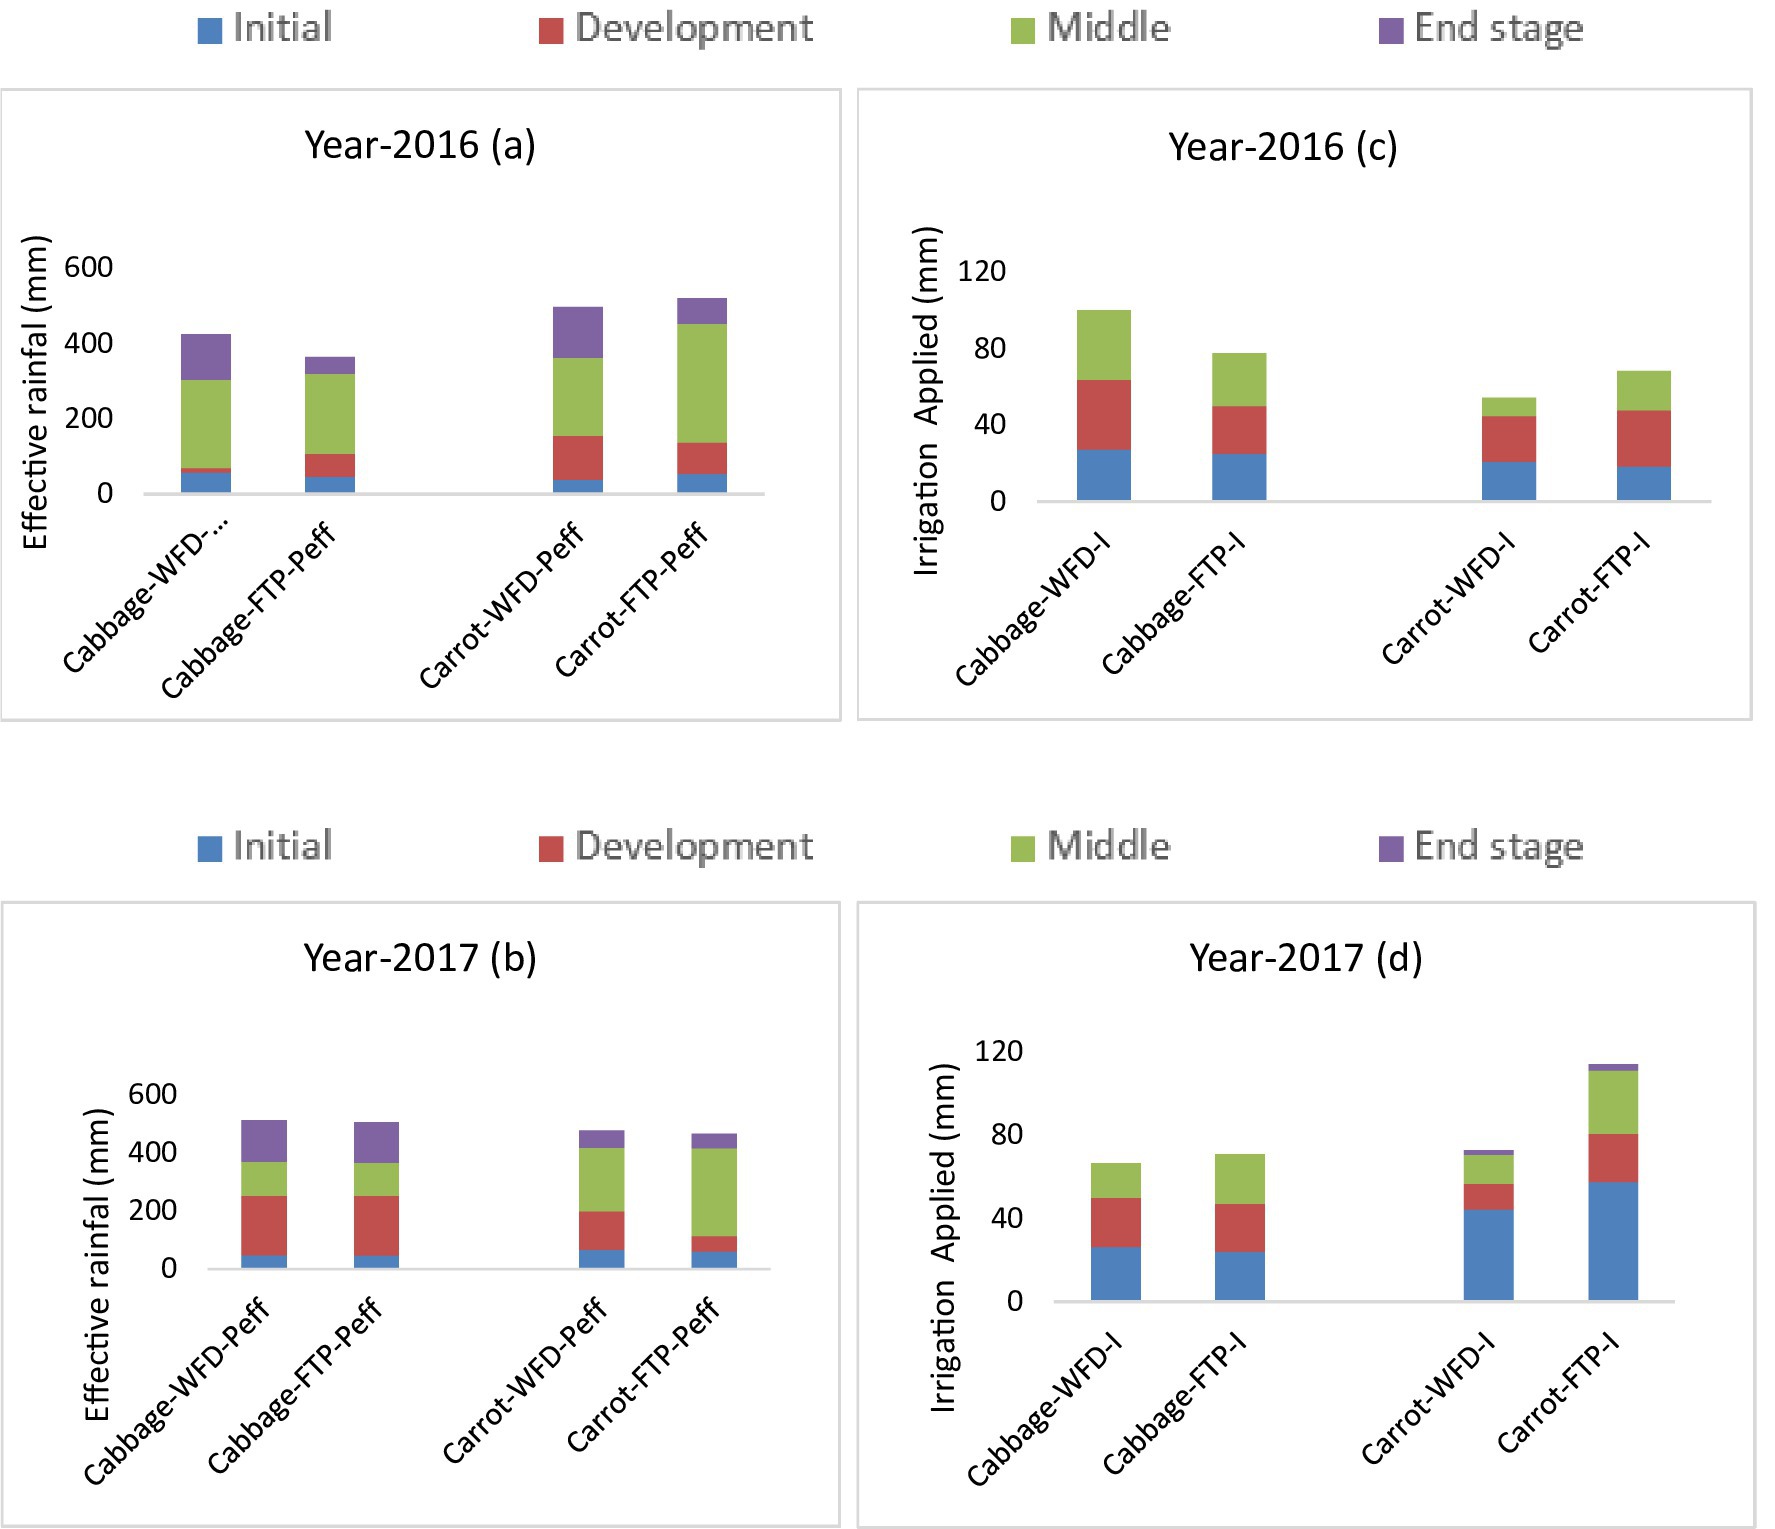
Figure 3. Estimated effective rainfall (mm) (A,B) and irrigation depth applied (mm) (C,D) for the two irrigation treatments for 2016 and 2017, respectively.
3.2 The effect of water management practices on the soil water balance components
3.2.1 Effective rainfall and irrigation
For both seasons and crops, the FTP treatment showed a higher irrigation water variability compared to the WFD treatments (p < 0.05) (Figure 3). The tool helped farmers to better manage how much water to apply as the tool indicated when the water moved below the root zone, whereas farmers who did not have the tool applied the water to the crops based on their experiences, which might have led to under- or over-irrigation.
3.2.2 Soil moisture and deep percolation
In 2016, throughout the growing seasons, the deep percolation of cabbage in the WFD and FTP was 31 mm and 20 mm, while the deep percolation of carrot in the WFD and FTP was 22 mm and 30 mm, respectively. In 2017, the corresponding values for cabbage were 29 and 23 mm, while for carrot, they were 21 and 27 mm, respectively. In 2016, the change in soil moisture for WFD and FTP treatment plots of cabbage accounted for 56 and 28 mm, and for carrot, it accounted for −6 and 11 mm, respectively. In 2017, the change in soil moisture for WFD and FTP treatment plots of cabbage accounted for 102 and 39, and for carrot, it accounted for −2 and −2 mm, respectively (Figure 4).
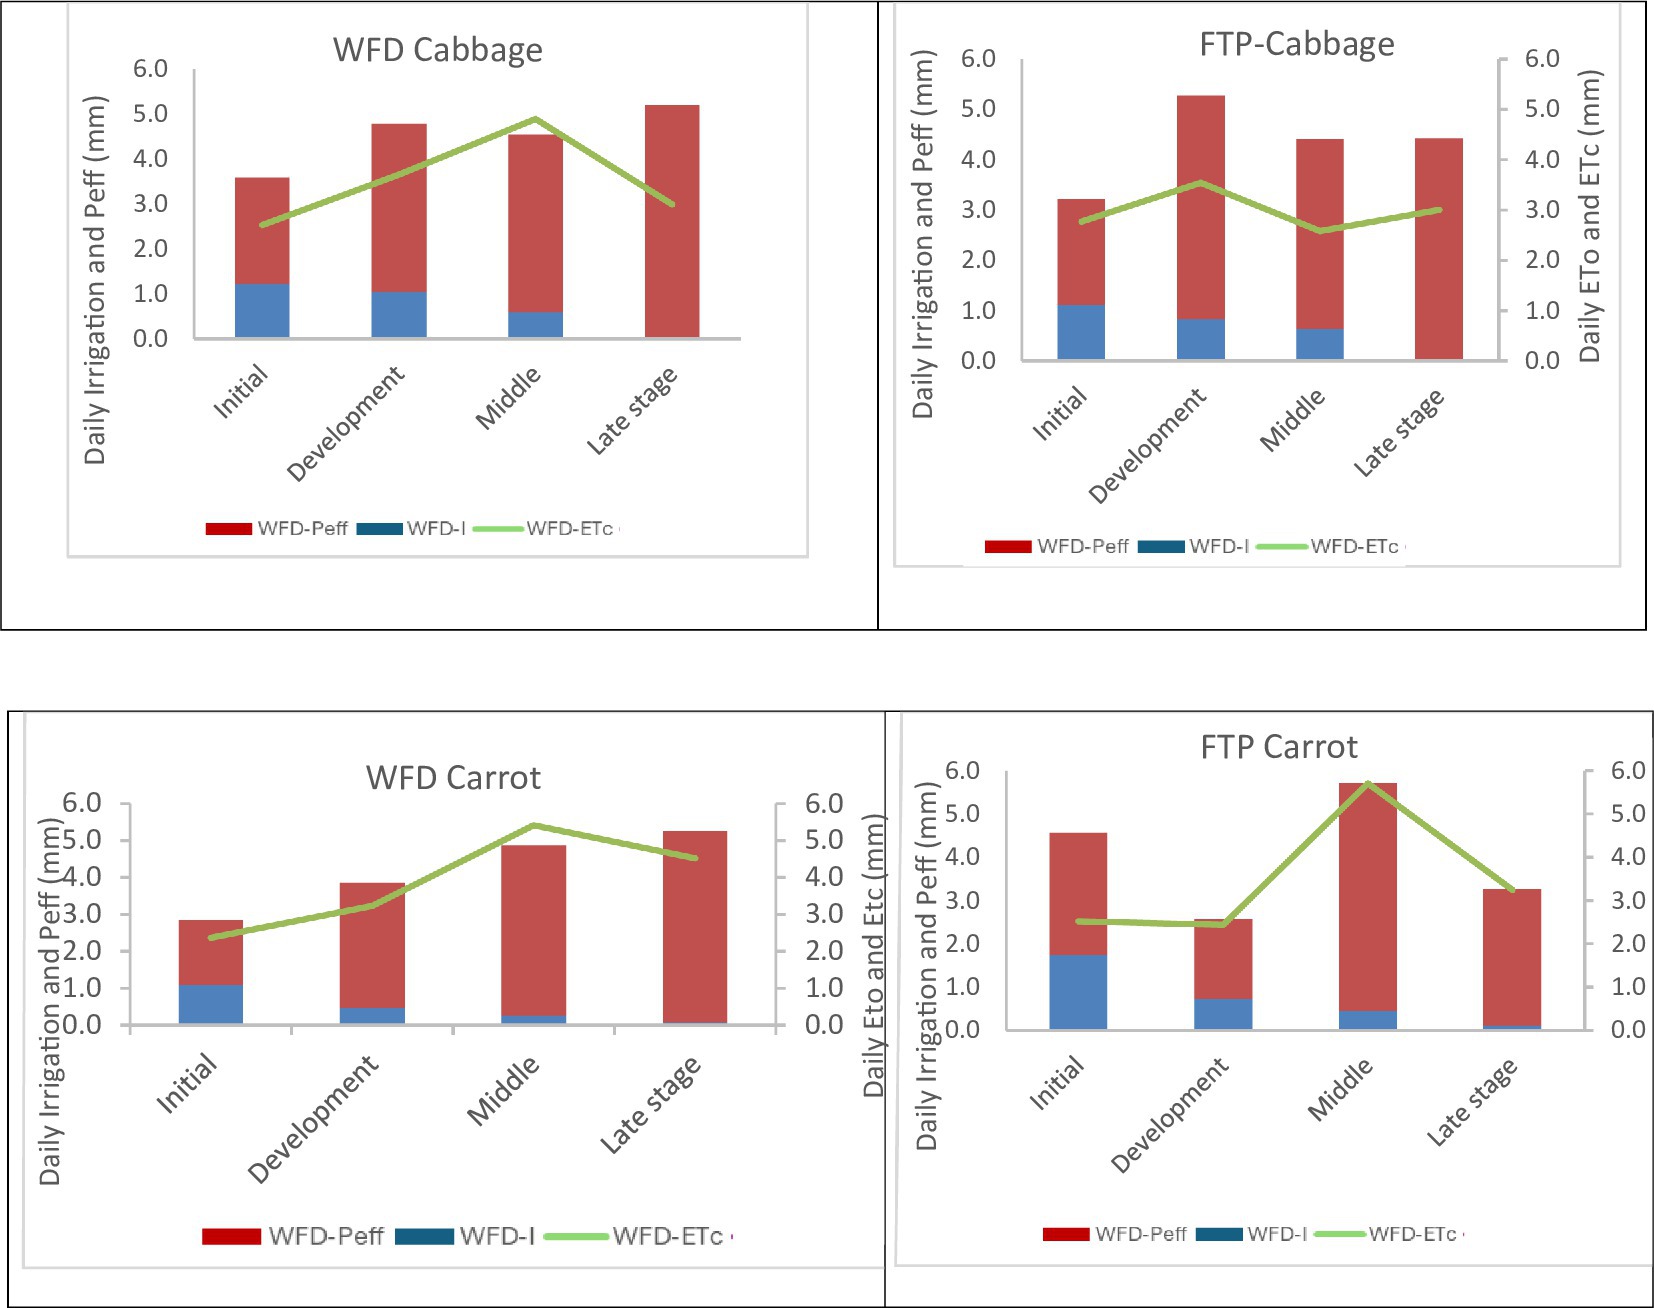
Figure 4. Water balance components under WFD and FTP treatments (Irrigation, ETc, and Peff, values).
3.2.3 Estimating crop evapotranspiration (ETc)
The actual crop evapotranspiration of cabbage and carrot was estimated for the period 2016 and 2017 using the daily climate data. The daily crop evapotranspiration was aggregated over the initial, development, mid, and late growing seasons (Figure 4). In 2016, the growing period for cabbage and carrot was 119 and 129 days, respectively, whereas, in 2017, the growing period for cabbage and carrot was 118 and 127 days, respectively. The water management practices influenced the duration of different cropping stages.
In 2016, the average amount of ETc for cabbage in the WFD and FTP treatments was 439 and 393 mm, and for carrot, it was 535 and 550 mm, respectively. In 2017, cabbage under the WFD and FTP treatment groups used 448 and 514 mm and carrot under the WFD and FTP treatment groups used 522 and 556 mm, respectively. According to Allen et al. (1998), the crop water requirement of cabbage and carrot ranges from 350 to 500 mm. For both seasons, ETc estimation indicated a similar pattern for both crop and treatment groups.
The 2-year average ETc from both crops showed a different amount of water applied along the different growing stages. The ETc was almost the same at the initial, development, and harvesting stages for both treatments and crops. However, during the middle stage, ETc in the FTP treatment was significantly lower for cabbage and significantly higher for carrot than that in the WFD treatment. This is because in the carrot plots, the soil surface is fully covered and the canopy cover is high compared with cabbage plots.
3.2.4 Crop coefficient estimation using the soil water balance
The Kc of cabbage in the WFD treatments at the initial, middle, and harvest seasons ranged from 0.66 to 0.79, 1.20 to 1.27, and 0.83 to 0.86, and in the FTP treatments, Kc ranged from 0.62 to 0.75, 1.1 to 1.26, and 0.55 to 0.86, respectively. Whereas for carrot, Kc in the WFD treatments at initial, middle, and late stages ranged from 0.69 to 0.71, 1.19 to 1.27, and 0.82 to 0.86, and Kc in the FTP treatments ranged from 0.28 to 1.05, 1.25 to 1.36, and 0.86 to 0.89, respectively (Figure 5). All the Kc values in each crop stage between the two treatments showed no significant difference (p < 0.05).
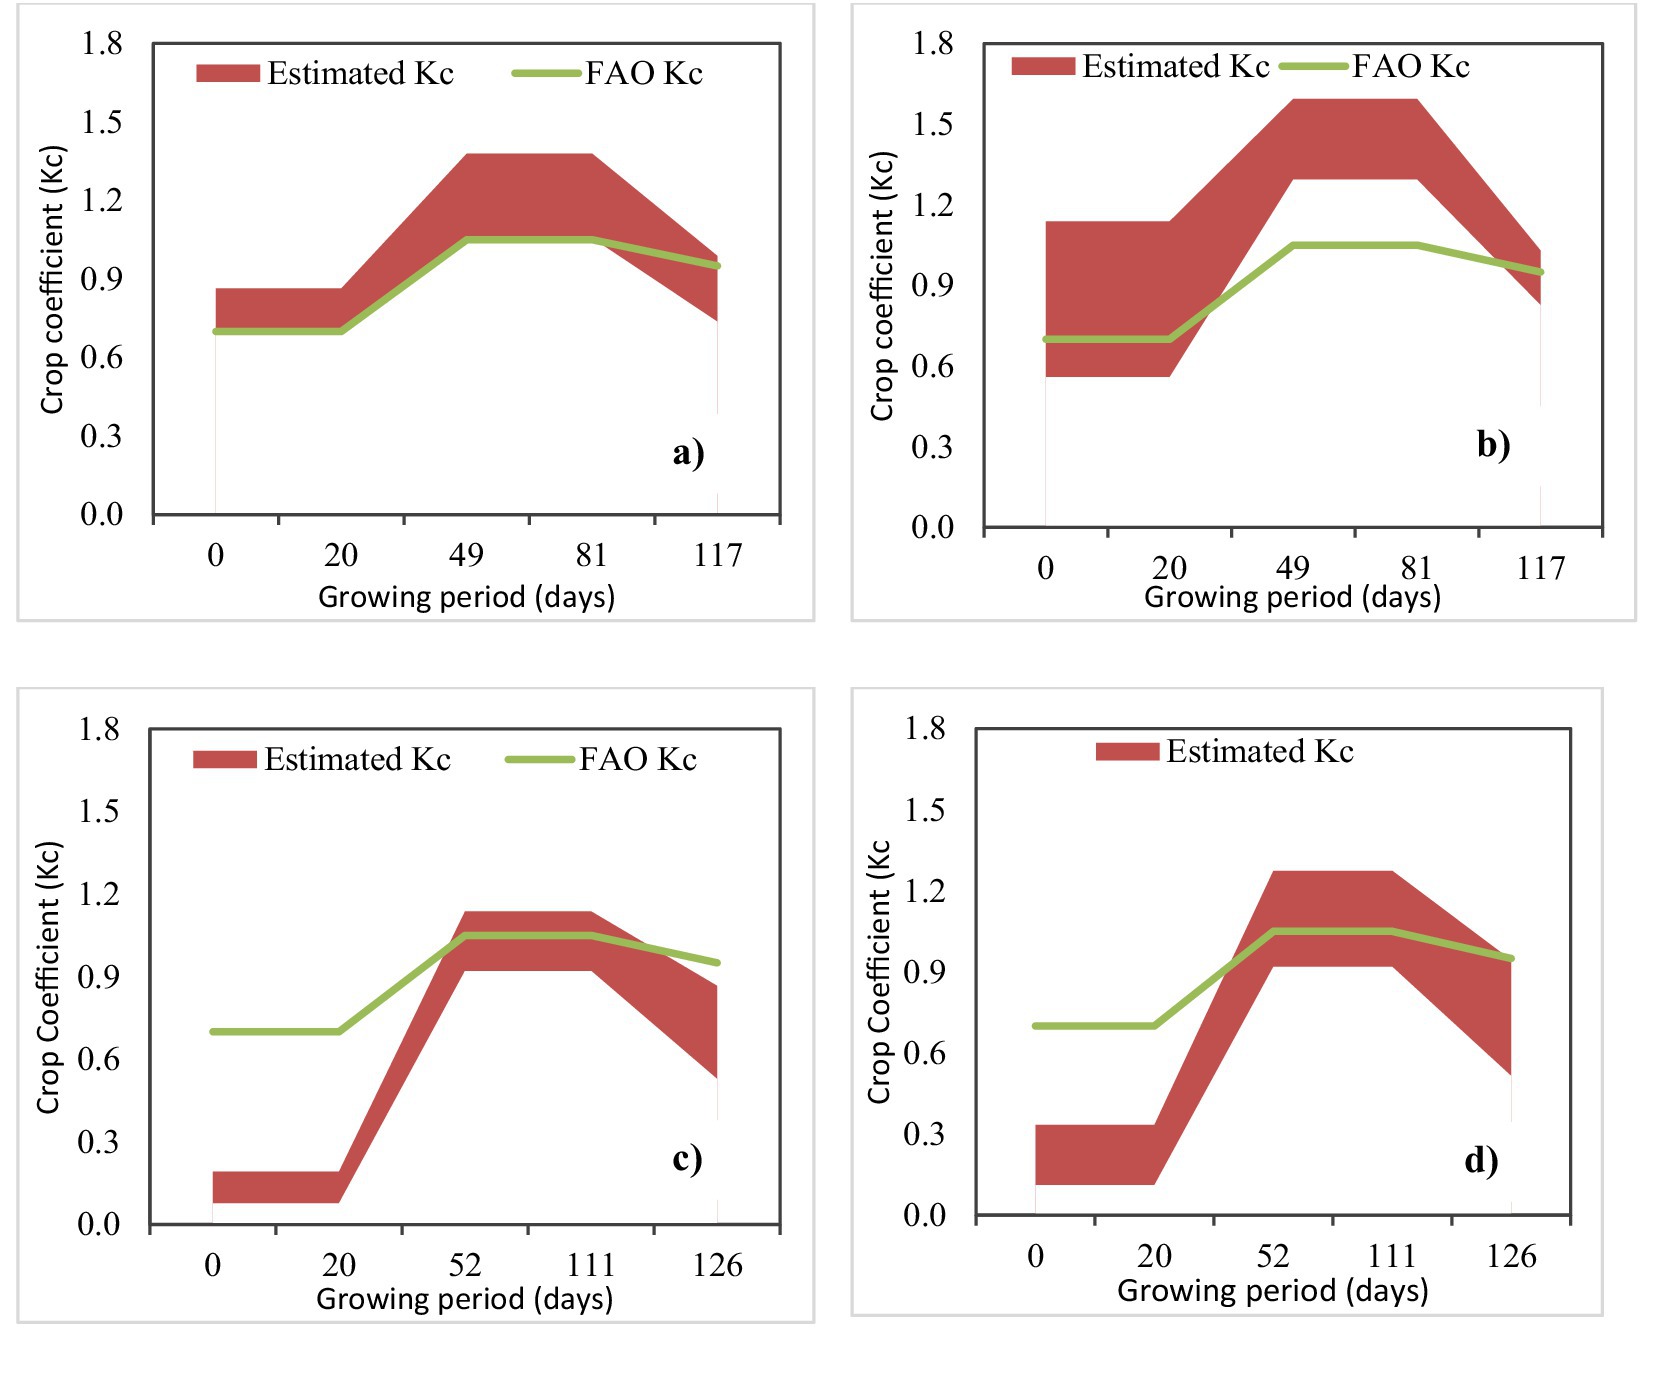
Figure 5. Comparison of the crop coefficient estimated with soil water balance and FAO regional values for: (A) cabbage WFD practice, (B) cabbage FTP practice, (C) carrot WFD practice, and (D) carrot FTP practice.
The FAO crop coefficients fell within the estimated range for some stages, crops, and treatments, especially the Kc at the initial stage for carrot, which was significantly lower in both treatments than in FAO. On the other hand, during the mid-stage of cabbage, the Kc values in the field were significantly higher than in the FAO. This reflects the need for local validation of Kc values based on climate conditions and varietal differences. The Kc values of cabbage and carrot in FAO estimations are not estimated by considering the Ethiopian local condition. FAO-estimated Kc values of cabbage and carrot reported under Allen et al. (1998) are for desert climate conditions of California, United States. Hence, according to the study by Allen et al. (1998), the Kc value of cabbage and carrot in each of their stages was the same, and the values at the initial, mid, and late seasons are 0.7, 1.05, and 0.95, respectively.
3.2.5 Crop coefficient estimation using the APEX model
The APEX model simulated yield captured the observed cabbage and carrot yield with an average root mean square error of 1.04 t/ha and 3.3 t/ha and PBIAS of 2.0 and 5.5%, respectively. The daily crop coefficient estimated as a ratio of the simulated actual and potential evaporation of the respective vegetables is plotted with the FAO-estimated regional values for both crops and practices (Figure 6). The APEX-simulated crop coefficient has captured the FAO crop coefficient pattern very well, with R-square values ranging between 0.73 and 0.90 for cabbage and between 0.77 and 0.98 for carrots (Appendix A). The APEX-simulated crop coefficient aggregated over the growing period compared with the soil water balance estimated crop coefficient captured the pattern very well with R-square ranging between 0.5 and 0.75 for cabbage and 0.66 and 0.96 for carrot. The crop coefficient estimated with the APEX model indicated a maximum value of one, and it is observed when there is enough soil moisture after irrigation or rainfall to meet the potential evaporation (i.e., when actual evaporation equals potential evaporation of the respective vegetables). However, the Kc reported under FAO is a fraction of a reference crop’s potential evaporation (i.e., potential evaporation of a hypothetical grass reference crop with an assumed crop height of 0.12 m, a fixed surface resistance of 70 s/m, and an albedo of 0.23) and crop’s actual evapotranspiration. The APEX-simulated crop coefficient was sensitive for irrigation applications and indicated a larger difference, especially at the initial stage of crop growth due to differences in canopy cover. The simulated crop coefficient for carrot during the late stage indicated a significant difference from the FAO generic crop coefficient curve (Appendix A). This is due to senescence processes, or deterioration of carrot leaves with age, where the leaf area decreases significantly after mid-maturity, leading to a divergence from a typical FAO crop coefficient curve.
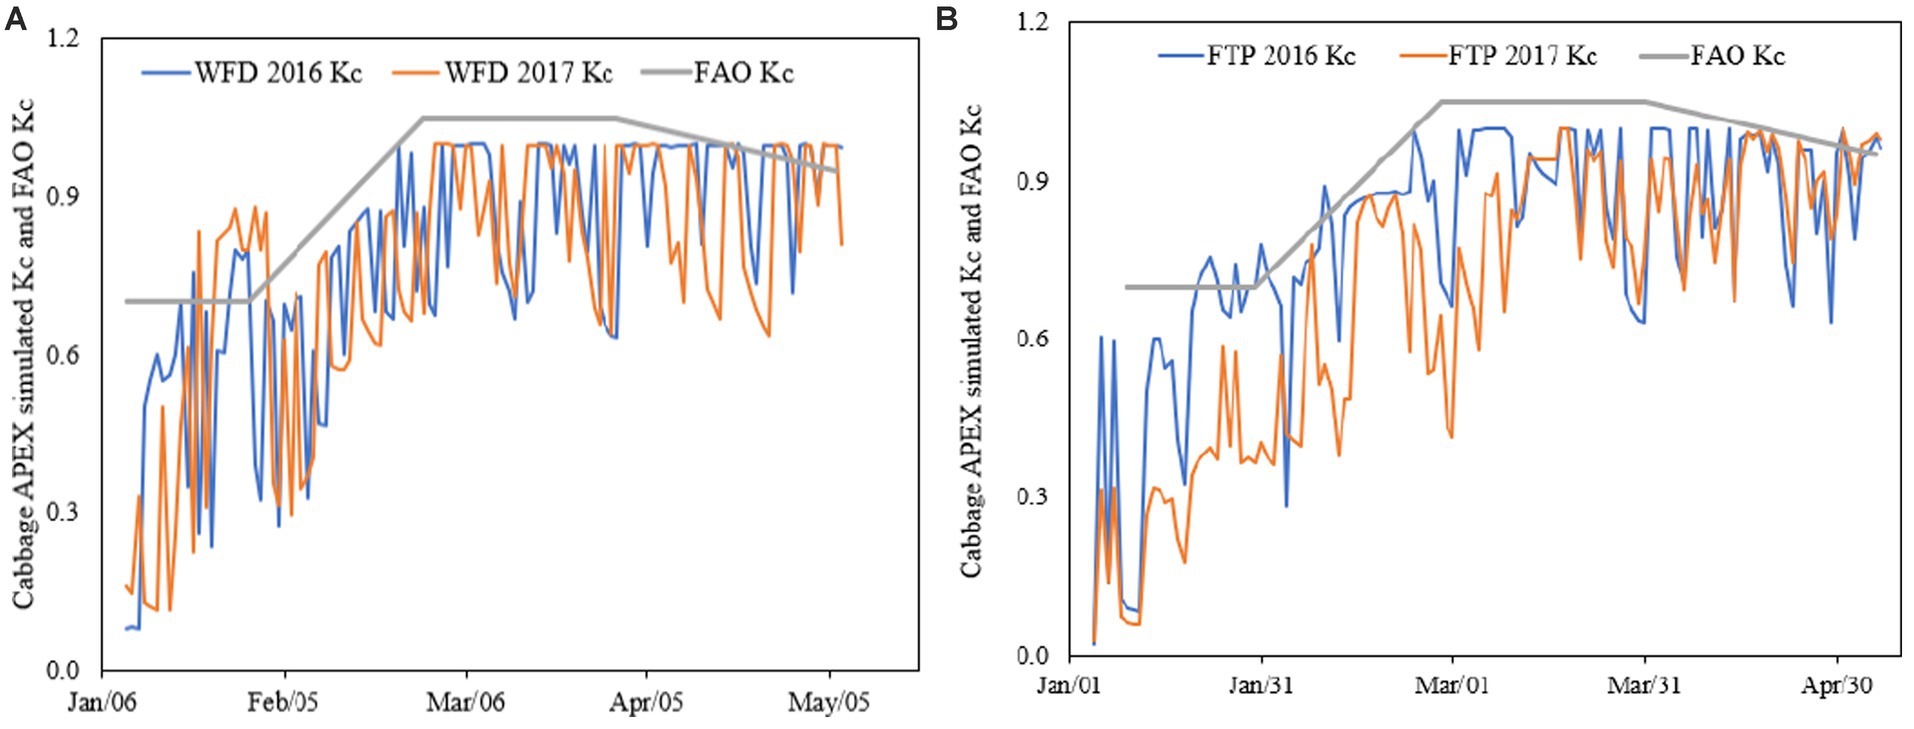
Figure 6. Agricultural Policy Environmental eXtender (APEX)-simulated crop coefficient as a ratio of the actual and potential evapotranspiration versus FAO Kc. (A) Simulated cabbage Kc of FTP practice for 2016 and 2017 vs. FAO Kc and (B) simulated cabbage Kc of WFD practice for 2016 and 2017 vs. FAO Kc.
3.3 Effect of climate change on Kc
3.3.1 Predicted rainfall and minimum and maximum temperatures for future time horizons
The projected climate for the three time horizons was compared with the observed temperature (baseline period; 2008 to 2019) (Figures 7A,B). In all the future time horizons, the projected minimum temperature showed an increasing trend during the dry season and the main rainfall season (June to October) compared to the baseline period. The average annual minimum temperature is expected to increase by 23, 31, and 34% from the baseline in 2025, 2055, and 2085, respectively. The maximum temperature will increase during the dry season and decrease during the rainy season (Figure 7B). The climate data analyzed during the cabbage and carrot growing period indicated that maximum and minimum temperatures are expected to increase during the future time horizon. The minimum temperature is expected to increase by 1.5% in 2025, 6.5% in 2055s, and 7.8% in 2085. The increasing minimum temperature coupled with the increasing maximum temperature during the dry season will significantly affect the evaporation and crop water requirement.
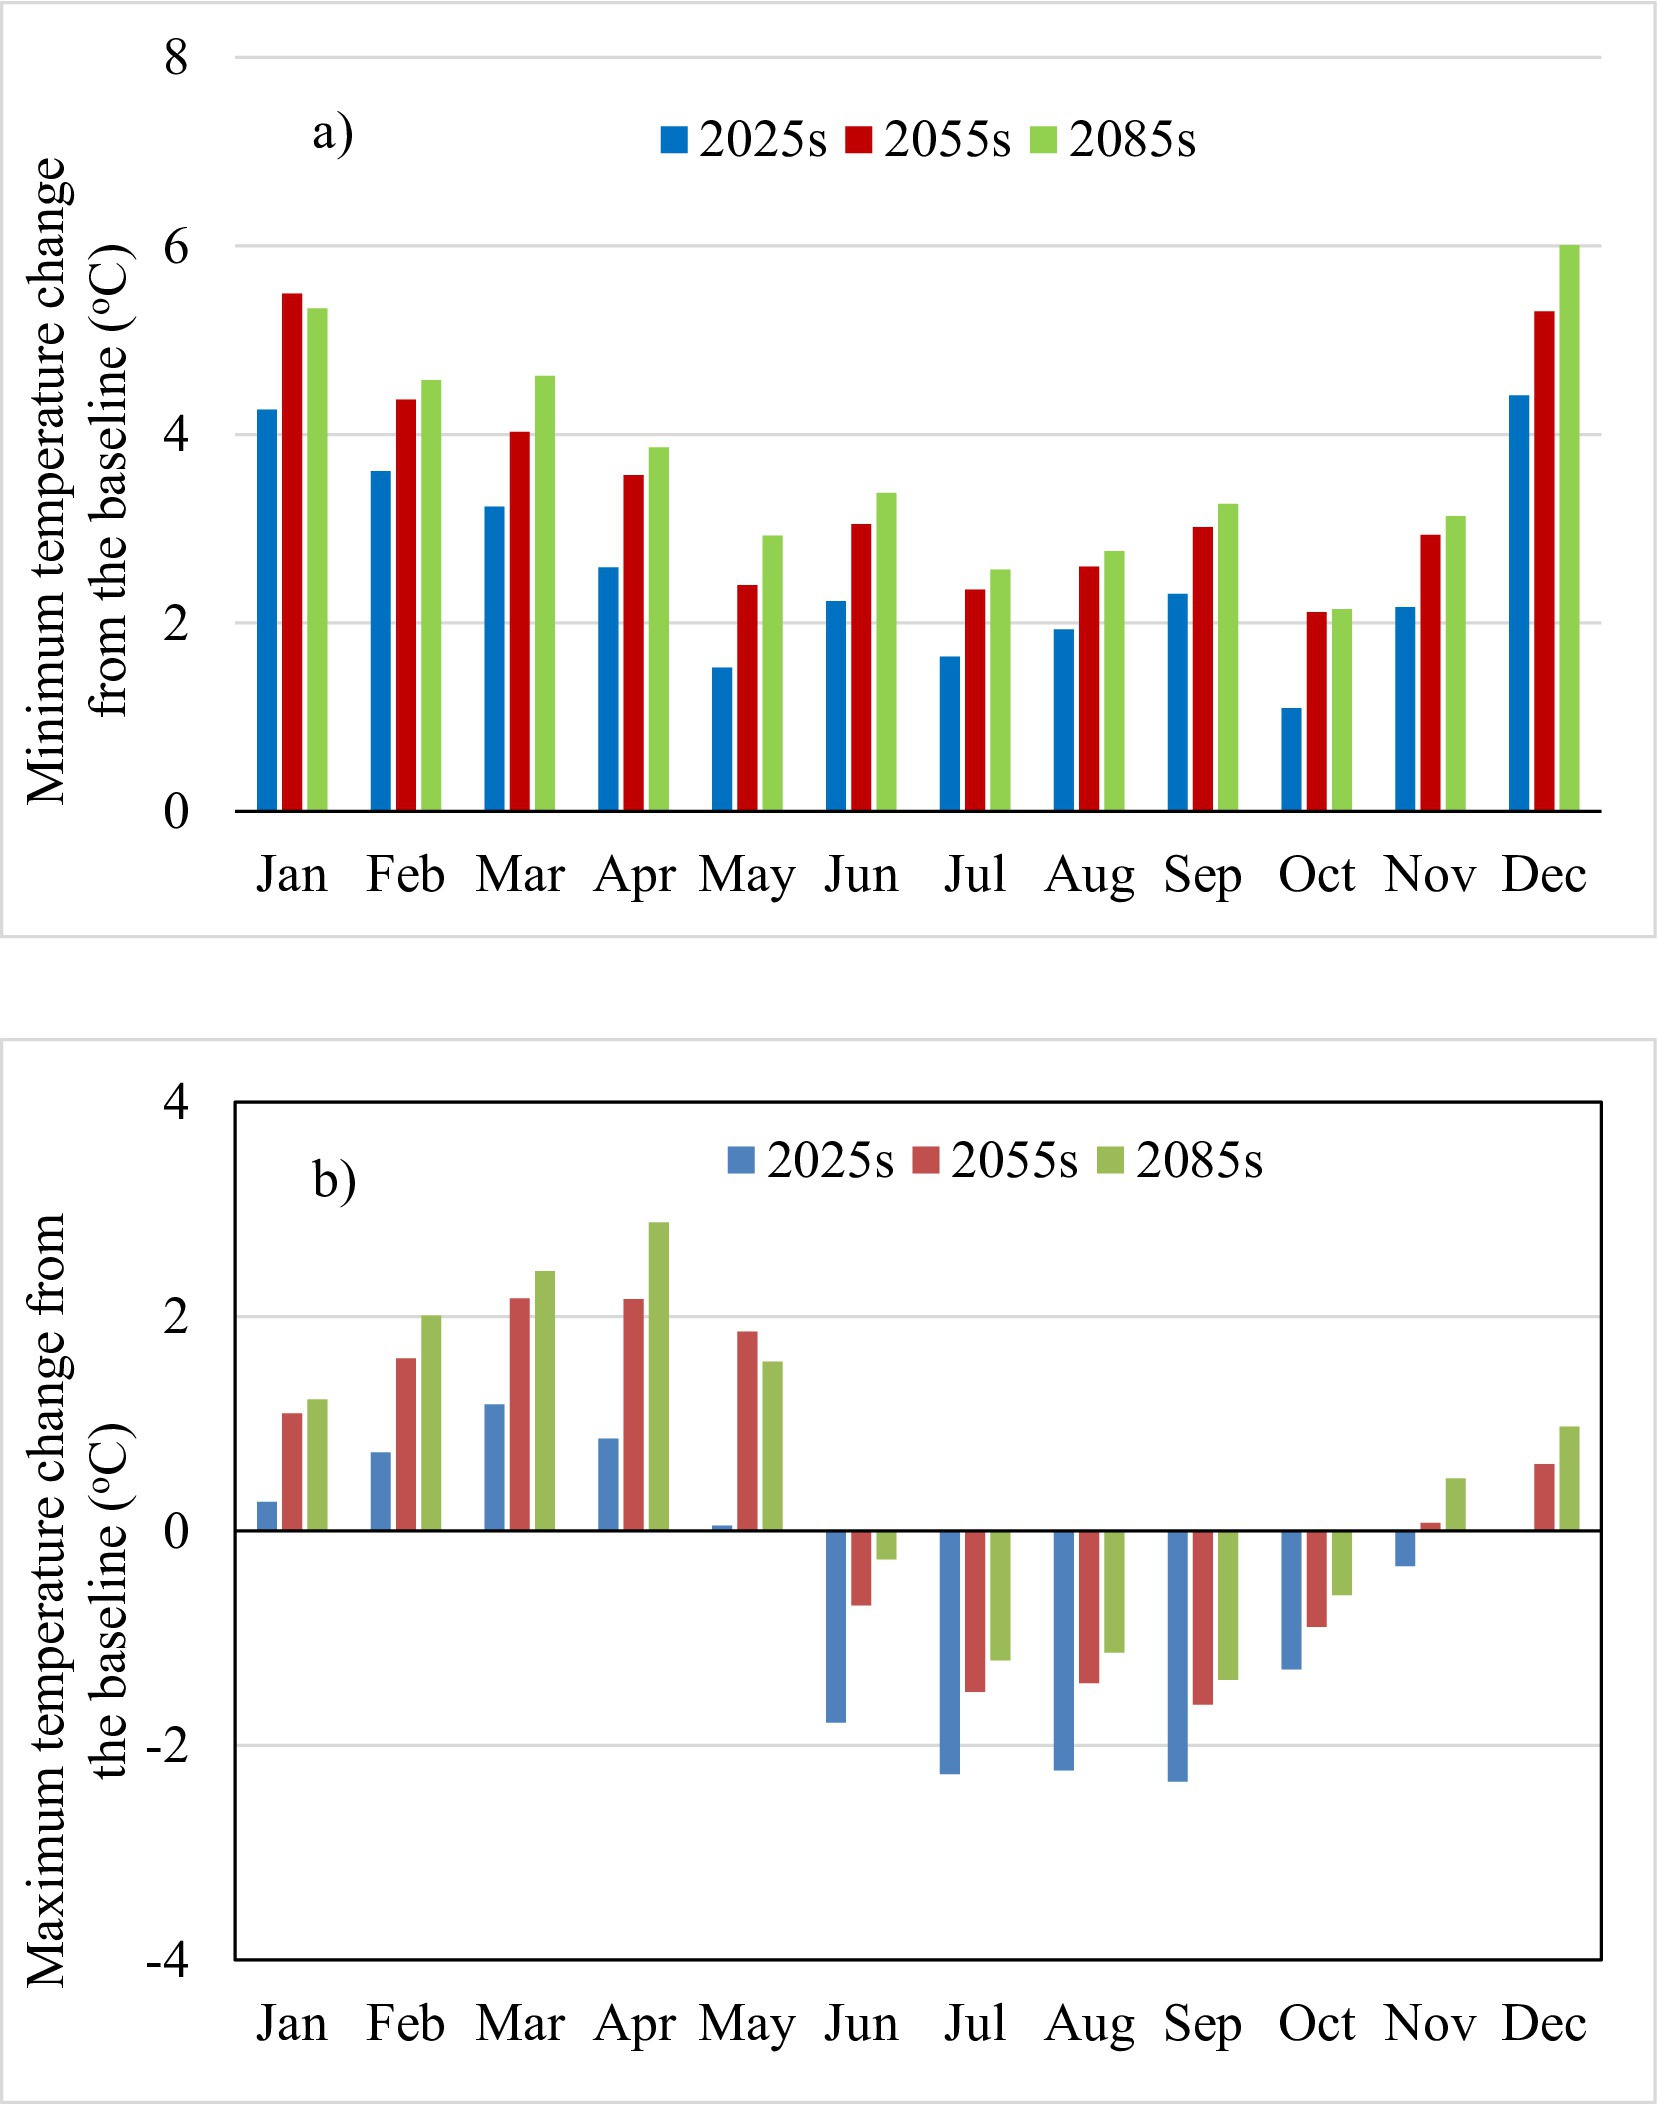
Figure 7. Minimum and maximum temperature change of the project time horizons from the baseline period: (A) monthly average minimum temperature changes from the baseline period and (B) monthly average maximum temperature changes from the baseline period.
The average annual projected rainfall is expected to increase by 9.1, 0.7, and 1.2% from the baseline period in 2025, 2055, and 2085, respectively (Figure 8). The monthly average rainfall is expected to increase in January, March, June, and November for the future time horizons and is expected to decrease in February, April, July, October, and December from the baseline period. Overall, the dry season rainfall (November to May) is expected to decrease across all time horizons. The projected rainfall of the dry season is expected to decrease by 20, 1.2, and 3.8% compared to the baseline period in 2025, 2055, and 2085, respectively.
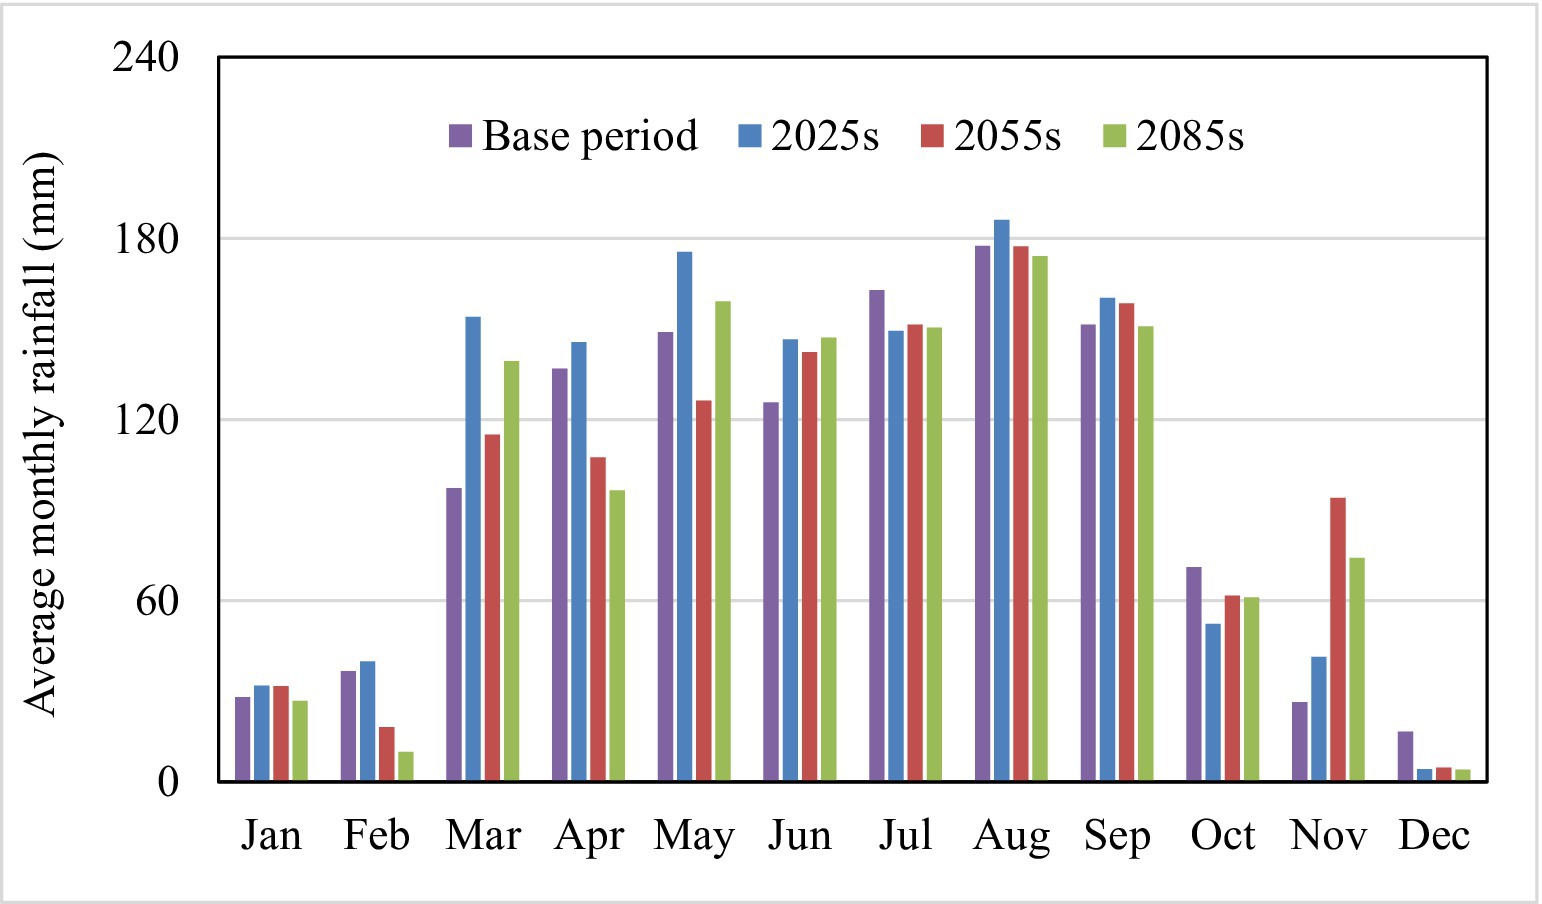
Figure 8. Average monthly rainfall for the baseline period and future time horizons.
Temperature increase together with the rainfall reduction in the future time horizons will likely increase the crop water demand and therefore the need for supplementary irrigation during the dry season.
3.3.2 Effect of climate change on crop coefficient
The effect of climate change on evapotranspiration and crop coefficient was evaluated using the calibrated APEX model for the baseline period. The result indicated that under climate change scenarios, the growing seasons’ potential evapotranspiration is expected to increase by 2.5, 5.1, and 6.0% in 2025, 2055, and 2085 from the baseline period, respectively (Figure 8). As the potential evaporation increases during the future time horizon, the water demand in each of the cropping stages (at initial, development, mid, and late seasons) will increase.
The crop coefficient for cabbage and carrot estimated as a fraction of simulated potential and actual evaporation is shown in Figures 9, 10, respectively. The project time horizon’s simulated crop coefficient indicated a similar trend with the simulated baseline crop coefficient with R-square ranging between 0.51 and 0.64 for cabbage and between 0.51 and 0.77 for carrot. The simulated crop coefficient indicated a higher variation in 2085 with 19% for cabbage and 24% for carrot, while the 2025 period simulated Kc indicated the least coefficient of variation (16 and 21% for cabbage and carrot, respectively).
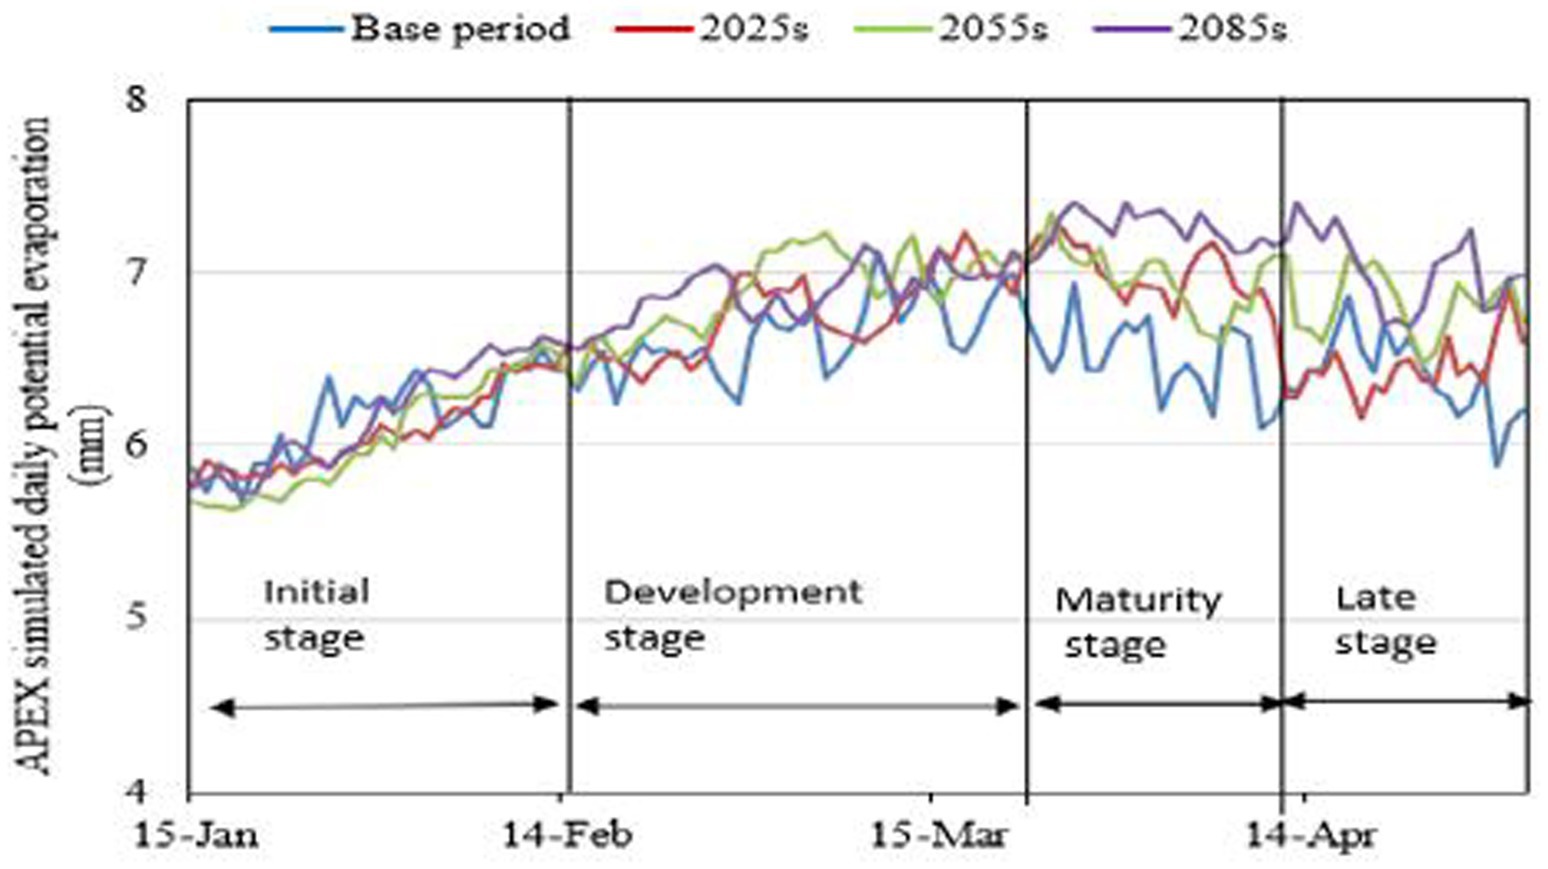
Figure 9. Daily potential evaporation during the cabbage growing period for the baseline and project time horizons.
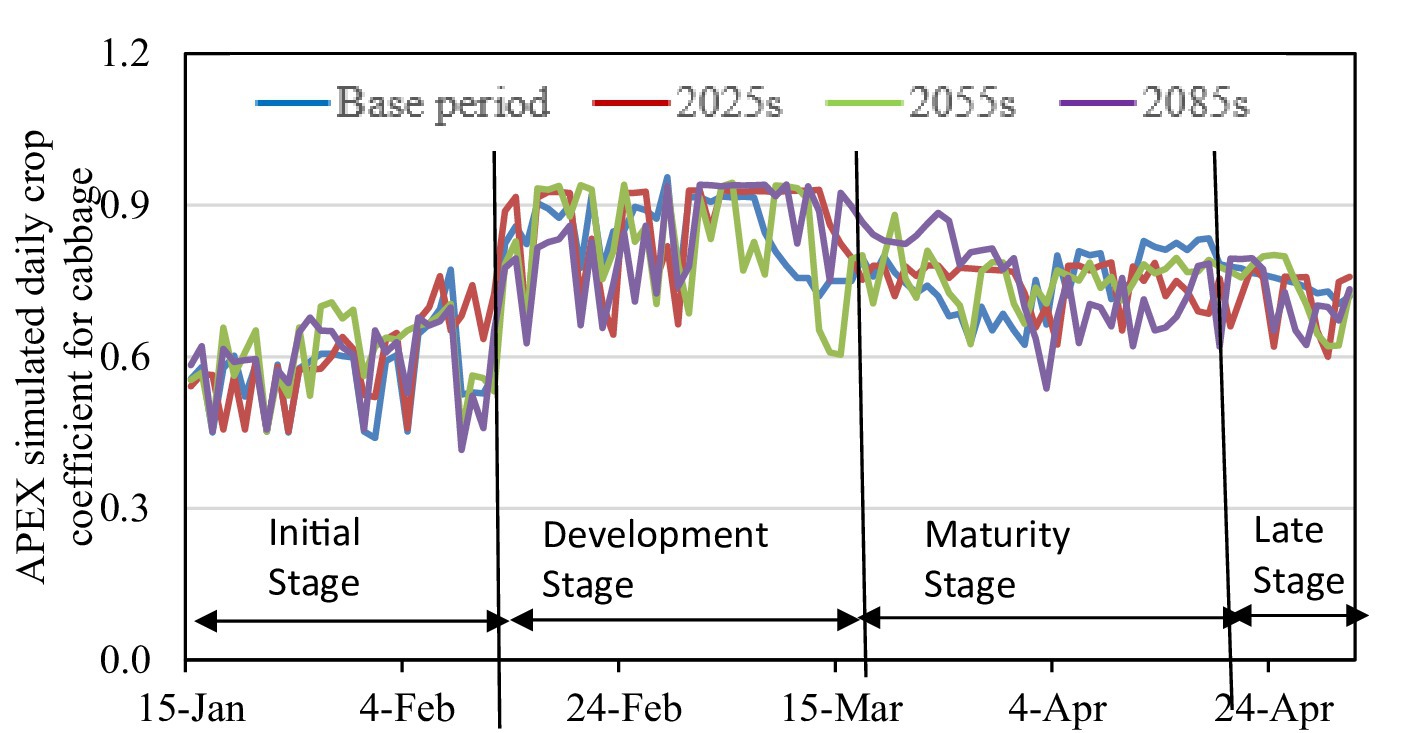
Figure 10. Agricultural Policy Environmental eXtender (APEX) model simulated average daily crop coefficient of cabbage for the baseline and project time horizons.
The projected climate parameters (minimum and maximum temperatures and rainfall) will have an immense impact on the future ETc and Kc (Figure 11). Hence, wise utilization and conservation of water resources will become increasingly important to avoid the risk of water scarcity for food production.
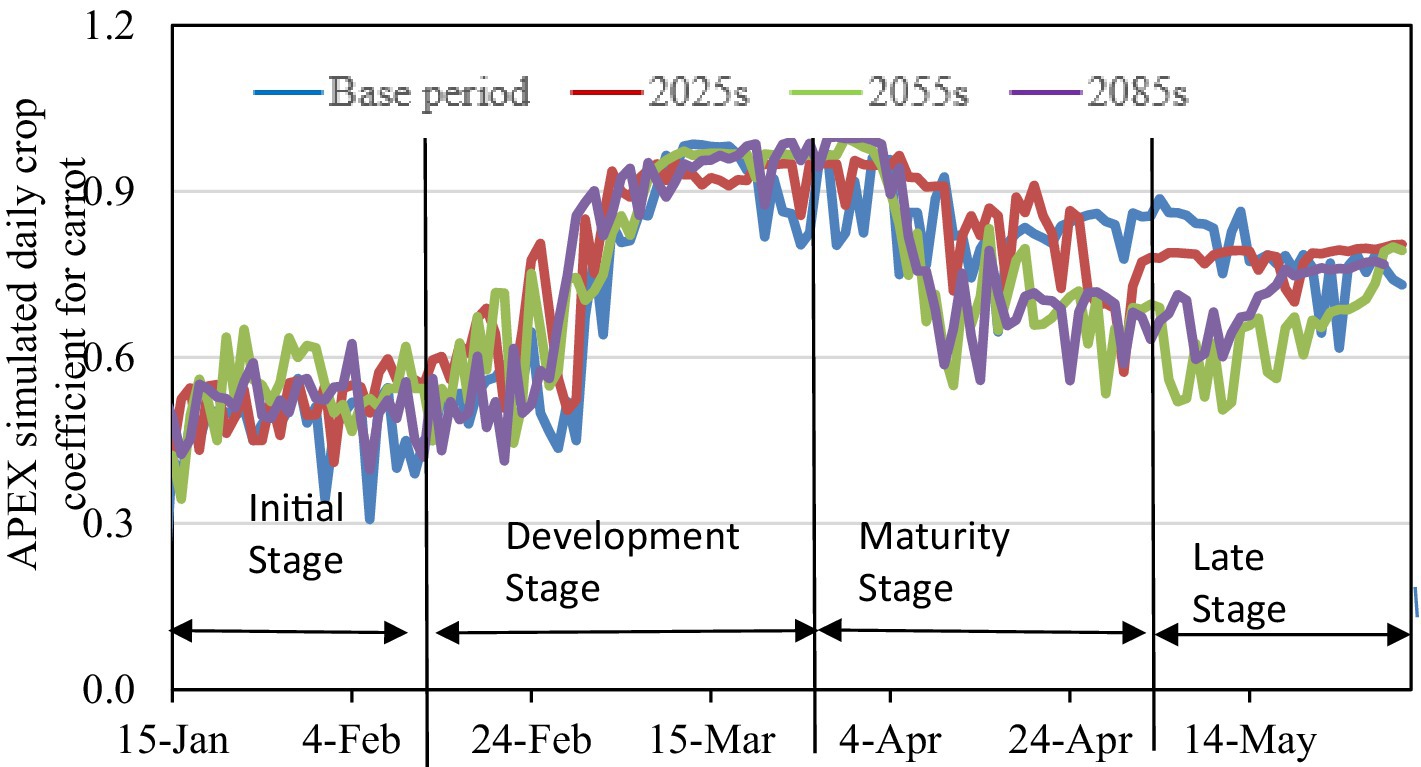
Figure 11. Agricultural Policy Environmental eXtender (APEX) model simulated the average daily crop coefficient of carrot for the baseline and project time horizons.
4 Conclusion
This study mainly evaluated the effect of climate change scenarios using field data, a biophysical model, and projected climate data. The Kc value estimated with the soil water balance and biophysical model (APEX) indicated a significant difference from the FAO regional values. This indicates that a local climate-based Kc value is needed for local climate-based crop water demand estimation. The ETc and Kc obtained at Lemo can be used for further studies related to on-farm water management, such as irrigation scheduling and deficit irrigation design and planning. The ETc and Kc of the crop depend on the specific crop characteristics, water needs, agronomic practices, and locally determined ETc and Kc values, which help with appropriate water management and irrigation planning decisions. Therefore, using locally determined Kc values, stakeholders working in this area can estimate the right amount of water for the crops they want to grow. In addition, by using simple on-farm water management technologies, such as the WFD, and by determining the right amount of water for each growth stage using the right crop characteristics (kc), water resources can be optimized. Furthermore, climate projections indicate an increasing ETc trend due to the increasing temperature trend. Hence, in the future, the expected crop water requirement in the region is expected to increase and should be taken into account as the country aims to expand its irrigable land to enhance food and nutrition security. Especially as water resources are expected to decline under future climate scenarios, irrigation planning together with on-farm water management tools will be crucial to reduce potential risks of water scarcity in the region. This study does not include the impacts of physiological forcing factors (specifically, it does not consider the closure of plant stomata in response to increasing carbon dioxide (CO2) concentrations). This closure may reduce water loss in plants, and future research on this topic will help to understand these impacts better.
Data availability statement
The raw data supporting the conclusions of this article will be made available by the authors, without undue reservation.
Author contributions
DT: Conceptualization, Data curation, Formal analysis, Investigation, Methodology, Software, Validation, Visualization, Writing – original draft, Writing – review & editing. PS: Conceptualization, Funding acquisition, Investigation, Project administration, Resources, Supervision, Visualization, Writing – review & editing. AW: Conceptualization, Data curation, Formal analysis, Funding acquisition, Investigation, Methodology, Project administration, Resources, Software, Supervision, Validation, Visualization, Writing – review & editing. NL: Funding acquisition, Investigation, Project administration, Resources, Supervision, Visualization, Writing – review & editing.
Funding
The author(s) declare financial support was received for the research, authorship, and/or publication of this article. This study was supported by the American people provided to the Feed the Future Innovation Lab for Small-Scale Irrigation through the United States Agency for International Development (USAID). Program activities are funded by the United States Agency for International Development (USAID) under Cooperative Agreement No. AID-OAA A-13-00055.
Acknowledgments
We would like to thank USAID. This work was carried out with support from the CGIAR Science Program on Sustainable Farming. We would like to thank all funders who supported this research through their contributions to the CGIAR Trust Fund.
Conflict of interest
The authors declare that the research was conducted in the absence of any commercial or financial relationships that could be construed as a potential conflict of interest.
Publisher’s note
All claims expressed in this article are solely those of the authors and do not necessarily represent those of their affiliated organizations, or those of the publisher, the editors and the reviewers. Any product that may be evaluated in this article, or claim that may be made by its manufacturer, is not guaranteed or endorsed by the publisher.
Supplementary material
The Supplementary material for this article can be found online at: https://www.frontiersin.org/articles/10.3389/frwa.2025.1355154/full#supplementary-material
References
Acharjee, T. K., Ludwig, F., van Halsema, G., Hellegers, P., and Supit, I. (2017). Future changes in water requirements of Boro rice in the face of climate change in North-West Bangladesh. Agric. Water Manag. 194, 172–183. doi: 10.1016/j.agwat.2017.09.008
Agricultural Transformation Agency [ATA] (2014). Transforming Agriculture in Ethiopia, annual report. Ethiopia: Addis Abeba.
Allen, R. G., Pereira, L. S., Raes, D., and Smith, M. (1998). Crop evapotranspiration-Guidelines for computing crop water requirements-FAO Irrigation and drainage paper 56, vol. 300. Rome: FAO, D05109.
Anose, F. A., Beketie, K. T., Zeleke, T. T., Ayal, D. Y., and Feyisa, G. L. (2021). Spatio-temporal hydro-climate variability in Omo-Gibe river Basin, Ethiopia. Clim. Serv. 24:100277.
Arnold, J., Williams, J. R., Srinivasan, R., King, K. W., and Griggs, R. H. (1994). SWAT (soil and water assessment tool) grassland. Temple, TX, USA: Soil and Water Research Laboratory, USDA, Agricultural Research Service.
Awulachew, S.B., Yilma, A.D., Loulseged, M., Loiskandl, W., Ayana, M., and Alamirew, T. (2007) Water resources and irrigation development in Ethiopia Iwmi. Sri Lanka: International Water Management Institute (IWMI).
Belew, T., and Derbew, F. (2015) A review on production status and consumption pattern of vegetable in Ethiopia.
Brekke, L. D. (2009). Climate change and water resources management: a federal perspective. Darby, PA, USA: Diane Publishing.
Chowdhury, S., Al-Zahrani, M., and Abbas, A. (2016). Implications of climate change on crop water requirements in arid region: an example of Al-Jouf, Saudi Arabia. J. King Saud Univ. Eng. Sci. 28, 21–31. doi: 10.1016/j.jksues.2013.11.001
Degefu, M. A., and Bewket, W. (2014). Variability and trends in rainfall amount and extreme event indices in the Omo-Ghibe River Basin, Ethiopia. Reg Environ. Change. 14, 799–810. doi: 10.1007/s10113-013-0538-z
Desalegn, T., Zenebe, A., Minh, T., Eva, L., and Petra, S., (2020). Enhancing water and potato productivity in Bakello Irrigation scheme, Basona Worana District, Ethiopia
Eyasu, Y., Atinkut, M., Tesfa-alem, G., Daniel, T., and Ermias, A. (2015). Multi reservoir operation and challenges of the Omo River Basin: part II: potential assessment of flood-based farming on lower Omo Ghibe Basin. Mekele, Ethiopia: Spate Irrigation Network.
Gao, Y., Sarker, S., Sarker, T., and Leta, O. T. (2022). Analyzing the critical locations in response of constructed and planned dams on the Mekong River Basin for environmental integrity. Environ. Res. Commun. 4:101001. doi: 10.1088/2515-7620/ac9459
Gassman, P. W., Abraham, J., Hauck, L., Saleh, A., and Keplinger, K. (1998). Simulation of nutrient losses from chicken litter applications in east central Texas with APEX and SWAT, 2001 ASAE Annual Meeting : American Society of Agricultural and Biological Engineers, 1.
Godard, V., Tucker, G. E., Burch, F. G., Burbank, D. W., Bookhagen, B., Godard, V., et al. (2013). Frequency-dependent landscape response to climatic forcing. Geophys. Res. Lett. 40, 859–863. doi: 10.1002/grl.50253
Gregory, P. J., Ingram, J. S., and Brklacich, M. (2005). Climate change and food security. Philos. Trans. R. Soc. B Biol. Sci. 360, 2139–2148. doi: 10.1098/rstb.2005.1745
Irmak, S. (2009) Magnitude and trends of reference evapotranspiration rates in South Central Nebraska: daily monthly, growing season total, and annual total. Lincoln, NE: University of Nebraska. Available at: https://extensionpubs.unl.edu/publication/ec765/2009/pdf/view/ec765-2009.pdf
Jaweso, D., Abate, B., Bauwe, A., and Lennartz, B. (2019). Hydro-meteorological trends in the upper Omo-Ghibe river basin, Ethiopia. Water, 11:1951. doi: 10.3390/w11091951
Kuria, A., Lamond, G., Pagella, T., Gebrekirstos, A., Hadgu, K., and Sinclair, F.L. (2014) Local knowledge of farmers on opportunities and constraints to sustainable intensification of crop-livestock-trees mixed systems in Lemo Woreda, SNNPR Region, Ethiopian highlands.
Mekuria, W., Girma, G., Haileslassie, A., Tegegne, D., and Tamiru, H. A. (2024). Participatory planning to conserve freshwater ecosystems in the Rift Valley Lakes Basin, Ethiopia. J. Nat. Conser. 78:126564. doi: 10.1016/j.jnc.2024.126564
Mekuria, W., and Tegegne, D. (2023). Water harvesting. Encyclopedia of Soils in the Environment. 5, 593–607.
Meshesha, Y., and Bekele, A. M. (2019). Challenges and opportunities for implementation of Integrated Water Resource Management in Omo-Gibe Basin, Ethiopia. J. Ecol. Nat. Environ. 11, 84–97.
Nunes, N., and Celili, M. (2008). Color Atlas of postharvest quality of fruits and vegetables. Hoboken, NJ, USA: Blackwell Publishing.
Passarelli, S., Mekonnen, D., Bryan, E., and Ringler, C. (2018). Evaluating the pathways from small-scale irrigation to dietary diversity: evidence from Ethiopia and Tanzania. Food Sec. 10, 981–997. doi: 10.1007/s12571-018-0812-5
Patz, J. A., Campbell-Lendrum, D., Holloway, T., and Foley, J. A. (2005). Impact of regional climate change on human health. Nature 438, 310–317. doi: 10.1038/nature04188
Saleh, A., and Gallego, O. (2007). Application of SWAT and APEX using the SWAPP (SWAT-APEX) program for the upper north Bosque River watershed in Texas. Trans. ASABE 50, 1177–1187. doi: 10.13031/2013.23632
Sarker, S., Sarker, T., Leta, O. T., Raihan, S. U., Khan, I., and Ahmed, N. (2023). Understanding the Planform Complexity and Morphodynamic Properties of Brahmaputra River in Bangladesh: Protection and Exploitation of Riparian Areas. Water 15:1384. doi: 10.3390/w15071384
Schmitter, P., Amare Haileslassie, A., Desalegn, Y., Chali, A., Langan, S., and Barron, J. (2017). “Improving on-farm water management by introducing wetting-front detector tools to smallholder farms in Ethiopia” in LIVES Working Paper 28 (Nairobi, Kenya: International Livestock Research Institute (ILRI)).
Schmitter, P.S., Tegegne, D., Adie, A., Baudron, F., Blümmel, M., Lefore, N., et al. (2016) Evaluation of suitable water lifting and on-farm water management technologies for the irrigation of vegetables and fodder in Lemo district, Ethiopia.
Shenkut, A., Tesfaye, K., and Abegaz, F. (2013). Determination of water requirement and crop coefficient for sorghum (Sorghum bicolor L.) at Melkassa, Ethiopia. Sci. Technol. Arts Res. J. 2, 16–24. doi: 10.4314/star.v2i3.98717
Singhal, A., Jaseem, M., Divya,, Sarker, S., Prajapati, P., Singh, A., et al. (2023). Identifying Potential Locations of Hydrologic Monitoring Stations Based on Topographical and Hydrological Information. Water Resour. Manag. 38, 369–384. doi: 10.1007/s11269-023-03675-x
Stirzaker, R. (2003). When to turn the water off: scheduling micro-irrigation with a wetting front detector. Irrig. Sci. 22, 177–185.
Teferi, E., O’Donnell, G., Kassawmar, T., Mersha, B. D., and Ayele, G. T. (2023). Enhanced soil moisture retrieval through integrating satellite data with pedotransfer functions in a complex landscape of Ethiopia. Water 15:3396. doi: 10.3390/w15193396
Tegegne, D., Damtie, M. T., and Shumye, A. (2024). Assessment of irrigation performance trends using selected comparative indicators over consecutive periods: a case study of the Koga Irrigation Scheme in the Amhara region, Ethiopia. Irrigat. Drainage. 12, 1–11. doi: 10.1002/ird.3021
Teichmann, C., Jacob, D., Remedio, A. R., Remke, T., Buntemeyer, L., Hoffmann, P., et al. (2020). Assessing mean climate change signals in the global CORDEX-CORE ensemble. Clim. Dyn. 57, 1269–1292. doi: 10.1007/s00382-020-05494-x
Tiruye, A. E., Asres, B. S., Schmitter, P., Tegegne, D., Zimale, F. A., and Tilahun, S. A. (2022). Yield, water productivity and nutrient balances under different water management technologies of irrigated wheat in Ethiopia. PLOS Water 1:60. doi: 10.1371/journal.pwat.0000060
Uusiku, N. P., Oelofse, A., Duodu, K. G., Bester, M. J., and Faber, M. (2010). Nutritional value of leafy vegetables of sub-Saharan Africa and their potential contribution to human health: A review. J. Food Compos. Anal. 23, 499–509. doi: 10.1016/j.jfca.2010.05.002
Wang, X., Kannan, N., Santhi, C., Potter, S., Williams, J., and Arnold, J. (2011). Integrating APEX output for cultivated cropland with SWAT simulation for regional modeling. Trans. ASABE 54, 1281–1298. doi: 10.13031/2013.39031
Williams, J. R., Arnold, J. G., Srinivasan, R., and Ramanarayanan, T. S. (1998). “APEX: a new tool for predicting the effects of climate and CO2 changes on erosion and water quality” in Modelling Soil Erosion by Water (Springer), 441–449.
Williams, J. R., Izaurralde, R., Singh, V., and Frevert, D. (2006). “The APEX model” in Watershed models, 437–482.
Worqlul, A., Dile, Y., Bizimana, J.-C., Jeong, J., Gerik, T., Srinivasan, R., et al. (2018). Multi-dimensional evaluation of simulated small-scale irrigation intervention: A case study in Dimbasinia Watershed, Ghana. Sustainability 10:1531. doi: 10.3390/su10051531
Worqlul, A., Dile, Y., Jeong, J., Schmitter, P., Bizimana, J., Gerik, T., et al. (2017). Water resource assessment, gaps and constraints of vegetable production in Robit and Dangishta Watersheds, Upper Blue Nile Basin, Ethiopia, AGU fall meeting abstracts.
Worqlul, A. W., Dile, Y. T., Schmitter, P., Jeong, J., Meki, M. N., Gerik, T. J., et al. (2019). Water resource assessment, gaps, and constraints of vegetable production in Robit and Dangishta watersheds, Upper Blue Nile Basin, Ethiopia. Agric. Water Manag. 226:105767. doi: 10.1016/j.agwat.2019.105767
Keywords: Africa, agricultural water management, climate change, irrigation scheduling, water productivity, WFD
Citation: Tegegne D, Schmitter P, Worqlul AW and Lefore N (2025) Estimating crop coefficients for vegetable production and agricultural water management under climate change in sub-humid tropics. Front. Water. 7:1355154. doi: 10.3389/frwa.2025.1355154
Edited by:
Satya Prakash, India Meteorological Department, IndiaReviewed by:
Jayantilal N. Patel, Sardar Vallabhbhai National Institute of Technology, Surat, IndiaShiblu Sarker, Virginia Department of Conservation and Recreation, United States
Copyright © 2025 Tegegne, Schmitter, Worqlul and Lefore. This is an open-access article distributed under the terms of the Creative Commons Attribution License (CC BY). The use, distribution or reproduction in other forums is permitted, provided the original author(s) and the copyright owner(s) are credited and that the original publication in this journal is cited, in accordance with accepted academic practice. No use, distribution or reproduction is permitted which does not comply with these terms.
*Correspondence: Desalegn Tegegne, RC5UZWdlZ25lQGNnaWFyLm9yZw==