 Kotapati Narayana Loukika
 Venkata Reddy Keesara
 Eswar Sai Buri
 Venkataramana Sridhar
- 1Department of Civil Engineering, National Institute of Technology Warangal, Warangal, India
- 2Department of Biological Systems Engineering, Virginia Polytechnic Institute and State University, Blacksburg, VA, United States
The behaviour of water between the surface and subsurface is a dynamic and intricate process, involving a complex interplay between surface water and groundwater. This interaction is vital for supporting ecosystems, providing water supplies, and ensuring the sustainable use of water resources. Disruptions in these interactions, such as over-extraction, reduced streamflow, and the impacts of climate change, contribute to water scarcity. An integrated management of surface and groundwater resources is crucial for addressing these challenges and ensuring the long-term availability and sustainability of water supplies. In this study, the spatiotemporal variations of surface and groundwater interactions were analysed using integrated SWAT and MODFLOW model using QSWATMOD plugin in QGIS software. The surface and groundwater interactions were analysed for future periods under climate and land use land cover (LULC) change scenarios. Pre-monsoon, monsoon, post-monsoon kharif, and post-monsoon rabi seasons are considered for analysing the surface and groundwater interactions. The future LULCs are projected using the DynaCLUE model for three user-defined scenarios such as past trend (scenario 1), drastic change in built-up and barren land (scenario 2), and restricted agricultural land (scenario 3). For projecting the interactions under both changing climate and LULC, LULC scenario 1 was used for near-future period, LULC scenario 2 for mid-future period, and LULC scenario 3 for far future period. Under the climate change scenario, the maximum groundwater recharge under SSP5-8.5 scenario is observed to be 20,805 m3/day in the near future, and the maximum discharge under SSP2-4.5 scenario is observed as 9,035 m3/day in the mid-future period. In both climate change and combined scenarios (both climate and user-defined LULC), there was a greater recharge of groundwater during the monsoon season relative to other seasons, while there was a greater discharge of groundwater during the post-monsoon rabi season. In the combined scenarios, the maximum discharge was under SSP5-8.5 with 15,009 m3/day in the mid-future, and the groundwater recharge was greater in the near future period under SSP3-7.0 with 19,556 m3/day. The groundwater–surface water interactions were analysed in four seasons, out of which monsoon season had the maximum recharge and groundwater discharge was more in the post-monsoon rabi season. The results found in this study’ can be used to plan and develop short-and long-term integrated surface and groundwater management strategies of the basin under changing climate and LULC.
Introduction
Water behaviour between the surface and subsurface is a dynamic and intricate process that involves a complex interplay between surface water and groundwater (Sridhar et al., 2018; Taie Semiromi and Koch, 2019; Aliyari et al., 2019; Yifru et al., 2020). Surface water, such as rivers, lakes, and wetlands, plays a crucial role in recharging groundwater through infiltration. Conversely, groundwater also contributes to surface water availability by seeping out and discharging into rivers, lakes, and other surface water bodies. This groundwater discharge sustains streamflow, particularly during dry periods when surface water alone may be insufficient to maintain flow. This interaction between surface and groundwater is vital for supporting ecosystems, providing water supplies, and ensuring the sustained usage of water resources (Sabzzadeh and Shourian, 2020; Jia et al., 2021; Nugraha et al., 2021). The increasing scarcity of water is closely intertwined with groundwater–surface water interactions (Kang et al., 2022). Disruptions in these interactions, such as over-extraction, reduced streamflow, and climate change impacts, contribute to water scarcity (Shrestha et al., 2016). An integrated management of groundwater and surface water resources is crucial for addressing water scarcity challenges.
The groundwater–surface water interactions is another major interest for the groundwater modellers to get accurate flow dynamics in the subsurface (Haque et al., 2021; Chang and Chung, 2021). As the hydrological model works on the water balance equation, which cumulates all the processes in the catchment, it leads to the redundancy in the groundwater levels at the regional scale. Therefore, at regional scale, a hydrological model should be coupled with another subsurface model to get precise groundwater levels (Kang and Sridhar, 2019). However, many authors are facing challenges in the integrated models regarding data scarcity at the regional scale (Sridhar et al., 2019; Satish Kumar et al., 2021). The earlier versions of SWAT-MODFLOW integrated models could not overcome the data scarcity challenge in their coupling algorithms, which resulted in imprecise results (Brunner and Simmons, 2012; Semenova and Beven, 2015). This challenge is being overcome in upgraded SWAT-MODFLOW model, which constructs the disaggregating hydrological response units (DHRUs) by merging hydrological response units (HRUs) of the SWAT model (Aouissi et al., 2016; Chen et al., 2023; Dakhlalla and Parajuli, 2019) and MODFLOW grids of the MODFLOW (Bailey and Park, 2019; Park et al., 2019; Gao et al., 2019). The upgraded version takes the basic assumptions of Darcy’s law and introduces various parameters to overcome the challenge associated with data scarcity. SWAT-MODFLOW allows for interaction between the saturated aquifer and channel reaches and can simulate the spatiotemporal distribution of groundwater recharge rates, aquifer evapotranspiration, and groundwater levels.
Yifru et al. (2020) assessed the performance of SWAT-MODFLOW to explore the groundwater recharge in Han River watershed, Seoul city, South Korea, and the results showed that it performed better than the SWAT model, especially in PBIAS, at simulating streamflow. Taie Semiromi and Koch (2019) developed a combined SWAT-MODFLOW model by incorporating all the sensitive parameters and concluded that the current coupled surface–groundwater hydrological model can be a useful tool for choosing appropriate proactive and reactive actions to prevent such harmful consequences on the water resources in a basin. Aliyari et al. (2019) investigated groundwater and surface water interactions in the Iranian Basin to understand the parameters that affect the model output and calibrated the sensitive parameters that have an impact on both groundwater and surface water.
Understanding the complex dynamics of groundwater systems is crucial for effective water resource management (Chunn et al., 2019). India has significant spatial and temporal variability in groundwater resources due to variations in geology, climate, and land use patterns. However, there remains a significant knowledge gap regarding the dynamic interaction between surface and subsurface water to understand the complete hydrologic cycle. This knowledge gap hinders accurate assessments of groundwater availability, sustainability, and the impacts of human activities and climate change on groundwater resources at a basin scale. Therefore, there is a need for a comprehensive investigation to characterise and quantify the spatial and temporal variations in groundwater movements like groundwater–surface water interactions in the basin. The interaction between surface and groundwater has been widely studied using various modelling approaches. This study employed the integrated SWAT–MODFLOW framework, implemented through the QSWATMOD plugin in QGIS, to analyse surface water–groundwater interactions under changing climate and land use land cover (LULC) scenarios. This approach was chosen for its ability to combine surface hydrological processes (SWAT) with groundwater dynamics (MODFLOW), enabling a comprehensive analysis of hydrological feedback mechanisms under dynamic conditions. Compared to standalone models, the integrated SWAT–MODFLOW framework offers a robust and efficient representation of these interactions, with the QSWATMOD plugin simplifying data transfer and reducing computational complexity. Supported by prior studies demonstrating its effectiveness across diverse basins, this approach was complemented by the DynaCLUE model, which provides spatially explicit projections of future LULC changes, ensuring realistic inputs for hydrological simulations.
In the current study, the integrated SWAT–MODFLOW model, which is available as QSWATMOD plugin is used to analyse the spatiotemporal changes of groundwater–surface water interactions under climate LULC change scenarios. The interactions were analysed in four seasons (monsoon, post-monsoon kharif, post-monsoon rabi, and pre-monsoon). Addressing these challenges will provide essential insights into the functioning and behaviour of groundwater systems, enabling informed decision-making for sustainable groundwater management, efficient water allocation, and the preservation of ecosystem health.
Study area
The Munneru River is a tributary of Krishna River basin in India, establishing itself as an autonomous sub-basin as depicted in Figure 1 (Loukika et al., 2022; Buri et al., 2022), encompassing a total area of 10,392 km2 spanning across the states of Andhra Pradesh and Telangana. It exhibits varying elevations ranging from 20 m to 791 m, while maintaining an average annual precipitation of 1,014 mm over the preceding 119 years. Prominent water bodies encompass Wyra reservoir, Lanka Sagar reservoir, Pakhal Lake, and Bhayyaram Cheruvu. Red and black soils predominate in the region, supporting agricultural practices focused on crops such as paddy, cotton, maize, and chillies. Urban areas, particularly Khammam and Nandigama, have witnessed significant LULC changes, notably the conversion of barren areas to built-up areas. However, agricultural lands, forest areas, and water bodies have shown minimal alteration. The rapid urbanisation in Telangana and the development of Amaravati capital region in Andhra Pradesh present challenges to water resources in the basin. The river serves as a vital water source for both irrigation and domestic needs. Approximately 77% of the basin’s total area is cultivable, supporting a diverse range of crops, including rice, maize, cotton, millet, sorghum, sugarcane, and various horticultural crops (Setti et al., 2020a).
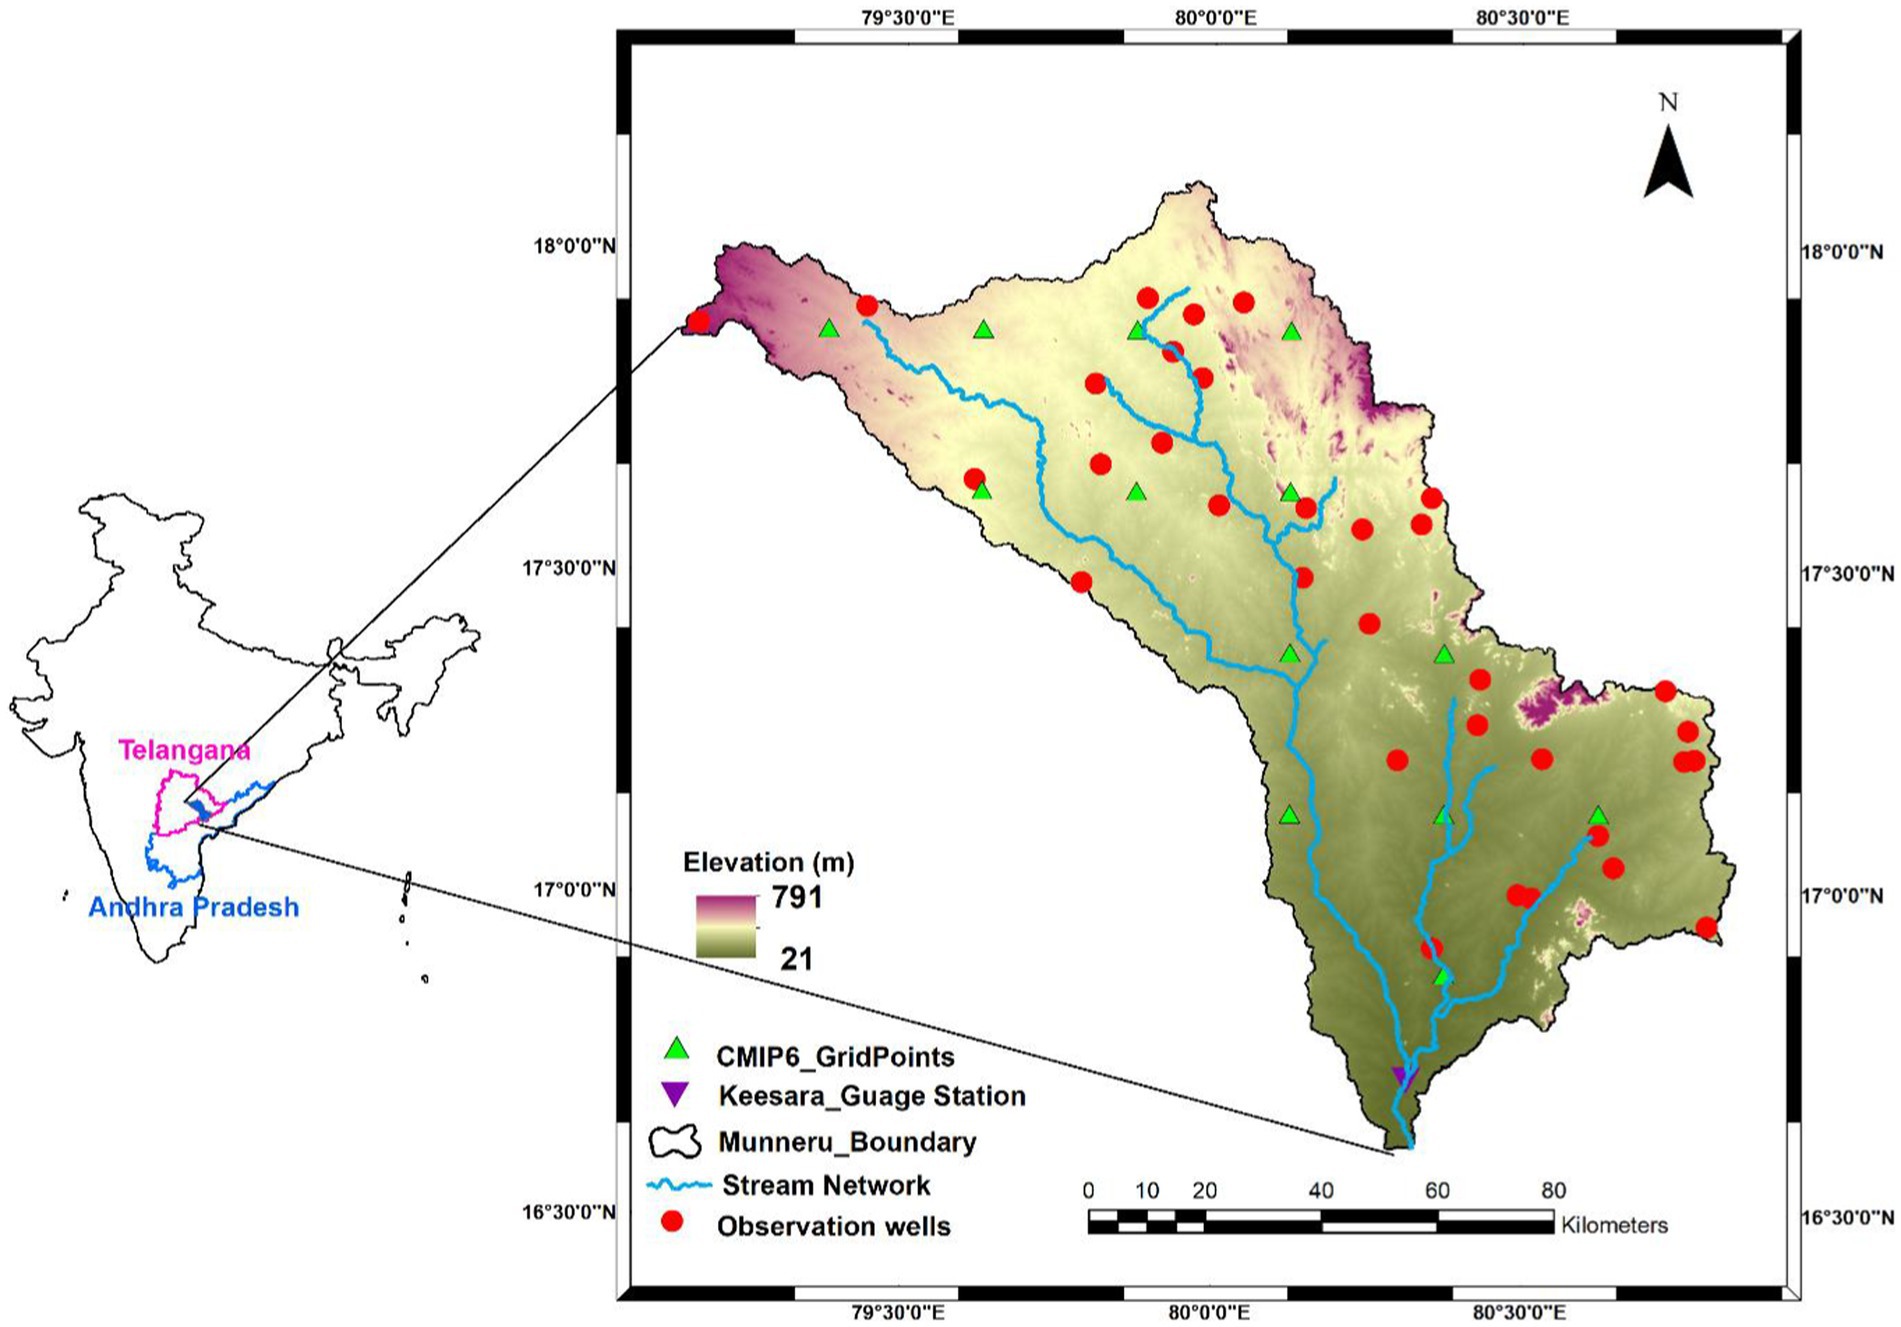
Figure 1. The location map of the study area.
However, the increasing population has led to a heightened demand for water, both domestically and industrially, thereby straining water resources (Setti et al., 2020b). Cropland and irrigated land dominate the watershed’s land use, with notable changes including the conversion of barren land to built-up areas, cropland to dryland, and urbanisation in key regions like Khammam and Nandigama. Future climate and LULC changes may further stress water distribution, necessitating policy interventions for a sustainable management of water resources in this basin.
Methodology
The methodology followed in the present is shown in Figure 2. The surface water and groundwater interactions were analysed using integrated SWAT and MODFLOW model using the QSWATMOD plugin. The calibrated SWAT model was initially used as input for the integrated model. MODFLOW model was created with initial boundary conditions and aquifer parameters. After that, the SWAT and MODFLOW files were linked. Initially the model was run for the observed and historic periods and calibrated with observed groundwater levels and discharge data. After the calibration, the model was run for three future periods under climate change and LULC scenarios.
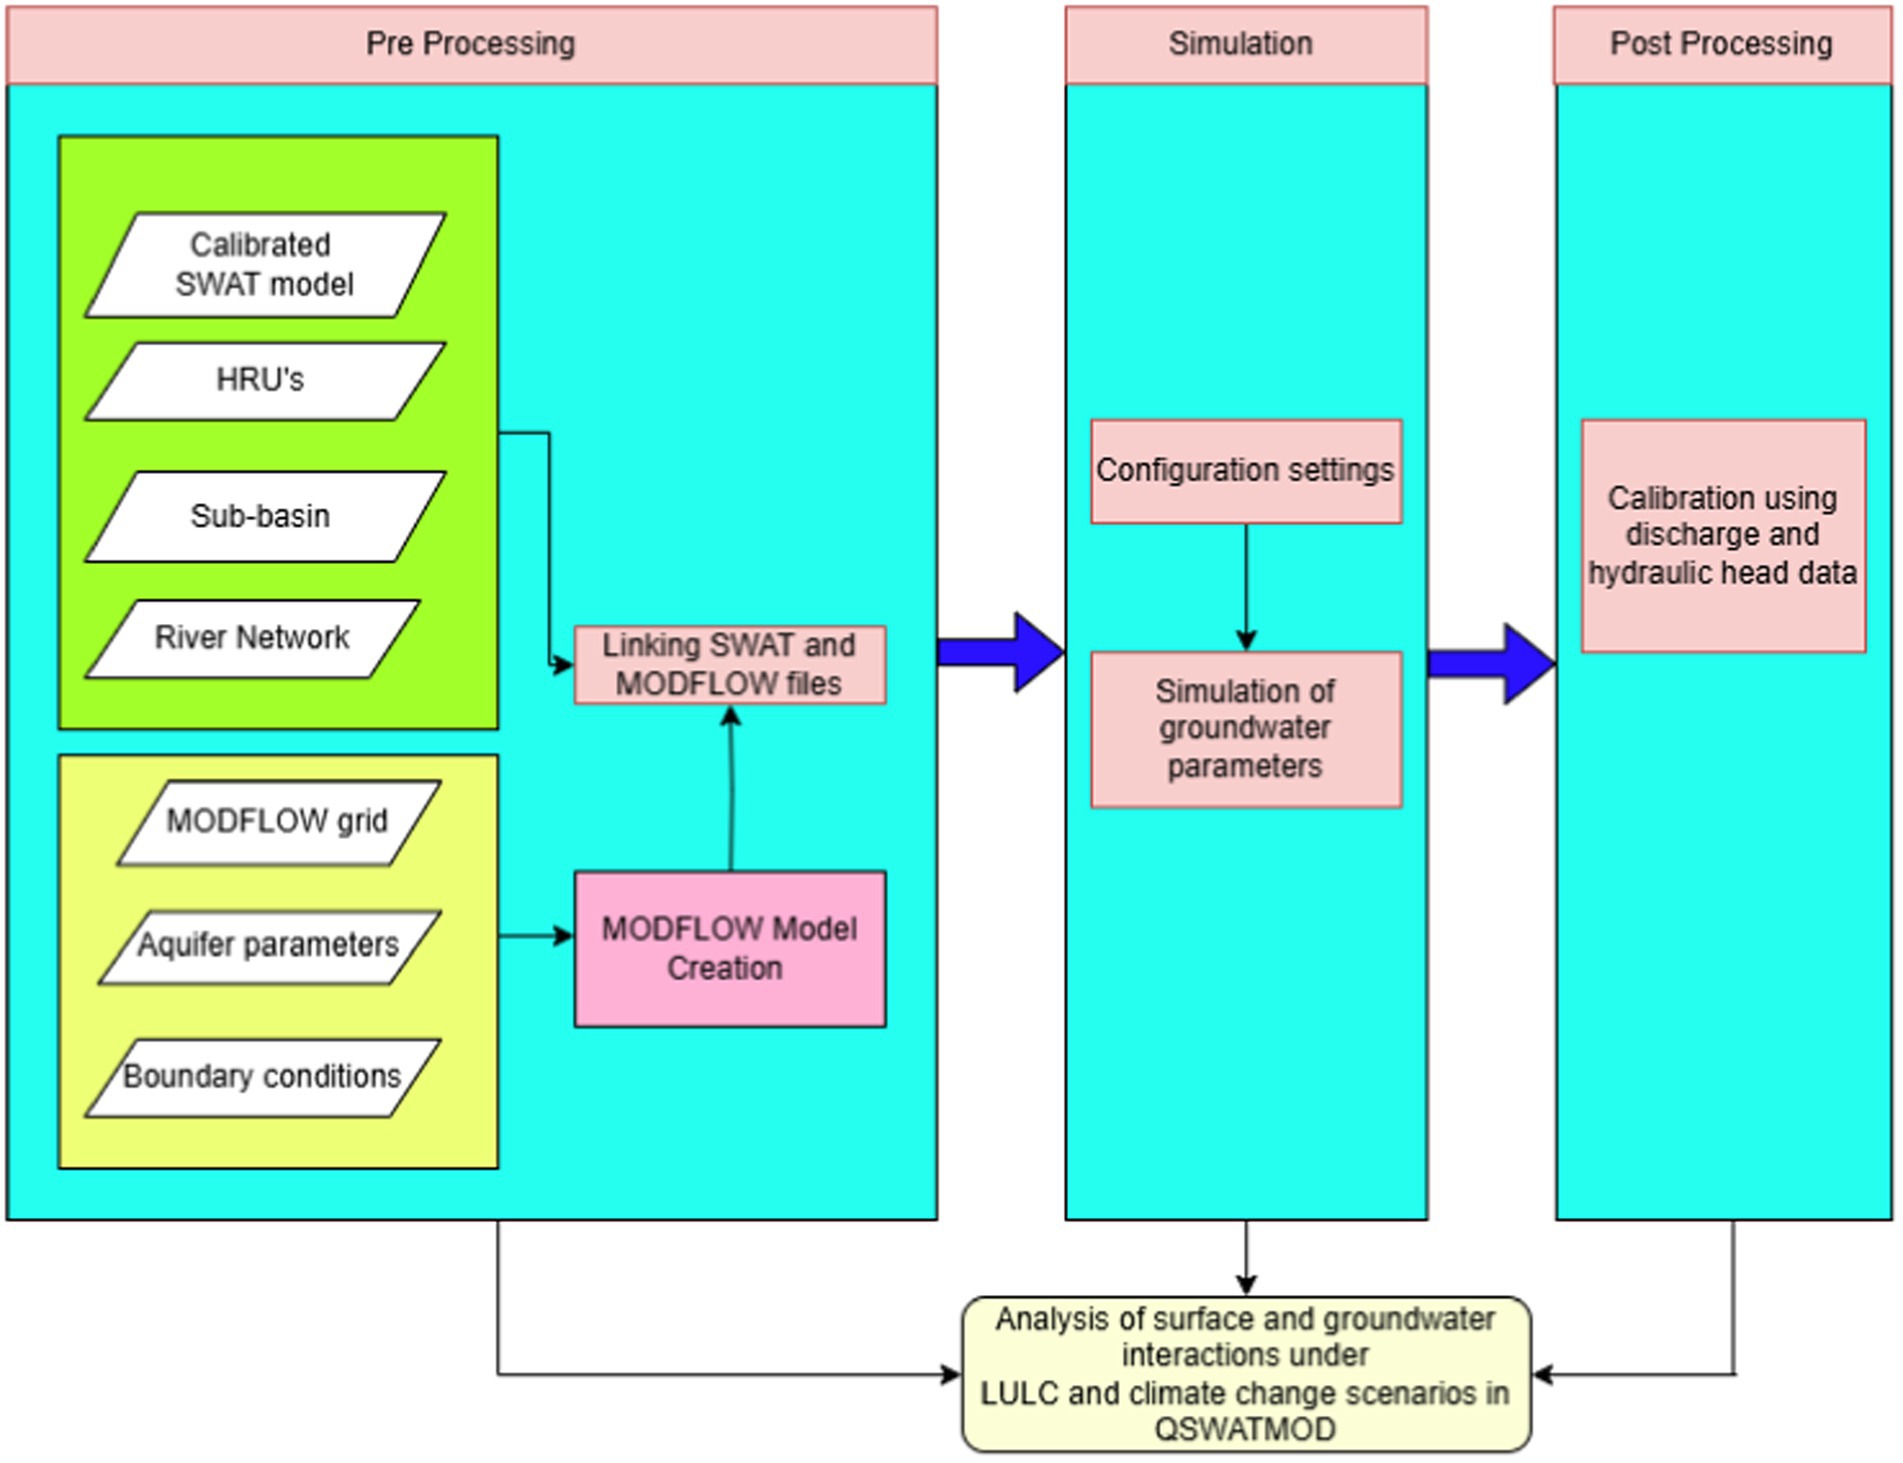
Figure 2. Methodology flowchart for simulation of surface and groundwater flow interactions with SWAT-MODFLOW integrated model.
The scenario-based LULC maps were predicted using DynaCLUE model for the years 2030, 2050, and 2080 (Loukika et al., 2023). In the present study, three user-defined scenarios were projected. The first one was based on the past trend followed in the study area (LULC scenario1) and the second was rapid change in urbanisation, which leads to an increase in barren land and a decrease in agriculture and forest areas (LULC scenario2). The third scenario was based on the restriction of agriculture land and other land use classes were unrestricted for changes (LULC scenario3). The SWAT model was calibrated and validated using SWATCUP for the period 1983–2017 (Loukika et al., 2022). The streamflow was projected in three future periods—near future (2025–2040), mid-future (2041–2070), and far future (2071–2,100) under three SSP scenarios.
The spatiotemporal variations of groundwater and surface water interactions under climate and LULC change scenarios using QSWATMOD for four seasons, namely, pre-monsoon (April–June), monsoon (July–September), post–monsoon kharif (October–December), and post-monsoon rabi (January–March).
QSWATMOD
QSWATMOD is a QGIS-based graphic user interface (GUI) plugin that enables the linkage of an existing SWAT model and a MODFLOW model within a GIS environment, thus facilitating model preparation and visualisation of results. The QSWATMOD model involves three main steps: pre-processing, simulation, and post-processing and the details of these steps are explained in below.
Pre-processing
The first step in the module is to import the SWAT ‘TxtInOut’ into the QSWATMOD model. The HRUs, sub-basin, and river network shapefiles are then imported to the QGIS canvas. Once users provide all SWAT model input files and shapefiles, MODFLOW options become enabled. The plugin also provides a facility to create the MODFLOW files like grid file, boundary shape file, and the aquifer parameters such as hydraulic conductivity, aquifer thickness, specific storage, and specific yield need to be assigned to the model. The detailed aquifer properties present in the study area are given in Table 1. The grid size was given as 2,500 × 2,500 m and after assigning the all the parameters create the MODFLOW model into the specified path. The preceding step involves assigning observation well shapefile (Point shapefile) to the model. It can be created using the QGIS or ArcGIS environment. There are a total of 33 observation wells present in the study area. This shape file helps the model to distinguish between observation well cells and river cells. After that, the model starts the linking process, where the HRUs are disaggregated to create DHRUs, which are then intersected with MODFLOW grid cells. SWAT HRUs are initially divided into separate polygons in the GIS environment, as they do not possess specific geographic locations. Each polygon represents an individual HRU with a distinct geographic position. To transfer the variables between SWAT and MODFLOW, these DHRUs are subsequently intersected with MODFLOW grid cells. Moreover, MODFLOW river cells, which estimate the volumetric flow exchange rates between the aquifer and stream are estimated, are also intersected with SWAT sub-basins. This intersection enables the accurate transfer of groundwater return flow rates to the appropriate sub-basin stream within the SWAT model. This linking process creates four major shape files of SWAT–MODFLOW, that is, DHRU to HRU text file, DHRU to Grid text file, Grid to DHRU text file, and River to Grid text file.
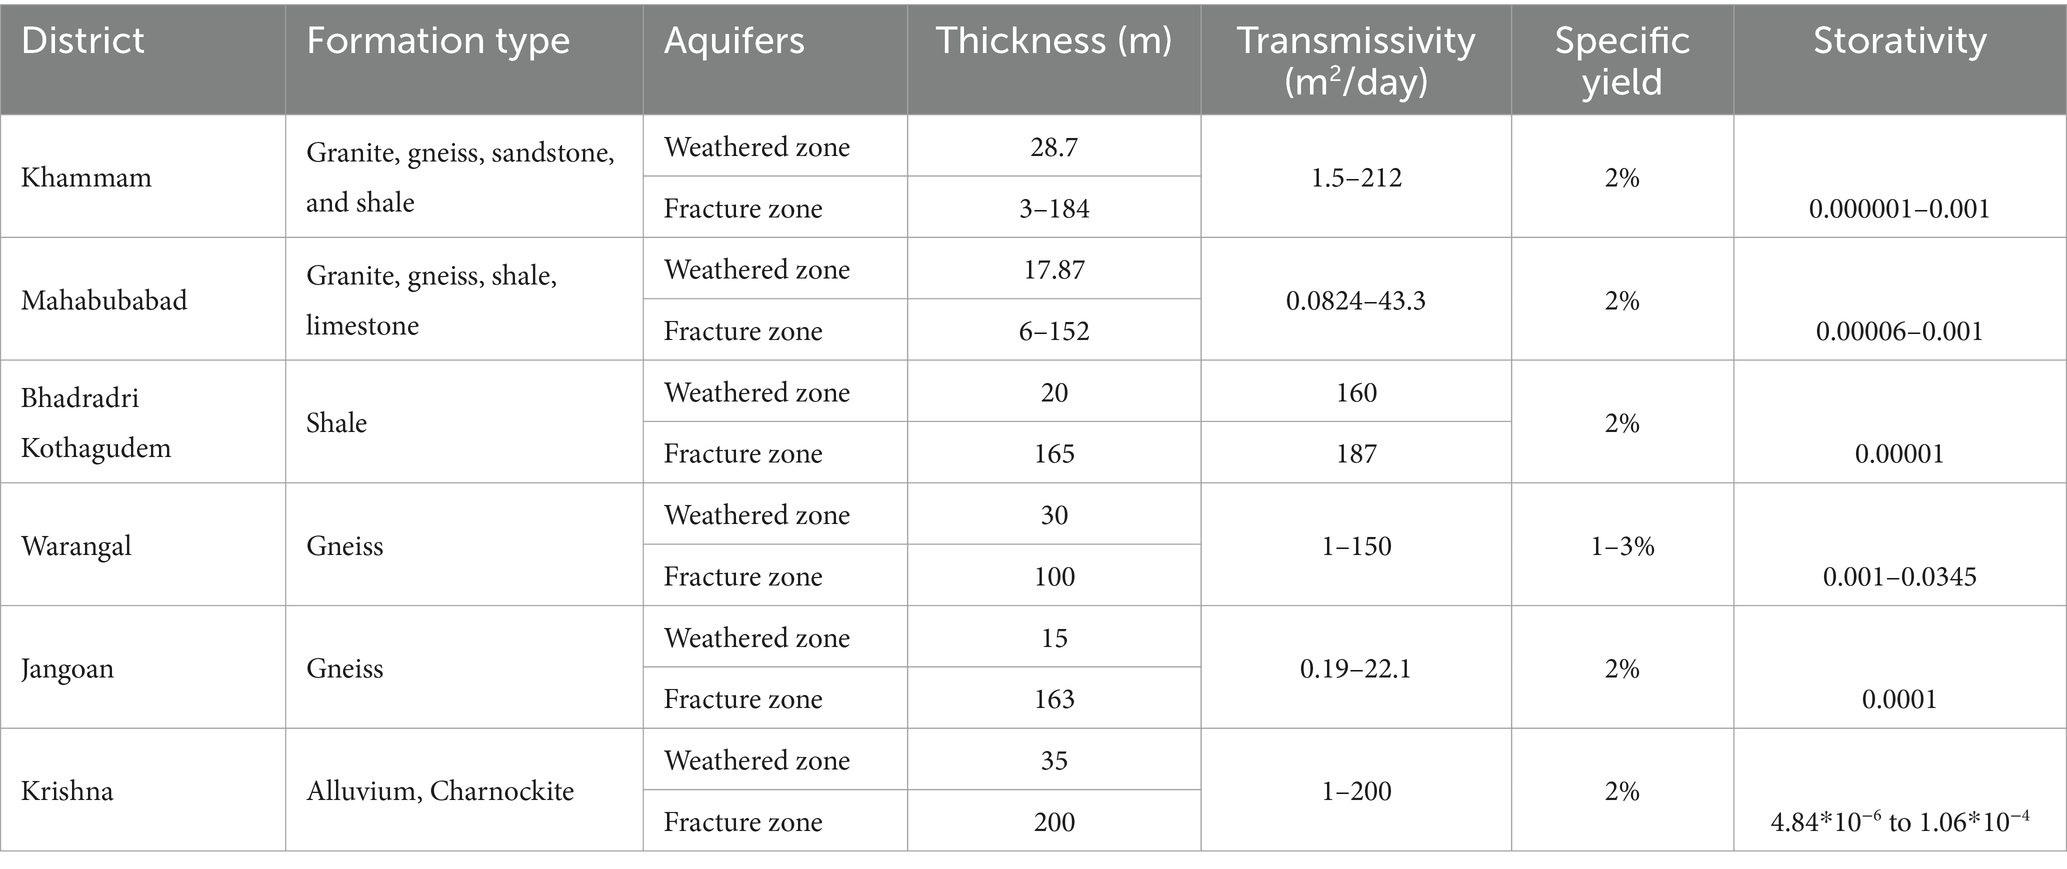
Table 1. Details of aquifer layers and aquifer properties of the study area.
Simulation
The ‘Simulation’ tab includes three frames: Simulation Period, Configuration Settings, and Optional outputs for SWAT–MODFLOW simulation. The value of groundwater delay (in days) is considered from the SWAT model, which is given as 60 days. After selecting the options, configuration settings were exported and simulation was run for the specified periods.
Post-processing
The post-processing module is mainly used to visualise the output results after the simulation. The three major processes involved are plotting, mapping, and exporting. The major outputs associated with the study are streamflow hydrograph and hydraulic heads and visualisation of groundwater–surface water interactions. Once the observation data for streamflow from 1985 to 2017 and groundwater levels from 1996 to 2017 are provided in the formats “streamflow.obd” and “modflow.obd,” objective function summary values such as Percent Bias (PBIAS), Nash-Sutcliffe Efficiency (NSE), and the coefficient of determination (R2) will be displayed.
Calibration of QSWATMOD
The goal of model calibration is to ensure the model can accurately replicate field-measured heads and flows. This calibration is achieved either through trial and error adjustments of aquifer parameters. Calibration was performed using data from observation wells monitored between 1996 and 2018 and stream discharge values from 1985 to 2017. Through iterative trial and error adjustments, the hydraulic conductivity, specific yield, specific storage values were increased over several runs until the observed, and simulated water levels matched. Model calibration involves adjusting the values of input parameters to align with field conditions within acceptable criteria. Once the model can reliably reproduce observed changes in field conditions, it is ready for predicting future simulations.
Results and discussion
Calibration of QSWATMOD using streamflow discharge and groundwater levels
The model calibration is to verify that the model can accurately replicate field-measured groundwater heads and flows. QSWATMOD calibration was performed manually adjusting the aquifer parameters such as hydraulic conductivity, specific yield, and specific storage by trial and error.
Calibration was employed using the data collected from eight observation wells monitored between 1996 and 2018 in the study region. Through iterative trial and error calibration, the conductivity values were incrementally adjusted over multiple runs until the observed and simulated water levels matched. The simulated streamflow discharge from QSWATMOD is shown in the Figure 3. The R2, NSE, and P-BIAS for the simulated discharge from QSWATMOD were 0.87, 0.86, and −15.67, respectively. Figure 4 illustrates the simulated average monthly groundwater levels (mbgl) for the eight observation wells of the study area from the integrated SWAT and MODFLOW model. The R2 values for the observation wells are as follows: Annapareddipalli (0.2), Gandampally (0.2), Sitarampuram (0.0), Kesamudram (0.36), Kumavaram (0.19), Gampalagudem (0.3), Ingurit (0.21), and Narsampaeta (0.19). From the simulated groundwater levels of Annapareddipalli, the observed groundwater levels show significant variability, with notable peaks and troughs, particularly between 1996 and 2010. There are sharp declines and rises. While the simulated levels generally follow a similar trend, they often differ in magnitude, especially around 2002 and 2008, where the simulations underestimate the observed drops. The simulated data consistently underestimates the observed values in Gandhampally and fluctuates in both observed and simulated groundwater levels. The observed data exhibits more pronounced peaks and troughs compared to the simulated data, which remains relatively subdued. For Sitarampuram, the observed groundwater levels exhibit significant variability particularly in the years 1998, 2004, and 2016. The simulated levels track the observed data to some extent but frequently miss the sharper changes, displaying less extreme fluctuations. The observed data from Kunavaram shows significant variability, with multiple peaks and troughs, especially around 2000, 2010, and 2014. The simulated data does not capture these sharp changes effectively, showing a much smoother trend with lower amplitude fluctuations. Groundwater levels exhibit significant variability in Ingurti, with notable decreases observed in the years 2000, 2008, and 2012. After these drops, there seems to be some recovery, but overall, the trend indicates periods of significant groundwater depletion. Groundwater levels show cyclical patterns with periods of decline and recovery in Kesamudram. The pattern suggests a relatively stable but fluctuating trend, possibly with a slight overall decline or stabilisation in recent years. Groundwater levels in Narsampeta show a significant decline, especially between 1996 and 2008, indicating that groundwater levels are under more stress compared to other regions or parameters. The groundwater levels in Gampalagudem indicate a relatively stable trend with only slight variations over time.
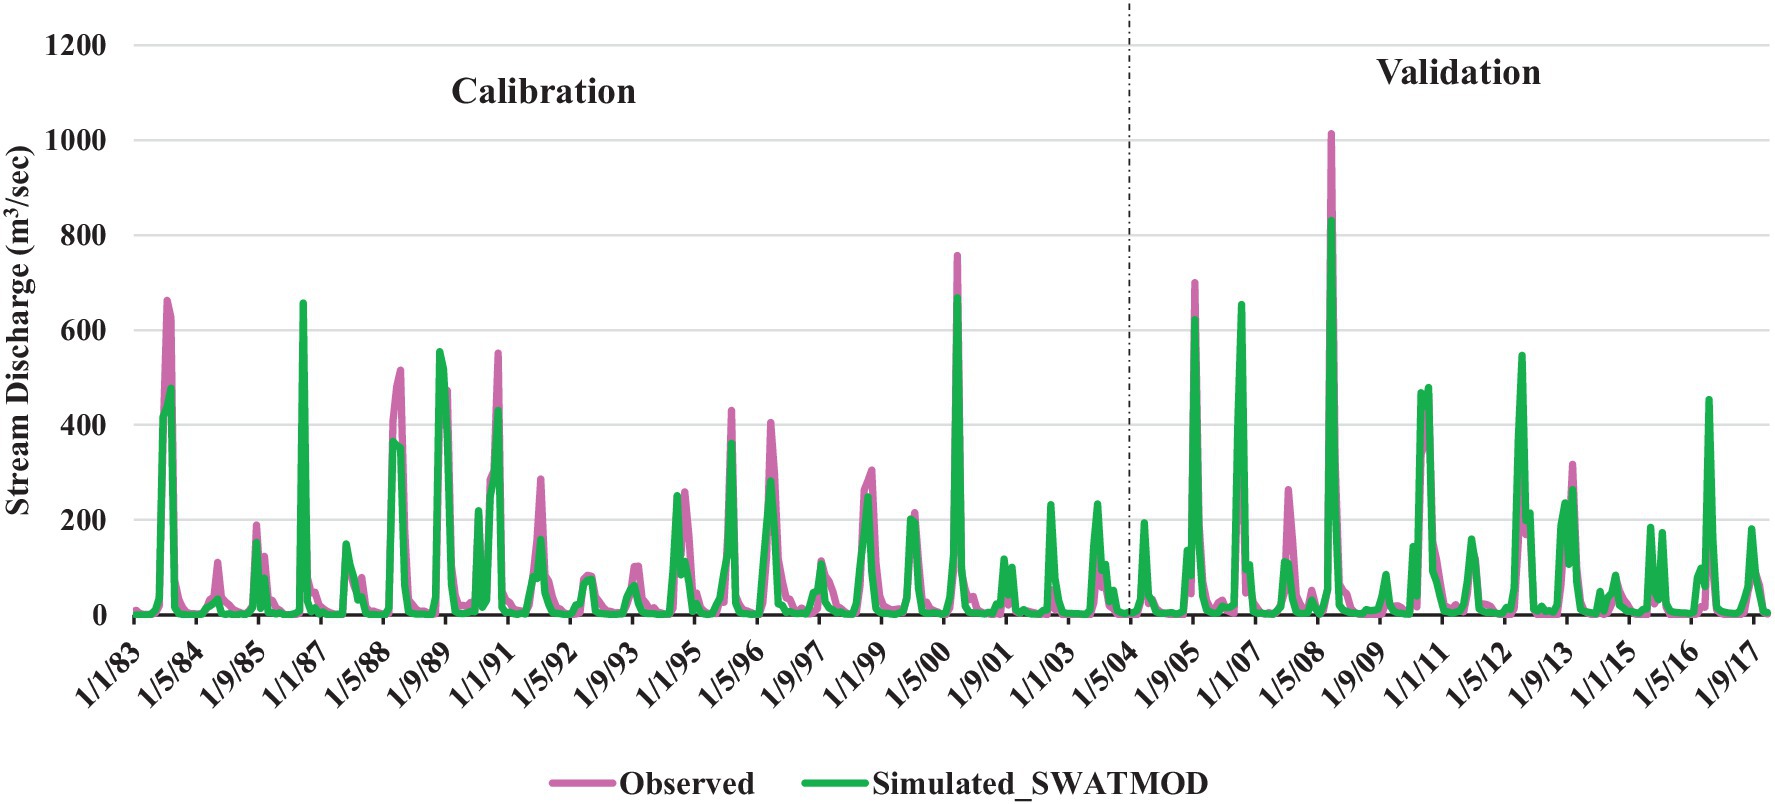
Figure 3. Observed and simulated stream discharge for the period 1983–2017.

Figure 4. Observed and simulated groundwater levels for the period 1996–2018.
The observed groundwater levels exhibit high variability with sharp declines and recoveries, while the simulated levels tend to underestimate these changes, presenting smoother trends with less variability.
Groundwater–surface water interactions in the observed period
After calibrating the integrated SWAT and MODFLOW model, interactions were analysed for the observed period (1983–2017) across monsoon, post-monsoon kharif, post-monsoon rabi, and pre-monsoon seasons, which are shown in Figure 5. The results show distinct seasonal variations in recharge and discharge rates. During the monsoon season, the highest recharge rate of 8,967 m3/day was recorded, along with a discharge of 4,952 m3/day. In the post-monsoon kharif season, the recharge reached 5,958 m3/day, while discharge slightly exceeded it at 6,326 m3/day. The post-monsoon rabi season had a recharge of 4,866 m3/day, with the highest discharge rate of 9,255 m3/day. The pre-monsoon season saw lower discharge levels at 3,980 m3/day, due to the declining groundwater levels.
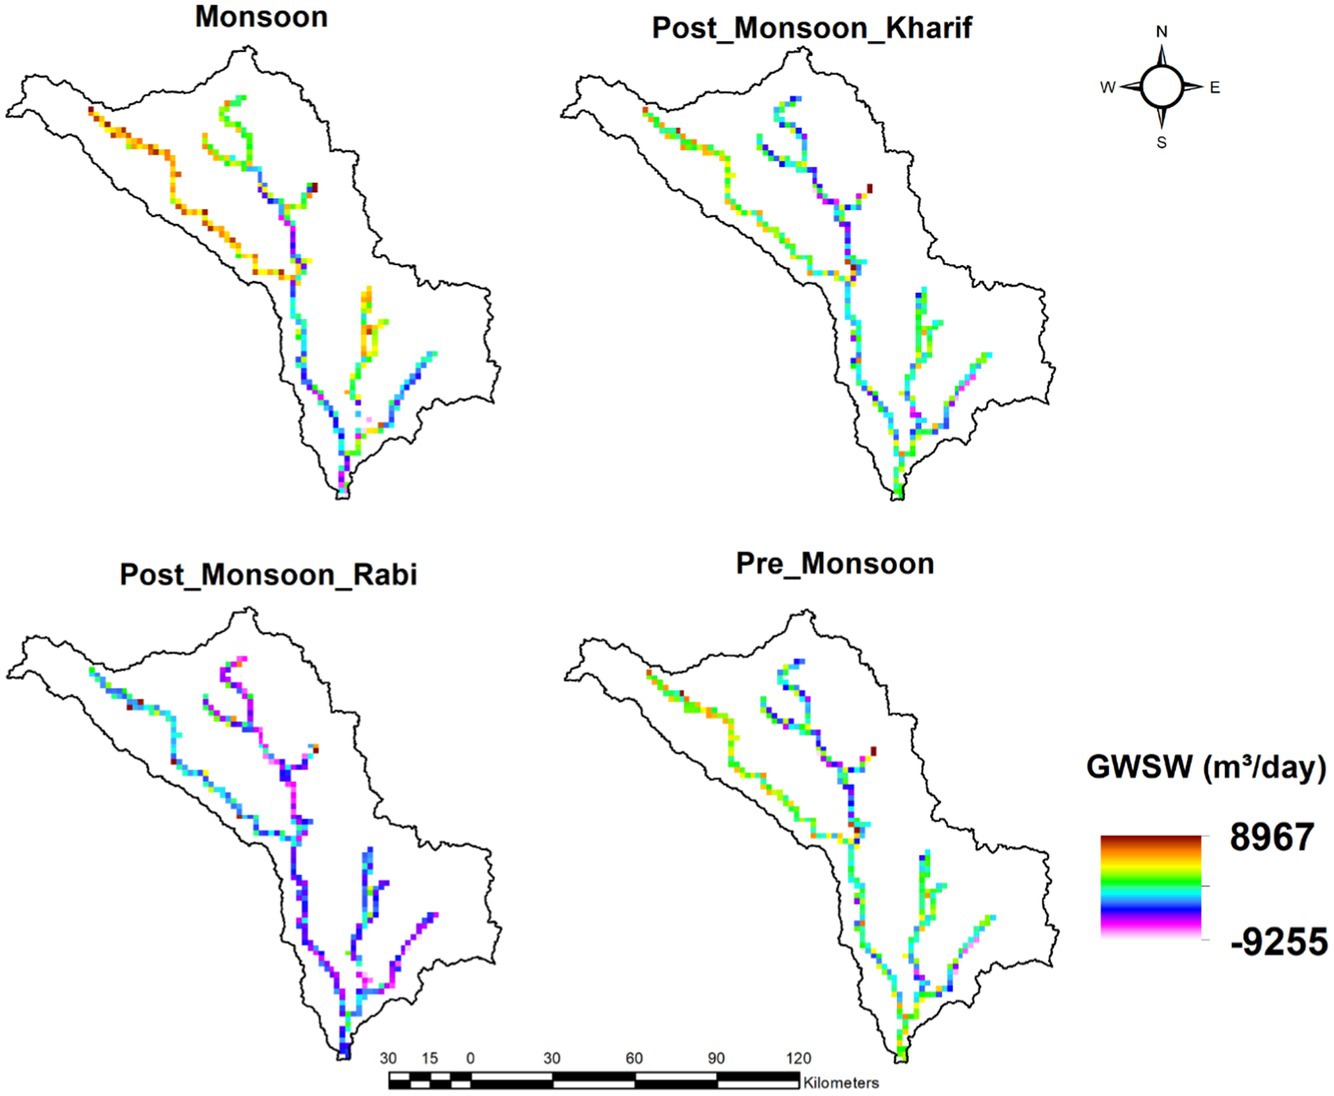
Figure 5. Groundwater and surface water interactions for the observed period 1983–2017.
Groundwater–surface water interactions under climate change scenarios
The interactions between groundwater and surface water under climate change scenarios were analysed by comparing them with the historic period (1983–2014). The results were simulated for four seasons such as monsoon, post-monsoon kharif, post-monsoon rabi, and pre-monsoon.
Monsoon
The groundwater and surface water interactions for monsoon season for three future periods under three different SSPs—SSP2-4.5, SSP3-7.0, and SSP5-8.5—are shown in Figure 6. In the monsoon season, the maximum groundwater recharge was observed when compared with other seasons. For SSP2-4.5, when compared with the historic period, the groundwater recharge was increased by 172.11, 76.35, and 117.02% in near future, mid-future, and far future periods. The groundwater recharge was increased by 224.40, 72.16, and 74.42% in near future, mid-future, and far future periods for SSP3-7.0. Similarly, in SSP5-8.5, the groundwater recharge was increased by 235.56, 81.73, and 126.24% in near future, mid-future, and far future periods. The groundwater discharge was decreased in future periods when compared with the historic period. For near future period, it was decreased by 41.22, 42.19, and 53.63% under SSP2-4.5, SSP3-7.0, and SSP5-8.5 scenarios. For mid-future period, groundwater discharge was decreased by 25.08, 26.65, and 23.06% under SSP2-4.5, SSP3-7.0, and SSP5-8.5 scenarios. Similarly, for the far future period, it was decreased by 18.76% under SSP2-4.5 and 18.51% under SSP5-8.5 scenario. There was a slight increase in discharge by 0.39% under SSP3-7.0.
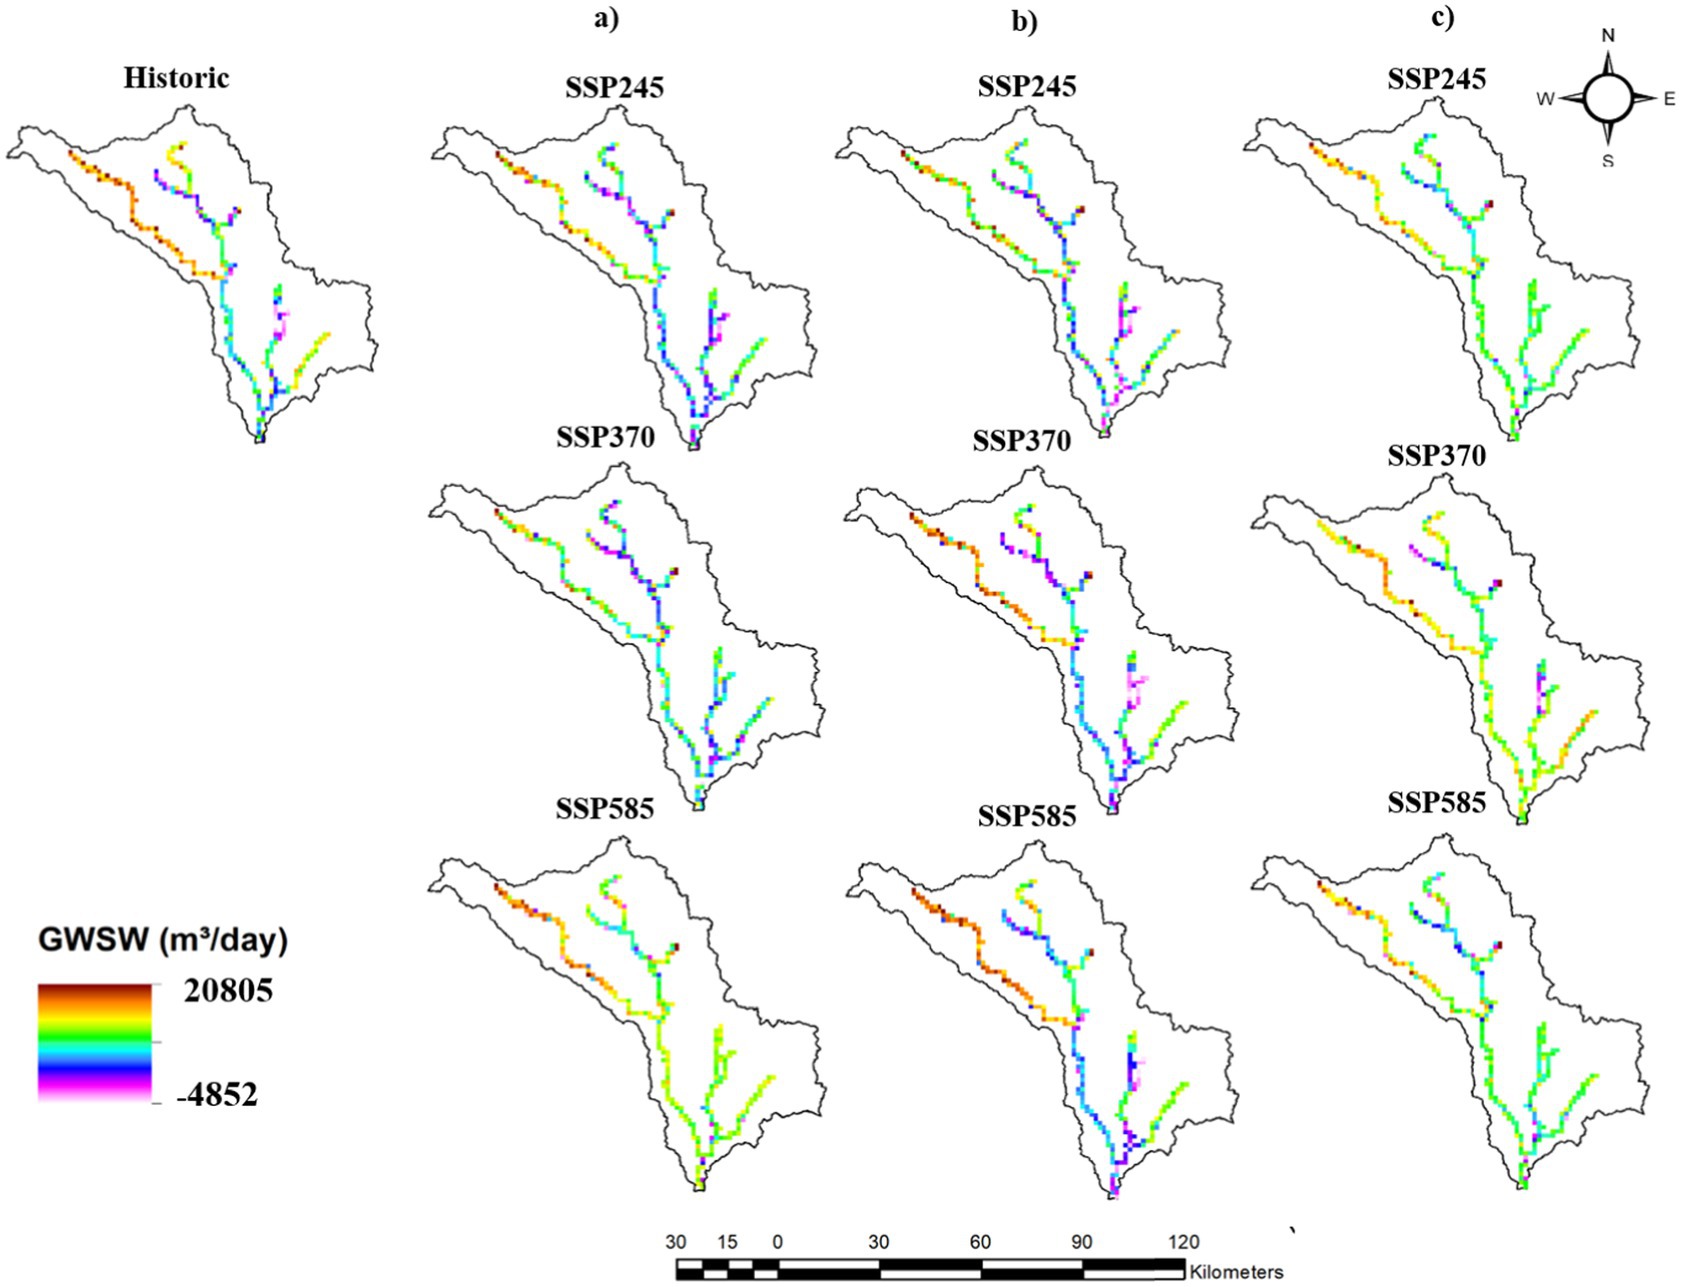
Figure 6. Groundwater and surface water interactions for monsoon: (A) near future; (B) mid-future; and (C) far future.
Post-monsoon kharif
Figure 7 illustrates groundwater and surface water interactions for post-monsoon kharif for three future periods under SSPs: SSP2-4.5, SSP3-7.0, and SSP5-8.5. The groundwater recharge was increased in future periods compared with the historic period for post-monsoon kharif season and the maximum recharge was observed in SSP3-7.0 and SSP5-8.5 in near future period. For SSP2-4.5, when compared with the historic period, the groundwater recharge was increased by 18.73, 3.53, and 7.44% in near future, mid-future, and far future periods. The groundwater recharge was increased by 60.60, 7.32, and 0.34% in near future, mid-future, and far future periods for SSP3-7.0. Similarly, in SSP5-8.5, the groundwater recharge was increased by 76.12, 0.25, and 3.77% in near future, mid-future, and far future periods. The groundwater discharge was increased in SSP2-4.5 scenario in all three future periods whereas for SSP3-7.0 and SSP5-8.5, it was decreased when compared with the historic period. For the near future period, it was increased by 3.14, 6.99, and 36.34% under SSP2-4.5, SSP3-7.0, and SSP5-8.5 scenarios. For the mid-future period, groundwater discharge was decreased by 1.07, 1.92, and 13.91% under SSP2-4.5, SSP3-7.0, and SSP5-8.5 scenarios. Similarly, for far future period, it was decreased by 3.76, 3.05, and 37.36% under SSP2-4.5, SSP3-7.0, and SSP5-8.5 scenario.
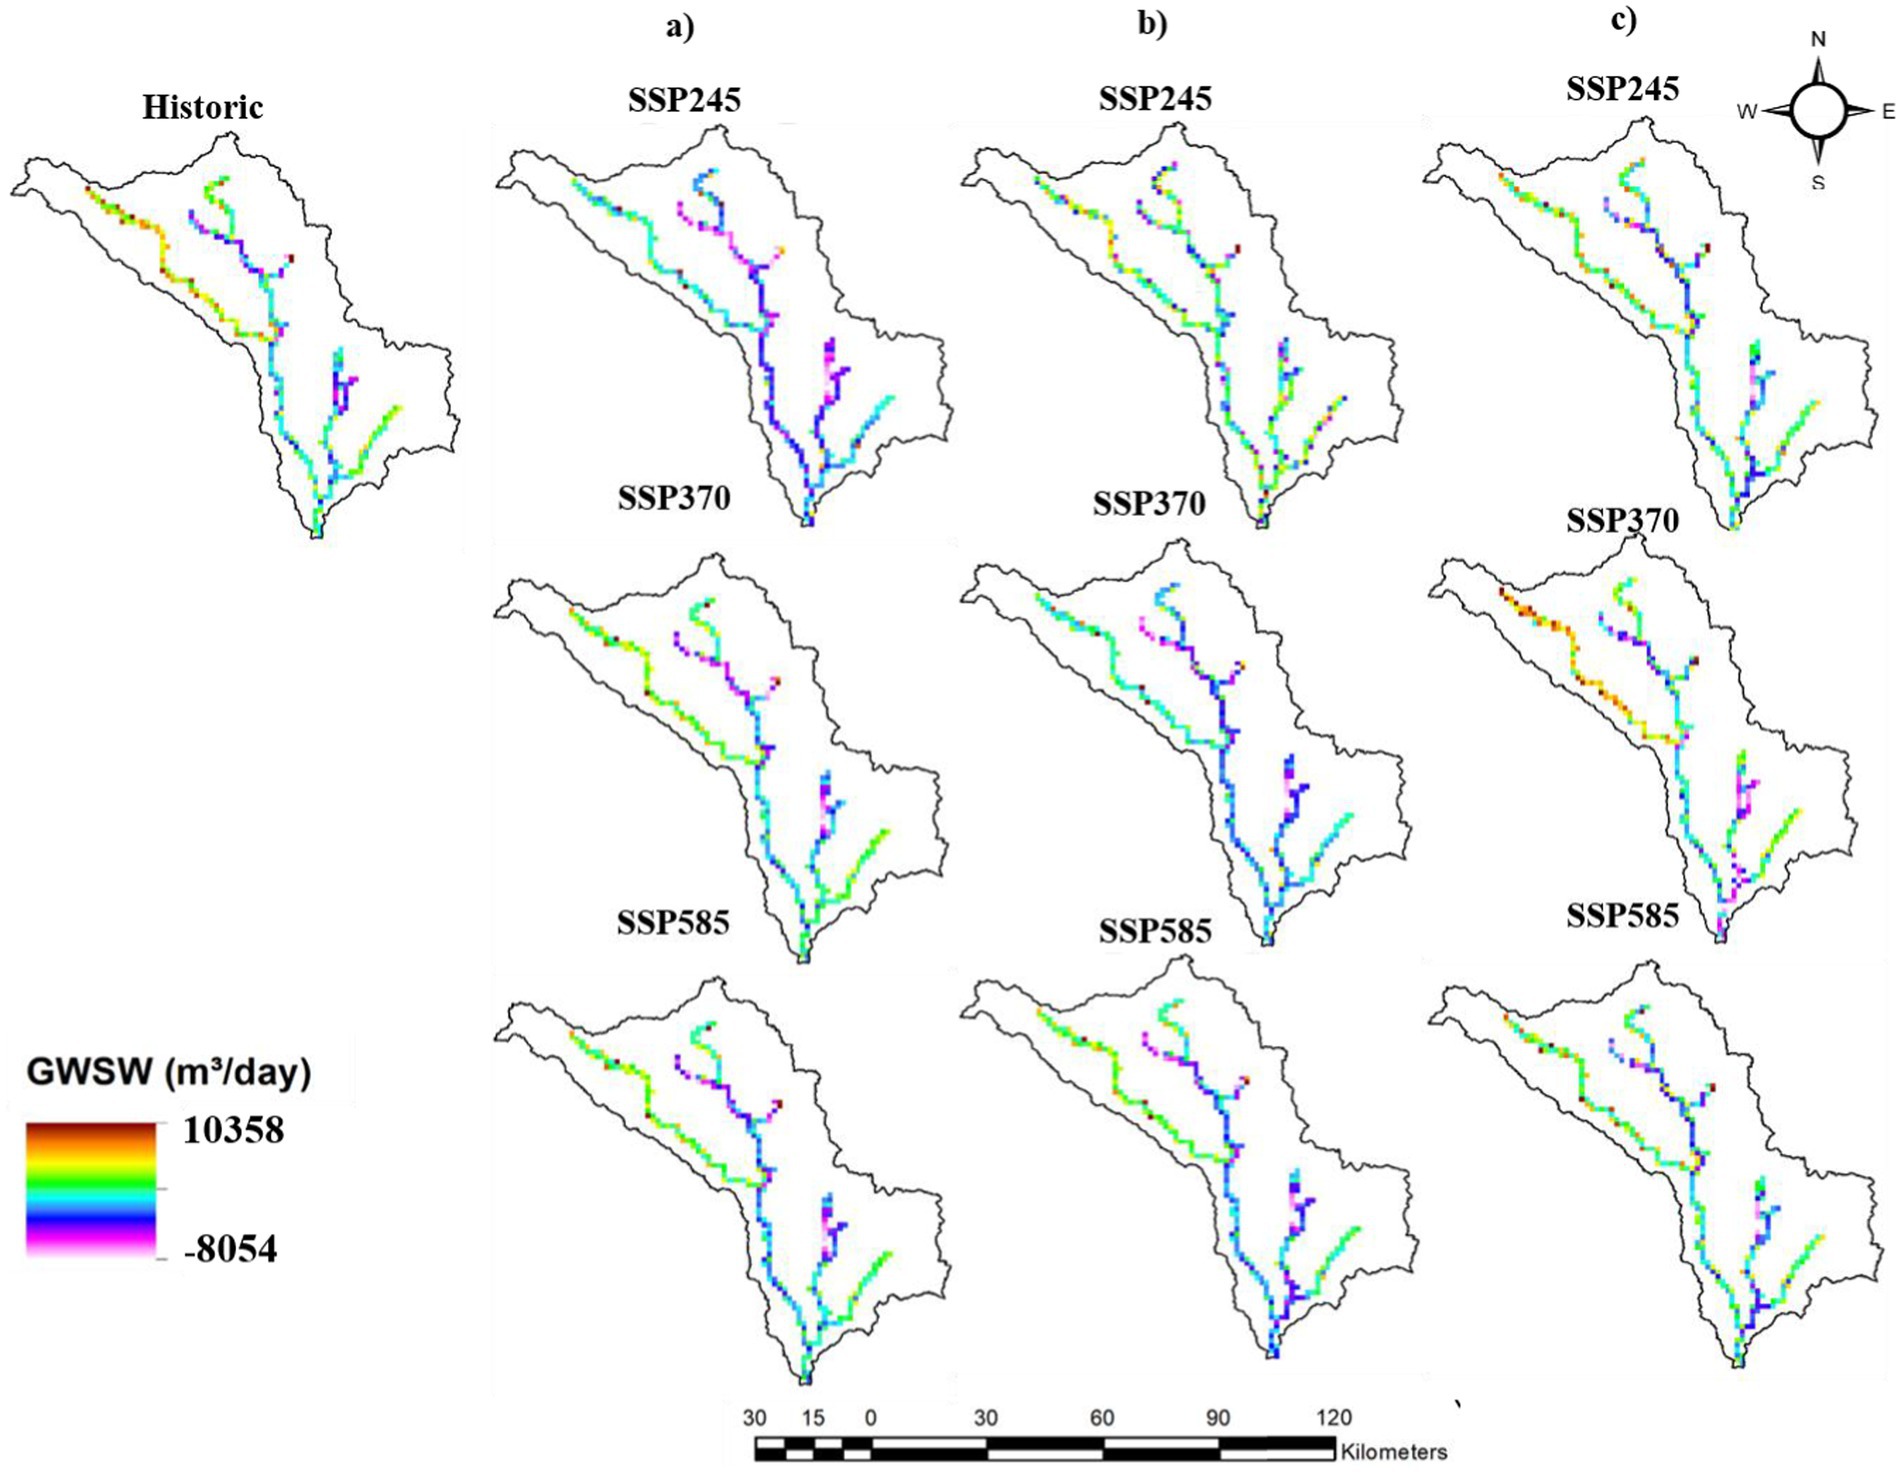
Figure 7. Groundwater and surface water interactions for post-monsoon kharif: (A) near future; (B) mid-future; and (C) far future.
Post-monsoon rabi
Groundwater and surface water interactions for post-monsoon rabi are shown in Figure 8 for three future periods under various SSPs: SSP2-4.5, SSP3-7.0, and SSP5-8.5. The groundwater recharge increased by 34.26, 38.96, and 39.48% in near future, mid-future, and far future periods when compared with the historic period under the SSP2-4.5 scenario. The groundwater recharge was increased by 63.71, 34.10, and 32.03% in near future, mid-future, and far future periods for SSP3-7.0. Similarly, in SSP5-8.5, the groundwater recharge was increased by 76.12, 0.25, and 3.77% in near future, mid-future, and far future periods. The groundwater discharge was more in post-monsoon rabi and the percentage change was moderate when compared with the historic period. The groundwater discharge was decreased in near future period by 21.93 and 0.58% in SSP2-4.5 and SSP3-7.0 and increased by 15.82% in SSP5-8.5. For the mid-future period, it was increased by 14.22% in SSP2-4.5 and decreased by 26.51 and 27.90% in SSP3-7.0 and SSP5-8.5. For the far future period, it was increased by 12.70 and 12.53% in SSP2-4.5 and SSP5-8.5 and decreased by 30.31% in SSP3-7.0.
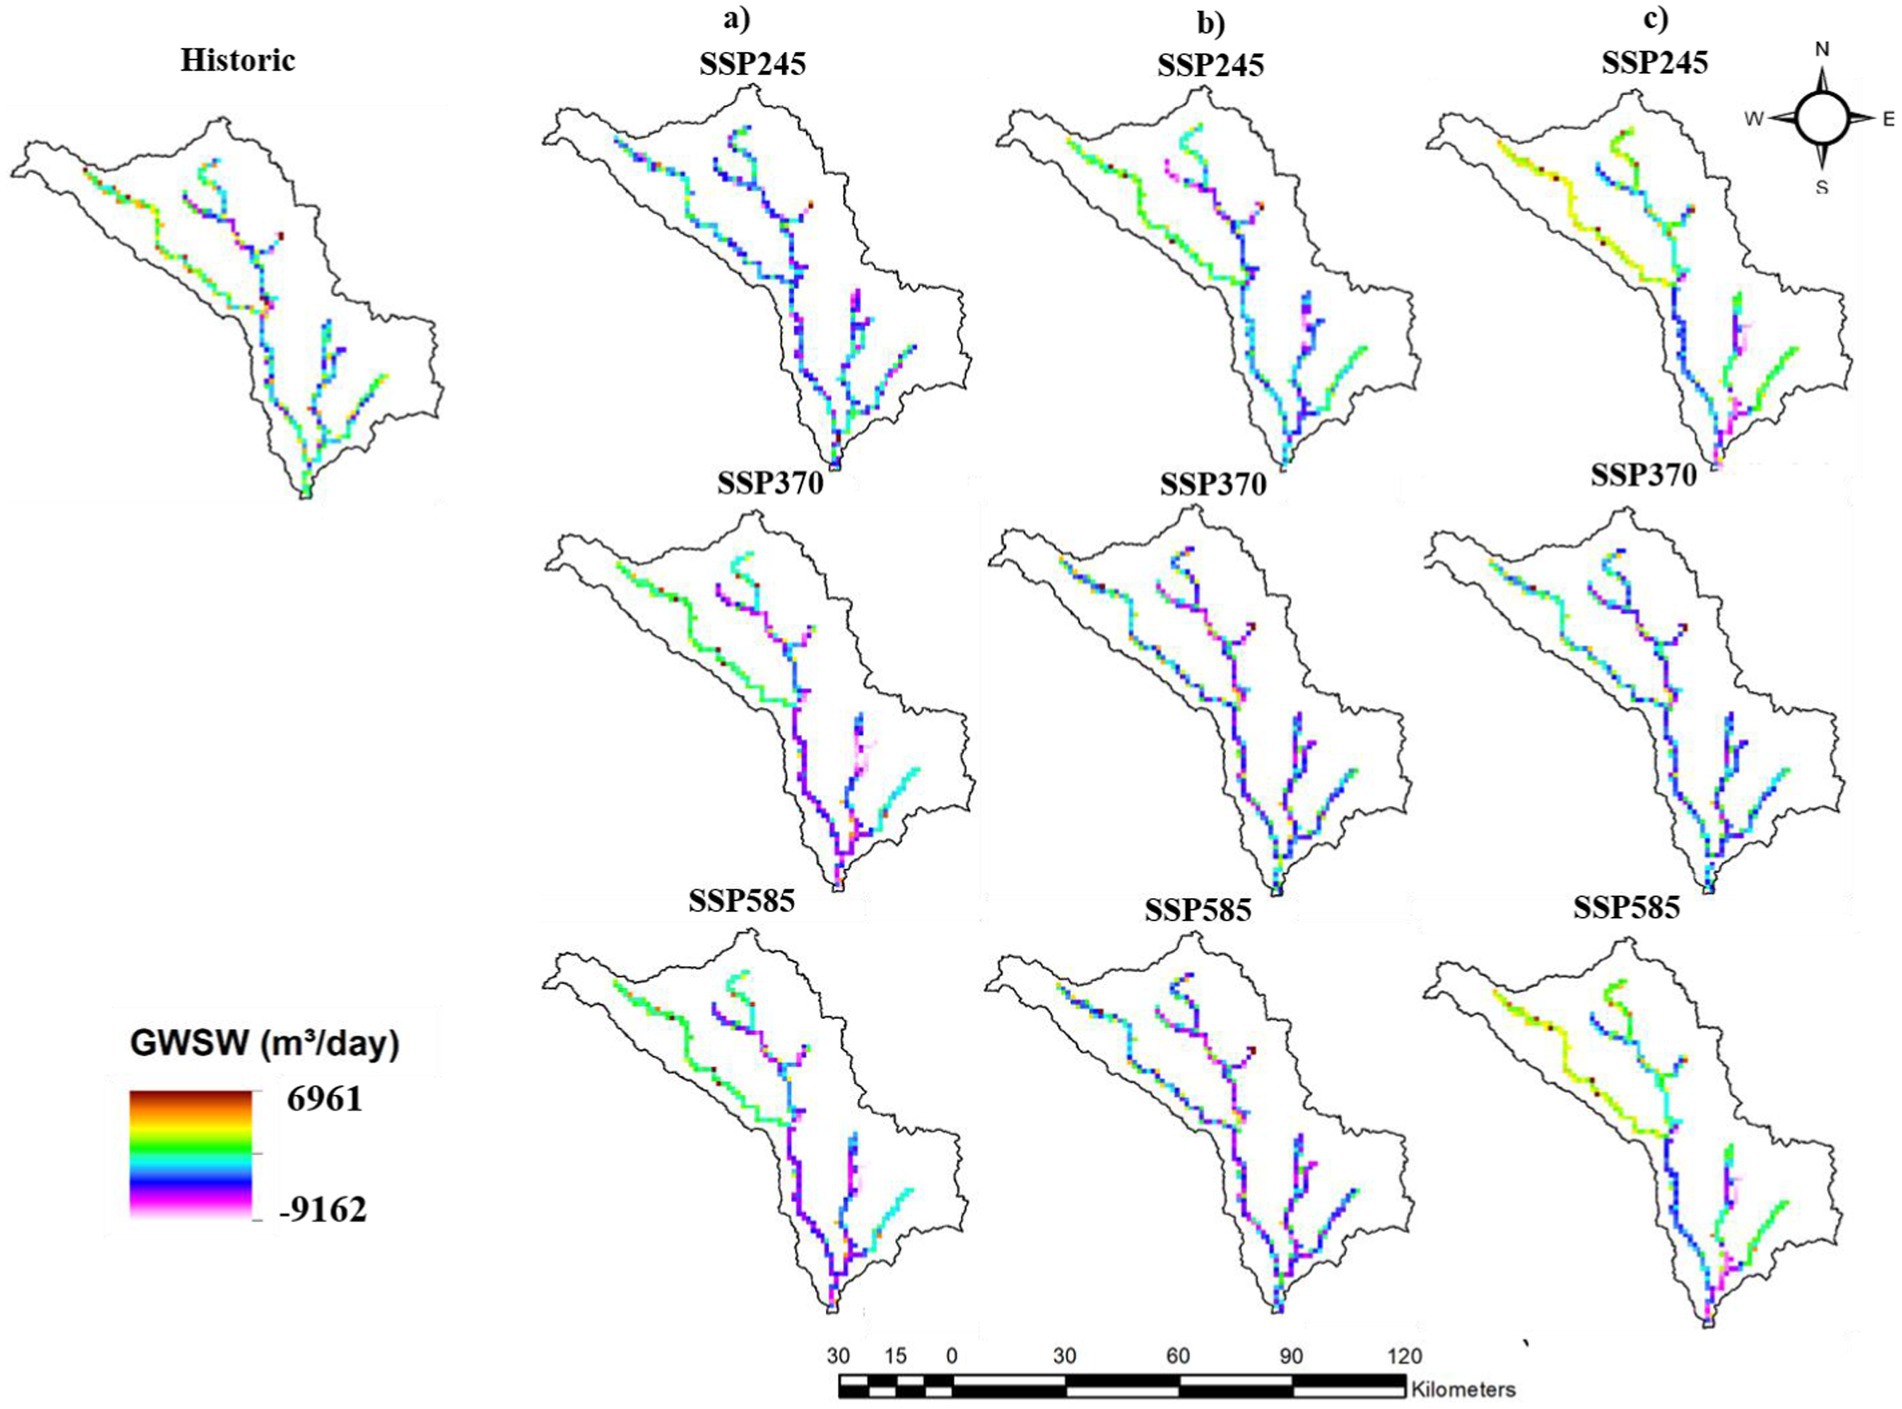
Figure 8. Groundwater and surface water interactions for post-monsoon rabi: (A) near future; (B) mid-future; and (C) far future.
Pre-monsoon
Groundwater and surface water interactions for pre-monsoon for three future periods under varying SSPs (SSP2-4.5, SSP3-7.0, and SSP5-8.5) are depicted in Figure 9. In the pre-monsoon season, both groundwater recharge and discharge were lower compared to other seasons. The percentage change in groundwater recharge and discharge was high when compared to the historic period. The groundwater recharge increased by 133.18, 109.53, and 90.64% in near future, mid-future, and far future periods when compared with the historic period under SSP2-4.5 scenario. The groundwater recharge was increased by 133.00, 148.23, and 115.23% in the near future, mid-future, and far future periods for SSP3-7.0. Similarly, in SSP5-8.5, the groundwater recharge was increased by 136.57, 85.71, and 89.05% in the near future, mid-future, and far future periods. The groundwater discharge was decreased in near future period by 70.31, 46.74, and 41.14% under SSP2-4.5, SSP3-7.0, and SSP5-8.5 scenarios. For the mid-future period, groundwater discharge was decreased by 44.47, 33.15, and 24.13% under SSP2-4.5, SSP3-7.0, and SSP5-8.5 scenarios. Similarly, for far future period, it was decreased by 41.14% and 10.59 under SSP2-4.5 and SSP5-8.5 scenarios and there was slight increase in discharge by 5.74% under SSP3-7.0.
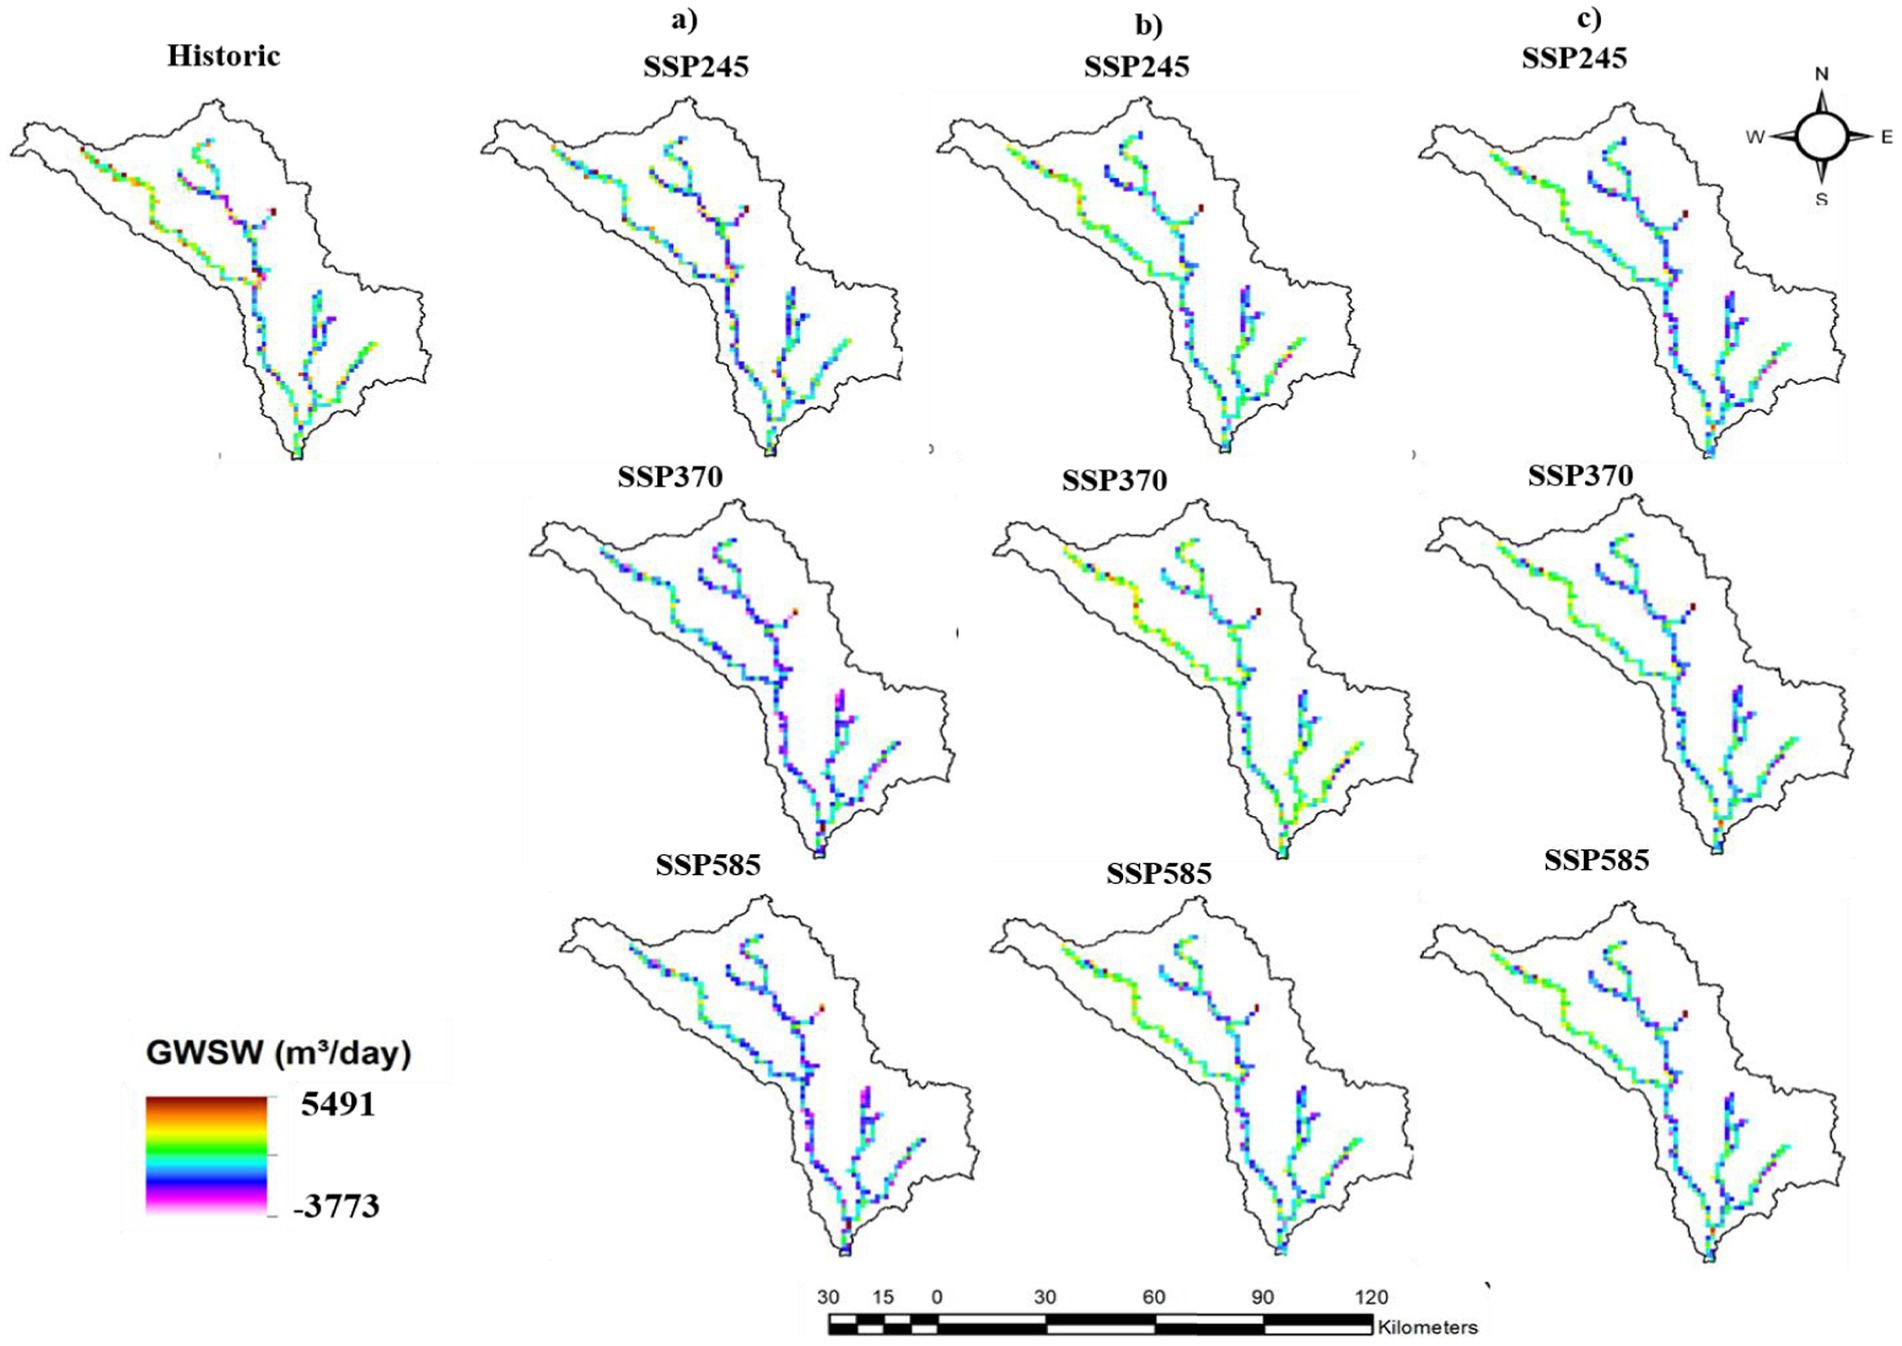
Figure 9. Groundwater and surface water interactions for pre-monsoon season: (A) near future; (B) mid-future; and (C) far future.
Table 2 represents the groundwater surface water interactions under climate change scenarios for three future periods. Under the SSP5-8.5 scenario, the highest recharge was observed during the monsoon season, with 20,805 m3/day in the near future period. The maximum discharge was observed in the post-monsoon rabi with 9,162 m3/day under SSP5-8.5 in the near future period. Groundwater and surface water interactions were lower in the pre-monsoon season when compared with other seasons. The lowest recharge and discharge were observed in pre-monsoon in all future periods. While there is a noticeable trend towards greater groundwater discharge in the mid-and far-future periods throughout all seasons, there is a slight increase in groundwater recharge in the near future, especially during the monsoon season.
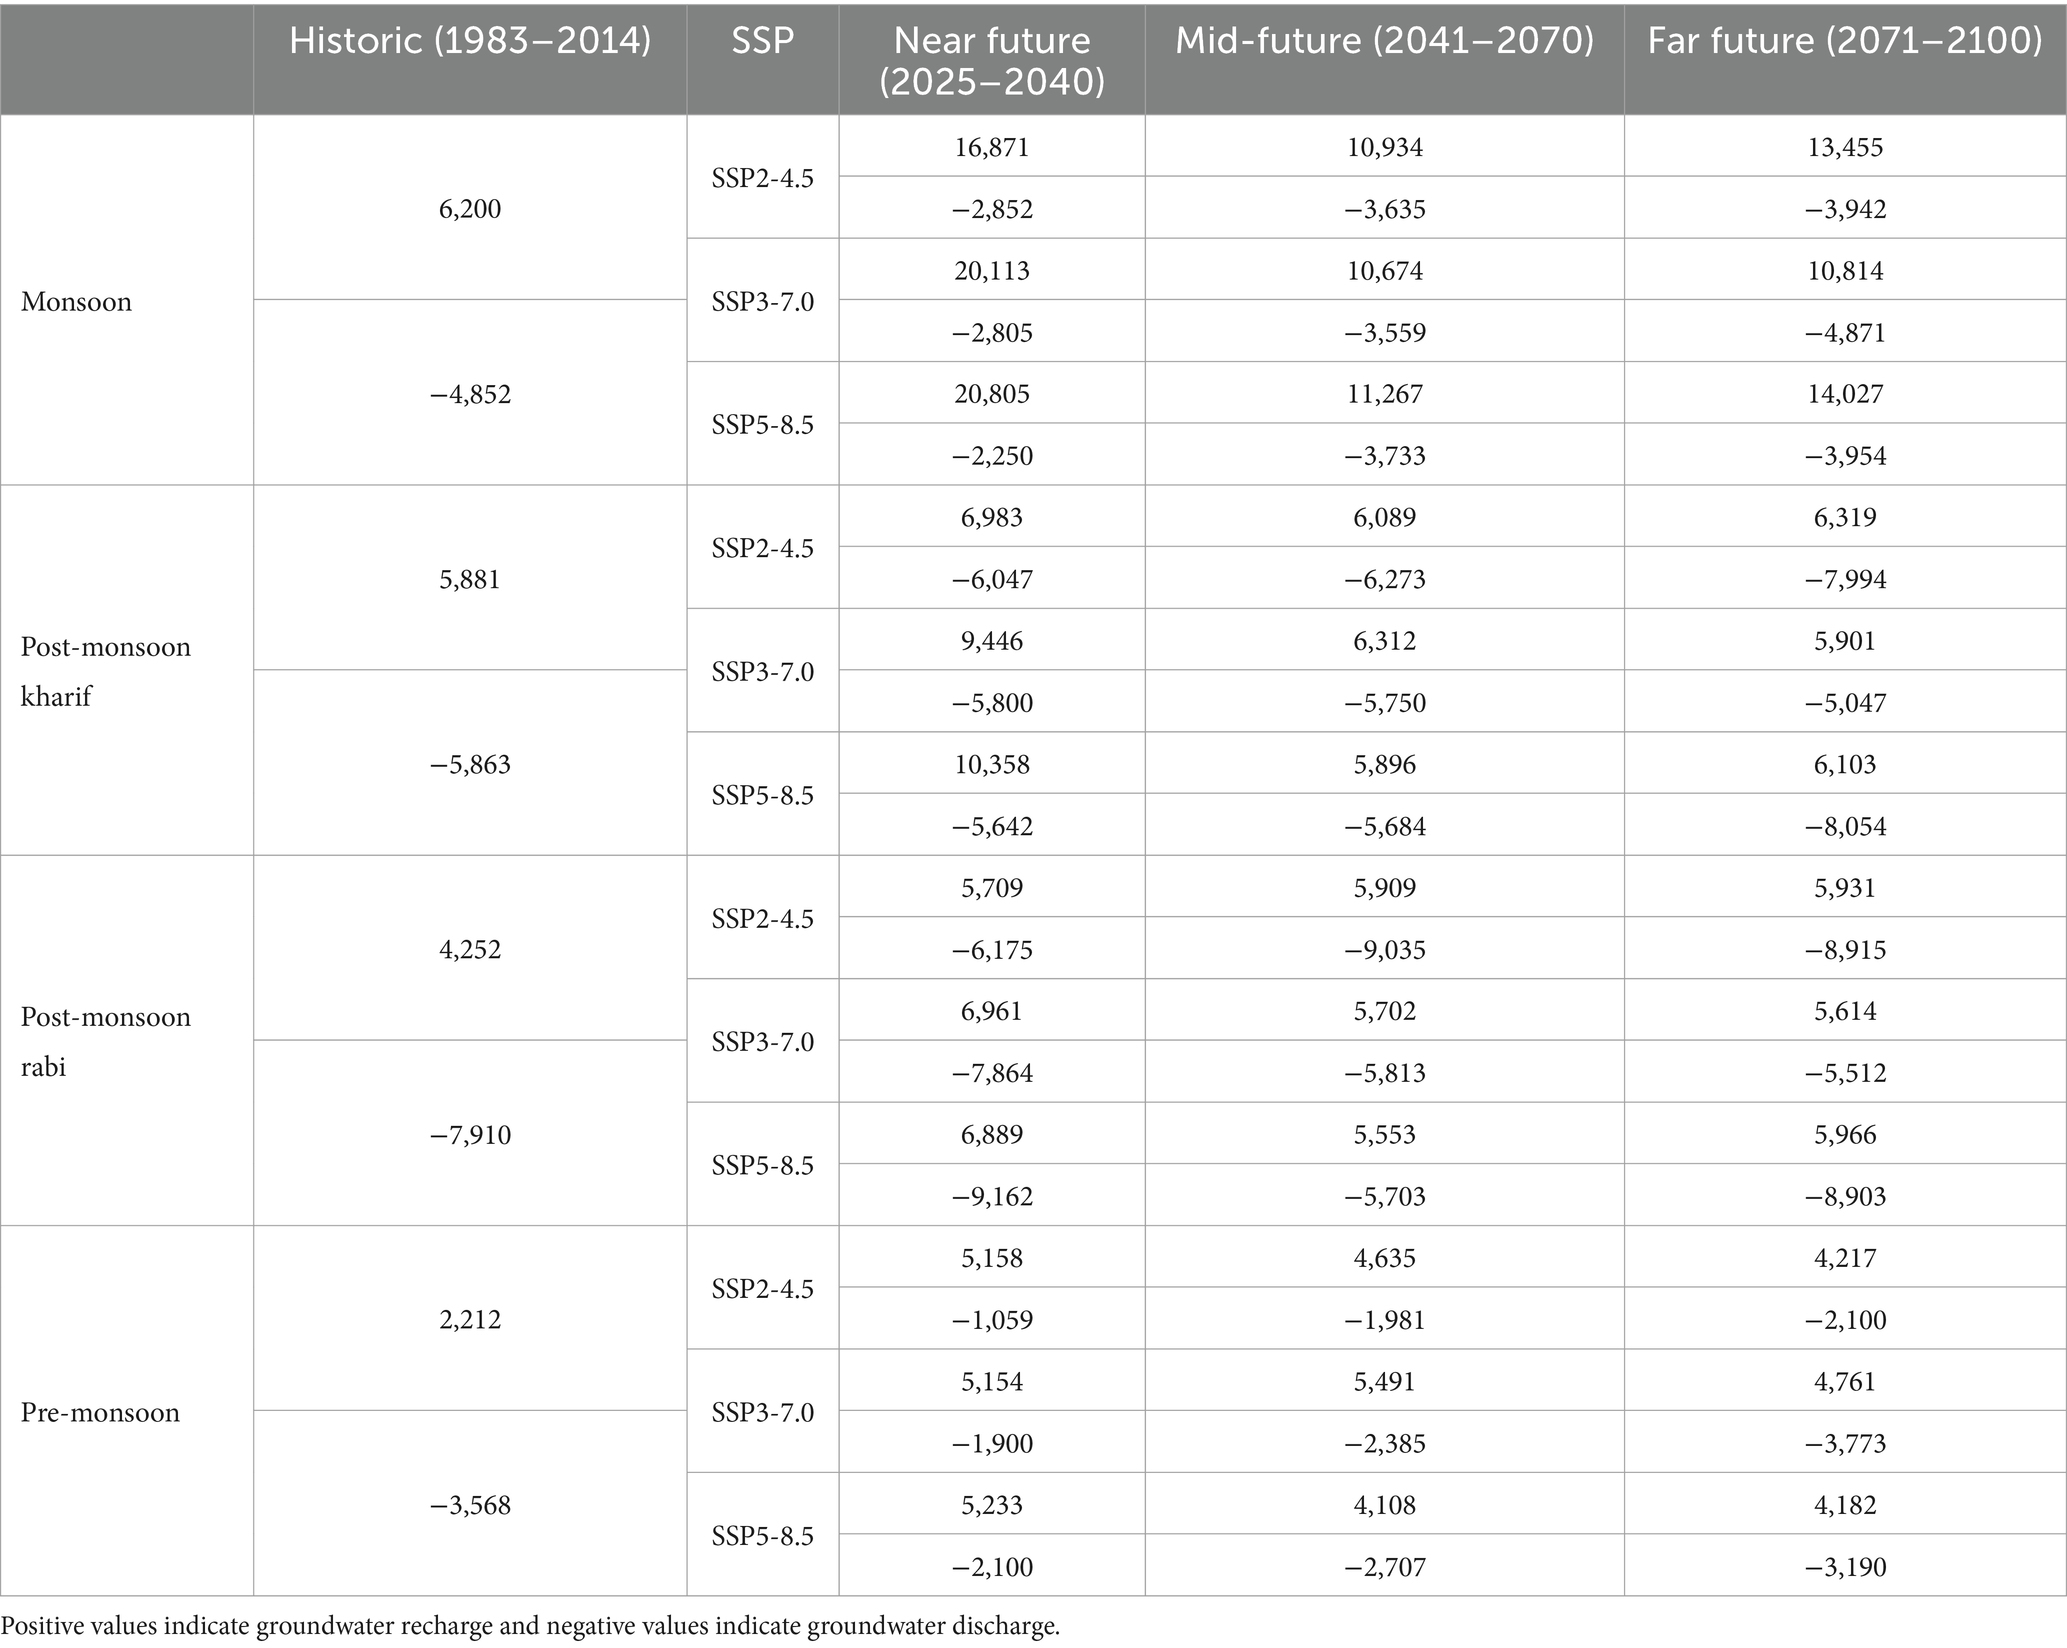
Table 2. Groundwater and surface water interactions (m3/day) under climate change scenarios for three future periods.
Groundwater–surface water interactions under both climate change and LULC scenarios
The groundwater and surface water interactions under both climate change and user defined LULC change scenarios were discussed in this section. For projecting interaction under both climate and LULC change, LULC scenario1 was used for near future period, LULC scenario 2 for mid-future, and LULC scenario3 for far future period.
Monsoon
Figure 10 illustrates groundwater and surface water interactions for the monsoon season for three future periods under both climate change and LULC. The maximum groundwater recharge was observed in this season when compared with other seasons. For SSP2-4.5, when compared with the historic period, the groundwater recharge was increased by 183.88, 107.75, and 123.37% in the near future, mid-future, and far future periods. The groundwater recharge was increased by 215.41, 85.35, and 77.74% in near future, mid-future, and far future periods for SSP3-7.0. Similarly, in SSP5-8.5, the groundwater recharge was increased by 203.98, 94.40, and 78.40% in near future, mid-future, and far future periods. The groundwater discharge was decreased in future periods when compared with the historic period. For near future period, it was decreased by 40.6 and 25.28% under SSP2-4.5 and SSP5-8.5 scenarios and increased by 20.56% under SSP3-7.0. For the mid-future period, groundwater discharge was decreased by 40.82, 33.36, and 24.62% under SSP2-4.5, SSP3-7.0, and SSP5-8.5 scenarios. Similarly, for the far future period, it was decreased by 38.29, 31.28, and 19.99% under SSP2-4.5, SSP3-7.0 and SSP5-8.5 scenario.
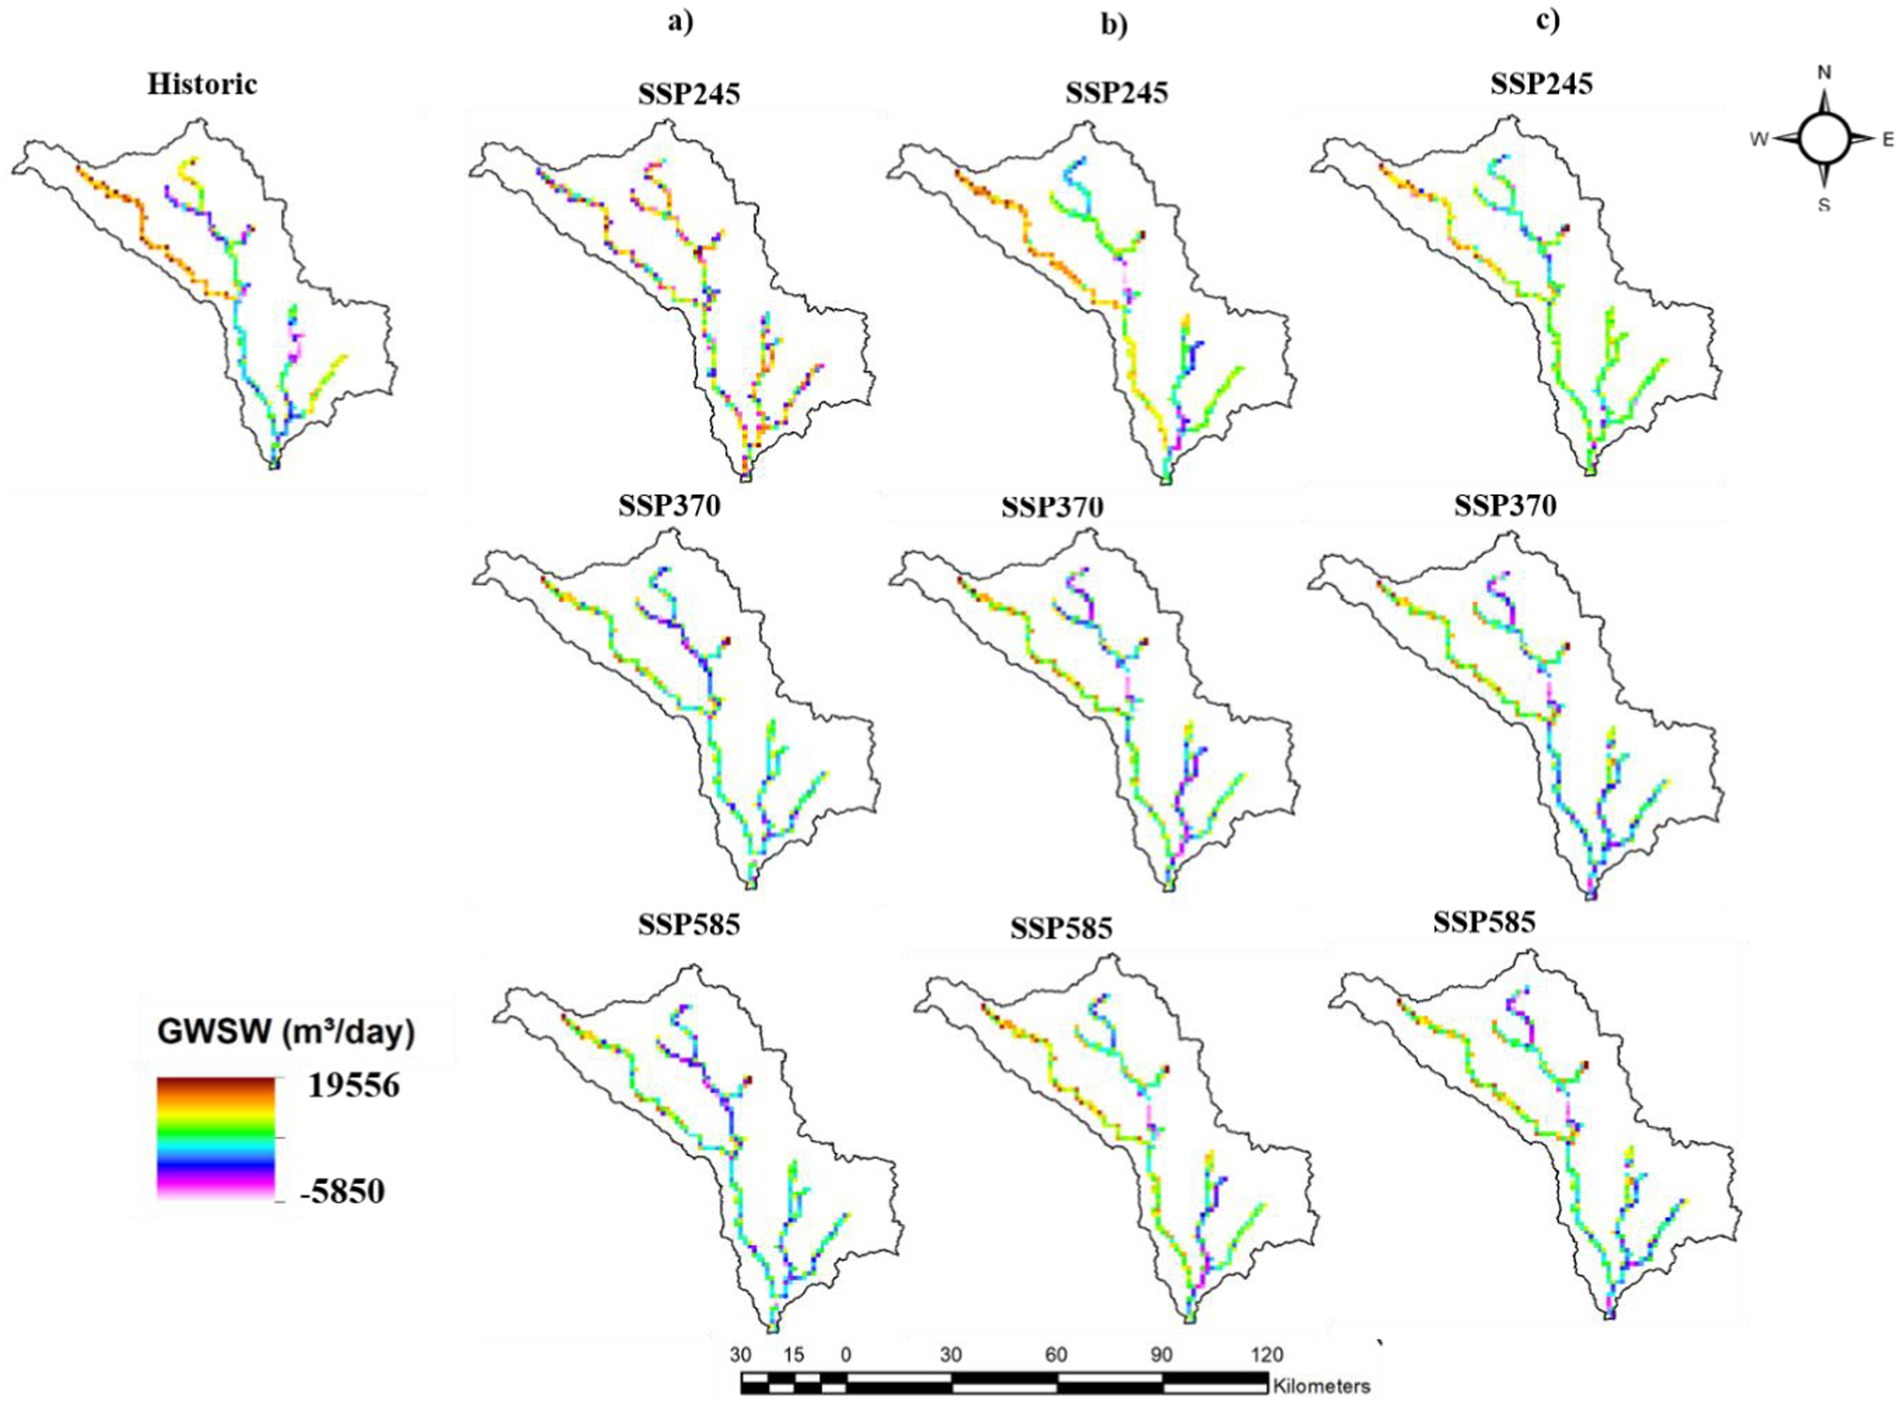
Figure 10. Groundwater and surface water interactions for monsoon season under both LULC and climate change: (A) near future; (B) mid-future; and (C) far future period.
Post-monsoon kharif
Figure 11 illustrates groundwater and surface water interactions for post-monsoon kharif under both climate change and LULC. The groundwater recharge was increased in future periods compared with the historic period for the post-monsoon kharif season and the maximum recharge was observed in SSP3-7.0 and SSP5-8.5 in the near future period. For SSP2-4.5, when compared with the historic period, the groundwater recharge was increased by 72.77 and 2.51% in near future and mid-future and decreased by 1.51% in far future period. The groundwater recharge was increased by 56.19, 5.71, and 4.48% in near future, mid-future, and far future periods for SSP3-7.0. Similarly, in SSP5-8.5, the groundwater recharge was increased by 48.58, 6.95, and 3.57% in the near future, mid-future, and far future periods. The groundwater discharge was increased in all three future periods when compared with the historic period. For the near future period, it was increased by 11.00, 33.89, and 19.89% under SSP2-4.5, SSP3-7.0, and SSP5-8.5 scenarios. For the mid-future period, groundwater discharge was increased by 12.55, 0.08, and 28.89% under SSP2-4.5, SSP3-7.0, and SSP5-8.5 scenarios. Similarly, for the far future period, it was increased by 51.25, 67.45, and 76.99% under SSP2-4.5, SSP3-7.0, and SSP5-8.5 scenarios.
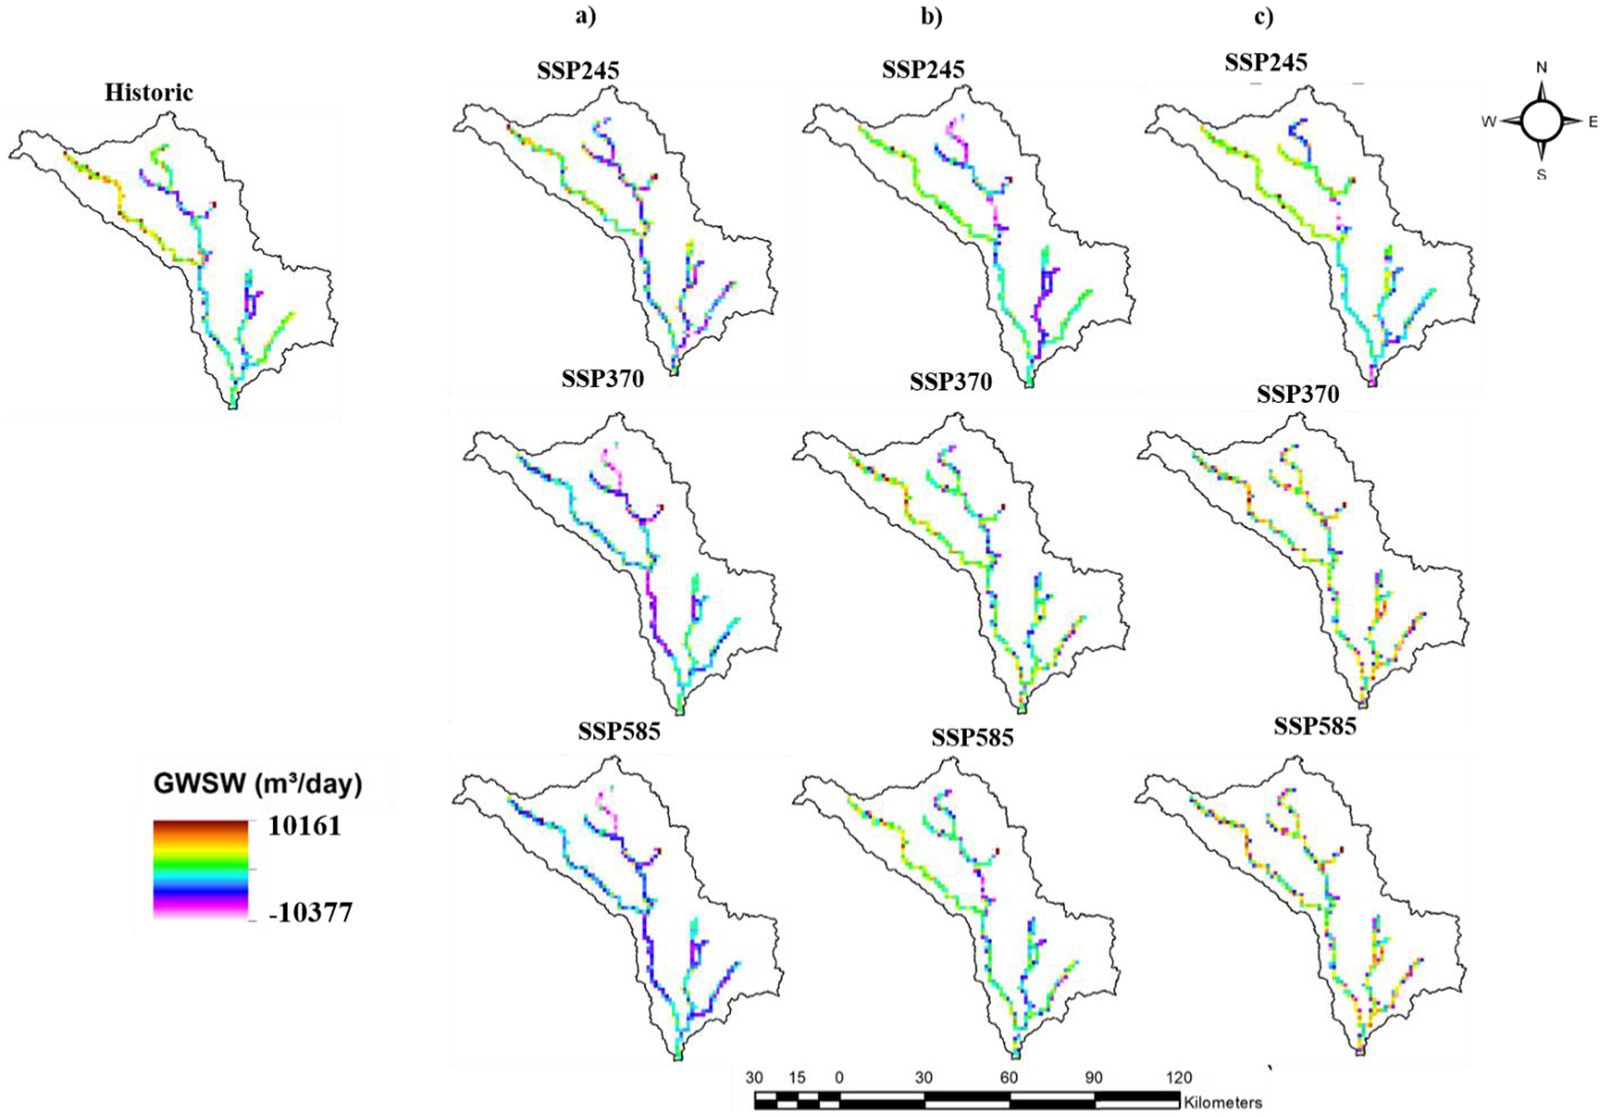
Figure 11. Groundwater and surface water interactions for post-monsoon Kharif under both LULC and climate change: (A) near future; (B) mid future; and (C) far future period.
Post-monsoon rabi
Figure 12 illustrates groundwater and surface water interactions for post-monsoon rabi season under both climate change and LULC scenarios. The groundwater recharge increased by 62.20, 35.32, and 20.67% in near future, mid-future, and far future periods when compared with the historic period under the SSP2-4.5 scenario. The groundwater recharge was increased by 69.02, 38.96, and 34.33% in the near future, mid-future, and far future periods for SSP3-7.0. Similarly, in SSP5-8.5, the groundwater recharge was increased by 62.74, 41.39, and 31.65% in the near future, mid-future, and far future periods. The groundwater discharge was more in post-monsoon rabi and the percentage change was moderate when compared with the historic period. The groundwater discharge was decreased in near future period by 5.68% in SSP2-4.5 and increased by 31.17 and 49.50% in SSP3-7.0 and SSP5-8.5 scenarios. For the mid-future period, it was increased by 14.22, 64.42, and 89.74% in SSP2-4.5, SSP3-7.0, and SSP5-8.5 scenarios. For the far future period, it was increased by 65.05, 28.14, and 50.59% in SSP2-4.5, SSP3-7.0, and SSP5-8.5 scenarios.
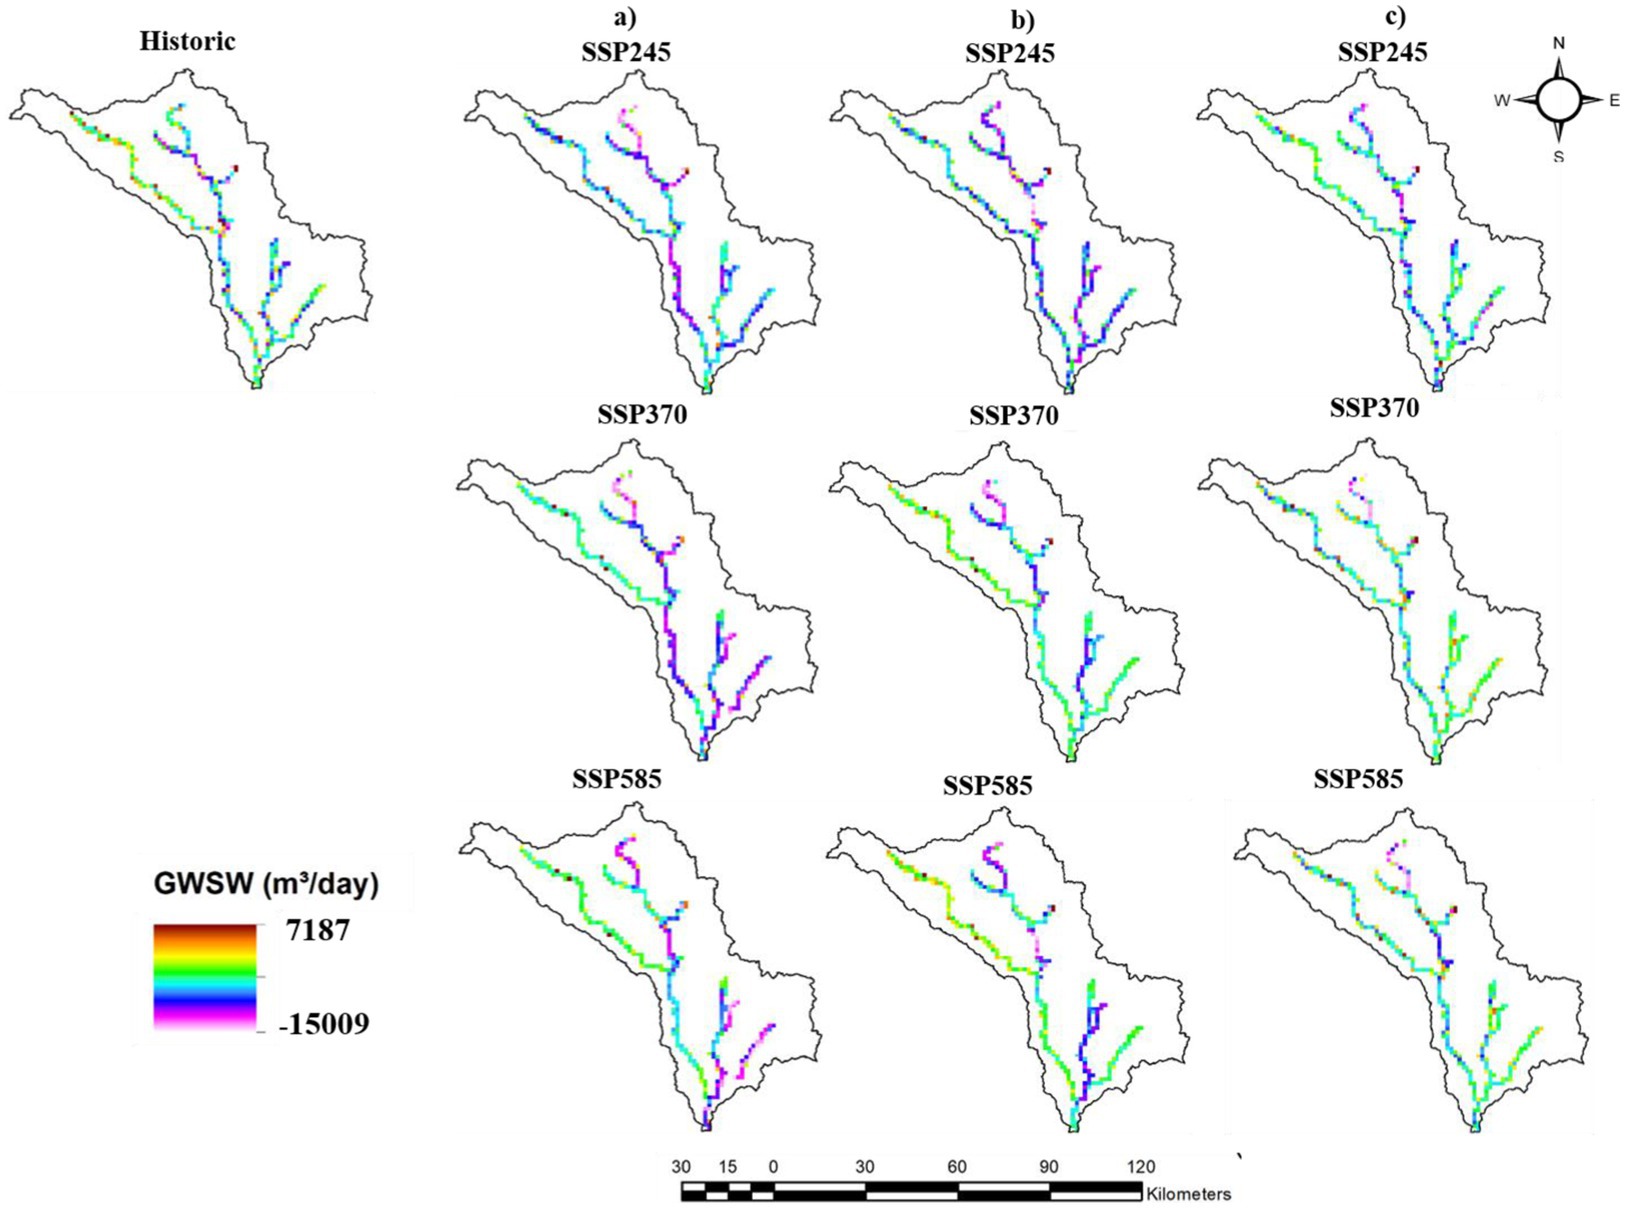
Figure 12. Groundwater and surface water interactions for post-monsoon rabi under both LULC and climate change: (A) near future; (B) mid-future; and (C) far future period.
Pre-monsoon
The groundwater and surface water interactions for pre-monsoon under both climate change and LULC was shown in the Figure 13. In the pre-monsoon season, both groundwater recharge and discharge were lower compared to other seasons. The percentage change in groundwater recharge and discharge was high when compared to the historic period. The groundwater recharge increased by 114.01, 108.31, and 90.55% in the near future, mid-future, and far future periods when compared with the historic period under the SSP2-4.5 scenario. The groundwater recharge was increased by 84.04, 124.41, and 78.97% in the near future, mid-future, and far future periods for SSP3-7.0. Similarly, in SSP5-8.5, the groundwater recharge was increased by 98.41, 124.59, and 61.12% in the near future, mid-future, and far future periods. The groundwater discharge was decreased in near future period by 72.28, 57.95, and 53.53% under SSP2-4.5, SSP3-7.0, and SSP5-8.5 scenarios. For the mid-future period, groundwater discharge was decreased by 25.84, 48.59, and 50% under SSP2-4.5, SSP3-7.0, and SSP5-8.5 scenarios. Similarly, for the far future period, it was decreased by 82.65, 69.92, and 21.32% under SSP2-4.5, SSP3-7.0 and SSP5-8.5 scenarios.
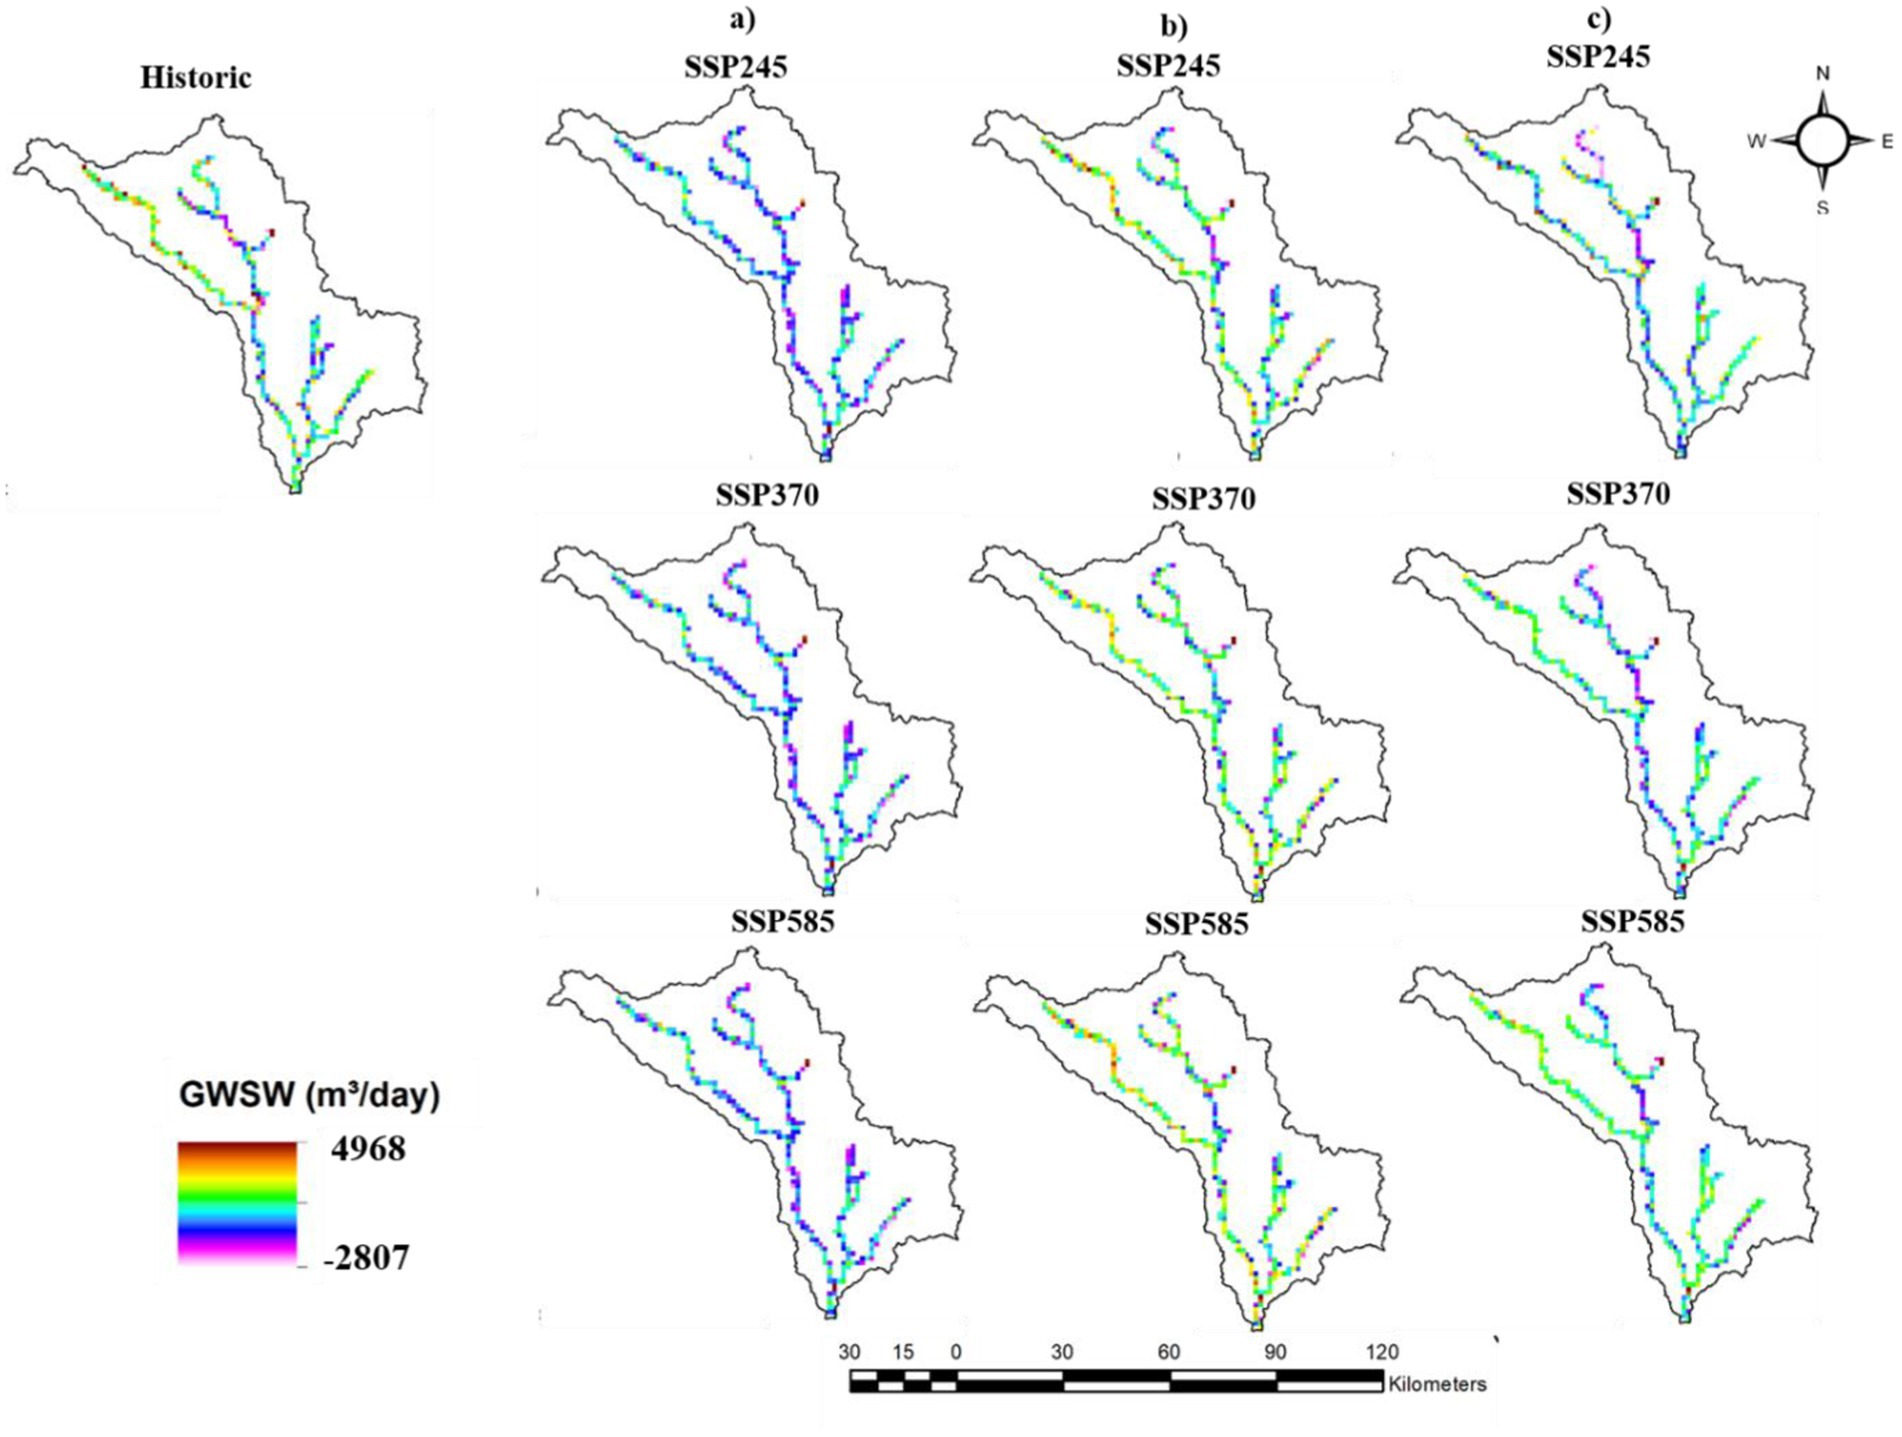
Figure 13. Groundwater and surface water interactions for pre-monsoon under both LULC and climate change: (A) near future; (B) mid-future; and (C) far future period.
Table 3 represents the groundwater surface water interactions under both climate change and LULC scenarios for three future periods. In SSP3-7.0, there is a significant increase in positive interaction values during the monsoon, indicating a higher recharge rate of 19,556 m3/day in the near future period. The post-monsoon rabi season shows a maximum discharge of 15,009 m3/day in the mid future under SSP5-8.5. Groundwater and surface water interactions were lower in the pre-monsoon season when compared with other seasons. The lowest recharge and discharge were observed in pre-monsoon in all future periods. While there is a noticeable trend towards greater groundwater discharge in the mid-and far future periods, throughout all the seasons, there is a slight increase in groundwater recharge in the near future, especially during the monsoon season.
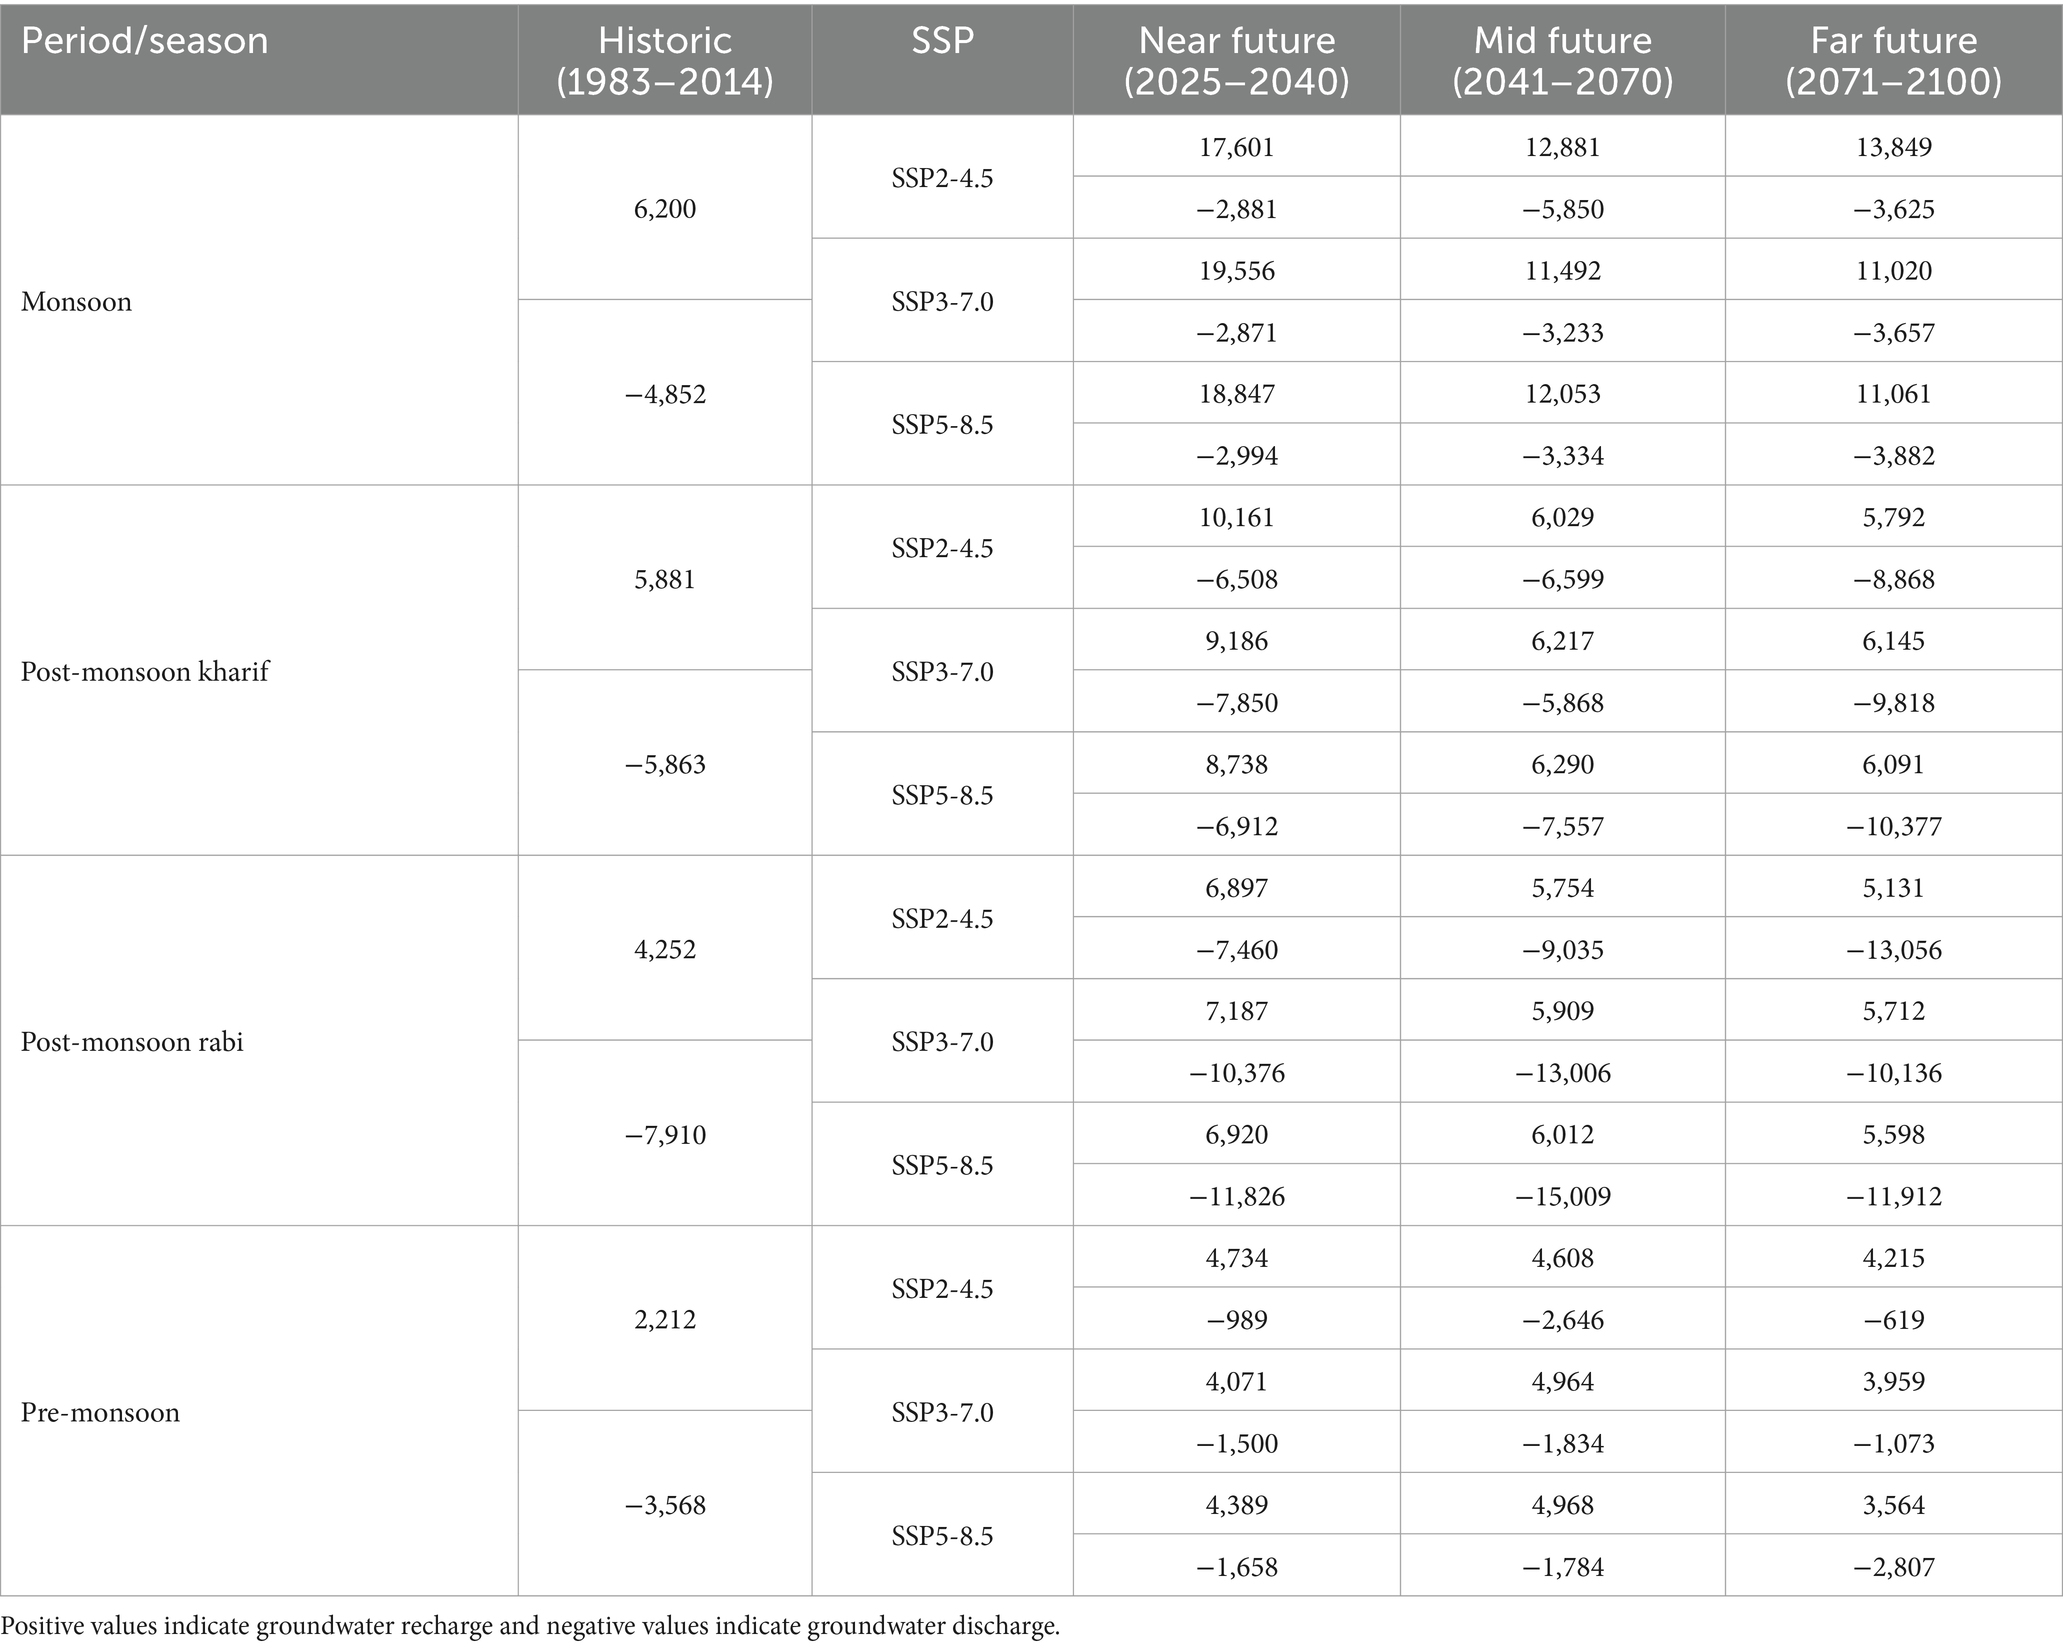
Table 3. Groundwater and surface water interactions (m3/day) under both climate change and LULC for three future periods.
The entire study area is considered as one aquifer, and the hydraulic conductivities of the river bed and the aquifer can be more spatially refined to get the best results. The model-computed groundwater–surface water interaction result can be improved by the validation of river aquifer interaction flow with field data/observations. The resolution of input data (e.g., climate, LULC, and soil parameters) can significantly influence model accuracy. Coarse spatial or temporal resolutions may have limited the ability to capture localised or short-term hydrological dynamics. The study’s reliance on predefined climate scenarios (SSPs) and LULC scenarios introduce potential bias in projecting future conditions. These scenarios may not fully represent all possible variations, particularly unexpected land-use changes or non-linear climatic shifts. While the models were calibrated and validated for historical data, there is no direct validation for future conditions. The extrapolation of results under changing climates and LULC scenarios inherently involves uncertainties. Anthropogenic factors such as groundwater extraction, irrigation practices, and policy interventions were not explicitly modelled. These factors can significantly influence surface and groundwater interactions.
Future studies should incorporate higher-resolution datasets for climate, LULC, and soil properties to improve the accuracy of model predictions. Conducting a comprehensive uncertainty analysis, including sensitivity testing for key parameters, can provide a clearer understanding of the robustness of the results. Future research should integrate human activities, such as groundwater pumping and land-use regulations, into the modelling framework to provide a more holistic assessment. Establishing long-term monitoring programmes can facilitate better validation of future projections and help refine models over time. Incorporating socioeconomic factors into LULC and water management scenarios can provide a more comprehensive view of future challenges and inform more actionable recommendations. These findings provide critical insights for developing integrated surface and groundwater management strategies to ensure sustainable water resources under changing climate and LULC conditions.
The findings have broader implications for environmental protection and the sustainable management of water resources, particularly in the context of climate change. Large watersheds are particularly vulnerable to the effects of climate change due to alterations in precipitation patterns, increased evapotranspiration, and the intensification of extreme events. Studies suggest that changing spatiotemporal precipitation patterns can reorganise river networks, influencing surface–groundwater interactions and the hydrological balance of entire basins (Abed-Elmdoust et al., 2016). For instance, the redistribution of groundwater recharge may shift discharge zones, impacting downstream water availability. Climate change also poses challenges to watershed-scale water resource planning, necessitating the identification of critical areas for hydrologic monitoring and adaptive management strategies (Singhal et al., 2024). This study’s grid-based groundwater discharge and recharge mapping can serve as a baseline for monitoring climate-induced changes in water availability and watershed health. For example, the construction of dams or other hydrological modifications may exacerbate ecological degradation and disrupt the connectivity of groundwater and surface water systems (Gao et al., 2022). By identifying hotspots of groundwater discharge and recharge, this research enables more informed decision-making for infrastructure placement and impact mitigation. Moreover, adapting watershed management strategies to account for long-term climate variability and anthropogenic pressures requires integrating insights from climatology and hydrological modelling (Sarker, 2022). Proactive planning, informed by this study, can help minimise the adverse effects of climate change on water availability and ecosystem services.
Conclusion
The interactions between surface and groundwater were simulated using the integrated SWAT and MODFOW model for the three future periods and the observed conditions under the LULC and climate change scenarios. The groundwater surface water interactions were analysed in four seasons out of which monsoon season, has maximum recharge and groundwater discharge was more in the post-monsoon rabi season. In climate change scenario the maximum recharge was observed in near future period under SSP5-8.5 scenario with 20,805 m3/day and maximum discharge in near future under SSP5-8.5 scenario with 9,162 m3/day. For the combined scenario, the maximum recharge rate was observed in SSP3-7.0 in the near future period with 19,556 m3/day and maximum discharge in mid-future period under SSP5-8.5 with 15,009 m3/day. In the monsoon season, the groundwater and surface water interactions generally decrease from the near future to the far future. However, scenarios that incorporate LULC changes tend to exhibit more pronounced reductions compared to only climate change scenarios. For example, SSP2-4.5 sees notable declines in mid-and far future periods, particularly when LULC changes are factored in. SSP3-7.0 and SSP5-8.5 follow similar trends, with initial higher values in the near future but a steady decrease over time. In post-monsoon kharif season, the interactions generally decline from the near future to the far future across all SSP scenarios (SSP2-4.5, SSP3-7.0, and SSP5-8.5). In SSP2-4.5, interactions decrease modestly without LULC changes, but more sharply when LULC is factored in, particularly in the far future where discharge reaches 8,868 m3/day. SSP3-7.0 follows a similar pattern, with high values in the near future but significant declines in the far future, especially when LULC changes cause discharge to 9,818 m3/day. SSP5-8.5 shows the highest initial values, but interactions also reduce notably over time, with LULC changes leading to the steepest decline, hitting 10,377 m3/day by the far future.
The post-monsoon rabi season shows a general decline in groundwater and surface water interactions across all SSP scenarios (SSP2-4.5, SSP3-7.0, and SSP5-8.5) from the near future to the far future. Under SSP2-4.5, interactions rise modestly in the near future but decrease significantly, particularly with LULC changes, where discharge increases drastically, reaching 13,056 m3/day by the far future. SSP3-7.0 shows similar trends, with discharge values intensifying under LULC changes, hitting 13,006 m3/day by the mid-future and 10,136 m3/day in the far future. SSP5-8.5 also exhibits large reductions in interactions, with discharge values plummeting under LULC changes, particularly in the far future, where it reaches 15,009 m3/day. Overall, LULC changes exacerbate the reduction in groundwater and surface water interactions, with sharp increases in discharge rates across all scenarios and time periods.
The pre-monsoon data reveals that groundwater and surface water interactions generally increase in the near future across all SSP scenarios (SSP2-4.5, SSP3-7.0, and SSP5-8.5) but decline in the mid-and far future periods. In SSP2-4.5, interactions rise in the near future (5,158 m3/day) but drop in the far future, especially under LULC changes, where discharge reaches 2,646 m3/day. SSP3-7.0 shows more variability, with interactions peaking in the mid-future scenario but discharge increasing significantly in the far future under LULC changes, reaching 3,773 m3/day. SSP5-8.5 follows a similar trend, with modest gains in the near future but notable reductions in the mid-and far future, where discharge under LULC changes hits 2,807 m3/day. Overall, LULC changes exacerbate the reduction in interactions, leading to greater discharge, particularly in the far future across all scenarios. In light of the projected LULC under climate change scenarios, the study’s findings can be used to plan and develop short-term and long-term integrated water management strategies for the basin.
Data availability statement
The raw data supporting the conclusions of this article will be made available by the authors without undue reservation.
Author contributions
KL: Conceptualization, Data curation, Formal analysis, Investigation, Methodology, Software, Visualization, Writing – original draft, Writing – review & editing. VK: Conceptualization, Data curation, Funding acquisition, Investigation, Methodology, Project administration, Software, Supervision, Validation, Writing – original draft, Writing – review & editing. EB: Data curation, Formal analysis, Investigation, Methodology, Software, Visualization, Writing – original draft, Writing – review & editing. VS: Conceptualization, Supervision, Validation, Writing – review & editing.
Funding
The author(s) declare that financial support was received for the research, authorship, and/or publication of this article. The corresponding author was funded by the United States India Educational Foundation as Fulbright-Nehru senior scholar.
Conflict of interest
The authors declare that the research was conducted in the absence of any commercial or financial relationships that could be construed as a potential conflict of interest.
Generative AI statement
The authors declare that no Gen AI was used in the creation of this manuscript.
Publisher’s note
All claims expressed in this article are solely those of the authors and do not necessarily represent those of their affiliated organizations, or those of the publisher, the editors and the reviewers. Any product that may be evaluated in this article, or claim that may be made by its manufacturer, is not guaranteed or endorsed by the publisher.
References
Abed-Elmdoust, A., Miri, M. A., and Singh, A. (2016). Reorganization of river networks under changing spatiotemporal precipitation patterns: an optimal channel network approach. Water Resour. Res. 52, 8845–8860. doi: 10.1002/2015WR018391
Aliyari, F., Bailey, R. T., Tasdighi, A., Dozier, A., Arabi, M., and Zeiler, K. (2019). Coupled SWATMODFLOW model for large-scale mixed agro-urban river basins. Environ. Model. Softw. 115, 200–210. doi: 10.1016/j.envsoft.2019.02.014
Aouissi, J., Benabdallah, S., Lili Chabaâne, Z., and Cudennec, C. (2016). Evaluation of potential evapotranspiration assessment methods for hydrological modelling with SWAT—application in data-scarce rural Tunisia. Agric. Water Manag. 174, 39–51. doi: 10.1016/J.AGWAT.2016.03.004
Bailey, R., and Park, S., (2019). SWAT-MODFLOW tutorial version 3 documentation for preparing and running SWAT-MODFLOW simulations. Fort Collins, CO, USA: Department of Civil and Environmental Engineering, Colorado State University. 1–89.
Brunner, P., and Simmons, C. T. (2012). Hydro geo sphere: a fully integrated. Phys. Based Hydrol. Model 13, 455–469. doi: 10.1111/j.1745-6584.2011.00882.x
Buri, E. S., Keesara, V. R., and Loukika, K. N. (2022). Long-term trend analysis of observed gridded precipitation and temperature data over Munneru River basin, India. J. Earth Syst. Sci. 131:115. doi: 10.1007/s12040-022-01864-7
Chang, S. W., and Chung, I. M. (2021). Water budget analysis considering surface water–groundwater interactions in the exploitation of seasonally varying agricultural groundwater. Hydrology 8:60. doi: 10.3390/hydrology8020060
Chen, S., Huang, J., and Huang, J.-C. (2023). Improving daily streamflow simulations for datascarce watersheds using the coupled SWAT-LSTM approach. J. Hydrol. (Amst.) 622:129734. doi: 10.1016/J.JHYDROL.2023.129734
Chunn, D., Faramarzi, M., Smerdon, B., and Alessi, D. S. (2019). Application of an integrated SWAT–MODFLOW model to evaluate potential impacts of climate change and water withdrawals on groundwater–surface water interactions in West-Central Alberta. Water 11:110. doi: 10.3390/w11010110
Dakhlalla, A. O., and Parajuli, P. B. (2019). Assessing model parameters sensitivity and uncertainty of streamflow, sediment, and nutrient transport using SWAT. Inf. Process. Agric. 6, 61–72. doi: 10.1016/J.INPA.2018.08.007
Gao, F., Feng, G., Han, M., Dash, P., Jenkins, J., and Liu, C. (2019). Assessment of surface water resources in the big sunflower river watershed using coupled SWAT–MODFLOW model. Water 11:528. doi: 10.3390/w11030528
Gao, Y., Sarker, S., Sarker, T., and Leta, O. T. (2022). Analyzing the critical locations in response of constructed and planned dams on the Mekong River basin for environmental integrity. Environ. Res. Commun. 4:101001. doi: 10.1088/2515-7620/ac9459
Haque, A., Salama, A., Lo, K., and Wu, P. (2021). Surface and groundwater interactions: a review of coupling strategies in detailed domain models. Hydrology 8:35. doi: 10.3390/hydrology8010035
Jia, W., Yin, L., Zhang, M., Zhang, X., Zhang, J., Tang, X., et al. (2021). Quantification of groundwater recharge and evapotranspiration along a semi-arid wetland transect using diurnal water table fluctuations. J. Arid. Land 13, 455–469. doi: 10.1007/s40333-021-0100-7
Kang, H., and Sridhar, V. (2019). Drought assessment with a surface-groundwater coupled model in the Chesapeake Bay watershed. Environ. Model Softw. 119, 379–389. doi: 10.1016/j.envsoft.2019.07.002
Kang, H., Sridhar, V., and Ali, S. A. (2022). Climate change impacts on flash droughts in the Mekong River basin. Sci. Total Environ. 838:155845. doi: 10.1016/j.scitotenv.2022.155845
Loukika, K. N., Keesara, V. R., Buri, E. S., and Sridhar, V. (2022). Predicting the effects of land use land cover and climate change on Munneru River basin using CA-Markov and soil and water assessment tool. Sustain. For. 14:5000. doi: 10.3390/su14095000
Loukika, K. N., Keesara, V. R., Buri, E. S., and Sridhar, V. (2023). Future prediction of scenario based land use land cover (LU& LC) using dyna CLUE model for a river basin. Eco. Inform. 77:102223. doi: 10.1016/j.ecoinf.2023.102223
Nugraha, G. U., Ridwansyah, I., Marganingrum, D., Hartanto, P., Lubis, R. F., and Bakti, H. (2021). “Transport modelling in Jakarta Groundwater Basin using QSWATMOD” in IOP conference series: earth and environmental science (Bristol: IOP Publishing Ltd.).
Park, S., Nielsen, A., Bailey, R. T., Trolle, D., and Bieger, K. (2019). A QGIS-based graphical user interface for application and evaluation of SWAT-MODFLOW models. Environ. Model Softw. 111, 493–497. doi: 10.1016/j.envsoft.2018.10.017
Sabzzadeh, I., and Shourian, M. (2020). Maximizing crops yield net benefit in a groundwaterirrigated plain constrained to aquifer stable depletion using a coupled PSO-SWATMODFLOW hydro-agronomic model. J. Clean. Prod. 262:121349. doi: 10.1016/j.jclepro.2020.121349
Sarker, S. (2022). Fundamentals of climatology for engineers: lecture note. Eng 3, 573–595. doi: 10.3390/eng3040040
Satish Kumar, K., Anand Raj, P., Sreelatha, K., Bisht, D. S., and Sridhar, V. (2021). Monthly and seasonal drought characterization using GRACE-based groundwater drought index and its link to teleconnections across south Indian river basins. Climate 9:56. doi: 10.3390/cli9040056
Semenova, O., and Beven, K. (2015). Barriers to progress in distributed hydrological modelling. Hydrol. Process. 29, 2074–2078. doi: 10.1002/hyp.10434
Setti, S., Maheswaran, R., Radha, D., Sridhar, V., Barik, K. K., and Narasimham, M. L. (2020a). Attribution of hydrologic changes in a tropical river basin to climate and land use change: a case study from India. ASCE J. Hydrol. Eng. 25:05020015. doi: 10.1061/(ASCE)HE.1943-5584.0001937
Setti, S., Maheswaran, R., Sridhar, V., Barik, K. K., Merz, B., and Agarwal, A. (2020b). Inter-comparison of gauge-based gridded data, reanalysis and satellite precipitation product with an emphasis on hydrological modelling. Atmos. 11:1252. doi: 10.3390/atmos11111252
Shrestha, S., Bach, T. V., and Pandey, V. P. (2016). Climate change impacts on groundwater resources in Mekong Delta under representative concentration pathways (RCPs) scenarios. Environ. Sci. Pol. 61, 1–13. doi: 10.1016/j.envsci.2016.03.010
Singhal, A., Jaseem, M., Divya Sarker, S., Prajapati, P., Singh, A., and Jha, S. K. (2024). Identifying potential locations of hydrologic monitoring stations based on topographical and hydrological information. Water Resour. Manag. 38, 369–384. doi: 10.1007/s11269-023-03675-x
Sridhar, V., Ali, S. A., and Lakshmi, V. (2019). Assessment and validation of total water storage in the Chesapeake Bay watershed using GRACE. J. Hydrol. Reg. Stud. 24:100607. doi: 10.1016/j.ejrh.2019.100607
Sridhar, V., Billah, M. M., and Hildreth, J. (2018). Coupled surface and groundwater hydrological modeling in a changing climate. Groundwater 56, 618–635. doi: 10.1111/gwat.12610
Taie Semiromi, M., and Koch, M. (2019). Analysis of spatio-temporal variability of surface–groundwater interactions in the Gharehsoo river basin, Iran, using a coupled SWAT-MODFLOW model. Environ. Earth Sci. 78:201. doi: 10.1007/s12665-019-8206-3
Keywords: basin, climate change, groundwater, interactions, LULC, MODFLOW, scenarios, SWAT
Citation: Loukika KN, Keesara VR, Buri ES and Sridhar V (2025) Spatiotemporal variations of surface and groundwater interactions under climate and land use land cover change scenarios. Front. Water. 6:1516031. doi: 10.3389/frwa.2024.1516031
Edited by:
Christopher E. Ndehedehe, Griffith University, AustraliaReviewed by:
Shiblu Sarker, Virginia Department of Conservation and Recreation, United StatesS. K. Pramada, National Institute of Technology Calicut, India
Copyright © 2025 Loukika, Keesara, Buri and Sridhar. This is an open-access article distributed under the terms of the Creative Commons Attribution License (CC BY). The use, distribution or reproduction in other forums is permitted, provided the original author(s) and the copyright owner(s) are credited and that the original publication in this journal is cited, in accordance with accepted academic practice. No use, distribution or reproduction is permitted which does not comply with these terms.
*Correspondence: Venkataramana Sridhar, dnNyaUB2dC5lZHU=