 Mihai Valentin Herbei1
 Codruța Bădăluță-Minda2Cosmin Alin Popescu1Adina Horablaga1*Lucian Octavian Dragomir1*George Popescu1Shuraik Kader3,4
 Paul Sestras5,6,7
- 1Department of Sustainable Development and Environmental Engineering, University of Life Sciences “King Mihai I” from Timisoara, Timisoara, Romania
- 2Department of Hydrotehnical, Politehnica University Timisoara, Timisoara, Romania
- 3School of Engineering and Built Environment, Griffith University, Nathan, QLD, Australia
- 4Green Infrastructure Research Labs (GIRLS), Cities Research Institute, Griffith University, Gold Coast, QLD, Australia
- 5Faculty of Civil Engineering, Technical University of Cluj-Napoca, Cluj-Napoca, Romania
- 6Faculty of Forestry and Cadastre, University of Agricultural Sciences and Veterinary Medicine Cluj-Napoca, Cluj-Napoca, Romania
- 7Academy of Romanian Scientists, Bucharest, Romania
The Hydrologic Modeling System (HEC-HMS), designed to accurately simulate precipitation-runoff processes in various watershed types, was employed in our study to establish a model for a particular watershed. Consequently, we planned to create a rainfall-runoff model to investigate the specific characteristics of floods, assess some pre-diction models, and issue assumptions about their viability, which could be beneficial in establishing flood warning systems. The model was developed using daily precipitation data collected from different rain gauge stations in the Gilort watershed, located in southern Romania. The study employed the HEC-GeoHMS terrain processing tool, utilizing a digital elevation design to build a hydrological model. The statistical indicators used to evaluate the runoff mechanisms, specifically regression, coefficient of determination, correlation coefficient, index of agreement (Willmott index), and the root mean squared error (RMSE), showed a strong relationship between the simulated and recorded flow of the watershed. The leaking model was assessed using other statistical parameters, including the deviation of runoff volumes (Dv = 6.40%), Nash−Sutcliffe efficiency (NSE = 0.908), and Kling-Gupta efficiency (KGE = 0.901). These parameters confirmed that the simulated data closely matched the observed data, indicating an effective association, and were considered reliable indicators of the model’s goodness of fit, ensuring its reliability and efficacy.
1 Introduction
Floods are typically responsible for around one-third of all global disasters. Unfortunately, these extraordinary phenomena spread quickly, and it is predicted that both the frequency and intensity of damage will increase in the future (Jonkman, 2005; Bronstert, 2003; Angelakis et al., 2023; Balica et al., 2023). Floods are the predominant form of natural calamity, arising from the inundation of territory that is typically dry due to an excess of water (Dixit, 2003; Merz et al., 2021). In tropical regions, floods frequently result from storms generated by tropical cyclones or tsunamis along the coast. Conversely, in temperate regions, floods are commonly triggered by intense rainfall or the rapid thawing of snow (Woodruff et al., 2013; Eccles et al., 2019). Flooding can lead to extensive destruction, causing fatalities and harm to private possessions and vital public health facilities. The occurrence and strength of floods are on the rise, and this trend is projected to increase as a result of climate change (Whitfield, 2012; Kron et al., 2012; Jain and Lall, 2001).
Basins are crucial elements for the hydrological regulation and sustainable utilization of natural resources within this system. The main factors that determine drainage networks are the geological and morphological structure, topography, and climatic elements (Tariq et al., 2023; Bryndal, 2023; Bouramtane et al., 2020). Morphometric studies are valuable tools for planners to enhance the effectiveness of urbanization, agricultural, and industrial activities within a watershed (Venkatesh and Anshumali, 2019; Ghosh and Gope, 2021). Several studies using the geoprocessing features of ArcGIS software have shown that different drainage networks are viable and sustainable, depending on the shape of the basin, the texture of the drainage, and the morphometric parameters of the relief (Bharath et al., 2021; Bahiru et al., 2024; Kumar Rai et al., 2017). Remote sensing is a beneficial technique for quickly obtaining data about the Earth’s surface, including Digital Elevation Models (DEM) and Land Use and Land Cover (LULC) information (Al-Taei et al., 2023; Ahmad et al., 2023; Sestras et al., 2019). This data can be employed as input for hydrological models (Bilașco et al., 2021). In addition, Geographic Information Systems (GIS) provide a platform for simulating hydrological models (Gambolati et al., 2002; Knebl et al., 2005; Thakur et al., 2017).
Adequate understanding of watershed runoff is crucial for the planning and design of water resources and associated projects (Zelelew and Melesse, 2018; Sudriani et al., 2023). The runoff simulation model is a hydrological model that analyses the response of a water basin to precipitation and predicts floods. It is used to enhance water resource management and implement preventive measures against floods in specific hydrographic basins (Teng et al., 2017; Du et al., 2012; Al-Sabhan et al., 2003). The Hydrologic Engineering Centre-Hydrologic Modeling System (HEC-HMS) model is a hydrological model that has been effectively employed with conclusive results (Visweshwaran, 2017). This model possesses the capacity to replicate floods in both immediate and prolonged scenarios. The timing of runoff can occasionally affect the effects of flooding. Consequently, a specific amount of rainfall can lead to a substantial flood in certain areas of the watershed, while causing a modest flood in other areas (Natarajan and Radhakrishnan, 2019; Masseroni et al., 2016; Ben Khélifa and Mosbahi, 2022; Ansari et al., 2023).
The process of flood modeling may be efficiently conducted by utilizing HEC-HMS and GIS. The outcomes of this modeling aid in making informed decisions and implementing protective measures to mitigate the adverse impacts of floods (Dunca and Bădăluță-Minda, 2018; Kumar et al., 2023). ArcGIS utilizes HEC-GeoHMS as a preliminary tool for the hydrologic models. The outputs produced by HEC-GeoHMS, such as the grid, watershed boundary, sub-river basin boundary, and the centroid of the watershed and sub-watershed, are subsequently imported into the Hydrologic Modeling System for the purpose of conducting the simulation (Castro and Maidment, 2020; Ramly and Tahir, 2016). HEC HMS and GIS technologies have undergone extensive testing and have been actively utilized globally for flood modeling purposes for numerous years (Seth et al., 2006; Pullar and Springer, 2000; Natarajan and Radhakrishnan, 2019; Natarajan and Radhakrishnan, 2020). The demand for a modeling system is also driven by the necessity to effectively plan and manage hydrographic basins, enabling accurate decision-making regarding timely flood alerts and the identification of flood risk zones (Taherizadeh et al., 2023; Mustafa et al., 2023; Bilașco et al., 2022).
Climate change, extreme weather events, deforestation, and anthropogenic interference adversely affect the environment and the socio-economic conditions of contemporary society. These factors have intensified catastrophic events, resulting in fatalities and considerable material devastation. Floods are a substantial global issue, resulting in adverse economic consequences. Consequently, the attention of scientists and society in this area is current. Significant emphasis was placed on evaluating and mitigating the impacts of floods globally, including in Europe and Romania (Peptenatu et al., 2020; Petrişor et al., 2020; Grecu et al., 2017; Ionita and Nagavciuc, 2021; Sestras et al., 2023b; Svetlana et al., 2015). The primary objective of this hydrological inquiry and modeling was to conduct a quantitative analysis of the surface flows within the Gilort watershed, located in the southern region of Romania, in order to produce simulation outcomes. Subsequently, these can be employed in combination with various software applications to analyze water availability, topography drainage, flow prediction, future climatic effects, reservoir spillway design, flood damage mitigation, floodplain regulation, and systems operation. To validate the precision of the prediction models for the match between simulated flows and real flows, it was proposed to utilize multiple statistical indicators. Hence, the validation of the models was performed using regression, coefficient of determination (R2), Pearson correlation coefficient (r), the root mean squared error (RMSE). In addition, the index of agreement (d) as stated by Willmott (1981) was computed, as well as other relevant indicators, as an established measure for evaluating the precision of the model’s predictions. Consequently, the objectives of this study were to evaluate the reliability of the HEC-HMS hydrological modeling system in estimating and simulating the rainfall-runoff process in a certain area of Romania, associated with excessive rainfall. Using statistical indicators, we also examined the reliability of the model developed for the Gilort watershed.
2 Materials and methods
2.1 The study area and timeframe used for creating the proposed model
The research was conducted in a region associated with the Gilort River, which is a left tributary of the Jiu River, located in the southern region of Romania (Figure 1). The Gilort river spans 116 kilometers in length and originates from the Parâng Mountains, namely from the Parângul Mare Peak (2,519 m a.s.l.). It is fed by two primary springs located at an altitude of 2,350 m a.s.l. The river is immediately bordered on the right by Mândra Peak and on the left by Gruiu Peak. The river traverses the western section of the Subcarpathian Olt region, encompassing a drainage basin of more than 1,348 km2, with the area having an average elevation of 544 m.a.s.l. Upstream, prior to exiting the Parâng Mountains, the river exhibits a characteristic mountain valley with steep slopes exceeding 65%, a bed profile in the shape of a V, and the formation of gorges on a small section with calcareous deposits.
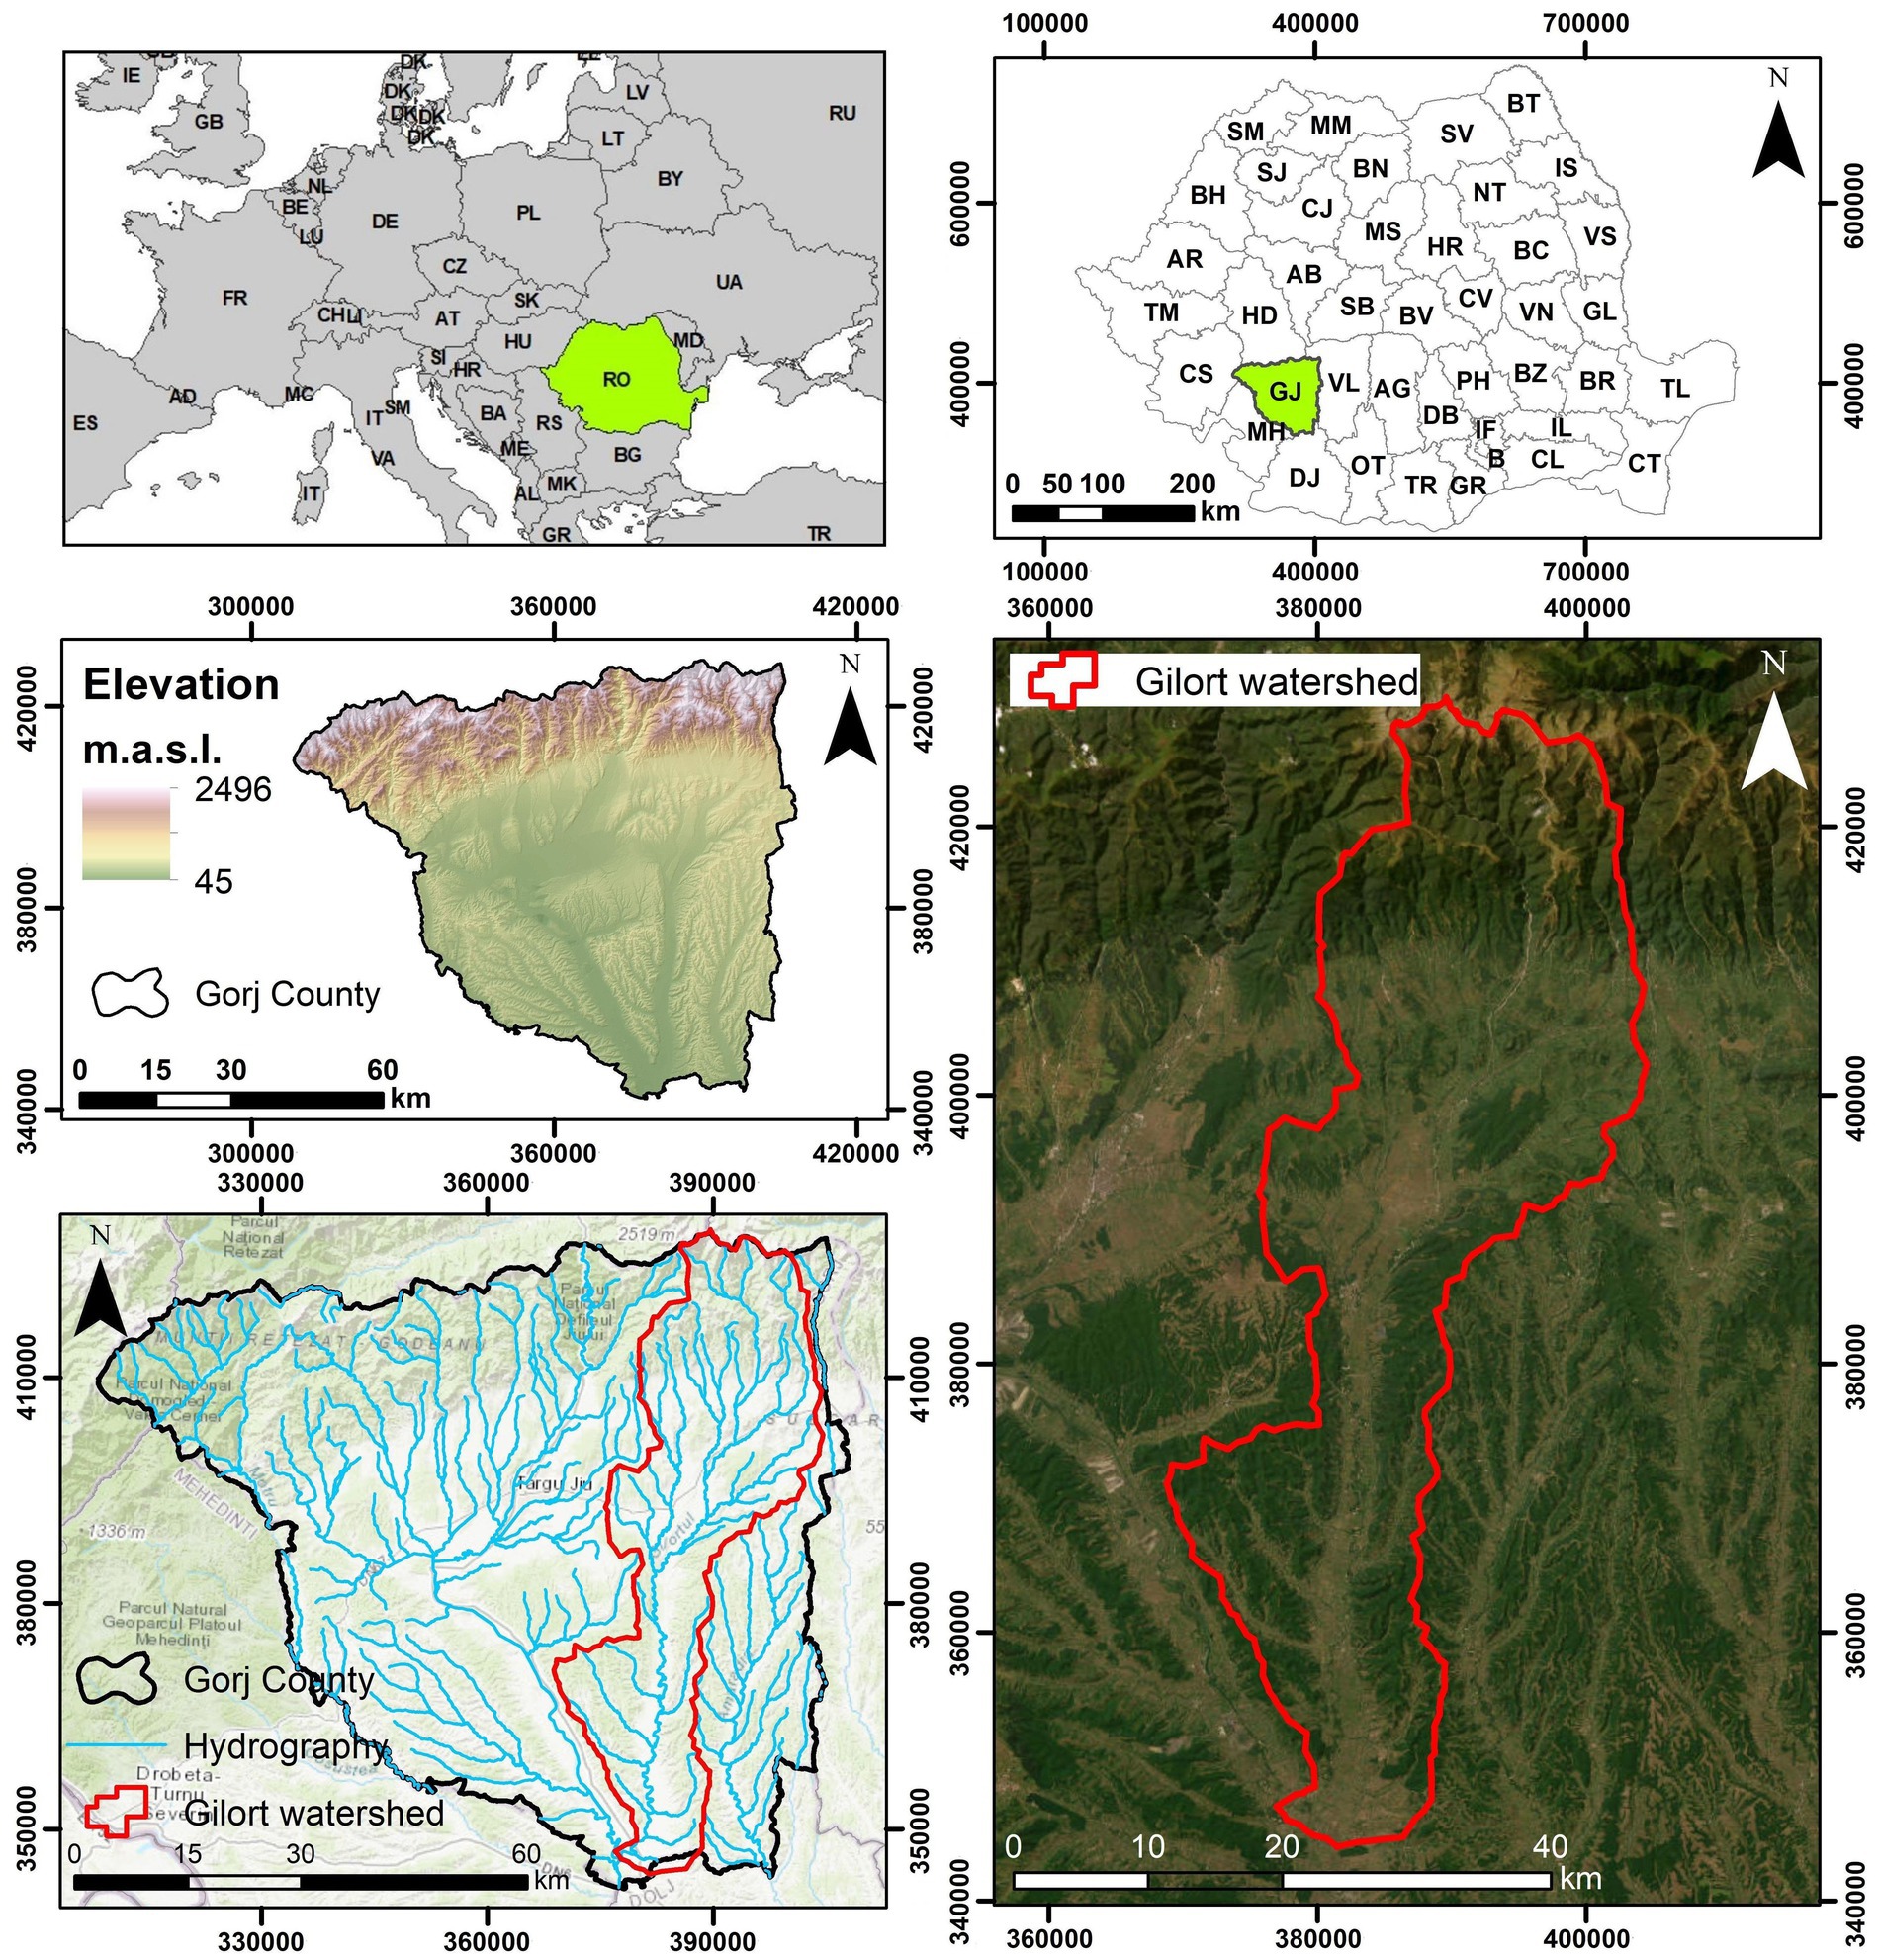
Figure 1. Location of the study area: Gilort catchment area, Romania.
The daily rainfall data from 2015 to 2020 obtained from the rain gauge stations in the basin were used as reference data for the development of the proposed model. During the year 2015, the month of July experienced a significant amount of rainfall, with precipitation levels ranging from 176.5 mm in Săcelu to 231.8 mm in Turburea (Table 1). Precipitation started on July 2, with recorded amounts ranging from 33.4 mm in Ciocadia to 53.3 mm in Turburea. The precipitation occurred as a result of the expansion of the Azoric anticyclone, combined with a rain front originating from the Mediterranean Sea. Consequently, during the period of July 2015, substantial amounts of precipitation were recorded (Administratia Nationala De Meteorologie, 2024; Meteoblue AG, 2024). Figure 2 depicts the flood hydrographs recorded at hydrometric stations in the Gilort hydrographic basin from July 8 to 23, 2015.
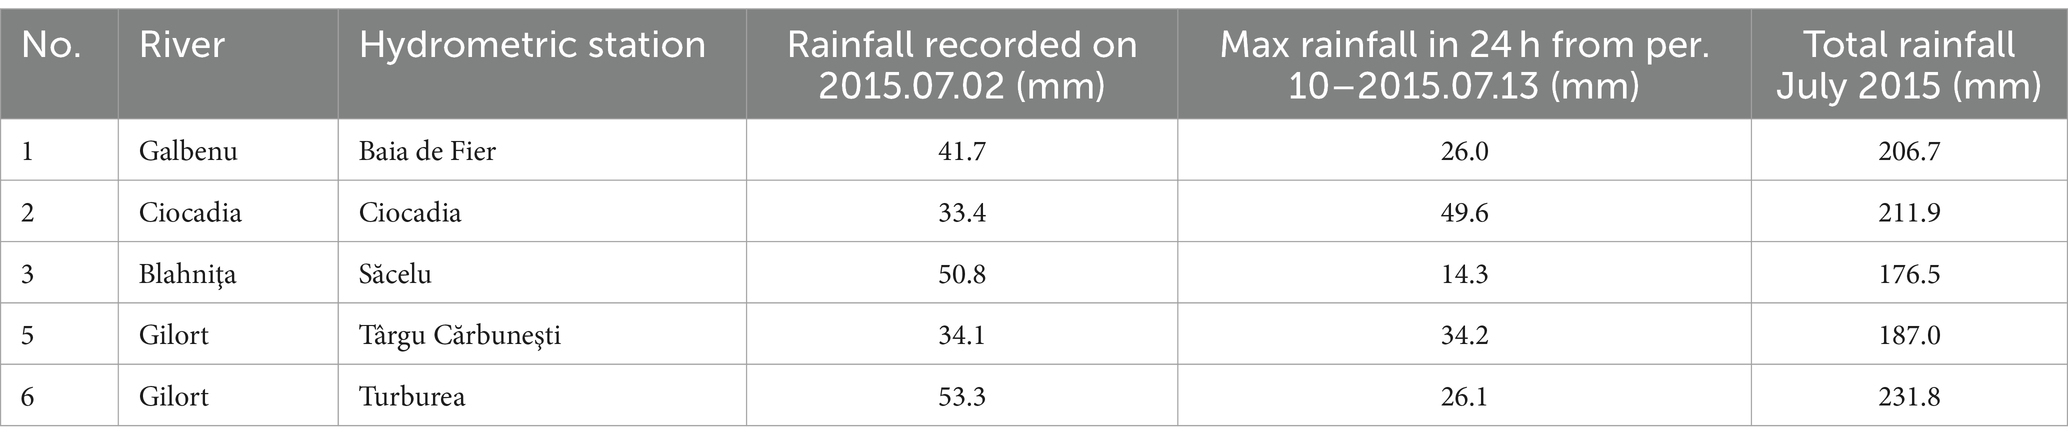
Table 1. Rainfall regime in July 2015 (Administratia Nationala De Meteorologie, 2024).
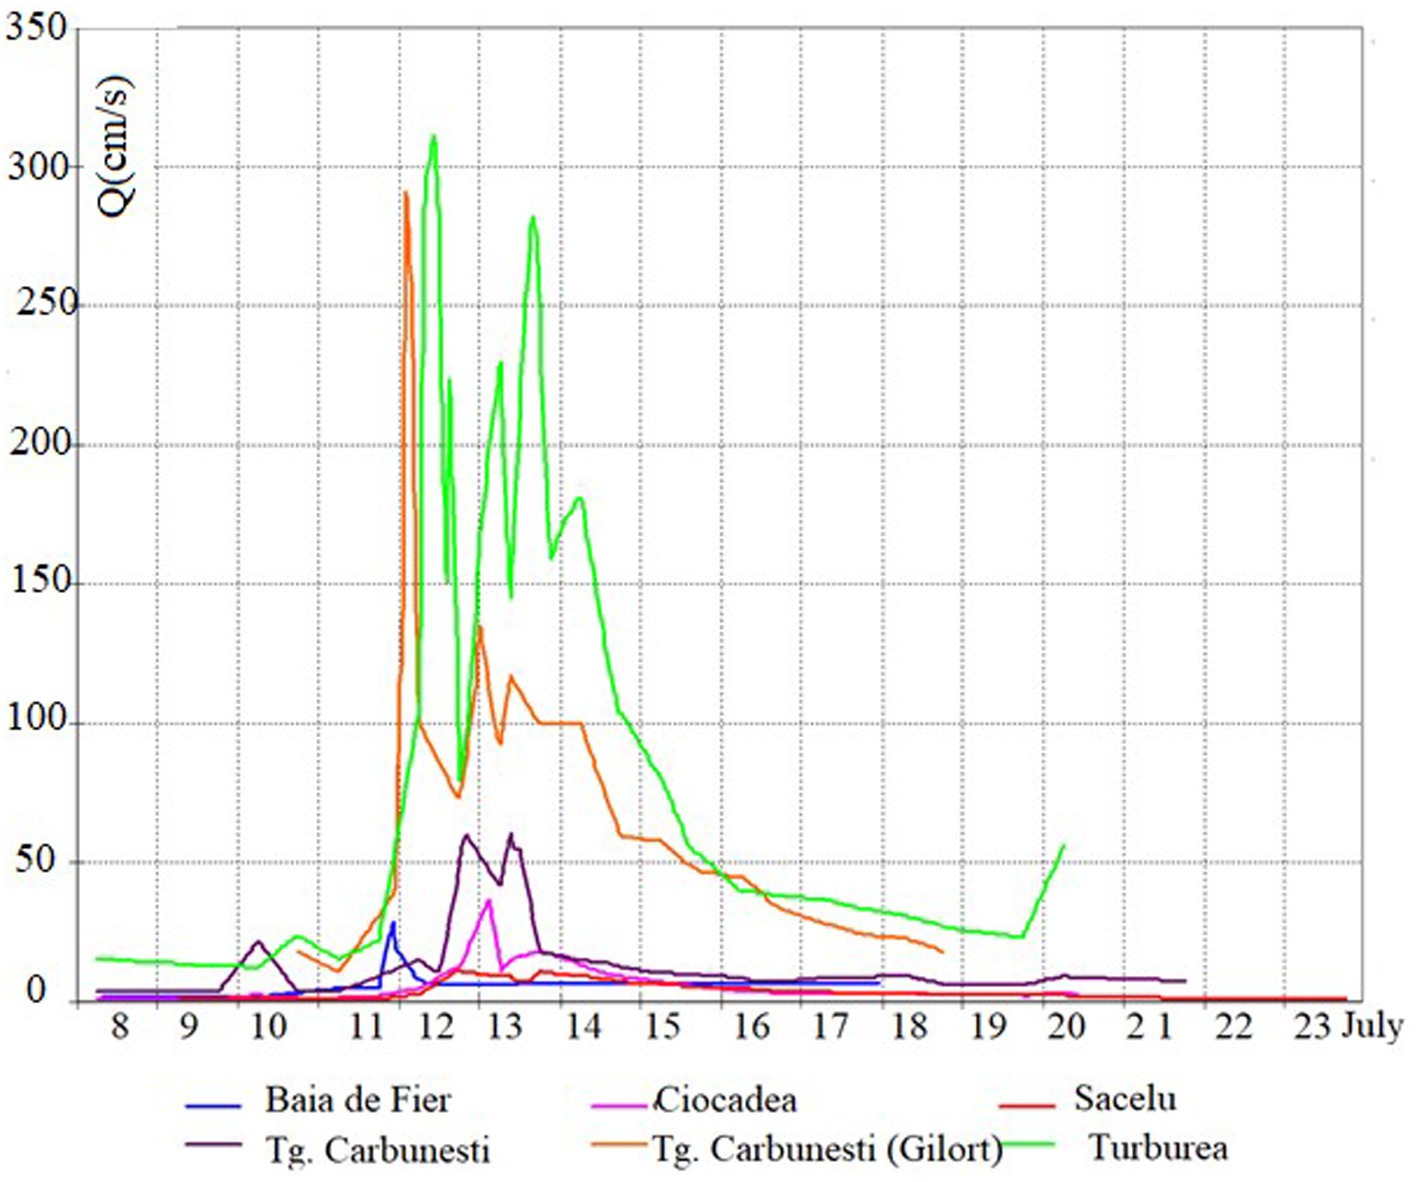
Figure 2. Flood hydrographs at hydrometric stations in the Gilort hydrographic basin from July 8–23, 2015.
2.2 Hydrological modeling
To perform the desired hydrologic simulations, the Hydrologic Modeling System (HEC-HMS), an open-source software developed by the US Army Corps of Engineers Hydrologic Engineering Center, was used to estimate the hydrologic response of the chosen basin, with precipitation as input. In addition, HEC-Geo HMS was used as a geospatial hydrological tool that allows the visualization of spatial information, the extraction of physical characteristics of watersheds from SRTM DEM (Shuttle Radar Topography Mission Digital Elevation Model) data (Yang et al., 2011), in order to develop hydrological parameters, as well as the construction of inputs to hydrological models (Fan et al., 2013; Fleming and Doan, 2013). Figure 3 depicts the hydrological modeling in our context. For this study, the Soil Conservation Service (SCS) Curve Number (CN) method (SCS CN) was chosen, which implements the curve number (CN) methodology, depending on the basin characteristics that generate the runoff such as soil type, land use, soil surface conditions and previous moisture conditions. A digital elevation model (DEM) with a cell size of 30 × 30 m was utilized, together with land use coverage records, to obtain the curve number (CN). CN is the parameter on which the SCS method can be applied (Ponce and Hawkins, 1996; Ross et al., 2018). Based on land use, for the territory of Romania, the values of the CN index were established (Chendeș, 2007). Furthermore, the SCS unit hydrograph method was used to simulate the flows in certain sections of the watercourses, using several input parameters (delay time, curve number, etc.). Given that soil moisture significantly influences the infiltration of water into the soil, impacting the amount and speed of runoff (Hawley and McCuen, 1982), the simulation method took into account the AMC index (antecedent moisture conditions) based on the AMC class (Chow et al., 1988) provided in Table 2.

Figure 3. The scheme of hydrological modeling using the HEC-HMS model.
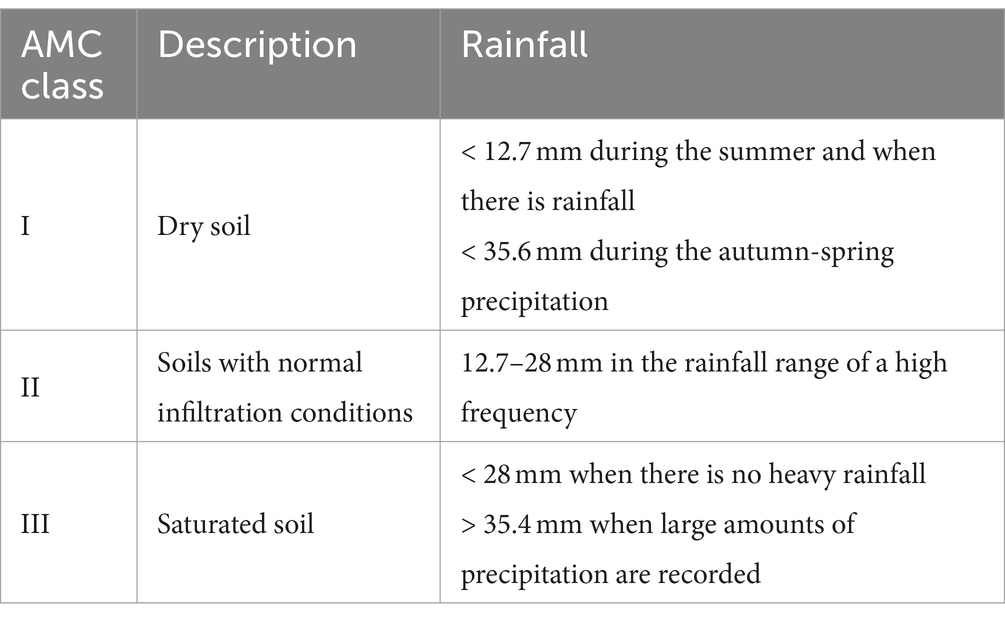
Table 2. Description of AMC classes (antecedent moisture conditions) considered in the simulation process (Chow et al., 1988).
The SCS – CN approach converts precipitation within the hydrographic basin into surface runoff. The designation of the drainage curve is determined by the hydrological soil group of the region, land utilization, treatment, and hydrological condition. The CN (curve number) values increase linearly with runoff potential and decrease inversely with infiltration coefficient. The categorization and allocation of values to the CN index have been modified and implemented (Chendeș, 2007) using both USDA textbooks and other established classifications found in the global literature. The SCS model is based on an extensively utilized equation for drainage layer, which does not directly account for the quantity of infiltrating water. The equation is as follows (Equation 1; Mihalik et al., 2008):
where: Q – accumulated runoff depth (mm); P – accumulated rainfall depth (mm); Ia – initial abstraction (mm); S – potential maximum retention after runoff begins.
Different soil groups have different infiltration rate and CN values (Muthu and Santhi, 2015; Table 3).
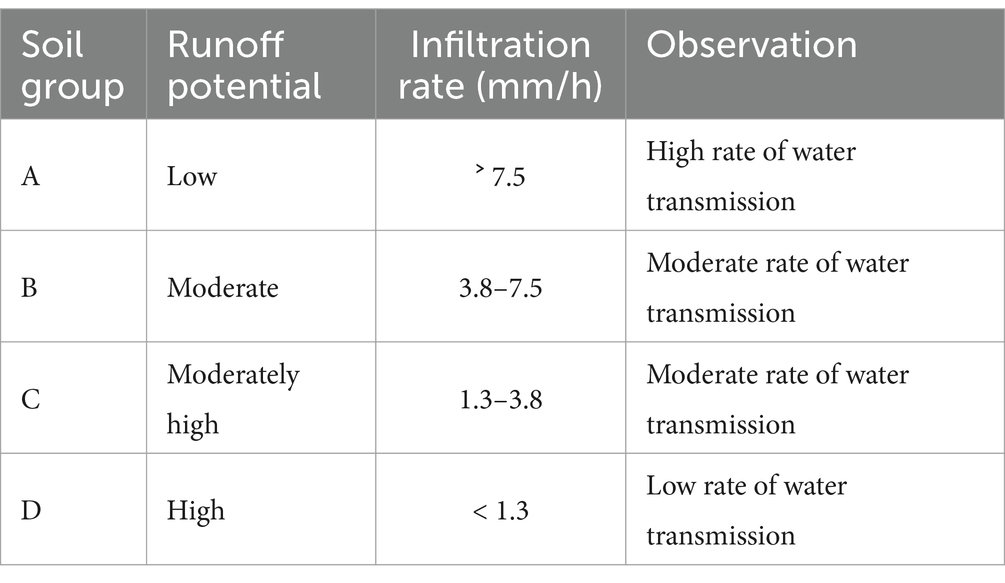
Table 3. SCS soil hydrologic groups and infiltration rates (Muthu and Santhi, 2015).
For the transfer function, the unitary hydrograph SCS method was used, which is successfully applied to simulate the flow rates of water courses. This method requires a lag time parameter in h, which is defined as the length of time between the centroid of the precipitation mass and the peak discharges (Equations 2, 3; Fleming and Brauer, 2016).
where: Tc – concentration time (h); L – the channel flow length (m); S – dimensionless main channel slope.
The excess rain was transformed into direct runoff by means of the SCS unitary hydrograph method, and the parameters required to run this model are shown in Table 4. Basin lag time values were calculated using Equation (4) (Mishra and Singh, 2013):
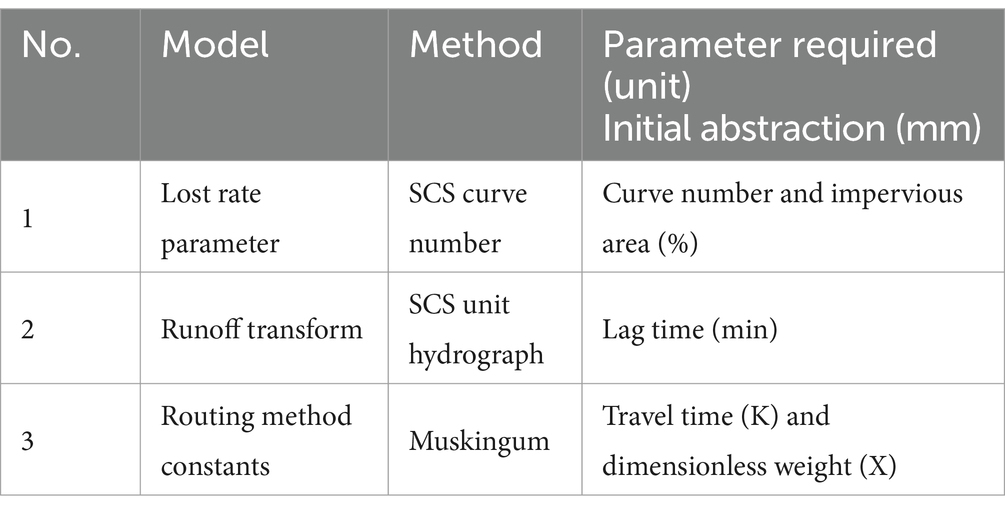
Table 4. The hydrological model of the HEC-HMS catchment (Chendeș, 2007).
where: S – maximum retention (mm); Lag – basin lag time (hour); L – hydraulic length of the catchment (longest flow path) (feet); Y− basin slope (%).
The standard error of the estimate of the dependent variable is equal to the standard deviation of the residuals with the root mean square error (RMSE) and determined by Equation (5):
where: N is the number of data points; yj is the actual values; yJ is the predicted values. The larger the RMSE, the larger the difference between the predicted and observed values, meaning that the regression model fits the data worse. Conversely, the smaller the RMSE, the better a model is able to fit the data.
The Pearson correlation method is one of the most used methods for numerical variables and assigns a value between −1 and 1, where 0 is no correlation, 1 is total positive correlation and − 1 is total negative correlation (Mudelsee, 2014). This is calculated with Equation (6):
where: mx and my are the means of x and y variables.
The index of agreement (d), introduced by Willmott (1981), is a standardized metric used to quantify the extent of error in model predictions. It was calculated using Equation (7).
The variables in the equation are defined as follows: Oi represents the observation value; Pi represents the forecast value, Obar represents the average observation values, and Pbar represents the average forecast values. As a measure that quantifies the relationship between the mean square error and the potential error, “d” values range from 0 to 1. A number of 1 in the agreement indicates a complete match, whereas a value of 0 shows no agreement all.
The soils were classified into four hydrological groups, namely A, B, C, and D, based on their texture. Group A comprises soils with a coarse texture, which exhibit the lowest runoff capacity. Group B consists of soils with a medium texture, which are either deep or of medium depth, and have good drainage. Group C comprises soils characterized by a restrictive layer that impedes the downward movement of water in the soil profile. These soils have a moderately fine to fine texture. In contrast, soils classified as Group D possess a fine structure characterized by a high clay content, resulting in a greater susceptibility to leakage and a reduced capacity for infiltration. The land use/cover map of the Gilort watershed (Figure 4) was created from the Corine Land Cover 2006 dataset.
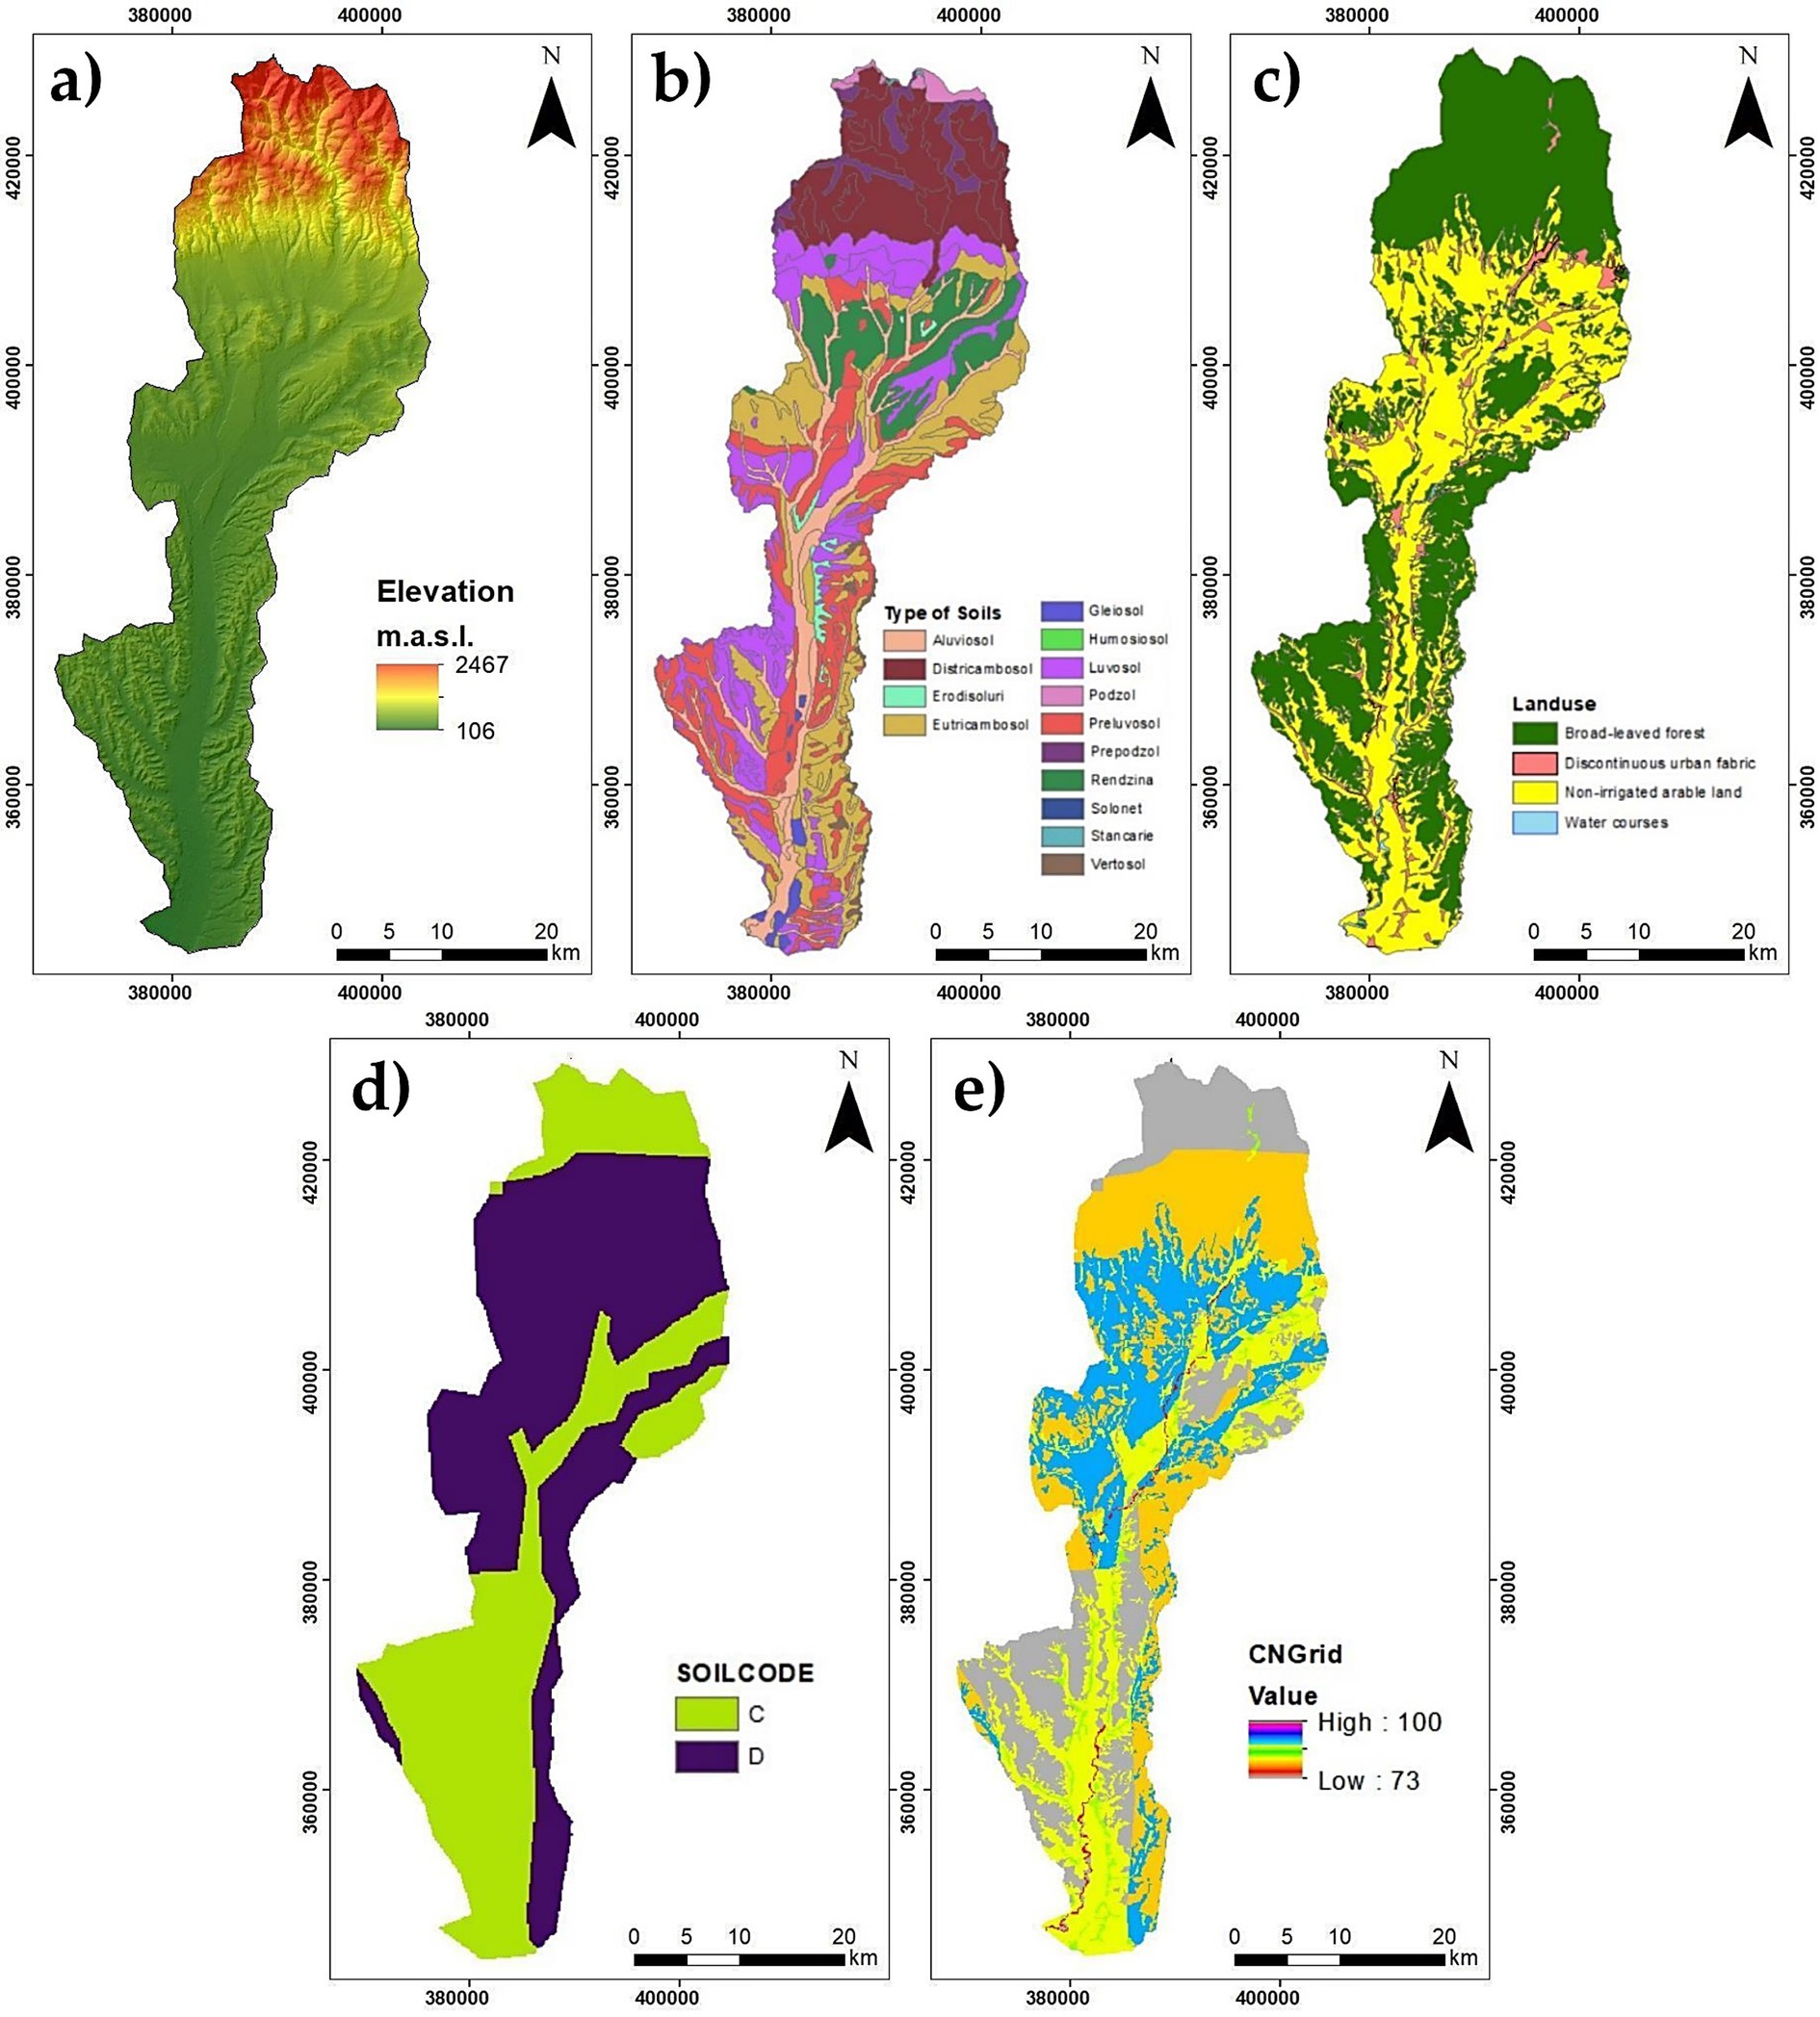
Figure 4. Study area of the Gilort watershed: (a) Elevation; (b) Soil type; (c) Land cover/use; (d) Soil code (Runoff potential: C – Moderately high; D – High); (e) CN – Curve Number.
Considering the soil and land use data in the study region of the Gilort watershed, the curve number (CN) accurately depicted the potential for runoff. The selection of the CN value was determined by considering key factors such as the soil composition in each sub-basin, the initial moisture level, and the type of vegetation covering the sub-basin. The CN is a dimensionless index used to measure leakage, ranging from 1 to 100. Higher values of CN implied a higher degree of leakage (USDA, 1972; USGS, 2017). The initial phase involved determining the moisture conditions under normal circumstances (CN II), which were then adjusted based on the prior moisture conditions (AMC I, AMC II, and AMC III). In the SCS Curve Number approach, each sub-basin was assigned a Curve Number value, which was obtained using the HEC Geo-HMS program. The data collected in this phase was used to do hydrological modeling using the HEC-HMS software. The modeling process involved four components: basin model, meteorological model, time series data, and specification control, based on which modeled basins were obtained such as for the Superior Barzava catchment presented in Figure 5.
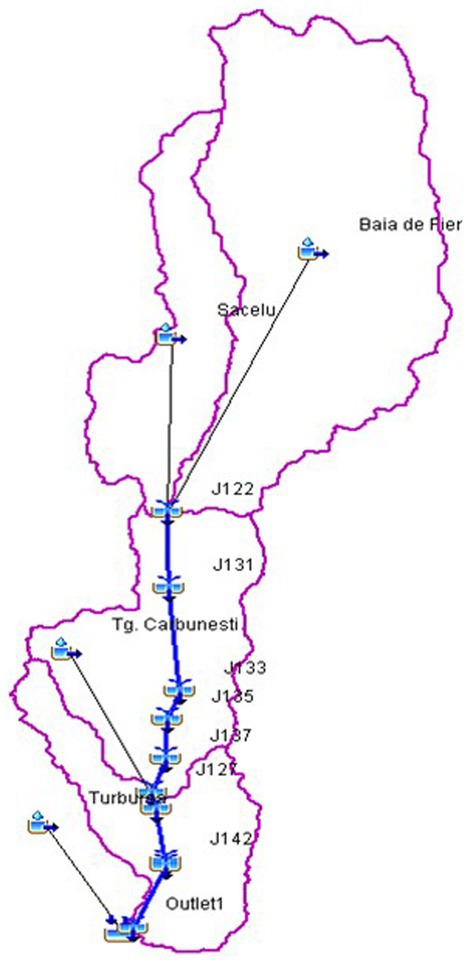
Figure 5. The modeled basin of the Superior Barzava catchment.
2.3 Data processing and statistics
The values of the individual parameters were estimated through manual calibration. The optimal values of the parameters (K, X) for the Muskingum model were determined by comparing the observed and simulated flows in the examined portions. In the current study, regression analysis, Pearson’s correlation coefficient (r) and coefficient of determination (R2) were utilized as effective tools in operational hydrological forecasting among the event-based rainfall-runoff models (Mekanik et al., 2013; De La Fuente et al., 2019; Yan et al., 2023; Liu et al., 2021). Additional quantitative models, such as root mean square error (RMSE), Nash–Sutcliffe efficiency (NSE), and others, were applied and assessed for evaluation (Ajmal et al., 2015; Mustafa et al., 2018; Franz and Hogue, 2011; Moriasi et al., 2007), some of them using AgriMetSoft software (AgriMetSoft, 2019). The model was calibrated using daily precipitation data from the hydrological year intervals spanning from 2015 to 2020. Two precipitation events were chosen annually from the years 2015 to 2017, for the purpose of calibrating and validating the data. The model was adjusted for the time frame from 8 to 23 July 2015 and verified for the year 2017. The parameters, including initial abstraction, CN number, percentage impermeability, and lag time, were adjusted to match the conditions of the SCS curve number technique for the year 2015. A one-sample t-test was used to test the regression hypothesis that the simulated and observed data were identical (p < 0.05). Calculations, including regression model fitting, used standardized variables and compared their absolute values.
3 Results
The results of the three stations (Săcelu, Târgu Cărbuneşti, and Turburea) for the introduction of precipitation data in the meteorological sheet, corresponding to the intervals of the hydrological years 2015–2020, are presented in Figures 6, 7. For the control run, daily rainfall began on 8 July and ended on 23 July. In our model, the HEC-HMS was used to simulate both a single watershed and a system of multiple hydrologically connected watersheds. The simulation of precipitation-runoff for the Gilort watershed done for a single rain event from July 8, 2015, to July 23, 2015, using HEC-HMS is presented in Figures 8–10. The data were obtained as hydrologic simulation models with the integrated use of remote sensing and GIS. Because a lack of reliable recorded data on precipitation and runoff is a serious problem for the planning and sustainable management of water resources in a river basin, we used the downpour from July 8 to 23, 2015, to simulate the precipitation-runoff model (HEC-HMS hydrological model). Calibration was undertaken to ensure that the empirical results for peak flow and peak time during the simulation matched the observed data. After the calibration procedure, the HEC-HMS model produced a simulated hydrograph for the Turburea sub-watershed (Figure 11) and simulated outflow data for the Gilort watershed (Figure 12) during the storm event that occurred from July 8 to 23, 2015. The calibration approach encompassed the utilization of standard parameters, including impermeability, delay duration, and curve number, which were tailored to our specific dataset.
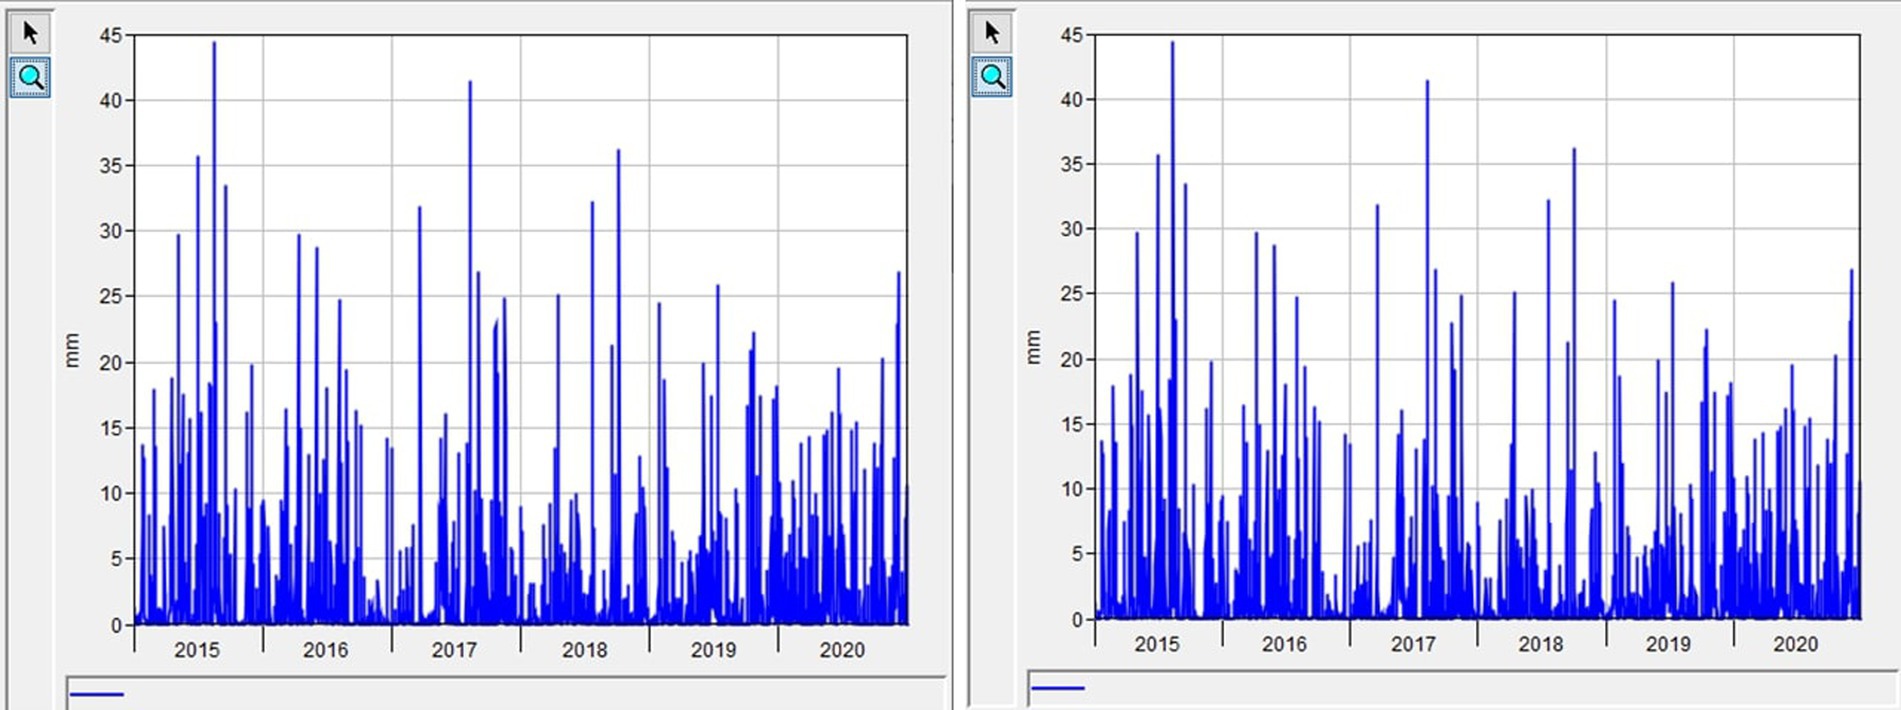
Figure 6. The daily precipitation for the period 2015–2020 at the station Săcelu and Târgu Cărbuneşti.
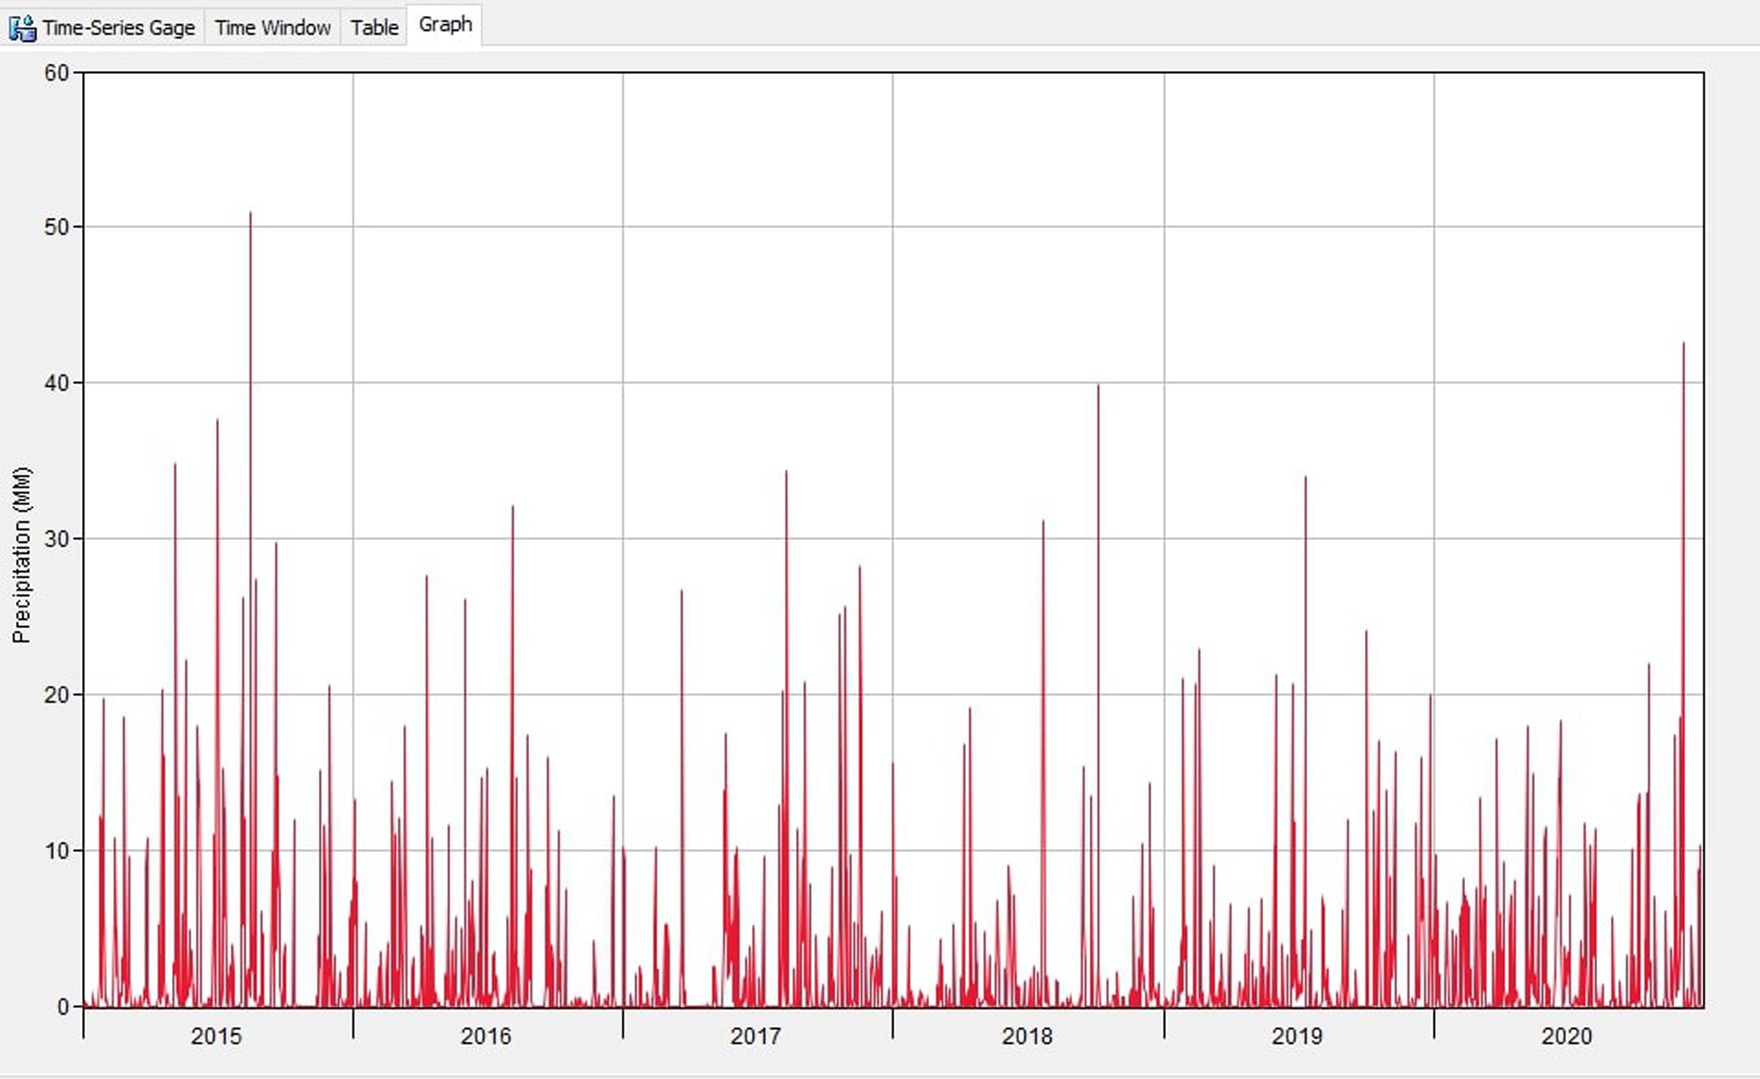
Figure 7. Daily precipitation for the period 2015–2020 at Turburea station.
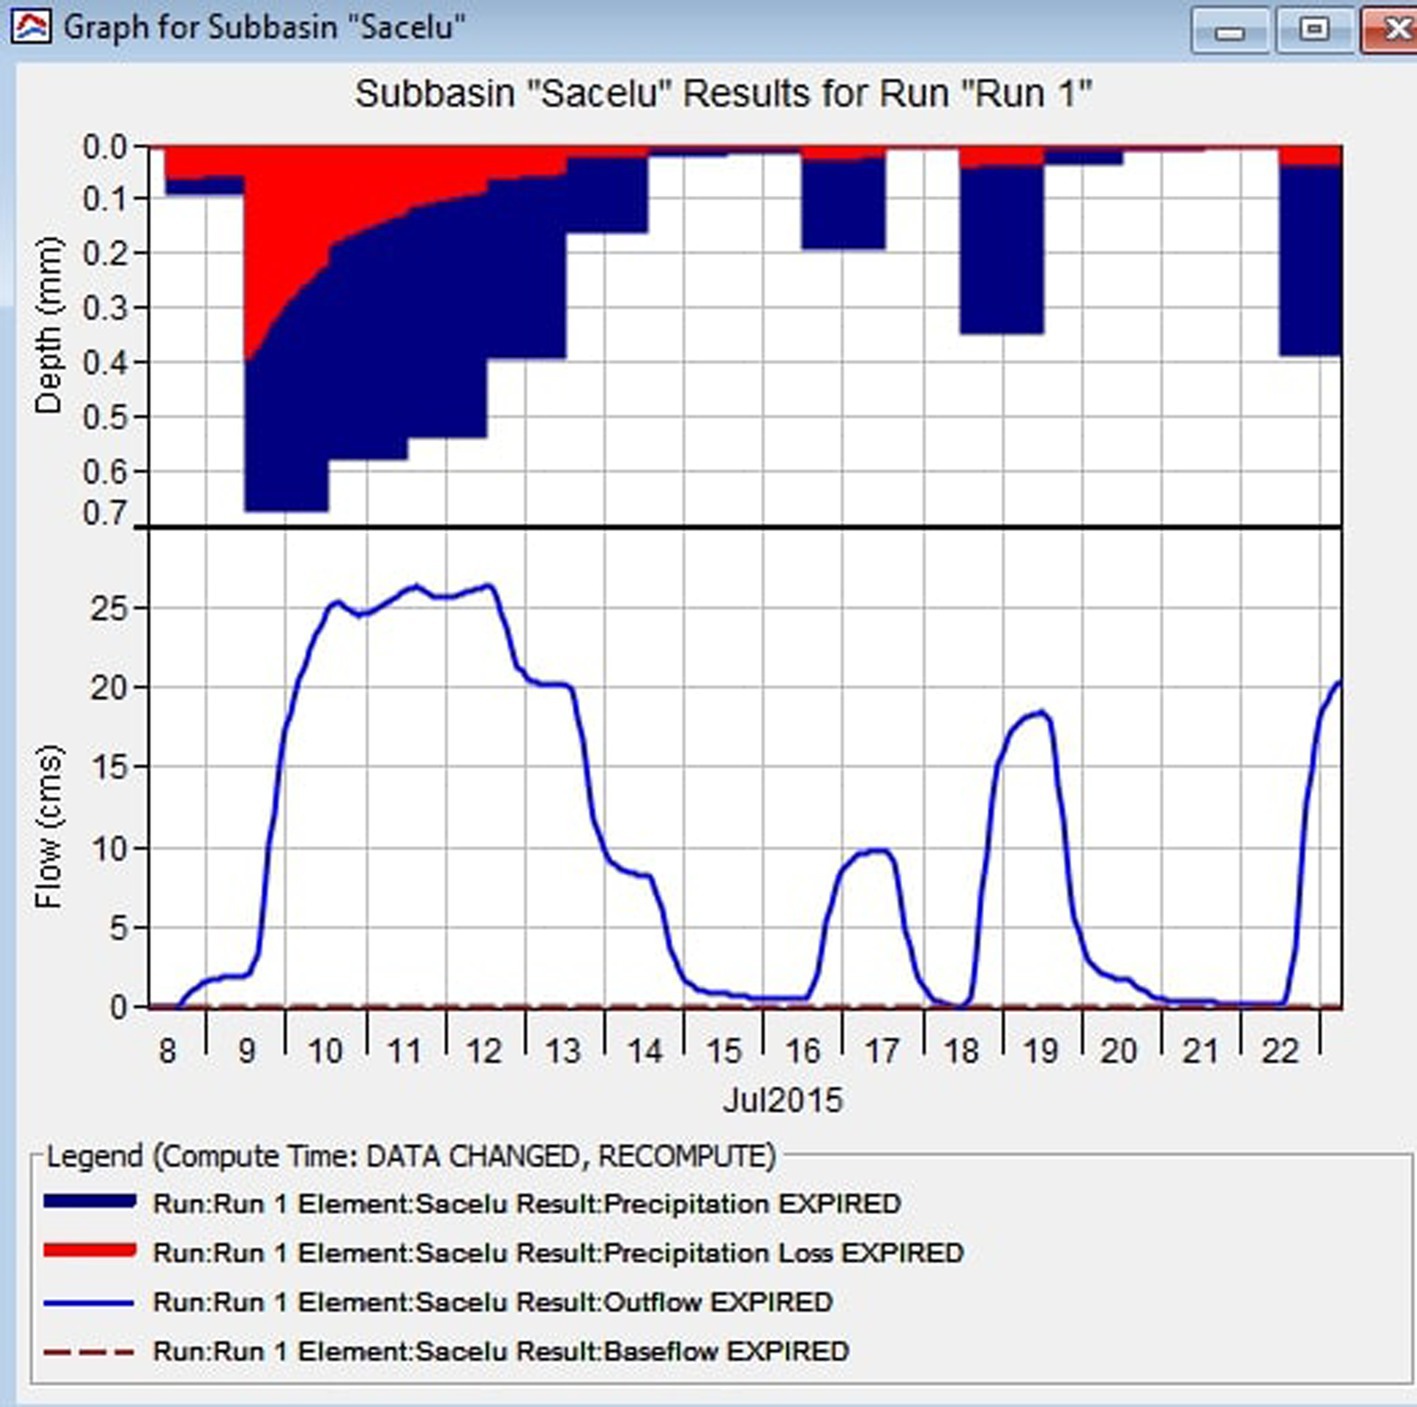
Figure 8. HEC-HMS simulated hydrograph of sub-watershed Săcelu shows the total precipitation, soil infiltration and total outflow.
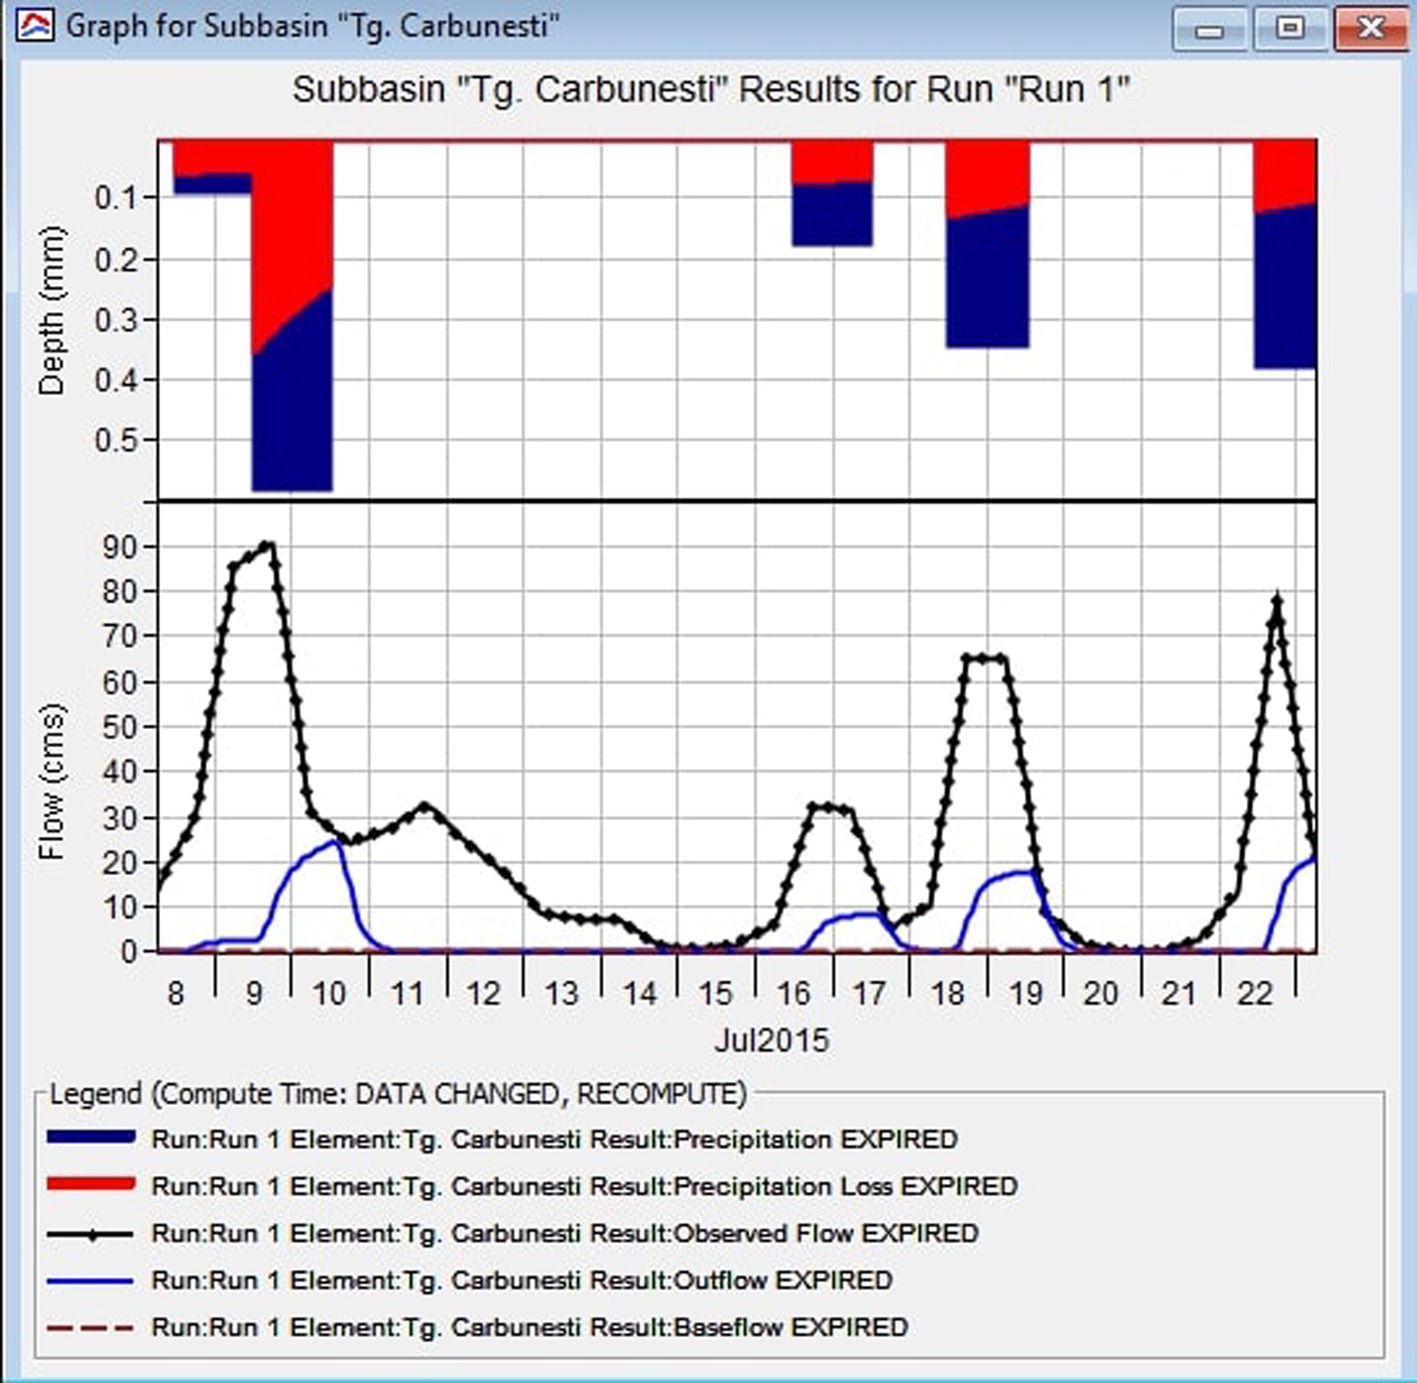
Figure 9. HEC-HMS simulated hydrograph of sub-watershed Târgu Cărbuneşti shows the total precipitation, soil infiltration and total outflow.
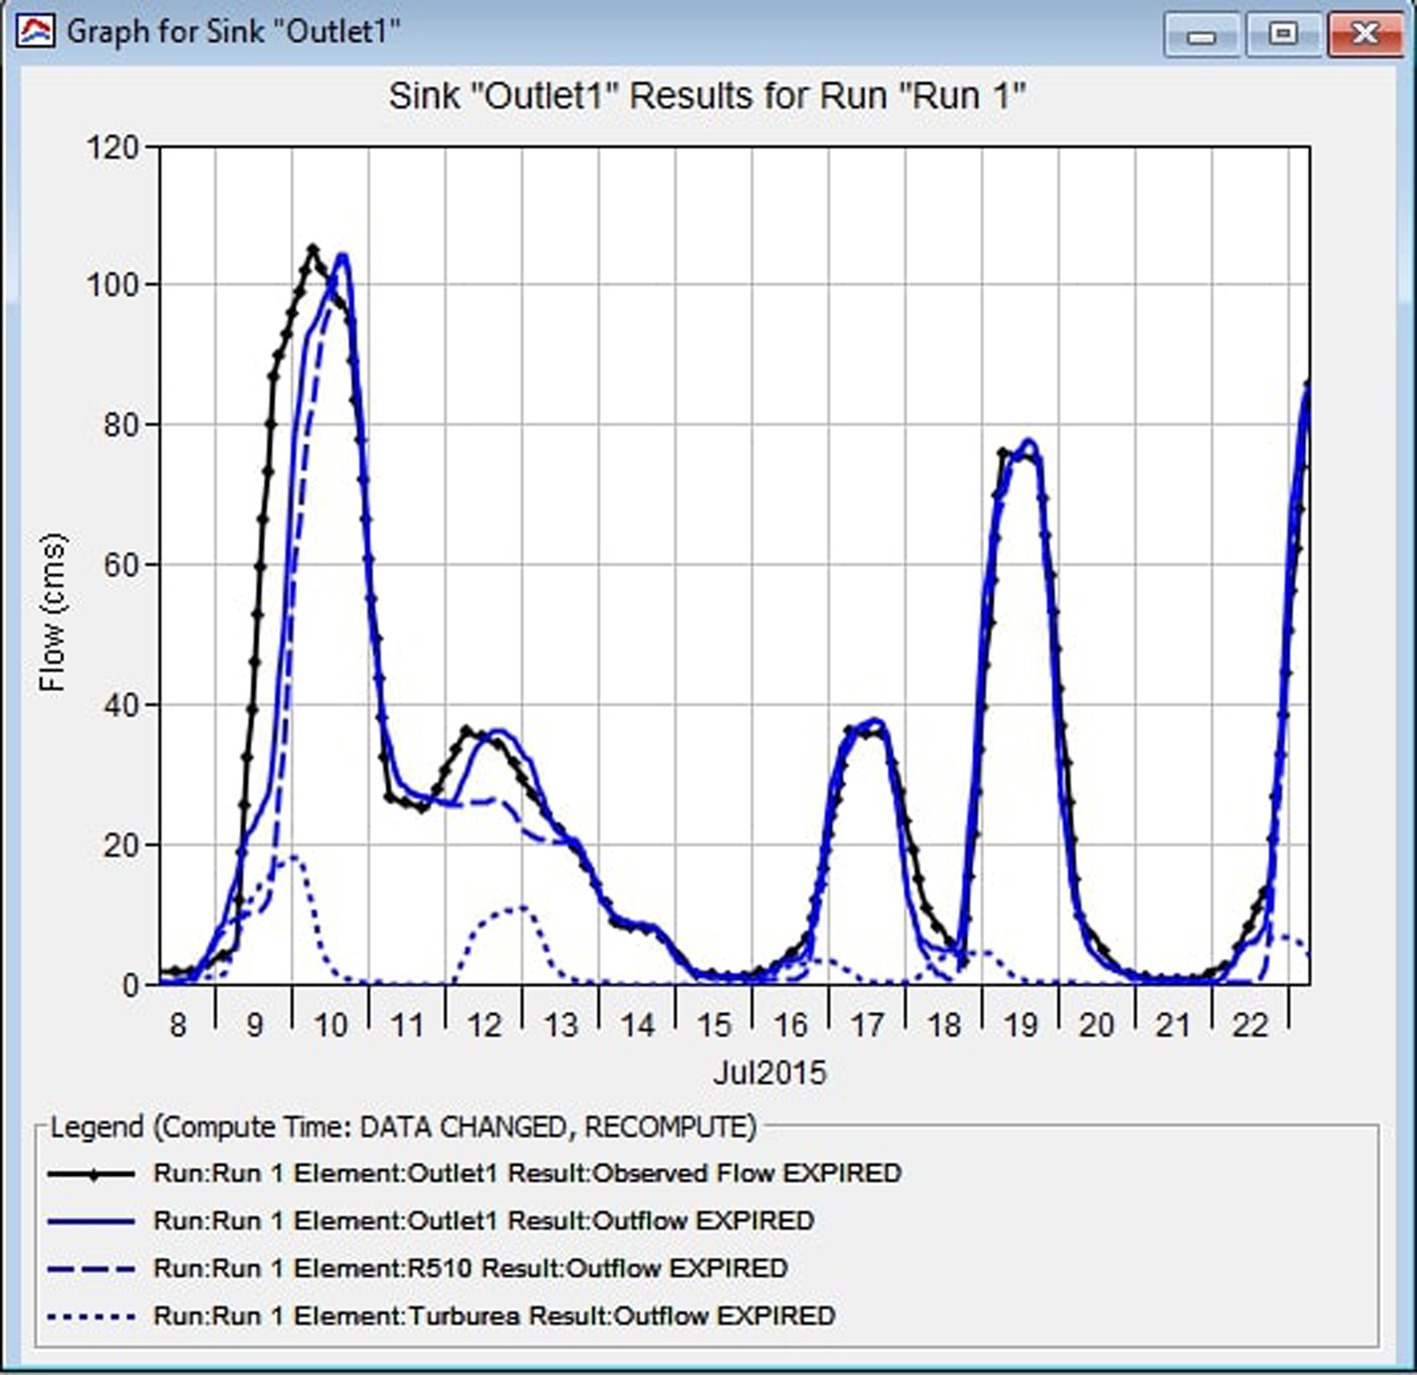
Figure 10. Simulated and observed the outflow graph of Gilort watershed on a storm event from 8 July 2015 to 23 July 2015.

Figure 11. HEC-HMS simulated hydrograph of sub-watershed Turburea after calibration.
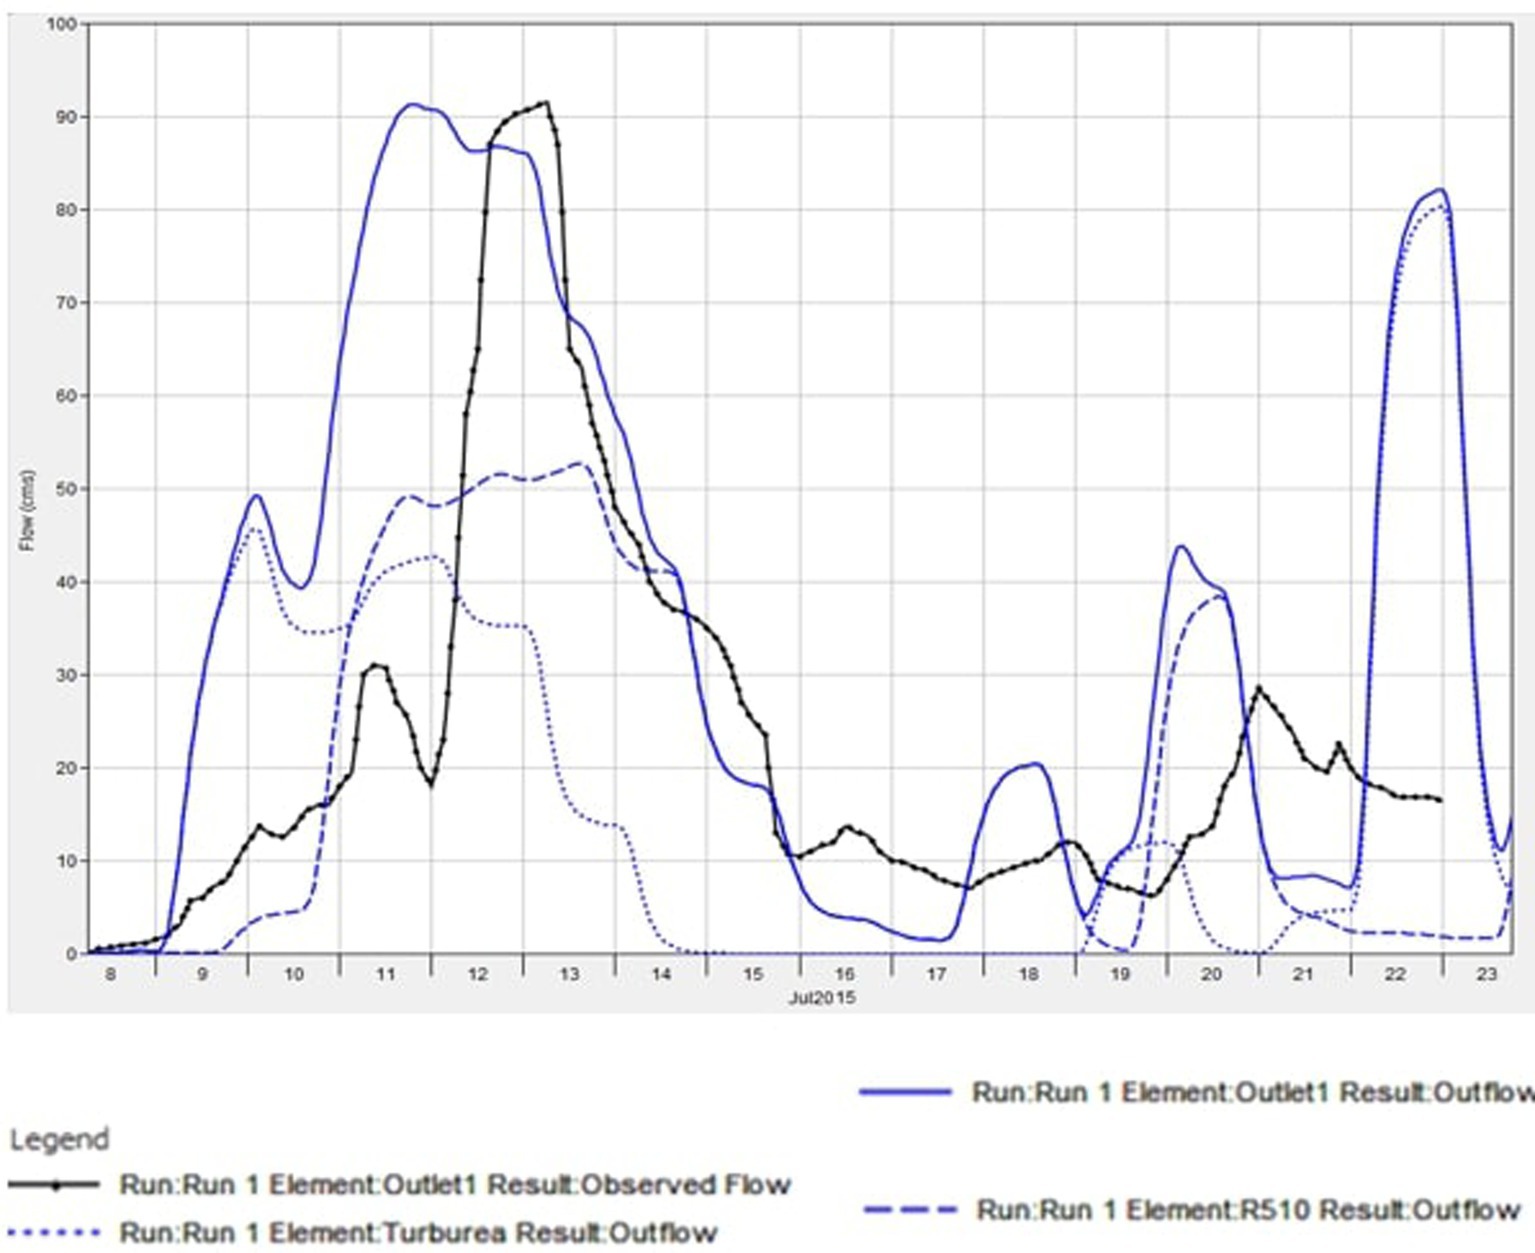
Figure 12. HEC-HMS simulated hydrograph of Gilort watershed after calibration.
The statistical parameters used to estimate the runoff process revealed a good match between the observed and simulated discharges for the hydrographic basin under consideration (Figure 13). Therefore, the coefficient of determination (R2) for the simulated vs observed flows has a high value (0.9113), indicating that the simulation accurately captures over 91% of the entire variation in the data. The regression equation and the regression line indicate the tight, directly proportional positive relationship between the two variables. The regression line has a sharp upward trend. In addition, the observed flows and the simulated flows have a Pearson correlation coefficient of 0.954, which indicates that there is a very close relationship between the two variables, respectively p < 0.001. Therefore, the t-test is likewise statistically significant, confirming the robust association between the observed and simulated runoff. Finally, the index of agreement (d) exhibited a significantly high value, nearly reaching 1, specifically 0.975, meaning that between the observed and simulated means and variances, there was almost a perfect match.
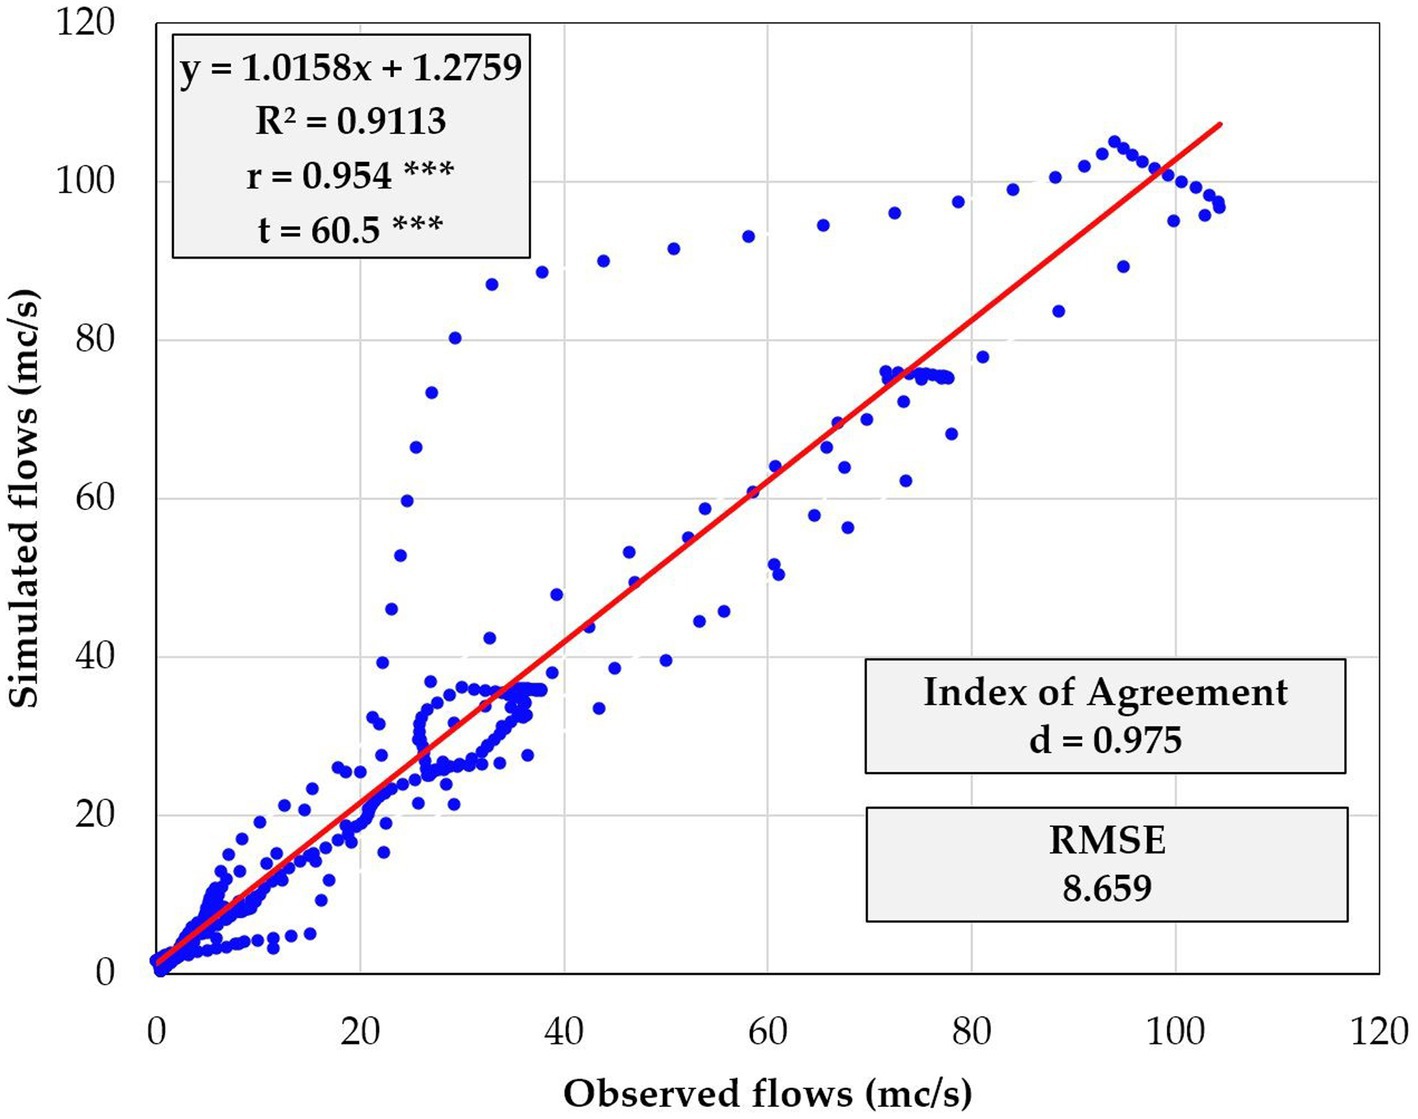
Figure 13. Simulated versus observed flows before the validation (8–23 July 2015).
Other assessment methods were also used to statistically test the predictions of the simulated model against the real data obtained in the Gilort basin throughout the investigated period. Figure 14 displays the findings obtained from different methods used to measure the accuracy of the model’s estimated values compared to the actual observations. These various models performed using AgriMetSoft (2019) also confirmed the accuracy of the previously reported values of the presented parameters. It can be noted that under the conditions that a reduced deviation of runoff volume value indicates superior model performance, the deviation of runoff volumes (Dv) was 6.40%. In addition, the Nash−Sutcliffe efficiency (NSE) of 0.908 indicates a strong agreement between the observed and simulated data, suggesting a nearly perfect fit of the model to the observed data, when NSE = 1 (AgriMetSoft, 2019). In general, the values of the other parameters that were estimated are consistent with these findings (i.e., Kling-Gupta efficiency) and offer support for the validity of the model. Residuals, which in the context of our investigation represented the portion of the validation data that the model did not explain, were used in conjunction with RMSE to assess the predictability of the model for observed and simulated datasets (Figure 15). The regression equation produced a negative result, suggesting a pronounced downward trend in the regression line. However, the coefficient of determination reveals that 88.1% of the variance in a component may be attributed to its association with the other factor. The correlation coefficient exhibited a high value, indicating a robust association between the variables. The data were evaluated using the t-test, resulting in statistical findings which certified that the regression coefficient between the two analyzed parameters is significant (p < 0.001).
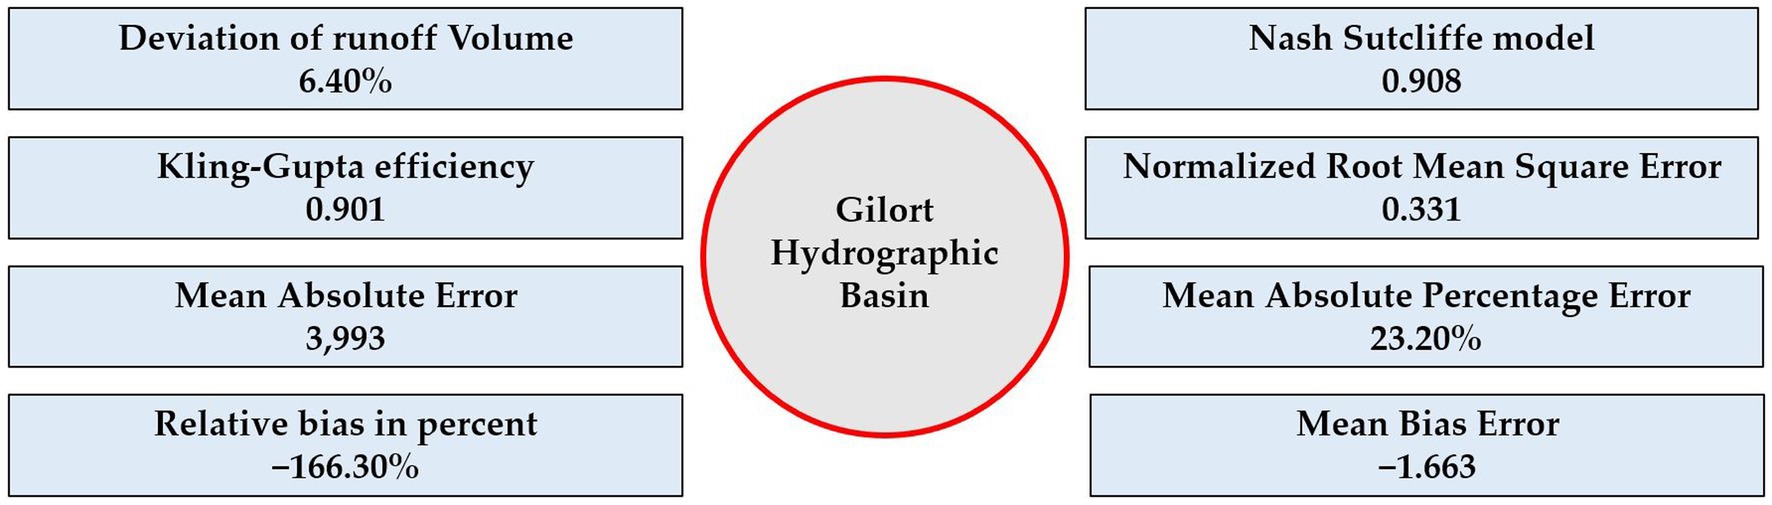
Figure 14. Calculated indices for statistical comparisons of model predictions with actual observations (simulated flows - observed flows) in Gilort Hydrographic Basin.
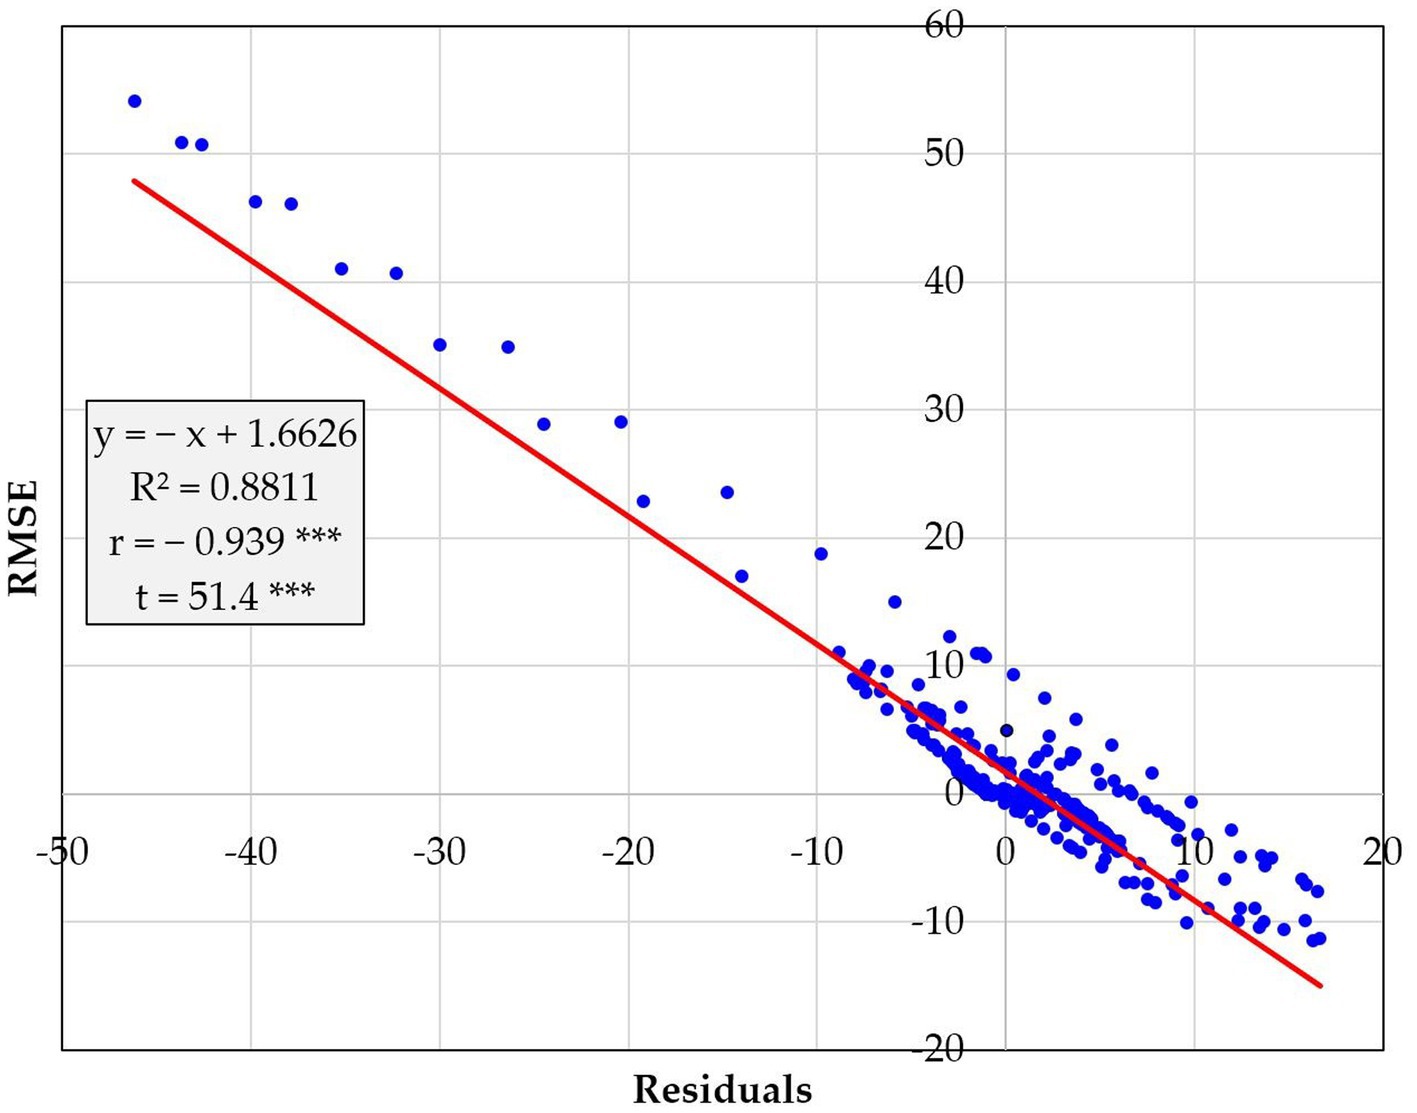
Figure 15. Simulated versus observed flows before the validation (8–23 July 2015).
4 Discussion
The data collected in the Gilort hydrographic basin, Romania, namely the leakage in the closure section, were utilized in our study to construct a simulation-based model for the purpose of verification and validation. The results were utilized in the model by computing the precipitation-runoff in the Gilort hydrographic basin, using the precipitation data that occurred on the surface of the investigated region as input. The highest recorded flow rates ranged from 10.9 m3/s in Săcelu to 311 m3/s in Turburea, while the flood volumes varied from 1.57 million m3 in Baia de Fier to 58.8 million m3 in Turburea. It is important to mention that although the caution limits in the study period were surpassed at Ciocadia, Săcelu, Tg-Cărbuneşti (Gilort), and the flood limit at Turburea, no physical harm was reported. The highest water flows were successfully channeled down the main riverbed.
The simulated and real flows of the hydrographic basin under study were precisely matched by the statistical indicators, particularly the coefficient of determination, coefficient of correlation, index of agreement, and RMSE, that were used to assess the runoff mechanisms. Other statistical parameters used to evaluate the runoff model, including the deviation of runoff volumes (Dv) and the Nash−Sutcliffe efficiency (NSE) confirmed the appropriate matching of the simulated and observed data. Both Dv (WMO, 1986; Wagener et al., 2004) and NSE (Nash and Sutcliffe, 1970) could be considered appropriate measures of goodness of fit which ensure model reliability and performance. Furthermore, the Kling-Gupta efficiency (KGE) appears to be comparable to the Nash−Sutcliffe efficiency (NSE), particularly in cases where there are no biases (Mathevet et al., 2023; Skaugen and Weltzien, 2016; Rezaei-Sadr, 2020). This is because both metrics assess the relative strength of distortion compared to the variability in observations (Duc and Sawada, 2023). The values of these two parameters in our investigation were highly comparable (KGE = 0.901; NSE = 0.908). The statistical comparisons of the model predictions with the real observations and the quantification of the goodness-of-fit of observations to the simulated values by the model were facilitated by the software and information support implemented by AgriMetSoft (2019). The index of agreement value, or Willmott index (d = 0.975), was near 1, indicating a perfect match, whereas 0 means no agreement (Aboelkhair et al., 2019; Biudes et al., 2014). The deviation of runoff volumes (Dv) had a quite small value in our investigation, which was a favorable result because a smaller Dv indicates superior model performance (knowing that in the case of a perfect model, Dv equals zero) (Mediero et al., 2010). The root mean square error (RMSE), which quantifies the discrepancy between two datasets by comparing the predicted and actual outcomes of individual differences, was calculated to be 8.659. The NSA value was very close to 1, a value that, on a scale of 0–1, indicates a perfect alignment between the simulated model and the observed data. When multiple criteria are utilized, particularly over a certain season or a series of seasons, evaluating a model’s success becomes challenging for a potential user (Martinec and Rango, 1989). Therefore, we tried to determine whether the relationship between the RMSE and the residuals may be employed as a potential method to assess the accuracy of the model. The results unequivocally demonstrated a robust negative correlation between these two variables, which was further supported by the t-test. The utilization of the regression equation in the investigation may be advantageous in predicting one variable, contingent upon the value of the other variable. Therefore, the model allows for the calculation (including both interpolation and extrapolation) of the extent to which the variables of interest can vary. This pertains to the problem of limited or insufficient data regarding rainfall and water flow, which has been an ongoing challenge in hydrological modeling (Demisse et al., 2021; Ben Khélifa and Mosbahi, 2022; Teng et al., 2018; Halwatura and Najim, 2013).
The findings of this study support the model’s validity and usefulness for developing flood mapping and designing flood mitigation measures in the studied area. Such generated models can be used to other hydrological basins with similar hydrological circumstances, allowing for modifications based on general and local variables. Furthermore, a multitude of studies emphasize these facets, conducted in various regions across the world, including diverse geographical and meteorological circumstances (Sahu et al., 2023; Yimer et al., 2009; Verma et al., 2022; Rahman et al., 2017; Shah and Lone, 2022; Bammou et al., 2024; Ouallali et al., 2024). Examining the intricacy of the hydrological process in a specific area relies on the attributes of precipitation and the qualities of the watershed (Sidle, 2021). Applying rainfall-runoff models involves distinct challenges and opportunities, which vary depending on a variety of factors, such as the geographical characteristics of the land and the specific meteorological circumstances of the area (Ranjan and Singh, 2022; Choudhari et al., 2014; Ramly and Tahir, 2016; Sarminingsih et al., 2019; Gholami and Khaleghi, 2021; Hamdan et al., 2021). An essential obstacle lies in the inherent uncertainty of precipitation and its dynamic formation and evolution throughout time. Predicting the spatial distribution of rainfall over the catchment region is particularly challenging since rainfall serves as the main input in hydrological models (Todini, 2007; Loritz et al., 2021; Salvadore et al., 2015). This could compel the researcher to reduce the number of research questions, thus leading to an increase in model uncertainty (Abushandi and Merkel, 2013). Hydrologic models may require substantial modifications to global data storage systems for geology and soils, which may be frequently necessary. In order to improve hydrological processes, it is essential to categorize various types of soil and rock classes into distinct groupings (Costea et al., 2022; Sestras et al., 2023a). When determining the scale of spatial discretization and routing in catchment models, it is essential to take into account the topographical data and the desired level of precision required by other modeling communities and organizations. The topography data is the primary factor that determines this (Olayinka and Irivbogbe, 2017; Fathalizadeh et al., 2020; Azizi et al., 2021). Enhancing the geological databases would be facilitated and rendered more valuable through increased collaboration and communication among hydrologists, geographers, and other researchers studying the Earth’s surface (Archfield et al., 2015; Qi et al., 2021).
In Romania, due to the increased frequency of floods, a Flood Risk Management Plan was developed (Ministerul Mediului, 2023; Diaconu, 2022), with the main goal of reducing the negative consequences of floods for human health, economic activity, the environment, and cultural heritage through a synergy of prevention, protection, preparation, emergency management, and post-flood measures (reconstruction and recovery). Flood Risk Management Plans address all areas of flood risk management, focusing on prevention, protection, and readiness while taking into account the features of the catchment or sub-catchment, such as flood forecasting and early warning systems. Hydrological modeling systems, such as HEC-HMS, can be beneficial for understanding rainfall-runoff mechanisms in high-risk watersheds and implementing the most effective remedies.
5 Conclusion
The current research employed the HEC-HMS model to simulate runoff in watersheds, facilitating flood modeling, water resource planning, and management applications. The regression equation, coefficient of determination, correlation coefficient, and various indices such as root mean squared error (RMSE), index of agreement (d), deviation of runoff volumes (Dv), Nash−Sutcliffe efficiency (NSE), and Kling-Gupta efficiency (KGE) have shown a strong correlation between simulated flows and observed flows. Hence, these statistical features have demonstrated the reliability of the model for the Gilort watershed. They contributed to comparing simulated and observed data and probably could be of interest to the forecast of discharges from the studied hydrographic region. The presented model can be utilized to predict river flow and aid in flood mitigation efforts. Furthermore, the findings derived from this study can serve as a valuable reference for forthcoming endeavors in assessing flood risks within the study region. Subsequent research will concentrate on creating a database for improved regionalization of the rainfall-runoff model and validating the model across a wide range of catchments in the current study area.
Data availability statement
The original contributions presented in the study are included in the article/supplementary material, further inquiries can be directed to the corresponding authors.
Author contributions
MH: Conceptualization, Methodology, Visualization, Writing – original draft. CB-M: Formal analysis, Investigation, Software, Validation, Visualization, Writing – original draft. CP: Funding acquisition, Project administration, Resources, Supervision, Writing – original draft. AH: Data curation, Investigation, Validation, Visualization, Writing – original draft. LD: Data curation, Formal analysis, Investigation, Supervision, Writing – review & editing. GP: Data curation, Formal analysis, Investigation, Methodology, Software, Validation, Visualization, Writing – original draft. SK: Formal analysis, Software, Validation, Visualization, Writing – review & editing. PS: Conceptualization, Formal analysis, Investigation, Visualization, Writing – review & editing.
Funding
The author(s) declare that financial support was received for the research, authorship, and/or publication of this article. This work was supported by the project “Increasing the impact of excellence research on the capacity for innovation and technology transfer within USV Timișoara” code 6PFE, submitted in the competition Program 1 - Development of the national system of research - development, Subprogram 1.2 - Institutional performance, Institutional development projects - Development projects of excellence in RDI.
Acknowledgments
The authors thank the GEOMATICS Research Laboratory, ULS “King Mihai I” from Timisoara, for the facility of the software use for this study.
Conflict of interest
The authors declare that the research was conducted in the absence of any commercial or financial relationships that could be construed as a potential conflict of interest.
Publisher’s note
All claims expressed in this article are solely those of the authors and do not necessarily represent those of their affiliated organizations, or those of the publisher, the editors and the reviewers. Any product that may be evaluated in this article, or claim that may be made by its manufacturer, is not guaranteed or endorsed by the publisher.
References
Aboelkhair, H., Morsy, M., and El Afandi, G. (2019). Assessment of agroclimatology Nasa power reanalysis datasets for temperature types and relative humidity at 2 m against ground observations over Egypt. Adv. Space Res. 64, 129–142. doi: 10.1016/j.asr.2019.03.032
Abushandi, E., and Merkel, B. (2013). Modelling rainfall runoff relations using HEC-HMS and Ihacres for a single rain event in an arid region of Jordan. Water Resour. Manag. 27, 2391–2409. doi: 10.1007/s11269-013-0293-4
Administratia Nationala De Meteorologie. (2024). Meteo Romania. București. Available at: https://www.meteoromania.ro/ (Accessed November 24, 2023).
AgriMetSoft. (2019). Online calculators. Korea, Seoul National University's BK Residence Halls is, A1201. Available at: https://agrimetsoft.com/calculators (Accessed December 10, 2023).
Ahmad, M. N., Shao, Z., and Javed, A. (2023). Modelling land use/land cover (Lulc) change dynamics, future prospects, and its environmental impacts based on geospatial data models and remote sensing data. Environ. Sci. Pollut. Res. 30, 32985–33001. doi: 10.1007/s11356-022-24442-2
Ajmal, M., Waseem, M., Ahn, J.-H., and Kim, T.-W. (2015). Improved runoff estimation using event-based rainfall-runoff models. Water Resour. Manag. 29, 1995–2010. doi: 10.1007/s11269-015-0924-z
Al-Sabhan, W., Mulligan, M., and Blackburn, G. A. (2003). A real-time hydrological model for flood prediction using Gis and the www. Comput. Environ. Urban. Syst. 27, 9–32. doi: 10.1016/S0198-9715(01)00010-2
Al-Taei, A. I., Alesheikh, A. A., and Darvishi Boloorani, A. (2023). Land use/land cover change analysis using multi-temporal remote sensing data: a case study of Tigris and Euphrates Rivers Basin. Land 12:1101. doi: 10.3390/land12051101
Angelakis, A. N., Capodaglio, A. G., Valipour, M., Krasilnikoff, J., Ahmed, A. T., Mandi, L., et al. (2023). Evolution of floods: from ancient times to the present times (ca 7600 BC to the present) and the future. Land 12:1211. doi: 10.3390/land12061211
Ansari, M. Z., Ahmad, I., Rautela, K. S., Goyal, M. K., and Singh, P. K. (2023). “Hydrological modelling using HEC-HMS and estimation of the flood peak by Gumbel’s method” in Ecosystem restoration: towards sustainability and resilient development. eds. A. K. Gupta, M. K. Goyal, and S. P. Singh (Singapore: Springer Nature Singapore).
Archfield, S. A., Clark, M., Arheimer, B., Hay, L. E., Mcmillan, H., Kiang, J. E., et al. (2015). Accelerating advances in continental domain hydrologic modeling. Water Resour. Res. 51, 10078–10091. doi: 10.1002/2015WR017498
Azizi, S., Ilderomi, A. R., and Noori, H. (2021). Investigating the effects of land use change on flood hydrograph using HEC-HMS hydrologic model (case study: Ekbatan Dam). Nat. Hazards 109, 145–160. doi: 10.1007/s11069-021-04830-6
Bahiru, T. K., Aldosary, A. S., Kafy, A. A., Rahman, M. T., Nath, H., Kalaivani, S., et al. (2024). Geospatial approach in modeling linear, areal, and relief morphometric interactions in Dabus river basin ecology for sustainable water resource management. Groundw. Sustain. Dev. 24:101067. doi: 10.1016/j.gsd.2023.101067
Balica, S. F., Dinh, Q., and Popescu, I. (2023). Vulnerability and exposure in developed and developing countries. In: J. F. Shroder, P. Paron, and G. BaldassarreDi, (eds.) Hydro-meteorological hazards, risks, and disasters. Boston: Elsevier.
Bammou, Y., Benzougagh, B., Igmoullan, B., Ouallali, A., Kader, S., Spalevic, V., et al. (2024). Optimizing flood susceptibility assessment in semi-arid regions using ensemble algorithms: a case study of Moroccan high atlas. Nat. Hazards 120, 7787–7816. doi: 10.1007/s11069-024-06550-z
Ben Khélifa, W., and Mosbahi, M. (2022). Modeling of rainfall-runoff process using HEC-HMS model for an urban ungauged watershed in Tunisia. Model. Earth Syst. Environ. 8, 1749–1758. doi: 10.1007/s40808-021-01177-6
Bharath, A., Kumar, K. K., Maddamsetty, R., Manjunatha, M., Tangadagi, R. B., and Preethi, S. (2021). Drainage morphometry based sub-watershed prioritization of Kalinadi basin using geospatial technology. Environ. Chall. 5:100277. doi: 10.1016/j.envc.2021.100277
Bilașco, Ș., Hognogi, G.-G., RoȘca, S., Pop, A.-M., Iuliu, V., Fodorean, I., et al. (2022). Flash flood risk assessment and mitigation in digital-era governance using unmanned aerial vehicle and GIS spatial analyses case study: small river basins. Remote Sens. 14:2481. doi: 10.3390/rs14102481
Bilașco, Ș., RoȘca, S., Vescan, I., Fodorean, I., Dohotar, V., and Sestras, P. (2021). A Gis-based spatial analysis model approach for identification of optimal Hydrotechnical solutions for gully Erosion stabilization: case study. Appl. Sci. 11:4847. doi: 10.3390/app11114847
Biudes, M. S., Machado, N. G., Danelichen, V. H. D. M., Souza, M. C., Vourlitis, G. L., and Nogueira, J. D. S. (2014). Ground and remote sensing-based measurements of leaf area index in a transitional forest and seasonal flooded forest in Brazil. Int. J. Biometeorol. 58, 1181–1193. doi: 10.1007/s00484-013-0713-4
Bouramtane, T., Tiouiouine, A., Kacimi, I., Valles, V., Talih, A., Kassou, N., et al. (2020). Drainage network patterns determinism: a comparison in arid, semi-arid and semi-humid area of Morocco using multifactorial approach. Hydrology 7:87. doi: 10.3390/hydrology7040087
Bronstert, A. (2003). Floods and climate change: interactions and impacts. Risk Anal. 23, 545–557. doi: 10.1111/1539-6924.00335
Bryndal, T. (2023). Changes in the active drainage network and their impact on the hydrological response and flood risk management process: a case study for a Flysch Mountain catchment. Resources 12:146. doi: 10.3390/resources12120146
Castro, C. V., and Maidment, D. R. (2020). Gis preprocessing for rapid initialization of HEC-HMS hydrological basin models using web-based data services. Environ. Model Softw. 130:104732. doi: 10.1016/j.envsoft.2020.104732
Chendeș, V. (2007). Liquid and solid runoff in curvature Subcarpathian. Doctoral thesis,: Romanian Academy, Institute of Geography.
Choudhari, K., Panigrahi, B., and Paul, J. C. (2014). Simulation of rainfall-runoff process using HEC-HMS model for Balijore Nala Watershed, Odisha, India. Int. J. Geom. Geosci. 5, 253–265.
Costea, A., Bilasco, S., Irimus, I.-A., Rosca, S., Vescan, I., Fodorean, I., et al. (2022). Evaluation of the risk induced by soil Erosion on land use. Case study: Guruslău depression. Sustain. For. 14:652. doi: 10.3390/su14020652
De La Fuente, A., Meruane, V., and Meruane, C. (2019). Hydrological early warning system based on a deep learning runoff model coupled with a meteorological forecast. Water 11:1808. doi: 10.3390/w11091808
Demisse, H., Ayalew, A., Ayana, M., and Lohani, T. (2021). Extenuating the parameters using HEC-HMS hydrological model for ungauged catchment in the central Omo-Gibe Basin of Ethiopia. J. Groundwater Sci. Eng. 9, 317–325. doi: 10.19637/j.cnki.2305-7068.2021.04.005
Dixit, A. (2003). Floods and vulnerability: need to rethink flood management. Nat. Hazards 28, 155–179. doi: 10.1023/A:1021134218121
Du, J., Qian, L., Rui, H., Zuo, T., Zheng, D., Xu, Y., et al. (2012). Assessing the effects of urbanization on annual runoff and flood events using an integrated hydrological modeling system for Qinhuai River basin, China. J. Hydrol. 464-465, 127–139. doi: 10.1016/j.jhydrol.2012.06.057
Duc, L., and Sawada, Y. (2023). A signal-processing-based interpretation of the Nash–Sutcliffe efficiency. Hydrol. Earth Syst. Sci. 27, 1827–1839. doi: 10.5194/hess-27-1827-2023
Dunca, A.-M., and Bădăluță-Minda, C. (2018). The determination of the maximum runoff in the representative and experimental hydrographical basin of Sebes River (Banat, Romania). Rocznik Ochrona Środowiska 20, 54–72.
Eccles, R., Zhang, H., and Hamilton, D. (2019). A review of the effects of climate change on riverine flooding in subtropical and tropical regions. J. Water Clim. Change 10, 687–707. doi: 10.2166/wcc.2019.175
Fan, Y., Li, H., and Miguez-Macho, G. (2013). Global patterns of groundwater table depth. Science 339, 940–943. doi: 10.1126/science.1229881
Fathalizadeh, B., Abedini, M., and Rajabi, M. (2020). Investigating the causes and hazards of flood in Zunuzchay watershed using HEC-HMS hydrological model and fuzzy logic. J. Quant. Geomorphol. Res. 9, 134–155. doi: 10.22034/gmpj.2020.109539
Fleming, M., and Brauer, T. (2016). Hydrologic modelling system HEC-HMS quick start guide. Version 4.2: US Army Corps of Engineers, Institute of Water Resources.
Fleming, M. J., and Doan, J. H. (2013). HEC-GeoHMS geospatial hydrologic modeling extension user’s manual. Davis, CA: US Army Corps of Engineers, Hydrologic Engineering Center.
Franz, K. J., and Hogue, T. S. (2011). Evaluating uncertainty estimates in hydrologic models: borrowing measures from the forecast verification community. Hydrol. Earth Syst. Sci. 15, 3367–3382. doi: 10.5194/hess-15-3367-2011
Gambolati, G., Teatini, P., and Gonella, M. (2002). Gis simulations of the inundation risk in the coastal lowlands of the northern Adriatic Sea. Math. Comput. Model. 35, 963–972. doi: 10.1016/S0895-7177(02)00063-8
Gholami, V., and Khaleghi, M. R. (2021). A simulation of the rainfall-runoff process using artificial neural network and HEC-HMS model in forest lands. J. For. Sci. 67, 165–174. doi: 10.17221/90/2020-JFS
Ghosh, M., and Gope, D. (2021). Hydro-morphometric characterization and prioritization of sub-watersheds for land and water resource management using fuzzy analytical hierarchical process (FAHP): a case study of upper Rihand watershed of Chhattisgarh state, India. Appl Water Sci 11:17. doi: 10.1007/s13201-020-01340-x
Grecu, F., Zaharia, L., Ioana-Toroimac, G., and ArmaȘ, I. (2017). “Floods and flash-floods related to river channel dynamics” in Landform dynamics and evolution in Romania. eds. M. Radoane and A. Vespremeanu-Stroe (Cham: Springer International Publishing).
Halwatura, D., and Najim, M. M. M. (2013). Application of the HEC-HMS model for runoff simulation in a tropical catchment. Environ. Model Softw. 46, 155–162. doi: 10.1016/j.envsoft.2013.03.006
Hamdan, A. N. A., Almuktar, S., and Scholz, M. (2021). Rainfall-runoff modeling using the HEC-HMS model for the Al-Adhaim River catchment, northern Iraq. Hydrology 8:58. doi: 10.3390/hydrology8020058
Hawley, M. E., and Mccuen, R. H. (1982). Water yield estimation in Western United States. J. Irrig. Drain Div. 108, 25–34.
Ionita, M., and Nagavciuc, V. (2021). Extreme floods in the eastern part of Europe: large-scale drivers and associated impacts. Water 13:1122. doi: 10.3390/w13081122
Jain, S., and Lall, U. (2001). Floods in a changing climate: does the past represent the future? Water Resour Res. 37, 3193–3205. doi: 10.1029/2001WR000495
Jonkman, S. N. (2005). Global perspectives on loss of human life caused by floods. Nat. Hazards 34, 151–175. doi: 10.1007/s11069-004-8891-3
Knebl, M. R., Yang, Z. L., Hutchison, K., and Maidment, D. R. (2005). Regional scale flood modeling using Nexrad rainfall, Gis, and HEC-HMS/RAS: a case study for the San Antonio River basin summer 2002 storm event. J. Environ. Manag. 75, 325–336. doi: 10.1016/j.jenvman.2004.11.024
Kron, W., Steuer, M., Löw, P., and Wirtz, A. (2012). How to deal properly with a natural catastrophe database – analysis of flood losses. Nat. Hazards Earth Syst. Sci. 12, 535–550. doi: 10.5194/nhess-12-535-2012
Kumar Rai, P., Narayan Mishra, V., and Mohan, K. (2017). A study of morphometric evaluation of the son basin, India using geospatial approach. Remote Sens. Appl. Soc. Environ. 7, 9–20. doi: 10.1016/j.rsase.2017.05.001
Kumar, V., Sharma, K. V., Caloiero, T., Mehta, D. J., and Singh, K. (2023). Comprehensive overview of flood modeling approaches: a review of recent advances. Hydrology 10:141. doi: 10.3390/hydrology10070141
Liu, Y., Zhang, T., Kang, A., Li, J., and Lei, X. (2021). Research on runoff simulations using deep-learning methods. Sustain. For. 13:1336. doi: 10.3390/su13031336
Loritz, R., Hrachowitz, M., Neuper, M., and Zehe, E. (2021). The role and value of distributed precipitation data in hydrological models. Hydrol. Earth Syst. Sci. 25, 147–167. doi: 10.5194/hess-25-147-2021
Martinec, J., and Rango, A. (1989). Merits of statistical criteria for the performance of hydrological MODELS1. Jawra J. Am. Water Resour. Assoc. 25, 421–432. doi: 10.1111/j.1752-1688.1989.tb03079.x
Masseroni, D., Cislaghi, A., Camici, S., Massari, C., and Brocca, L. (2016). A reliable rainfall–runoff model for flood forecasting: review and application to a semi-urbanized watershed at high flood risk in Italy. Hydrol. Res. 48, 726–740. doi: 10.2166/nh.2016.037
Mathevet, T., Le Moine, N., Andréassian, V., Gupta, H., and Oudin, L. (2023). Multi-objective assessment of hydrological model performances using Nash–Sutcliffe and Kling–Gupta efficiencies on a worldwide large sample of watersheds. Comptes Rendus. Géosci. 355, 117–141. doi: 10.5802/crgeos.189
Mediero, L., Jiménez-Álvarez, A., and Garrote, L. (2010). Design flood hydrographs from the relationship between flood peak and volume. Hydrol. Earth Syst. Sci. 14, 2495–2505. doi: 10.5194/hess-14-2495-2010
Mekanik, F., Imteaz, M. A., Gato-Trinidad, S., and Elmahdi, A. (2013). Multiple regression and artificial neural network for long-term rainfall forecasting using large scale climate modes. J. Hydrol. 503, 11–21. doi: 10.1016/j.jhydrol.2013.08.035
Merz, B., Blöschl, G., Vorogushyn, S., Dottori, F., Aerts, J. C. J. H., Bates, P., et al. (2021). Causes, impacts and patterns of disastrous river floods. Nat. Rev. Earth Environ. 2, 592–609. doi: 10.1038/s43017-021-00195-3
Meteoblue AG. Meteoblue weather. Basel. (2024) Available at: https://content.meteoblue.com/en (Accessed November 24, 2023).
Mihalik, E. N., Levine, N. S., and Amatya, D. M. (2008). Rainfall-runoff modeling of the chapel branch creek watershed using GIS-based rational and SCS-CN methods. St. Joseph, MI: American Society of Agricultural and Biological Engineers.
Ministerul Mediului. (2023). Planul de Management al Riscului la Inundații (Romania). București. Available at: https://www.mmediu.ro/categorie/planul-de-management-al-riscului-la-inundatii/376 (Accessed December 12, 2023).
Mishra, S. K., and Singh, V. P. (2013). Soil conservation service curve number (SCS-CN) methodology (Vol. 42). Springer Science & Business Media.
Moriasi, D. N., Arnold, J. G., van Liew, M. W., Bingner, R. L., Harmel, R. D., and Veith, T. L. (2007). Model evaluation guidelines for systematic quantification of accuracy in watershed simulations. Trans. ASABE 50, 885–900. doi: 10.13031/2013.23153
Mudelsee, M. (2014). Climate time series analysis: Classical statistical and bootstrap methods. 2nd Edn. Cham: Springer International Publishing.
Mustafa, M., Barnhart, B., Babbar-Sebens, M., and Ficklin, D. (2018). Modeling landscape change effects on stream temperature using the soil and water assessment tool. Water 10:1143. doi: 10.3390/w10091143
Mustafa, A., Szydłowski, M., Veysipanah, M., and Hameed, H. M. (2023). GIS-based hydrodynamic modeling for urban flood mitigation in fast-growing regions: a case study of Erbil, Kurdistan region of Iraq. Sci. Rep. 13:8935. doi: 10.1038/s41598-023-36138-9
Muthu, A. L., and Santhi, M. H. (2015). Estimation of surface runoff potential using SCS-CN method integrated with GIS. Indian J. Sci. Technol. 8, 1–6. doi: 10.17485/ijst/2015/v8i28/83324
Nash, J. E., and Sutcliffe, J. V. (1970). River flow forecasting through conceptual models part I — a discussion of principles. J. Hydrol. 10, 282–290. doi: 10.1016/0022-1694(70)90255-6
Natarajan, S., and Radhakrishnan, N. (2019). Simulation of extreme event-based rainfall–runoff process of an urban catchment area using HEC-HMS. Model. Earth Syst. Environ. 5, 1867–1881. doi: 10.1007/s40808-019-00644-5
Natarajan, S., and Radhakrishnan, N. (2020). Flood hazard delineation in an ungauged catchment by coupling hydrologic and hydraulic models with geospatial techniques—a case study of Koraiyar basin, Tiruchirappalli City, Tamil Nadu, India. Environ. Monit. Assess. 192:689. doi: 10.1007/s10661-020-08650-2
Olayinka, D., and Irivbogbe, H. (2017). Estimation of hydrological outputs using HEC-HmS and GIS. Nig. J. Environ. Sci. Technol. 1, 390–402. doi: 10.36263/nijest.2017.02.0054
Ouallali, A., Kader, S., Bammou, Y., Aqnouy, M., Courba, S., Beroho, M., et al. (2024). Assessment of the erosion and outflow intensity in the Rif region under different land use and land cover scenarios. Land 13:141. doi: 10.3390/land13020141
Peptenatu, D., Grecu, A., Simion, A. G., Gruia, K. A., Andronache, I., Draghici, C. C., et al. (2020). “Deforestation and frequency of floods in Romania” in Water resources management in Romania. eds. A. M. Negm, G. Romanescu, and M. Zeleňáková (Cham: Springer International Publishing).
Petrişor, A.-I., Sirodoev, I., and Ianoş, I. (2020). Trends in the national and regional transitional dynamics of land cover and use changes in Romania. Remote Sens. 12:230. doi: 10.3390/rs12020230
Ponce, V. M., and Hawkins, R. H. (1996). Runoff curve number: has it reached maturity? J. Hydrol. Eng. 1, 11–19. doi: 10.1061/(ASCE)1084-0699(1996)1:1(11)
Pullar, D., and Springer, D. (2000). Towards integrating Gis and catchment models. Environ. Model Softw. 15, 451–459. doi: 10.1016/S1364-8152(00)00023-2
Qi, W., Ma, C., Xu, H., Chen, Z., Zhao, K., and Han, H. (2021). A review on applications of urban flood models in flood mitigation strategies. Nat. Hazards 108, 31–62. doi: 10.1007/s11069-021-04715-8
Rahman, K. U., Balkhair, K. S., Almazroui, M., and Masood, A. (2017). Sub-catchments flow losses computation using Muskingum–Cunge routing method and HEC-HMS GIS based techniques, case study of Wadi Al-Lith, Saudi Arabia, Model. Earth Syst. Environ Saudi Arabia. Model. Earth Syst. Environ 3, 1–19. doi: 10.1007/s40808-017-0268-1
Ramly, S., and Tahir, W. (2016). “Application of HEC-GeoHMS and HEC-HMS as rainfall–runoff model for flood simulation” in Isfram 2015. eds. W. Tahir, P. I. D. S. H. Abu Bakar, M. A. Wahid, S. R. Mohd Nasir, and W. K. Lee (Singapore: Springer Singapore), 181–192.
Ranjan, S., and Singh, V. (2022). HEC-HMS based rainfall-runoff model for Punpun river basin. Water Pract. Technol. 17, 986–1001. doi: 10.2166/wpt.2022.033
Rezaei-Sadr, H. (2020). Flood hydrograph prediction in a semiarid mountain catchment: the role of catchment subdivision. J. Flood Risk. Manag. 13:e12568. doi: 10.1111/jfr3.12568
Ross, C., Prihodko, L., Anchang, J., Kumar, S., Ji, W., and Hanan, N. (2018). Global hydrologic soil groups (HYSOGs250m) for curve number-based runoff modeling. Oak Ridge, TN: ORNL DAAC.
Sahu, M. K., Shwetha, H. R., and Dwarakish, G. S. (2023). State-of-the-art hydrological models and application of the HEC-HMS model: a review. Model. Earth Syst. Environ. 9, 3029–3051. doi: 10.1007/s40808-023-01704-7
Salvadore, E., Bronders, J., and Batelaan, O. (2015). Hydrological modelling of urbanized catchments: a review and future directions. J. Hydrol. 529, 62–81. doi: 10.1016/j.jhydrol.2015.06.028
Sarminingsih, A., Rezagama, A., and Ridwan,. (2019). Simulation of rainfall-runoff process using HEC-HMS model for Garang watershed, Semarang, Indonesia. J. Phys. Conf. Ser. 1217:012134. doi: 10.1088/1742-6596/1217/1/012134
Sestras, P., Mircea, S., Cîmpeanu, S. M., Teodorescu, R., RoȘca, S., BilaȘco, Ș., et al. (2023a). Soil Erosion assessment using the intensity of Erosion and outflow model by estimating sediment yield: case study in river basins with different characteristics from Cluj County, Romania. Appl. Sci. 13:9481. doi: 10.3390/app13169481
Sestras, P., Mircea, S., RoȘca, S., BilaȘco, Ș., Sălăgean, T., Dragomir, L. O., et al. (2023b). Gis based soil erosion assessment using the Usle model for efficient land management: a case study in an area with diverse pedo-geomorphological and bioclimatic characteristics. Not. Bot. Hort. Agrob. 51:13263. doi: 10.15835/nbha51313263
Sestras, P., Salagean, T., Bilasco, S., Bondrea, M. V., Nas, S., Fountas, S., et al. (2019). Prospect of a Gis based digitization and 3D model for a better management and land use in a specific micro-areal for crop trees. Environ. Eng. Manag. J. 18, 1269–1277. doi: 10.30638/eemj.2019.121
Seth, N., Deshmukh, S. G., and Vrat, P. (2006). A conceptual model for quality of service in the supply chain. Int. J. Phys. Distri. Logist. Manag. 36, 547–575. doi: 10.1108/09600030610684971
Shah, M., and Lone, M. A. (2022). Hydrological modeling to simulate stream flow in the Sindh Valley watershed, Northwest Himalayas. Model. Earth Syst. Environ. 8, 2461–2470. doi: 10.1007/s40808-021-01241-1
Sidle, R. C. (2021). Strategies for smarter catchment hydrology models: incorporating scaling and better process representation. Geosci. Lett. 8:24. doi: 10.1186/s40562-021-00193-9
Skaugen, T., and Weltzien, I. H. (2016). A model for the spatial distribution of snow water equivalent parameterized from the spatial variability of precipitation. Cryosphere 10, 1947–1963. doi: 10.5194/tc-10-1947-2016
Sudriani, Y., Sebestyén, V., and Abonyi, J. (2023). Surface water monitoring systems—the importance of integrating information sources for sustainable watershed management. IEEE Access 11, 36421–36451. doi: 10.1109/ACCESS.2023.3263802
Svetlana, D., Radovan, D., and Ján, D. (2015). The economic impact of floods and their importance in different regions of the world with emphasis on Europe. Proc. Econ. Fin. 34, 649–655. doi: 10.1016/S2212-5671(15)01681-0
Taherizadeh, M., Niknam, A., Nguyen-Huy, T., Mezősi, G., and Sarli, R. (2023). Flash flood-risk areas zoning using integration of decision-making trial and evaluation laboratory, Gis-based analytic network process and satellite-derived information. Nat. Hazards 118, 2309–2335. doi: 10.1007/s11069-023-06089-5
Tariq, A., Hashemi Beni, L., Ali, S., Adnan, S., and Hatamleh, W. A. (2023). An effective geospatial-based flash flood susceptibility assessment with hydrogeomorphic responses on groundwater recharge. Groundw. Sustain. Dev. 23:100998. doi: 10.1016/j.gsd.2023.100998
Teng, F., Huang, W., Cai, Y., Zheng, C., and Zou, S. (2017). Application of hydrological model Prms to simulate daily rainfall runoff in Zamask-Yingluoxia subbasin of the Heihe River basin. Water 9:769. doi: 10.3390/w9100769
Teng, F., Huang, W., and Ginis, I. (2018). Hydrological modeling of storm runoff and snowmelt in Taunton River basin by applications of HEC-HMS and PRMS models. Nat. Hazards 91, 179–199. doi: 10.1007/s11069-017-3121-y
Thakur, J. K., Singh, S. K., and Ekanthalu, V. S. (2017). Integrating remote sensing, geographic information systems and global positioning system techniques with hydrological modeling. Appl Water Sci 7, 1595–1608. doi: 10.1007/s13201-016-0384-5
Todini, E. (2007). Hydrological catchment modelling: past, present and future. Hydrol. Earth Syst. Sci. 11, 468–482. doi: 10.5194/hess-11-468-2007
USDA (1972). Soil conservation service national engineering handbook. Section 4: hydrology. Washington, DC: USDA.
USGS. (2017). Runoff: surface and overland water runoff. Water Science School. Available at: https://www.usgs.gov/ (Accessed December 12, 2023).
Venkatesh, M., and Anshumali,. (2019). A GIS-based assessment of recent changes in drainage and morphometry of Betwa River basin and sub-basins, Central India. Appl. Water Sci. 9:157. doi: 10.1007/s13201-019-1033-6
Verma, R., Sharif, M., and Husain, A. (2022). Application of HEC-HMS for hydrological modeling of upper Sabarmati River basin, Gujarat, India. Model. Earth Syst. Environ. 8, 5585–5593. doi: 10.1007/s40808-022-01411-9
Visweshwaran, R. (2017). Application of the HEC-HMS model for runoff simulation in the Krishna basin. Master of Technology in Remote Sensing and Geographic Information System, National Institute of Technology Karnataka Surathkal.
Wagener, T., Wheater, H., and Gupta, H. V. (2004). Rainfall-runoff modelling in gauged and ungauged catchments. London: World Scientific.
Whitfield, P. H. (2012). Floods in future climates: a review. J. Flood Risk. Manag 5, 336–365. doi: 10.1111/j.1753-318X.2012.01150.x
Willmott, C. J. (1981). On the validation of models. Phys. Geogr. 2, 184–194. doi: 10.1080/02723646.1981.10642213
WMO (1986). Intercomparison of models of snowmelt runoff. Geneva: World Meteorological Organization.
Woodruff, J. D., Irish, J. L., and Camargo, S. J. (2013). Coastal flooding by tropical cyclones and sea-level rise. Nature 504, 44–52. doi: 10.1038/nature12855
Yan, Y., Zhang, W., Liu, Y., and Li, Z. (2023). Simulated annealing algorithm optimized Gru neural network for urban rainfall-inundation prediction. J. Hydroinf. 25, 1358–1379. doi: 10.2166/hydro.2023.006
Yang, L., Meng, X., and Zhang, X. (2011). SRTM DEM and its application advances. Int. J. Remote Sens. 32, 3875–3896. doi: 10.1080/01431161003786016
Yimer, G., Jonoski, A., and Griensven, A. V. (2009). Hydrological response of a catchment to climate change in the upper Beles river basin, upper blue Nile, Ethiopia. Nile Basin Water Eng. Sci. Mag. 2, 49–59.
Keywords: catchment area, discharge, hydrologic processes, precipitation, runoff, watershed systems
Citation: Herbei MV, Bădăluță-Minda C, Popescu CA, Horablaga A, Dragomir LO, Popescu G, Kader S and Sestras P (2024) Rainfall-runoff modeling based on HEC-HMS model: a case study in an area with increased groundwater discharge potential. Front. Water. 6:1474990. doi: 10.3389/frwa.2024.1474990
Edited by:
Velibor Spalevic, University of Montenegro, MontenegroReviewed by:
Ana M. Petrović, Serbian Academy of Sciences and Arts, SerbiaRastko Marković, University of Niš, Serbia
Abdessalam Ouallali, University of Hassan II Casablanca, Morocco
Copyright © 2024 Herbei, Bădăluță-Minda, Popescu, Horablaga, Dragomir, Popescu, Kader and Sestras. This is an open-access article distributed under the terms of the Creative Commons Attribution License (CC BY). The use, distribution or reproduction in other forums is permitted, provided the original author(s) and the copyright owner(s) are credited and that the original publication in this journal is cited, in accordance with accepted academic practice. No use, distribution or reproduction is permitted which does not comply with these terms.
*Correspondence: Adina Horablaga, YWRpbmFob3JhYmxhZ2FAdXN2dC5ybw==; Lucian Octavian Dragomir, bHVjaWFuZHJhZ29taXJAdXN2dC5ybw==