- 1ICAR-Central Research Institute for Dryland Agriculture, Hyderabad, Telangana, India
- 2ICAR-National Bureau of Soil Survey and Land Use Planning, Nagpur, Maharashtra, India
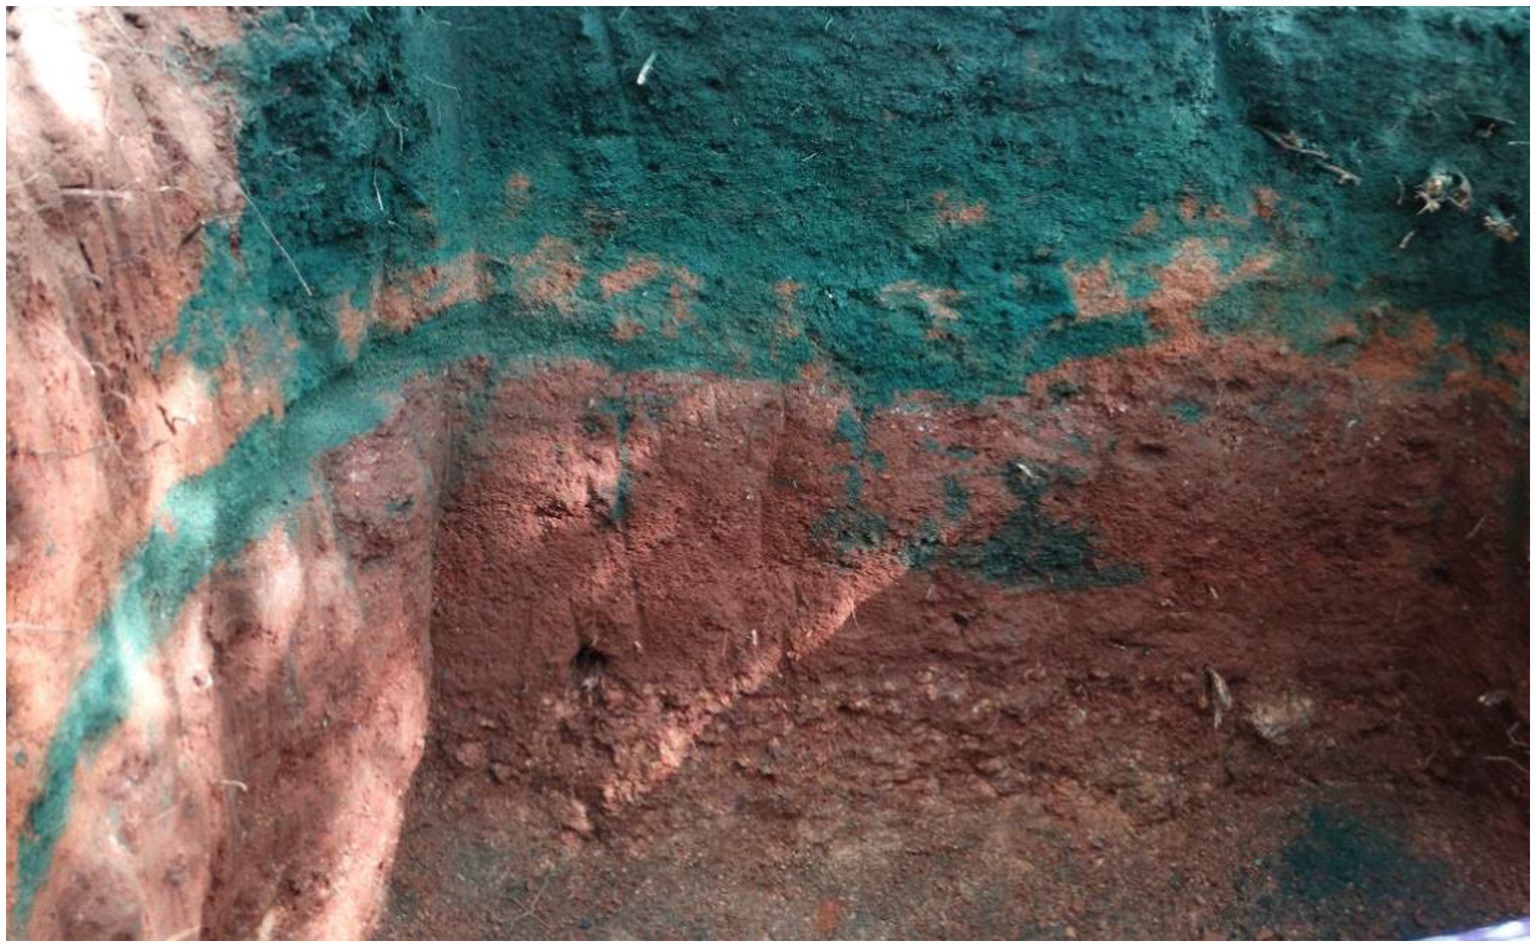
Preferential flow refers to the specific pathways through which water flows, including biopores, fractures, and macropores. Soil preferential flow has become increasingly important in the face of changing climates, erratic rainfall patterns, and for effective rainwater management. In semi-arid regions, watersheds serve as fundamental hydrologic units, providing a holistic perspective for the study of soil preferential flow. Given that limited research has been conducted on soil preferential flow in the dryland regions of southern India, the Hayathnagar watershed in Hyderabad was selected for this study. Land uses at different elevations were considered to systematically collect data on soil preferential flow, allowing for an analysis of how variations in elevation and land use influence flow dynamics across the landscape in the watershed. Brilliant blue tracer experiments were conducted at selected sites within the Hayathnagar watershed to assess soil preferential flow and investigate the subsurface movement of water across three land uses (cropped, fallow, and forest) under varying elevations. Vertical profile images were captured using a Canon EOS 1300D digital camera, producing high-resolution images (5184 × 3456 pixels). These digital images were then processed using ArcGIS 10.3 and ImageJ. The presence of preferential flow was clearly evident across all three different land uses and elevations within the watershed. The lower reach, with the least elevation, exhibited the highest dye coverage, correlating with greater uniform infiltration depth values. Furthermore, the middle reach displayed the maximum soil preferential flow, as indicated by the higher preferential flow fraction values, which were further justified by the preferential flow evaluation index. Heterogeneous matrix flow and fingering were observed both at the surface and sub-surface, along with macropore flow with low and mixed interactions. The findings and methodology of this study have significant implications for understanding preferential flow in diverse watersheds across the region. By enhancing our understanding of soil–water dynamics and flow patterns within the soil profile, this research contributes to the development of effective water management strategies in such areas.
Introduction
Dryland ecosystems, which cover 41% of the Earth’s surface, are sensitive to natural and anthropogenic disturbances and exert significant effects on the Earth’s climate through land–atmosphere interactions (Kimura and Moriyama, 2024). This ecosystem is constantly expanding with a growing population facing limited natural resources for production and sustainability. Soil hydrodynamics in these landscapes play an important role in efficient water use and management. Soil and water management is a solution for drylands to address national efforts to neutralize land degradation (Badapalli et al., 2021; Anusha et al., 2023).
The critical problems faced by dryland regions are shallow soil, large sections of rocks, and water movement within the soil (Anusha et al., 2023). The absorption of water into the soil, its redistribution into the soil matrix, and the rapid vertical and lateral movement of water along the proposed routes affect vegetation and cultivation in the long term. The presence of soil preferential flow (PF) also determines the flow rate of water through soil into the water bodies (Gou et al., 2023). Large volumes of water and mobilized substances from major storms rapidly flow through the subsoil to the aquifer, often within hours, days, or weeks, leading to significant groundwater contamination (Caputo et al., 2024).
In dryland regions, the watershed serves as a basic hydrological unit, where limited water resources are crucial for sustaining both the ecosystem and local communities (Sivapalan, 2003). Watershed hydrology is determined by the local climate, land use, and pathways of water flow. Preferential flow, a common form of soil–water movement, has gained increased attention in recent years as a key concept in soil hydrology, particularly due to its influence on solute transport (Makowski et al., 2020; Pushpanjali et al., 2022a). Depending on the saturated conductivity, soil preferential flow, either directly or indirectly regulates soil–water movement in dry rocky areas (Sohrt et al., 2014).
Land use significantly affects hydrological systems (Zhang et al., 2022), and its impact on soil hydrology and water distribution down the soil profile (Teixeira et al., 2014; Zhang et al., 2024) needs to be investigated. The heterogeneity of soil structure affects water and solute transport in soil (Cao et al., 2023; Chen et al., 2023). Various methods have been used to quantify soil PF and its morphological properties (Liu T. et al., 2022). Over the past 5 years, various techniques such as tracer technology, CT scan technology, isotopic tracking, geophysical sounding technology, electrical resistivity tomography (ERT) monitoring, and others have been used both in both field and laboratory conditions to study soil preferential flow (De Carlo et al., 2021). Methods such as dye tracer experiments and breakthrough curves are common and time-tested methods for investigating preferential flows at the field scale (Zhang et al., 2019; Haas et al., 2020; Liu T. et al., 2022; Duan et al., 2024). Such methods are easy to use, inexpensive, and widely used (Weiler and Flühler, 2004; Zhang et al., 2019) in large-scale soil hydrological studies (Haas et al., 2020; Duan et al., 2024). Organic dyes such as brilliant blue are invariably used for this purpose and are less toxic to soil flora and fauna (Flury et al., 1994; Forrer et al., 2000; Flury and Flühler, 1995; Sander and Gerke, 2007). In addition, brilliant blue is less absorbed into the soil and is widely used in groundwater flow tests due to its good mobility and visibility (Liu T. et al., 2022; Duan et al., 2024). The impact of brilliant blue was found to be negligible on soil properties (Fuhrmann et al., 2019; Wei et al., 2024). Despite some limitations, dye tracer experiments have been widely used (Morris and Mooney, 2004; Liu et al., 2023) to investigate preferential flow through soil macropores (Alaoui and Goetz, 2008; Allaire et al., 2009; Wang et al., 2021). Further image analysis of dye-stained soil helps to assess soil morphological properties (Wei et al., 2024), visualize (Persson, 2005; Wei et al., 2024; Duan et al., 2024), and quantify groundwater dynamics (Ewing and Horton, 1999; Aeby et al., 2001) within the soil profile.
Although preferential flow is often the rule rather than the exception in semi-arid dryland soils (Vogel et al., 2006), its knowledge is crucial for resource management to meet the water and agricultural needs of the region. Very few studies have been conducted to assess PF in the southern drylands of India, as it is often difficult for hydrologists to develop soil–water interaction-based hydrological models for these areas (Pandey et al., 2024); therefore, the need for soil hydrological studies of the area has been emphasized (Roy et al., 2024).
Detailed information on the soil hydrological parameters of different land uses is useful in evaluating the management requirements of these areas (Shahid et al., 2018; Shougrakpam et al., 2010). This study aims to bridge the gap by evaluating key aspects of soil preferential flow across different land uses and elevations within the watershed, to better understand its behavior in this region.
Materials and methods
Location
The Hayathnagar watershed, with an area of 154 ha, lies between 17°20′ 18.00″ to 17° 21′ 8.94″ N latitude and 78° 35′ 26.14″ to 78° 36′ 4.890″ E longitude. The study area represents a semi-arid tropical environment characterized by hot summers and mild winters. The mean annual rainfall in this area is 746.2 mm, with approximately three-fourths of the total precipitation occurring during the southwest monsoon season, from June to September.
The predominant land uses in the region include cropped land, fallow, and planted forestry and settlements (Pushpanjali et al., 2022b). The watershed was chosen specifically to cover most of the land use that prevailed in this region. The soils in the study area were derived from granite gneiss and were found in gently sloping to moderately sloping landscapes. These soils formed under a prevailing semi-arid climate and have experienced arid erosional cycles in the past. Moderate erosion covered approximately 67% of the study area, followed by slight erosion in 33% of the area.
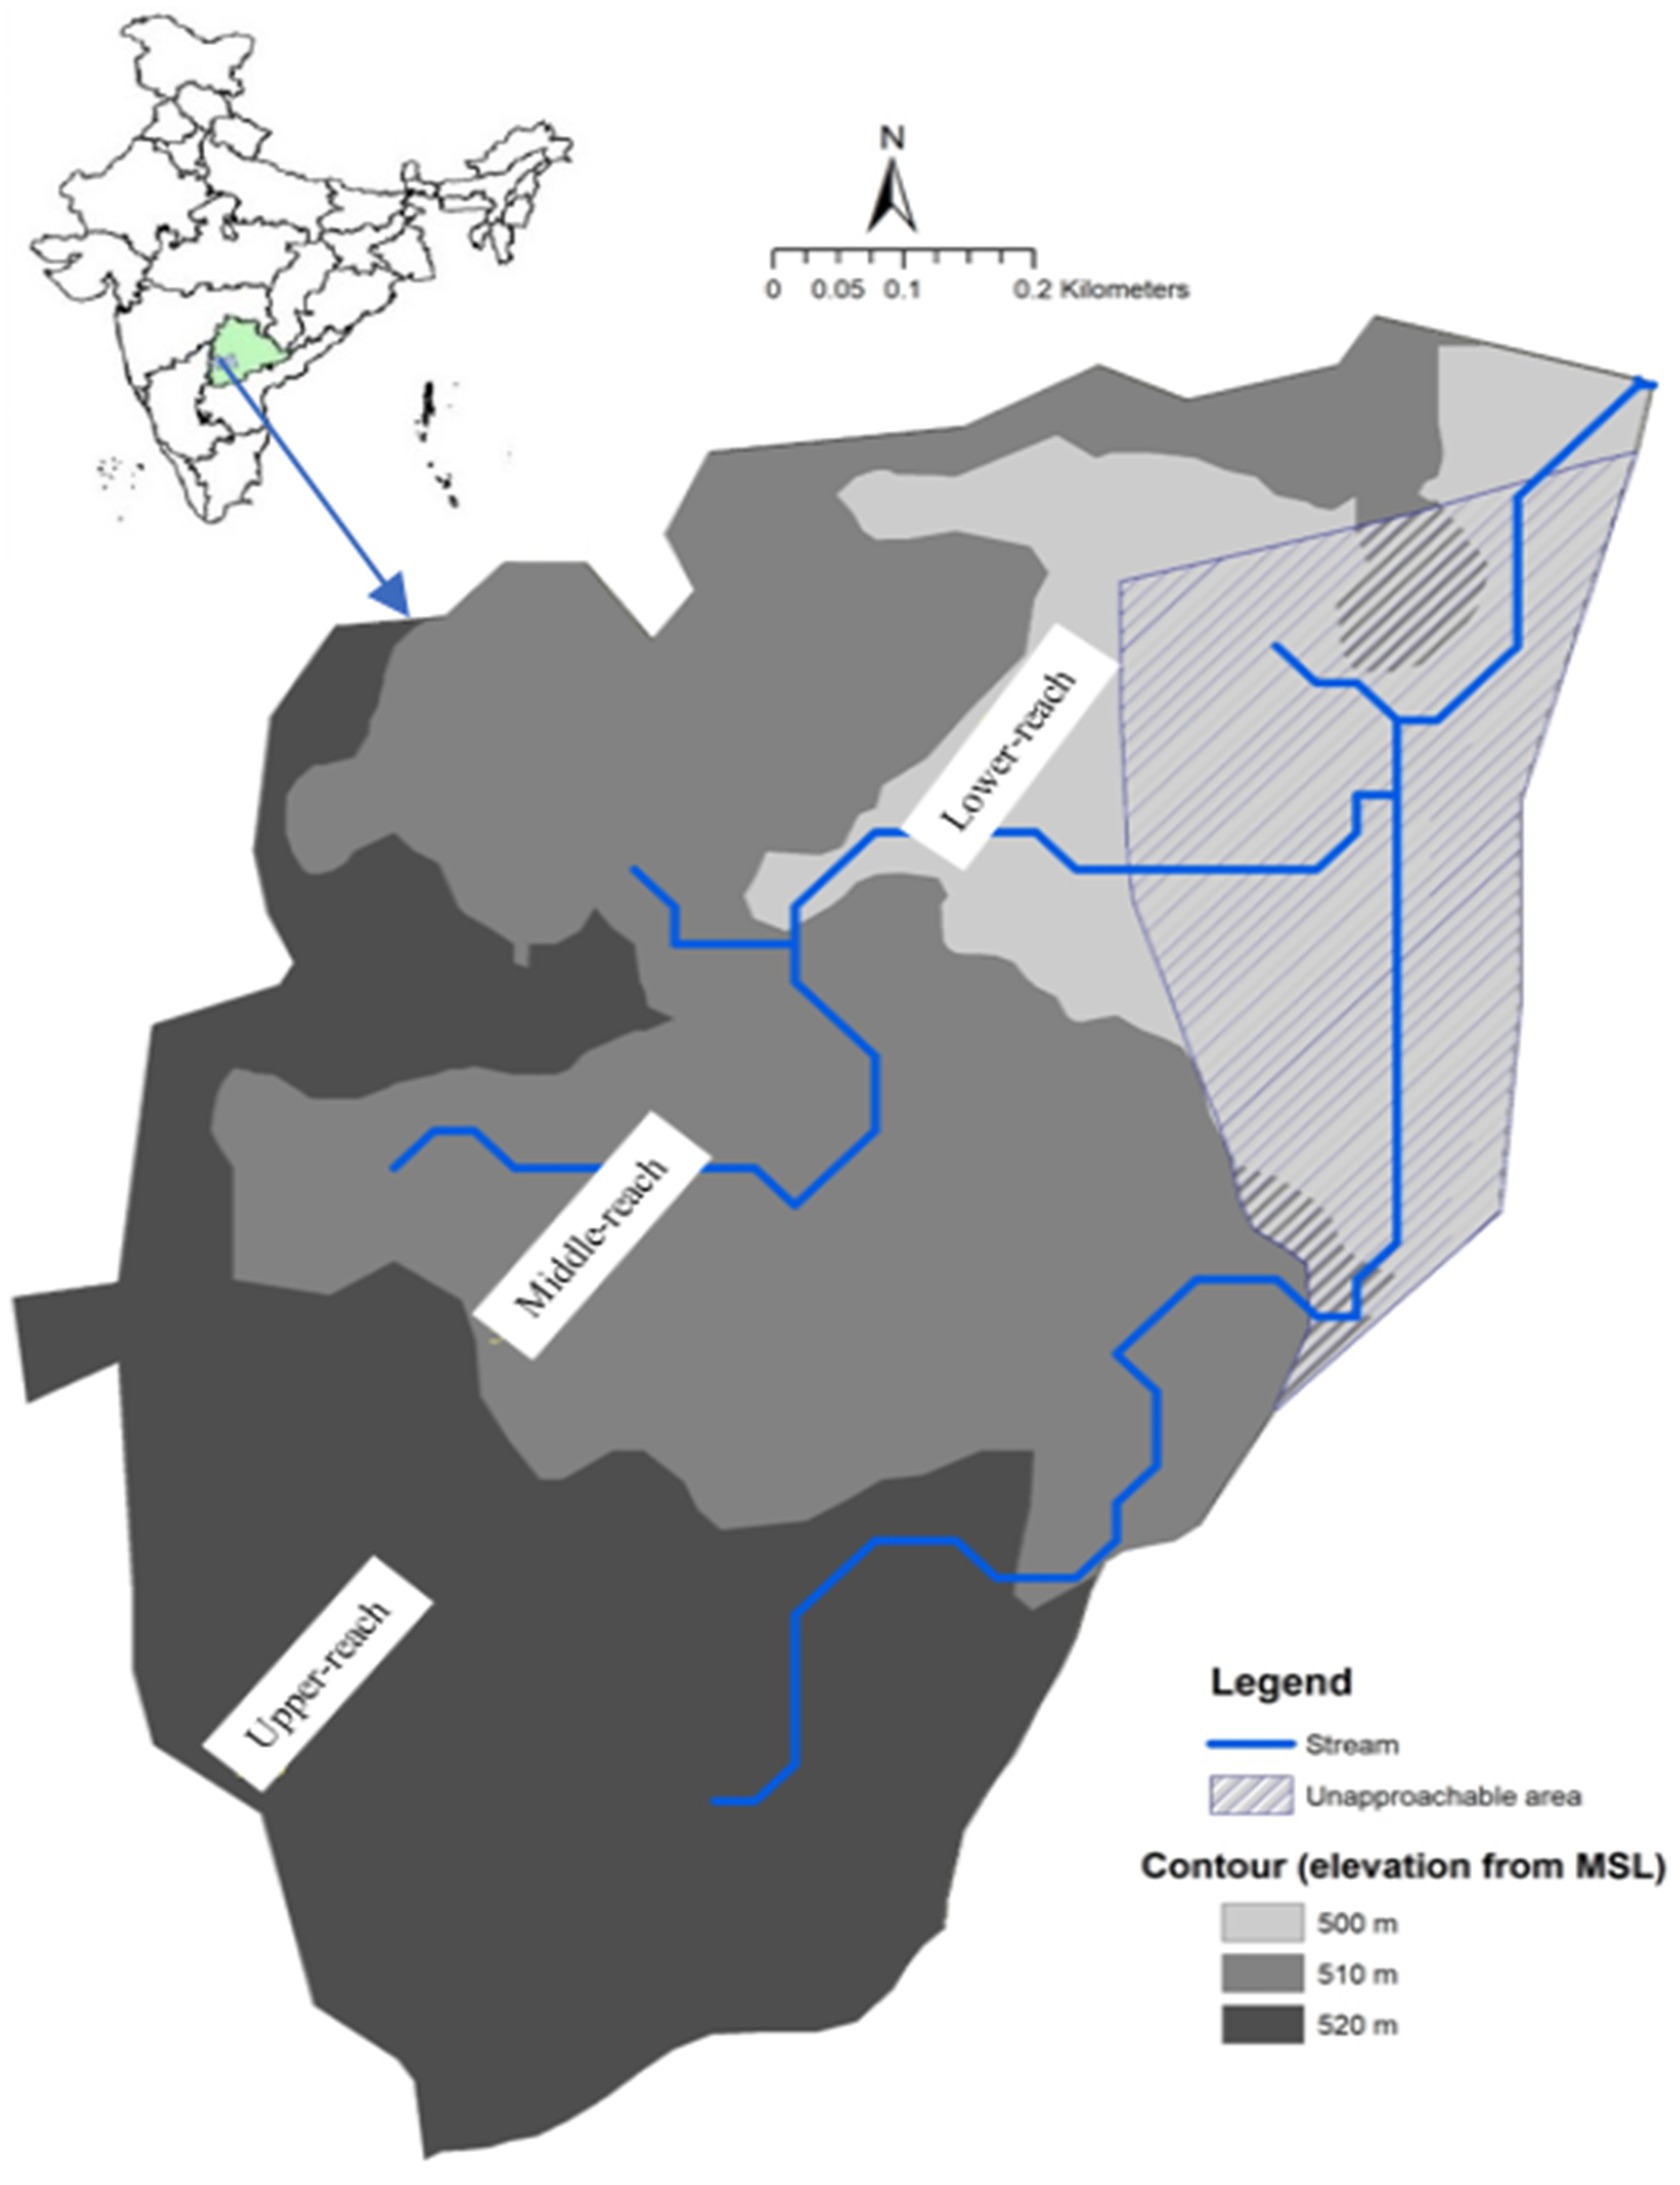
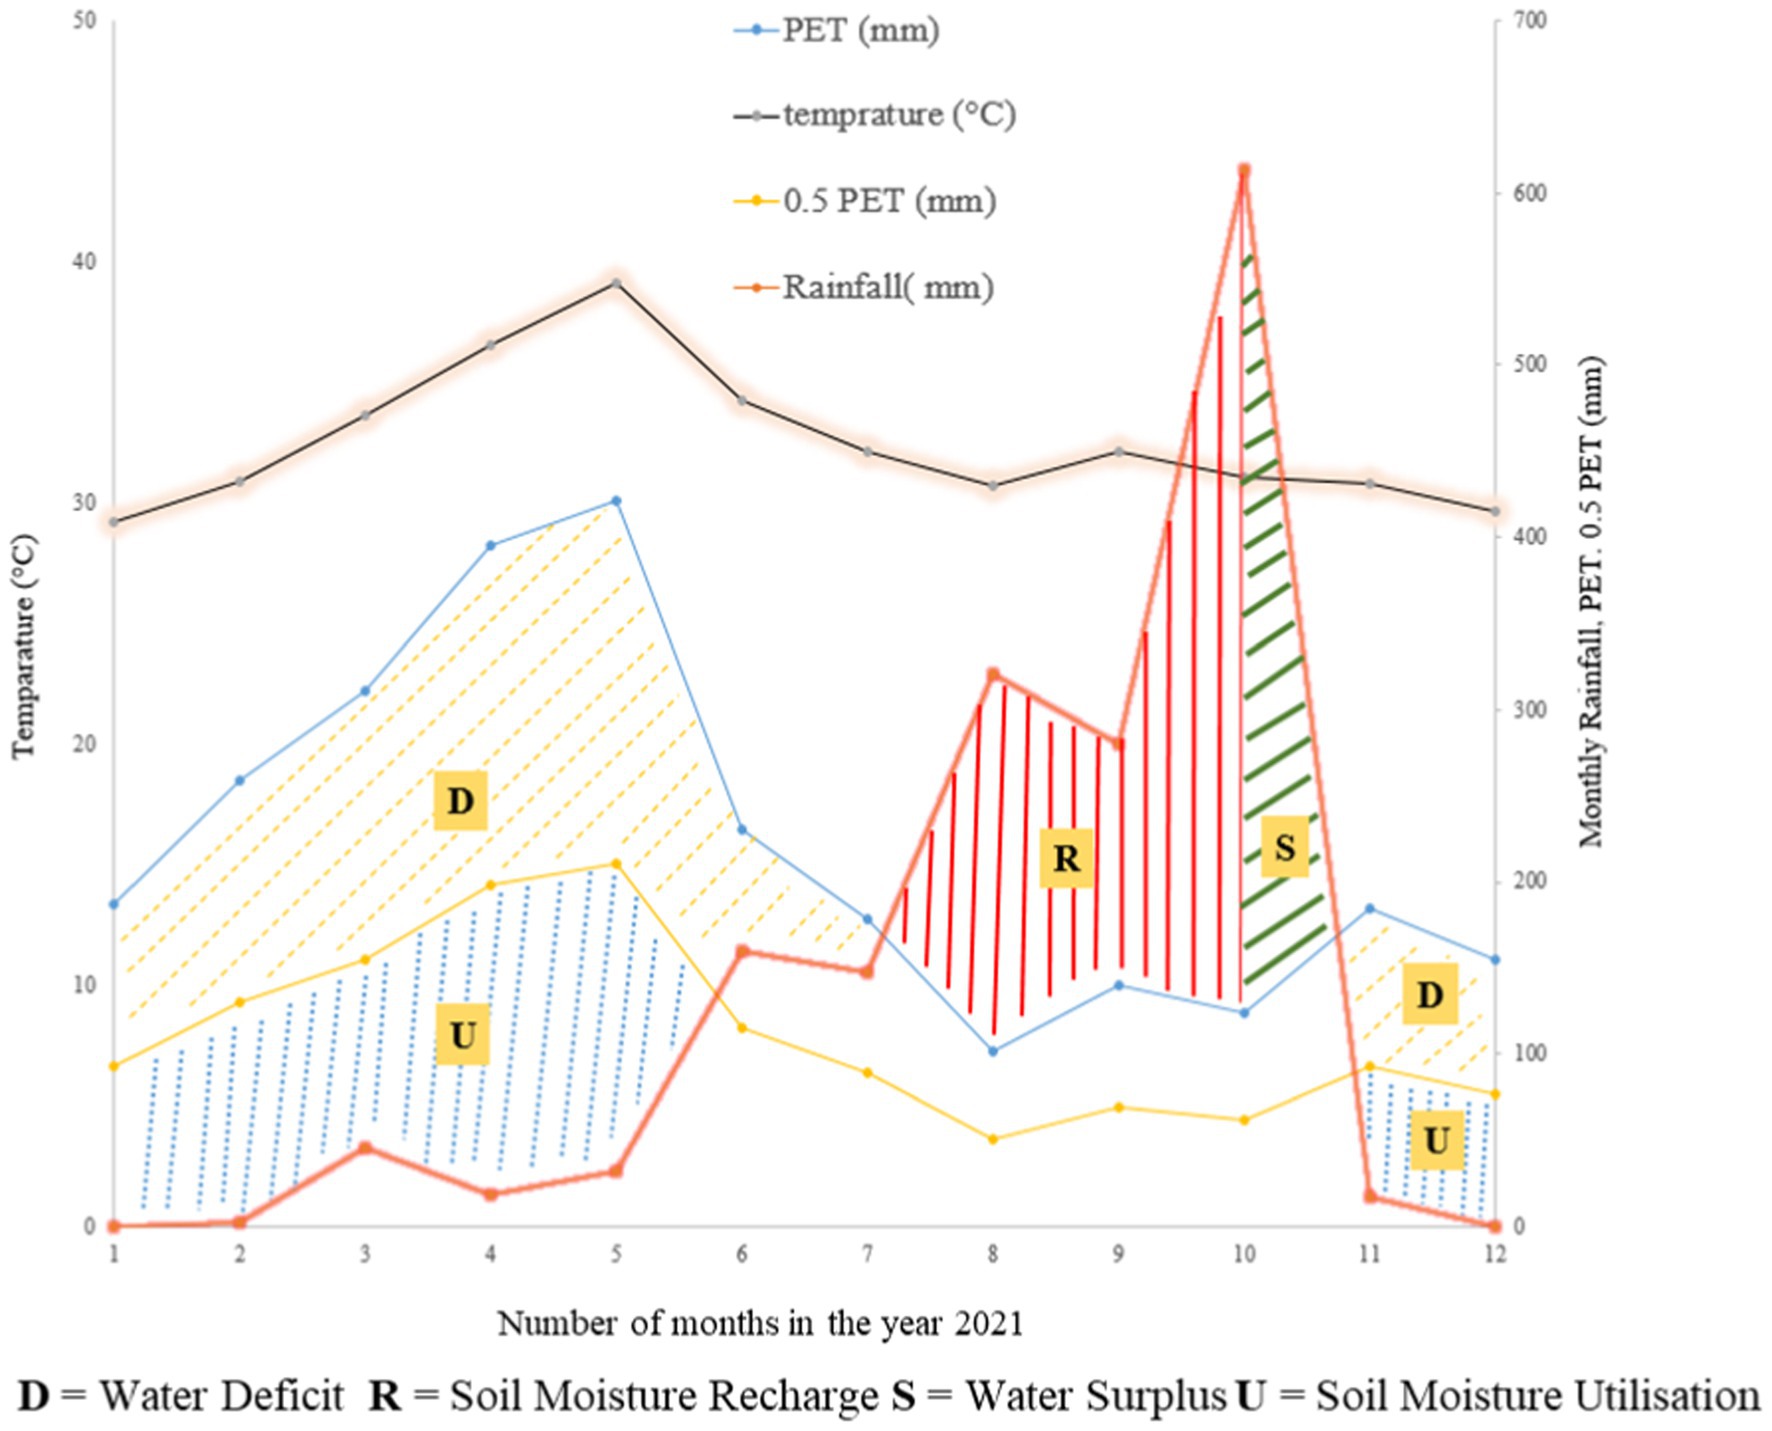
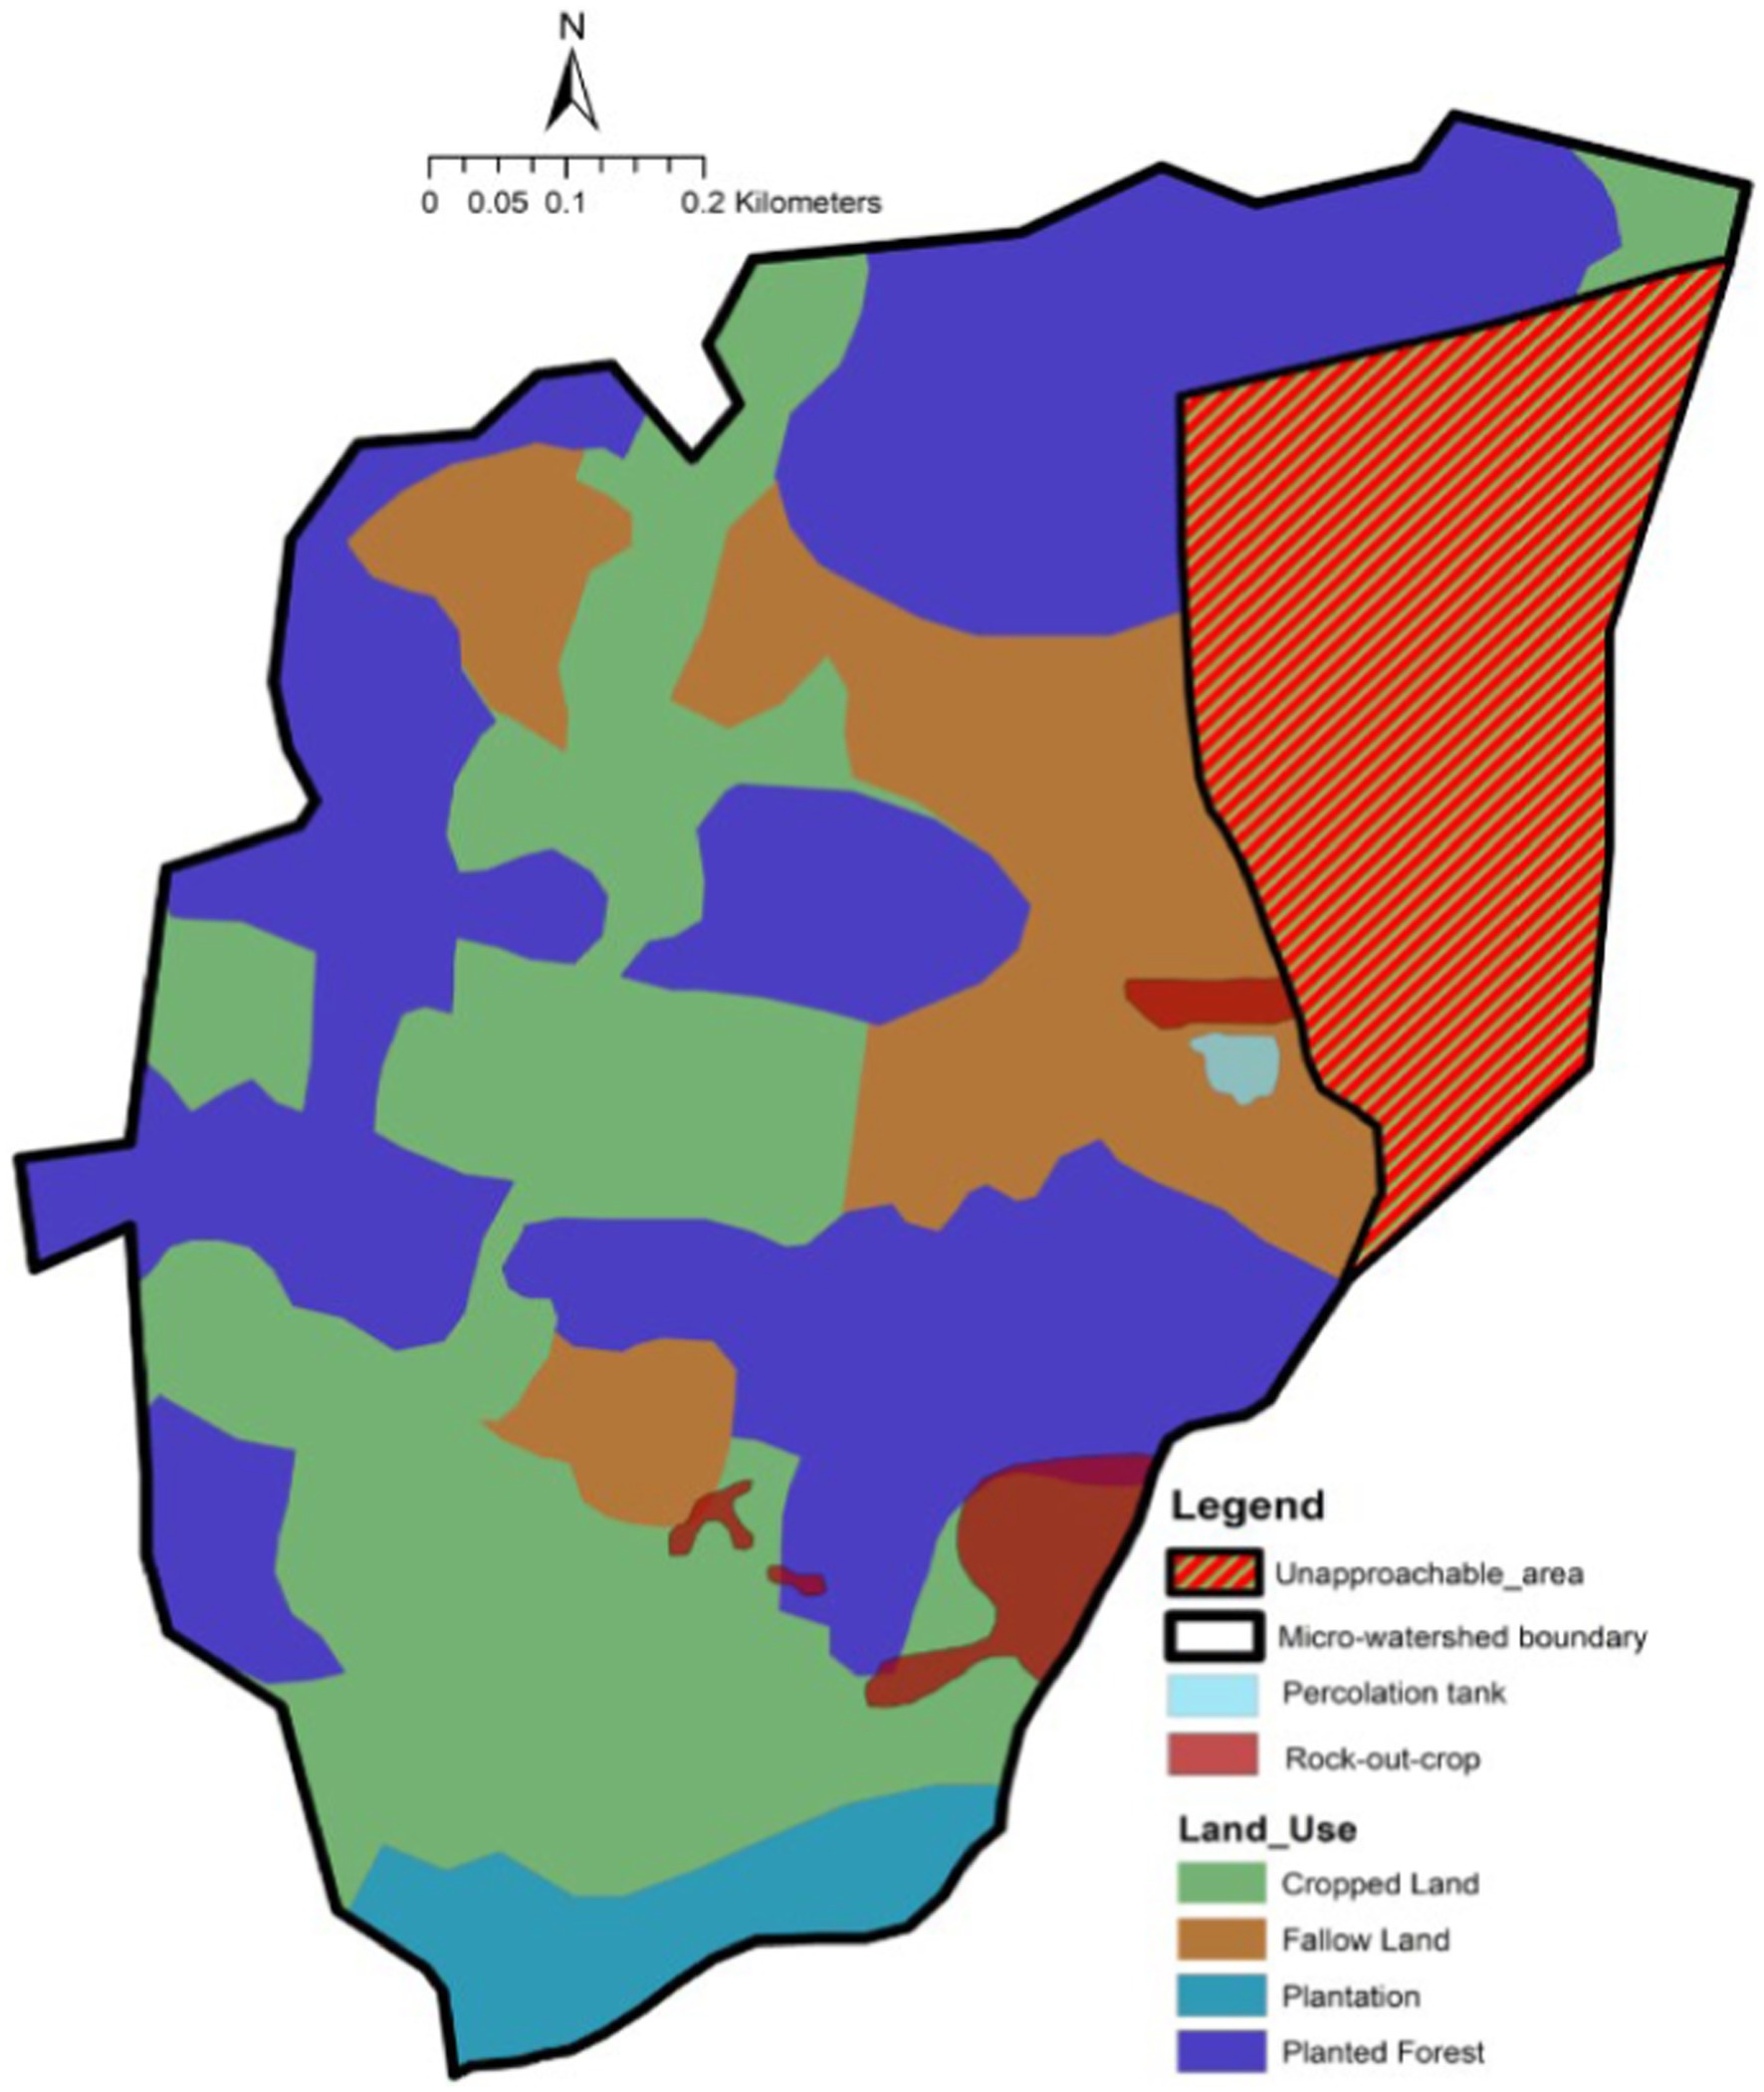
The watershed was divided into three distinct units based on elevation: upper reach (54 ha), middle (60 ha), and lower reach (40 ha) (Figure 1). Figure 2 represents the temperature and rainfall distribution for the experimental year. Approximately 40% of the watershed area is covered by planted forests, 30% is used for field crops, 5% is allocated to plantation and horticulture, and the remaining area is fallow land (Figure 3).
Hayathnagar watershed delineation
ASTER DEM with 30 m resolution and World Geodetic System (WGS84) projection were downloaded from the Earth Explorer USGS website. A contour map with 10-meter intervals was generated using ASTER DEM. To better understand the flow patterns based on elevation, the watershed was further divided into upper, middle, and lower reaches (Figure 1).
Sampling and soil analysis
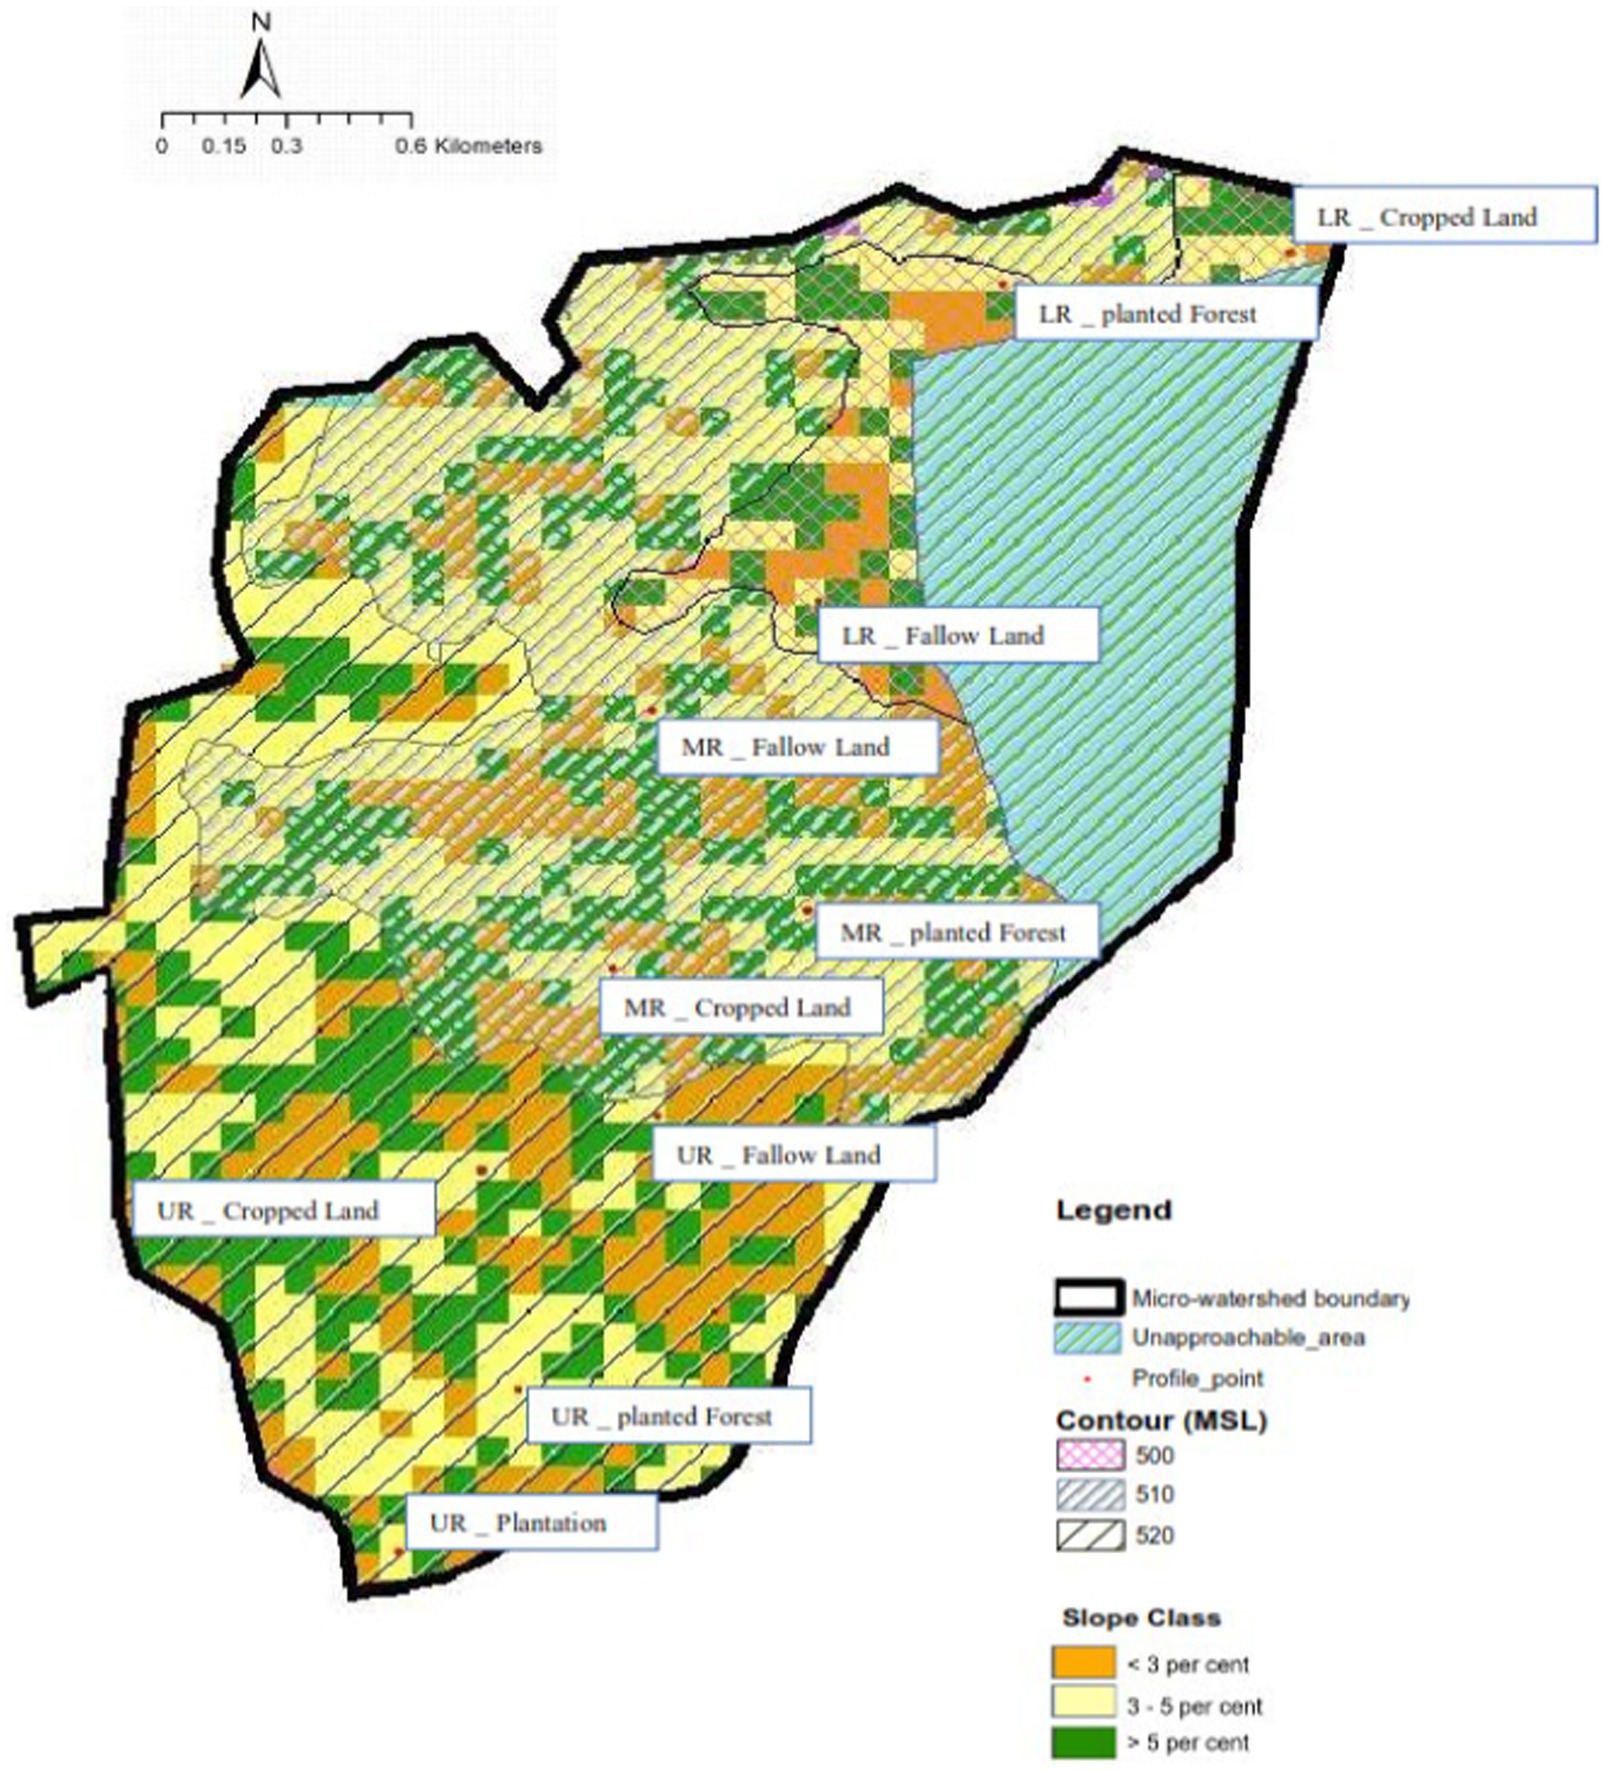
Based on the land use and elevation, a transact was drawn for soil profile point selection (Figure 4). Eighteen soil profiles were studied for soil preferential flow, with two representative profiles taken from each land-use type (planted forest, fallow, and cropped land) under three elevations. The morphological characteristics of the soil, such as color, texture, and structure, were studied in the field and described according to the soil survey manual (AIS & LUS Organization, 1971). The processed soil samples were analyzed following standard laboratory procedures. Soil samples were collected from stained and unstained areas of soil horizon in the profiles.
Dye solution preparation and application
Brilliant blue tracer at a concentration of 4 g/L (Flury et al., 1994; Flury and Flühler, 1995) was sprayed on the soil surface to visualize the soil preferential flow path (Duan et al., 2024). Image analysis (Hamed et al., 2015; Liu C. et al., 2022) of the stained profile was further carried out to determine the distribution of the preferential flow paths.
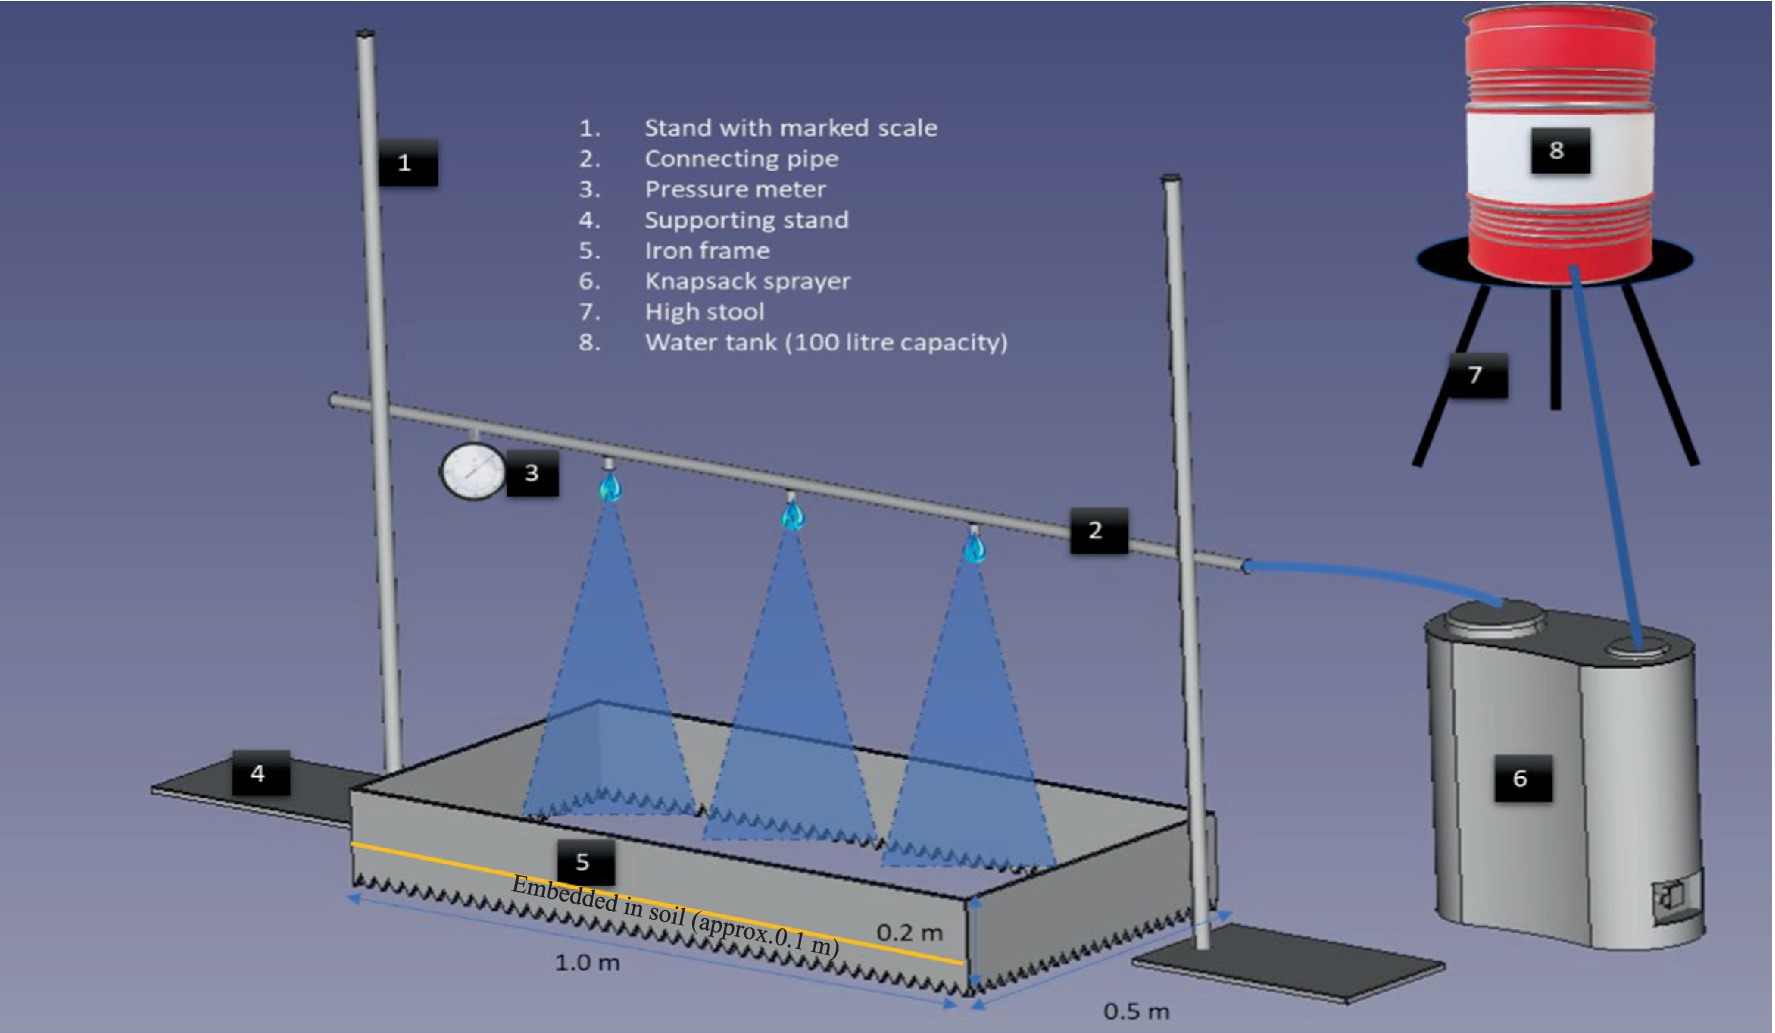
A series of tracer experiments were conducted in rainless months (October–December 2021) to avoid data ambiguity. To ensure uniform application of the dye, custom-designed equipment (Figure 5) was used, with nozzles adjusted according to the frame dimensions to prevent overlap of the sprayed area. A 1 m × 1 m flat area was selected at each location, and an iron frame measuring 1 m × 0.50 m × 0.20 m was placed into the soil (Figure 5). Although ponding was avoided if a certain slope prevailed on the land surface, the frame provided a check of the dye water movement. An overhead tank with a capacity of 100 liters was used to ensure a steady flow of water at a constant rate. Based on the infiltration rate, the duration of application was limited to a maximum of 3 h in the majority of the profiles. The initial available water content (AWC) ranged from 3 to 4% at the time of application. After 24 h, two consecutive vertical profiles with a 10-cm gap were excavated. The sprayed area was covered with an iron sheet for a period of 24 h to allow the infiltration process to take place. The exposed surface was leveled and cleaned with a brush to remove fallen dust and soil particles resulting from digging. The stained patterns were captured during daylight hours with the aid of a digital camera. The four edge points of the profile were identified prior to taking photographs. The stained region depicts the preferred flow path, and the rest is regarded as the soil matrix.
Image acquisition and analysis
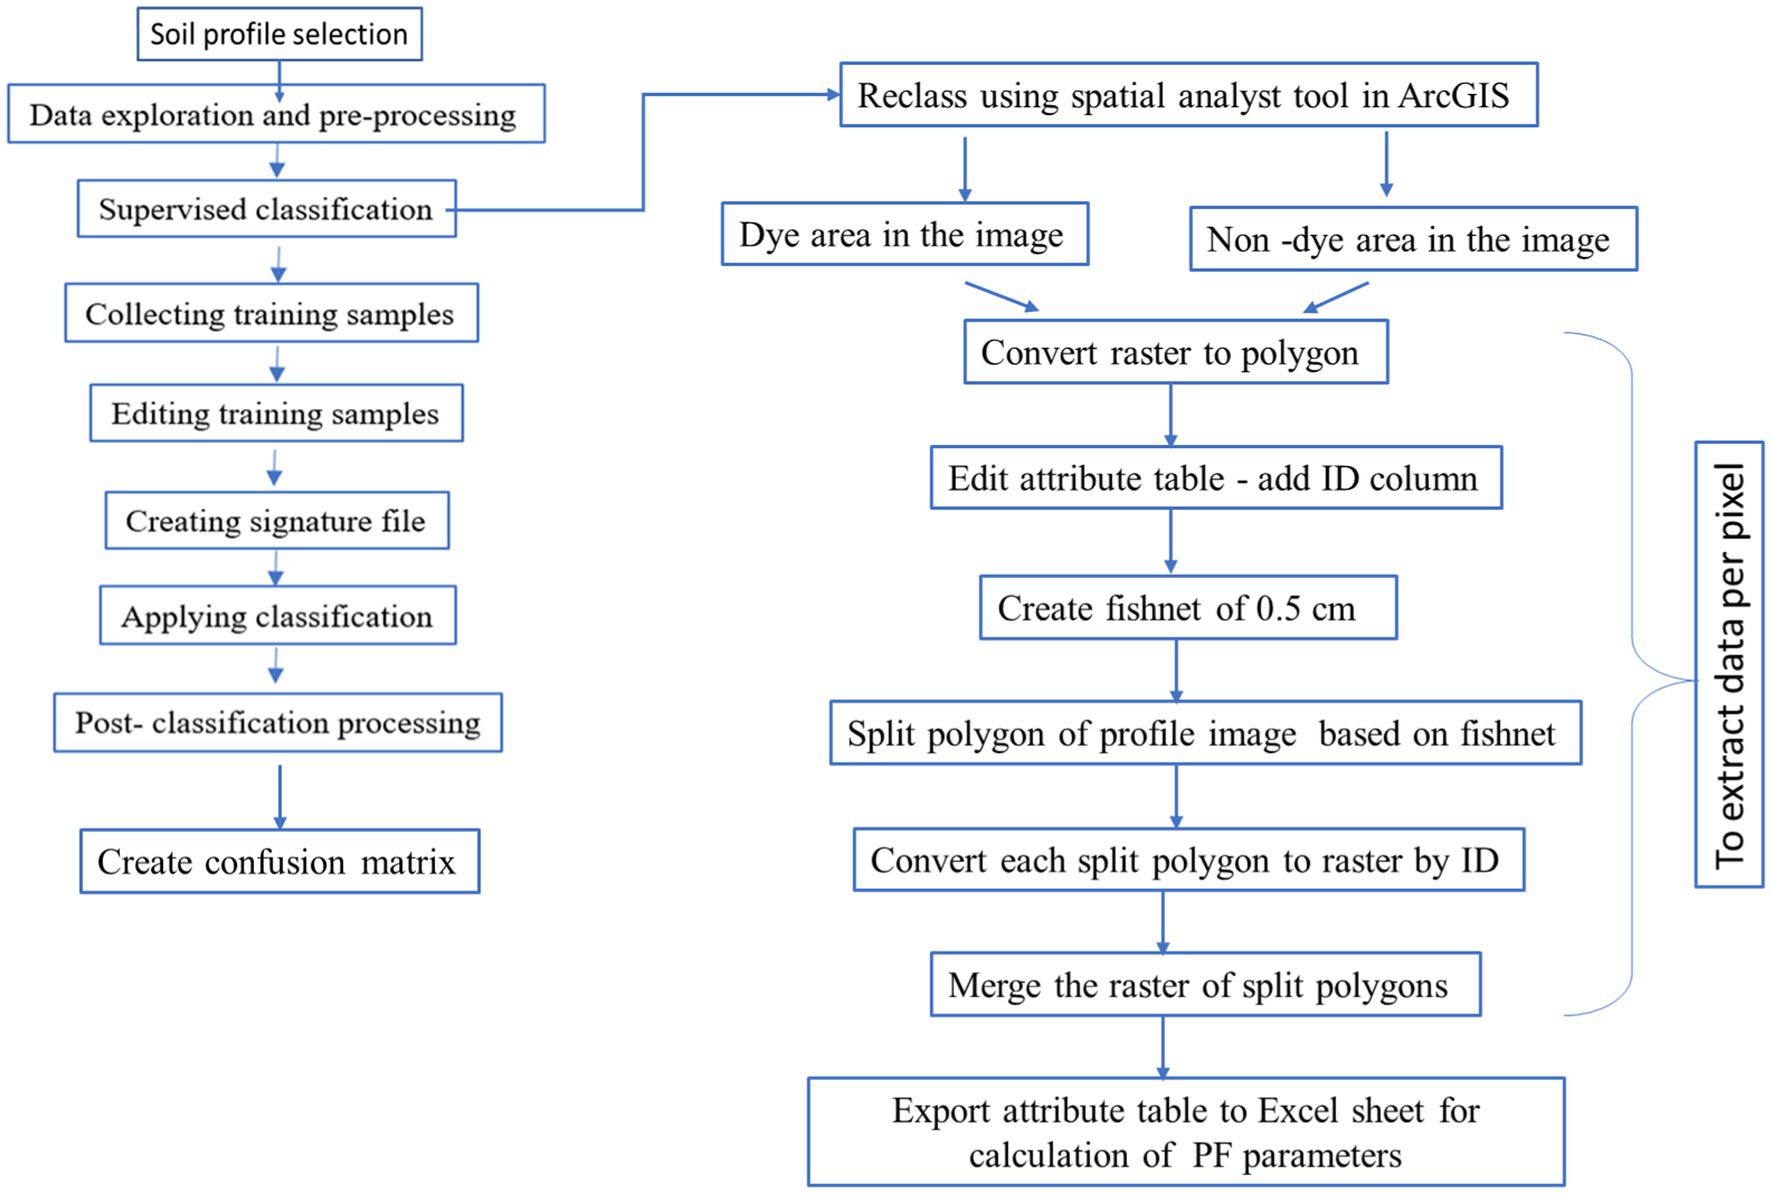
The stained vertical faces of each profile were captured using a digital camera, Canon EOS 1300 (shot 1/100 s, f/4 23 mm). To reduce the presence of perspective effects between the lens and the surface of the soil, a trial version of Coral Draw Photo Editing Software was used. Subsequently, the photos were adjusted for geometrical distortion based on their edge points with the aid of photo editing software. The corrected images were then imported into the GIS environment. Nine profiles (Figure 6) were randomly selected across elevations and land uses for image analysis. Dye-stained and non-stained areas were classified by processing the images (Flury et al., 1994; Baveye and Boast, 1998) in ArcGIS 10.3. A new methodology was adopted to extract pixel data easily and accurately from the profile image. The workflow is presented in Figure 7. For image classification, the maximum likelihood classification tool (Figure 8A) was used. Each pixel represented 1 × 1 μm of soil profile and was classified as “stained” or “unstained” based on its red, green, and blue values.
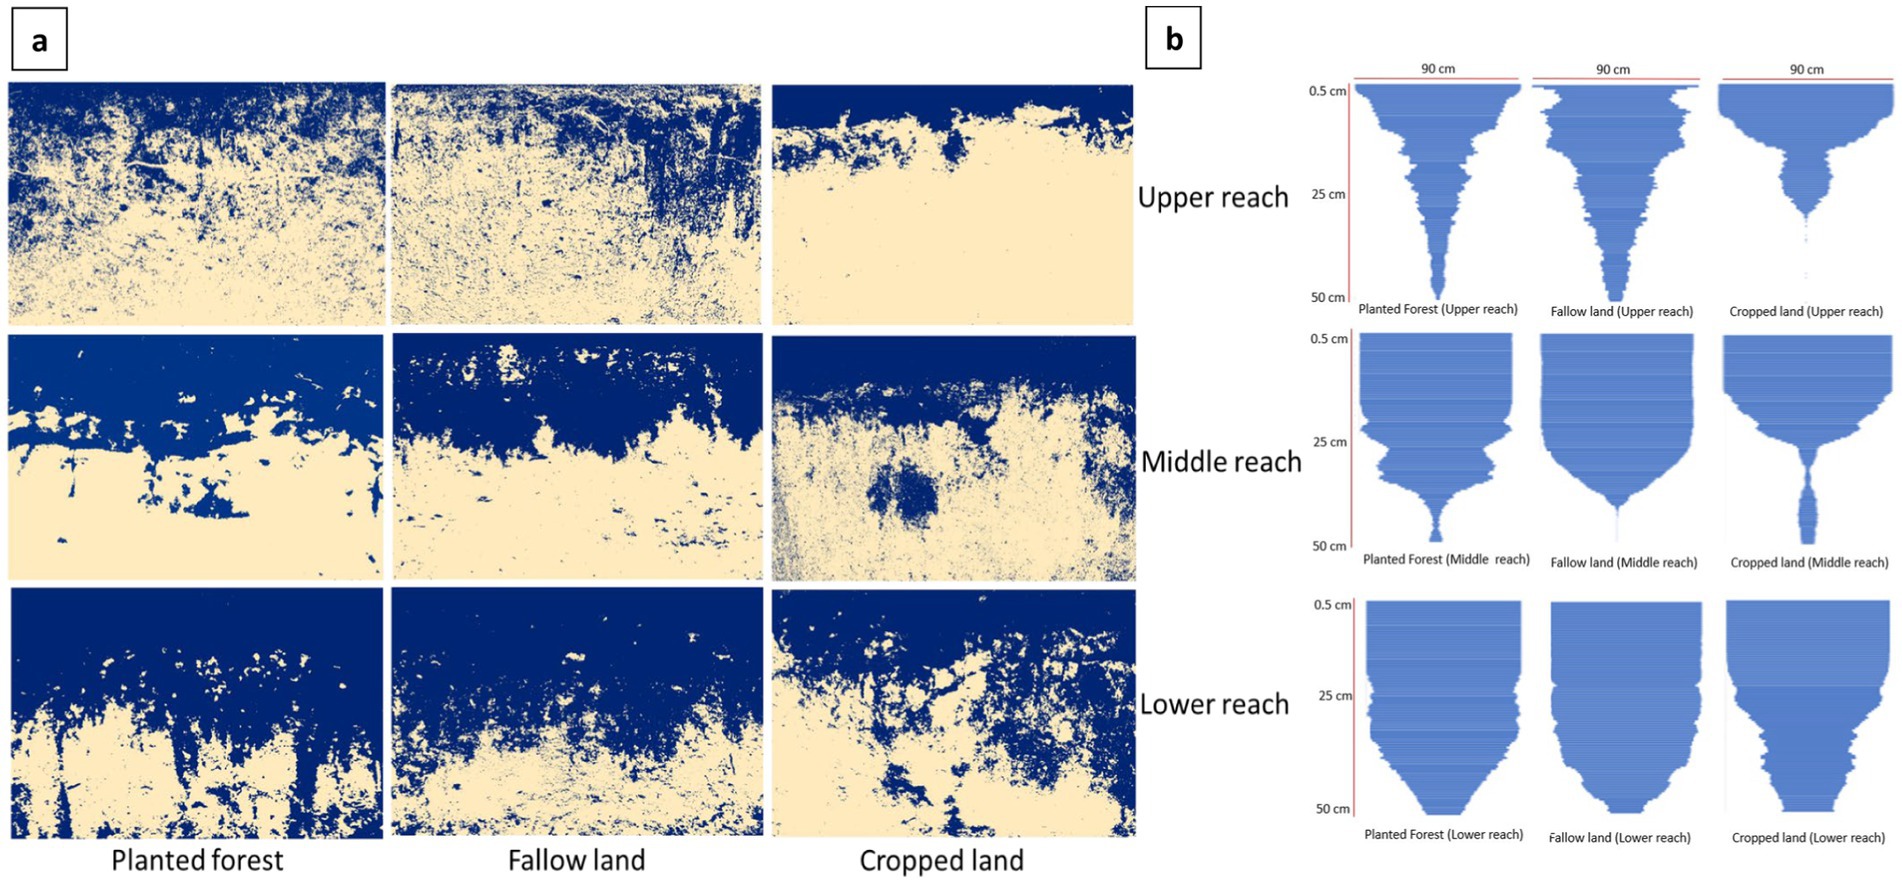
Figure 8. (A) Classified image of the soil profiles (blue color represents stained area); (B) Funnel graph of the dye movement down the profile under different land use and elevations.
Estimation of soil preferential flow
Dye coverage, total stained area, uniform infiltration depth, preferential flow fraction, coefficient of variation, length index, and peak index are the commonly used indices (Bargués Tobella et al., 2014; Benegas et al., 2014; Zhang et al., 2017) for soil preferential flow path studies.
Dye coverage (DC)
DC is the percentage ratio of the dye-stained area to the sum of the dye-stained and non-stained areas (Equation 1).
where DC is the dye coverage (%), D is the dye-stained area (cm2), and ND is the unstained area (cm2).
Total stained area (TSA)
The TSA is defined as the sum of the cumulative areas of all dye units as the depth decreases in the profile.
Uniform infiltration depth (UID)
The UID is defined as the depth at which the dye coverage decreases below 80% (Van Schaik, 2009). This indicates the depth at which the flow path is prevalent.
Preferential flow fraction (PFF)
The PFF is defined as the fraction of the total infiltration that flows through the preferential flow paths (Equation 2; Benegas et al., 2014; Van Schaik, 2009).
Length index (LI)
The LI is the summation of the absolute differences between the DC values at a given depth in a profile (Equation 3). Soils with a high degree of preferential flow result in a higher value of LI.
where LI is the length index; i represents a given depth interval (or zone) of stained area DC was calculated; and DCi and represent the dye area ratio corresponding to layers i and i + 1, respectively, of the soil profile.
Peak value (PV)
The PV is a vertical line drawn based on the dye coverage percentage of that particular profile intersecting the total dye coverage profile. This parameter is also related to the heterogeneity of the stain patterns in a soil profile (Bargués Tobella et al., 2014).
Coefficient of variation (CV)
The CV is a measure of the heterogeneity in the staining of the soil profile (Equation 4; Zhang et al., 2017).
where DC is the average ratio of the dye area.
PF evaluation index
To reflect the development degree of soil preferential flow at different slope positions and eliminate the differences between different indices used in the calculation of soil preferential flow, e.g., DC, TSA, PV, PFF, UID, LI, and CV, the range method was used to standardize the preferential flow index to obtain a dimensionless value, which was used to calculate the mean square deviation of each. Finally, the weight coefficient of each index was determined using the mean square error decision-making method (Zhang et al., 2017). According to the standardized value and weight coefficient, the evaluation index of preferential flow was obtained. The result obtained was a synthesis of all parameters, which can directly reflect the development degree of the soil preferential flow. The higher the value, the higher the development degree of the preferential flow.
Parameter normalization:
where = standard value of the parameter.
= actual value of preferential flow parameter.
= maximum value of preferential flow parameter.
= minimum value of preferential flow parameter.
i = ordinal number of data for a given indicator.
j = number of indicators.
Weight coefficient of each parameter:
PF evaluation index (PFI):
where = standard value of the index.
= mean square deviation of each parameter.
PFI = PF evaluation index.
Statistical analysis
The Wilcoxon signed-rank test and boxplot were used for dye coverage analysis and comparison under different land uses and elevations. The statistical analysis was performed using the SPSS 22.0 trial version. The significance level was set to 0.05% for all the analyses.
Stained path width (SPW) for defining flow types
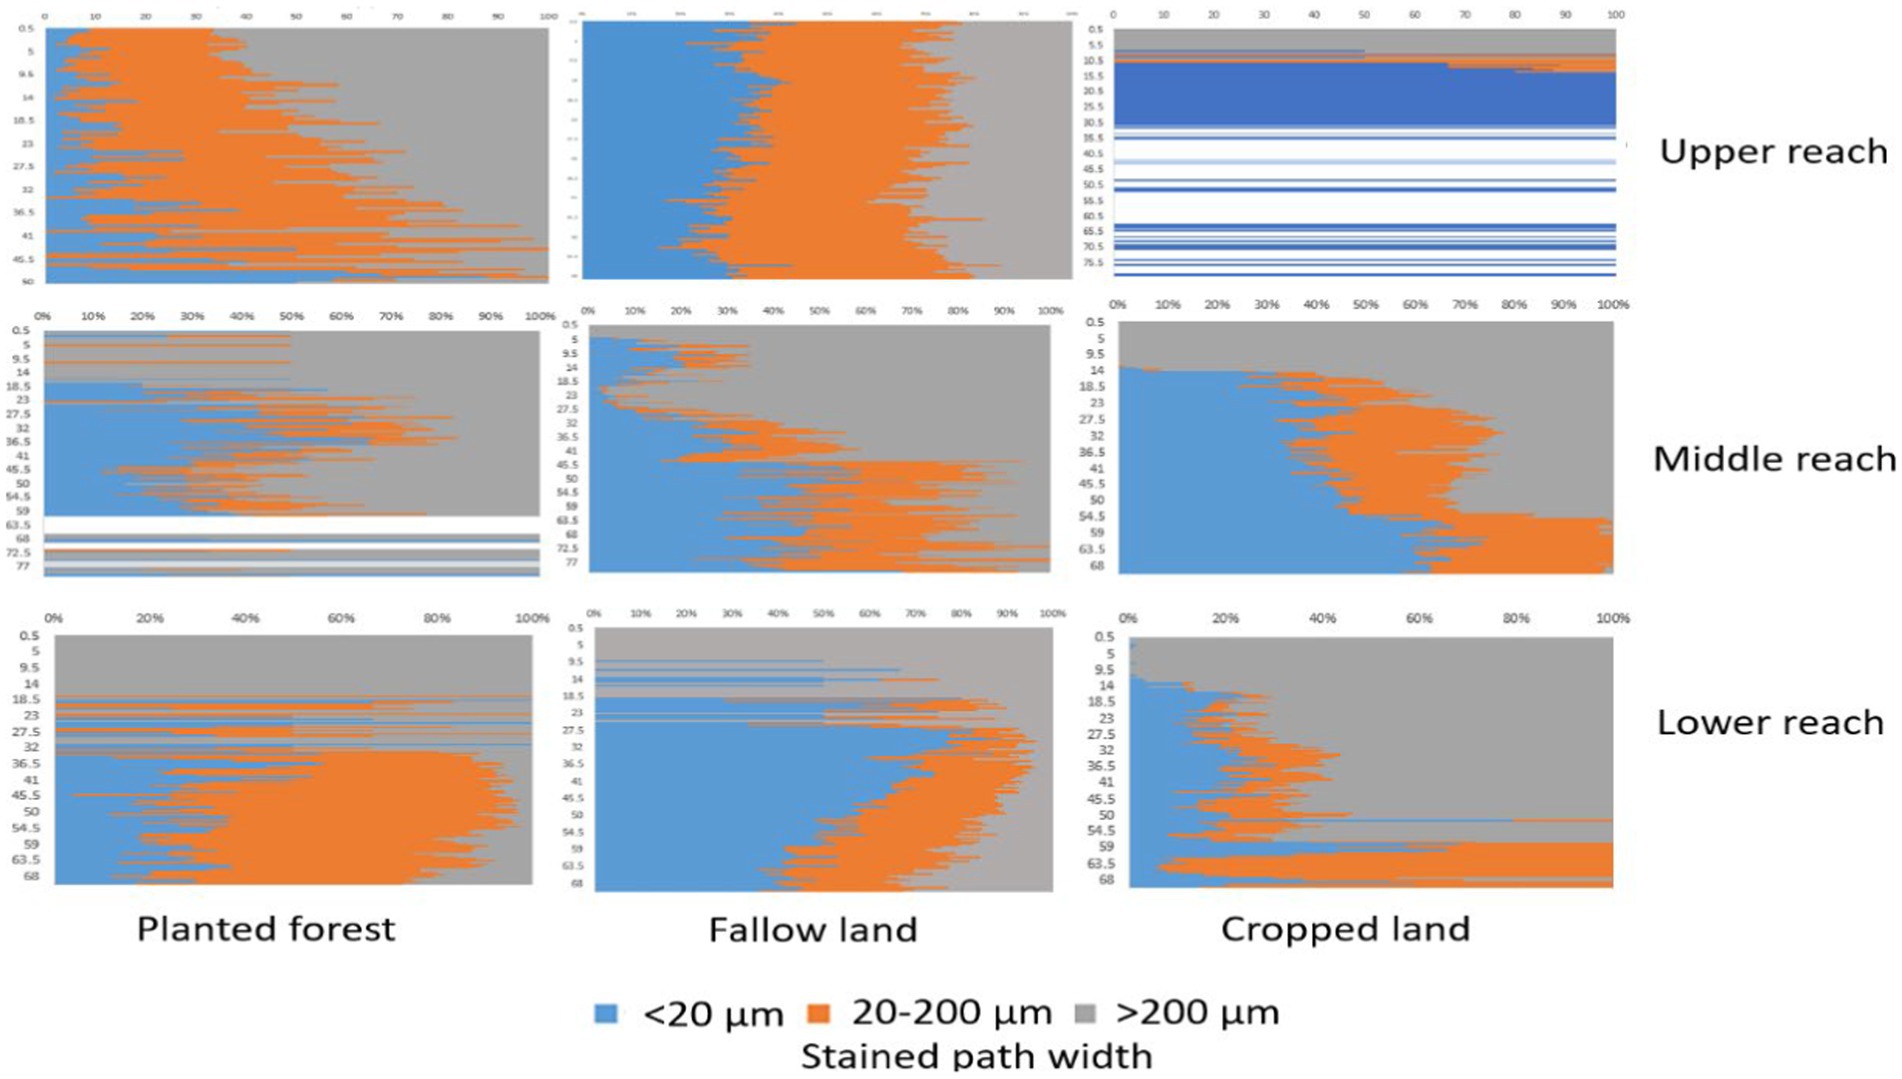
Considering the soil as isotropic, the intercept length can be used to calculate the area of an object in two dimensions (Weibel, 1979). Consequently, the width of the object was used as an indicator of its size at each soil depth (Weiler and Flühler, 2004). For each image, the SPW values were calculated using ArcGIS 10.3 software at every 0.5 cm depth, including SPW less than 20 μm (SPW20), SPW between 20 and 200 μm (SPW20-200), and SPW greater than 200 μm (SPW200) was calculated.
SPW20 corresponds to very narrow flow paths often associated with fine pores, micro-pores, or small-scale cracks. SPW20-200 represents medium-sized pores often associated with macropores, the primary conduits for water movement under typical field conditions, such as cracks, root channels, or larger inter-aggregate pores, and SPW200 are larger pores or channels, which can be root channels, cracks, or large macropores formed by soil aggregation or bioturbation (e.g., from earthworms).
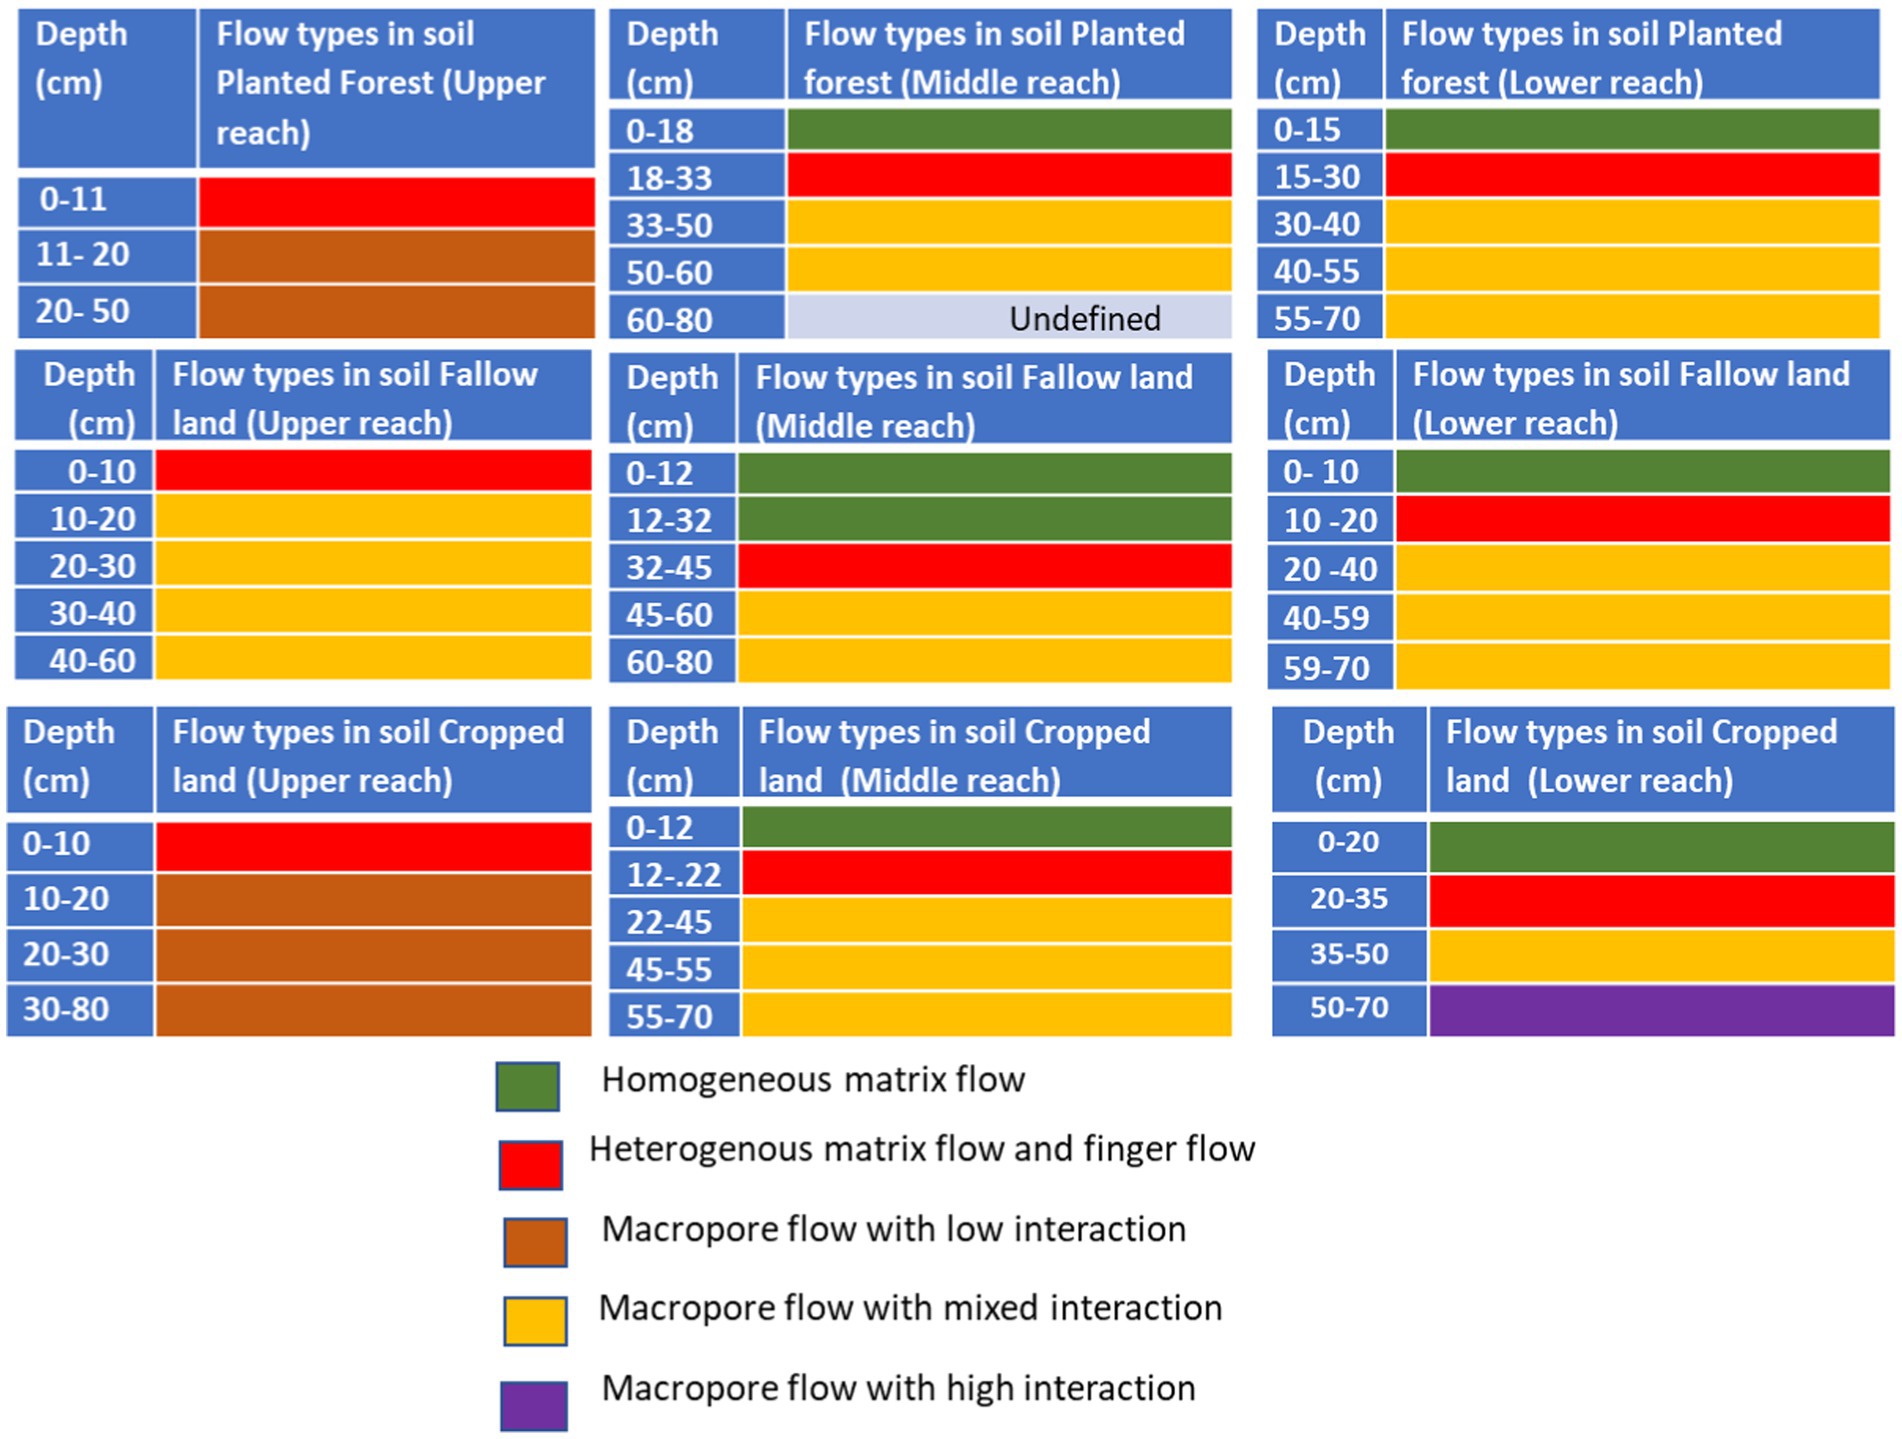
The flow types were then determined by adding all three values (SPW20, SPW20-200, and SPW200) at the horizon depths. The obtained value was used to determine the flow type at the respective horizon. The definition of the flow type that can be distinguished by the dye pattern was adopted by Weiler and Flühler (2004).
Skeletonization
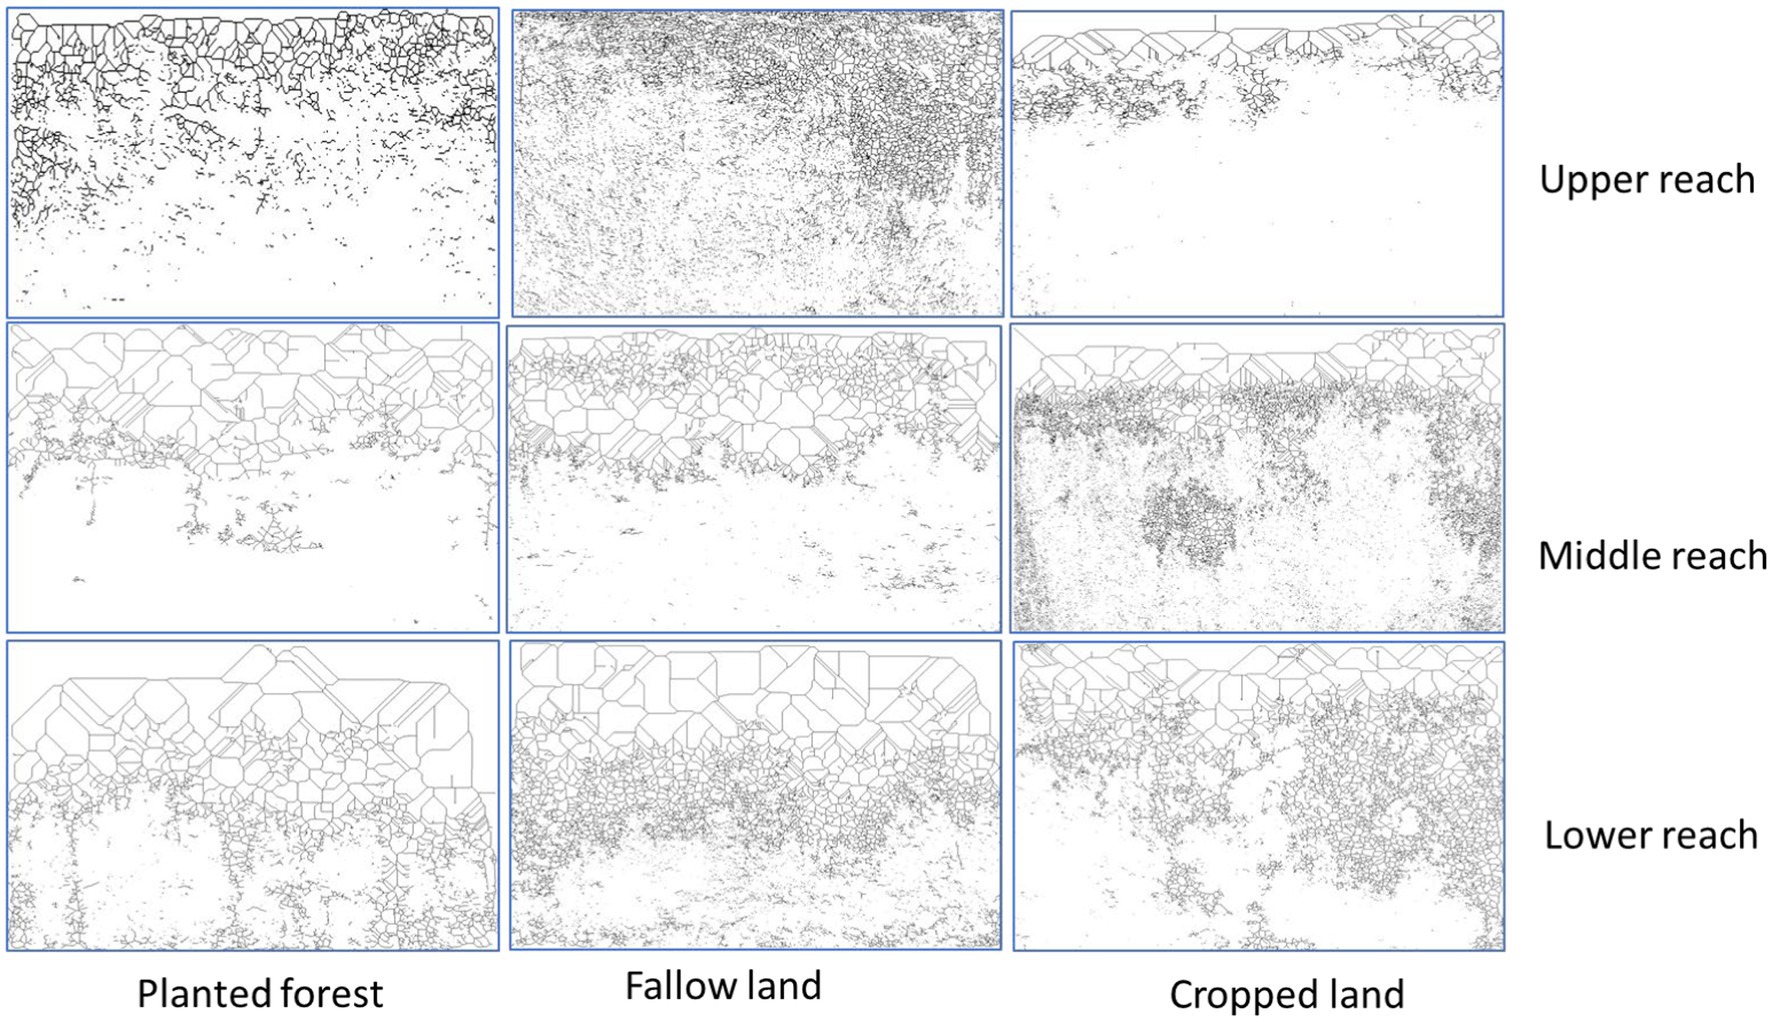
For skeletonization, the public domain image software ImageJ 1.53 k was used. ImageJ uses a number of skeletonization algorithms such as Zhang and Suen’s (1984) thinning algorithm. Each iteration was rounded up to two sub-iterations, thus preserving the connectivity of the skeleton. Eight-bit binary images were created from the classified profile images. The pixels of objects in the binary image were repeatedly removed from their edges using this algorithm until they were reduced to single-pixel width shapes. Only one skeleton was left in the pattern after several iterations.
Results
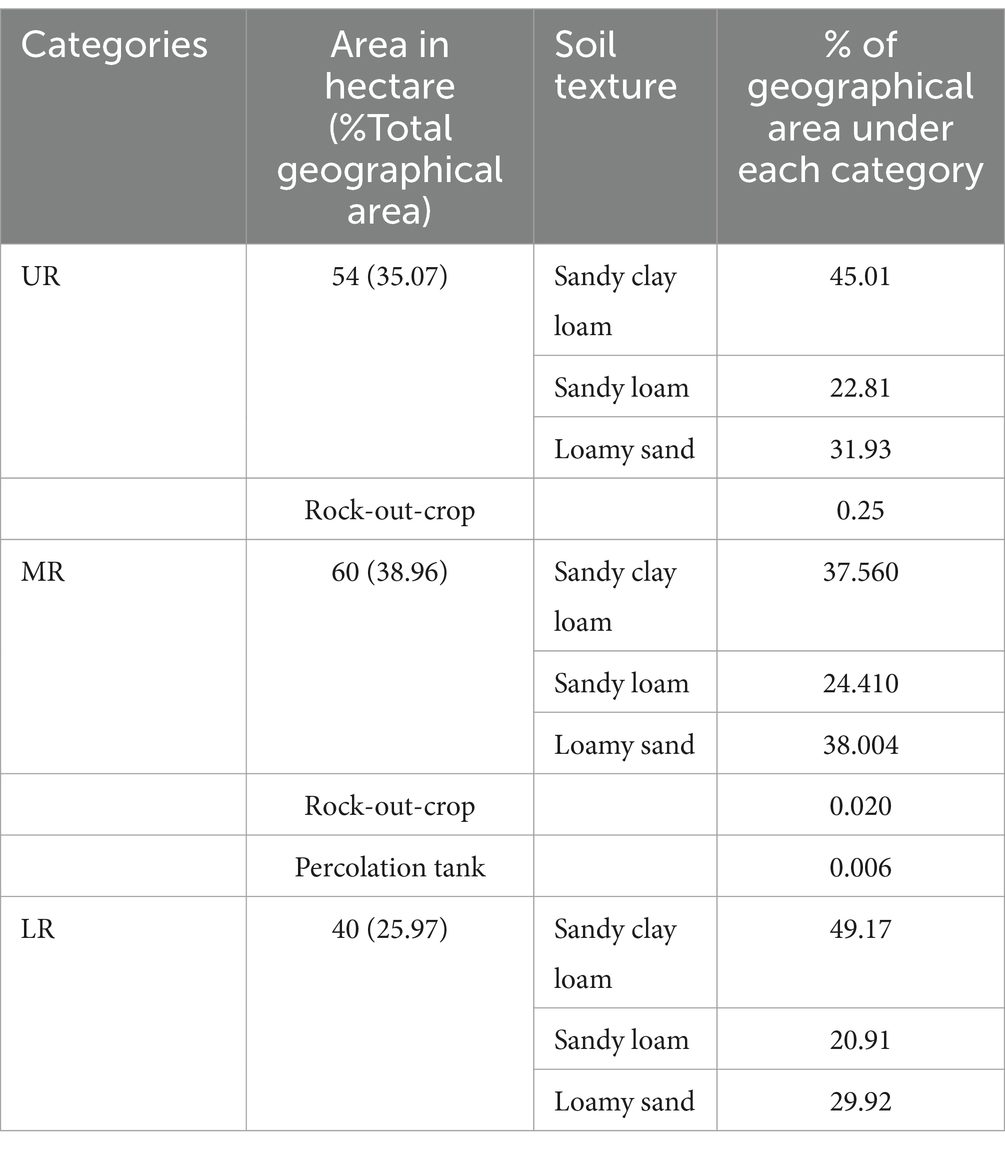
The soils in the study area were primarily ferruginous and contained laterite gravel. Analyzing the surface soil texture under different categories, it is evident that sandy clay loam occupies the largest geographical area in the upper and lower reaches. In contrast, the middle reach was predominantly covered by a loamy sand texture, as given in Table 1.
In terms of soil structure, the subsurface layer exhibits a well-developed structure, ranging from fine to moderate, and coarse to strong subangular blocks. When observed in the field, the majority of the soils felt gritty and possessed a slight stickiness to a slightly plastic consistency, as mentioned in Table 2.
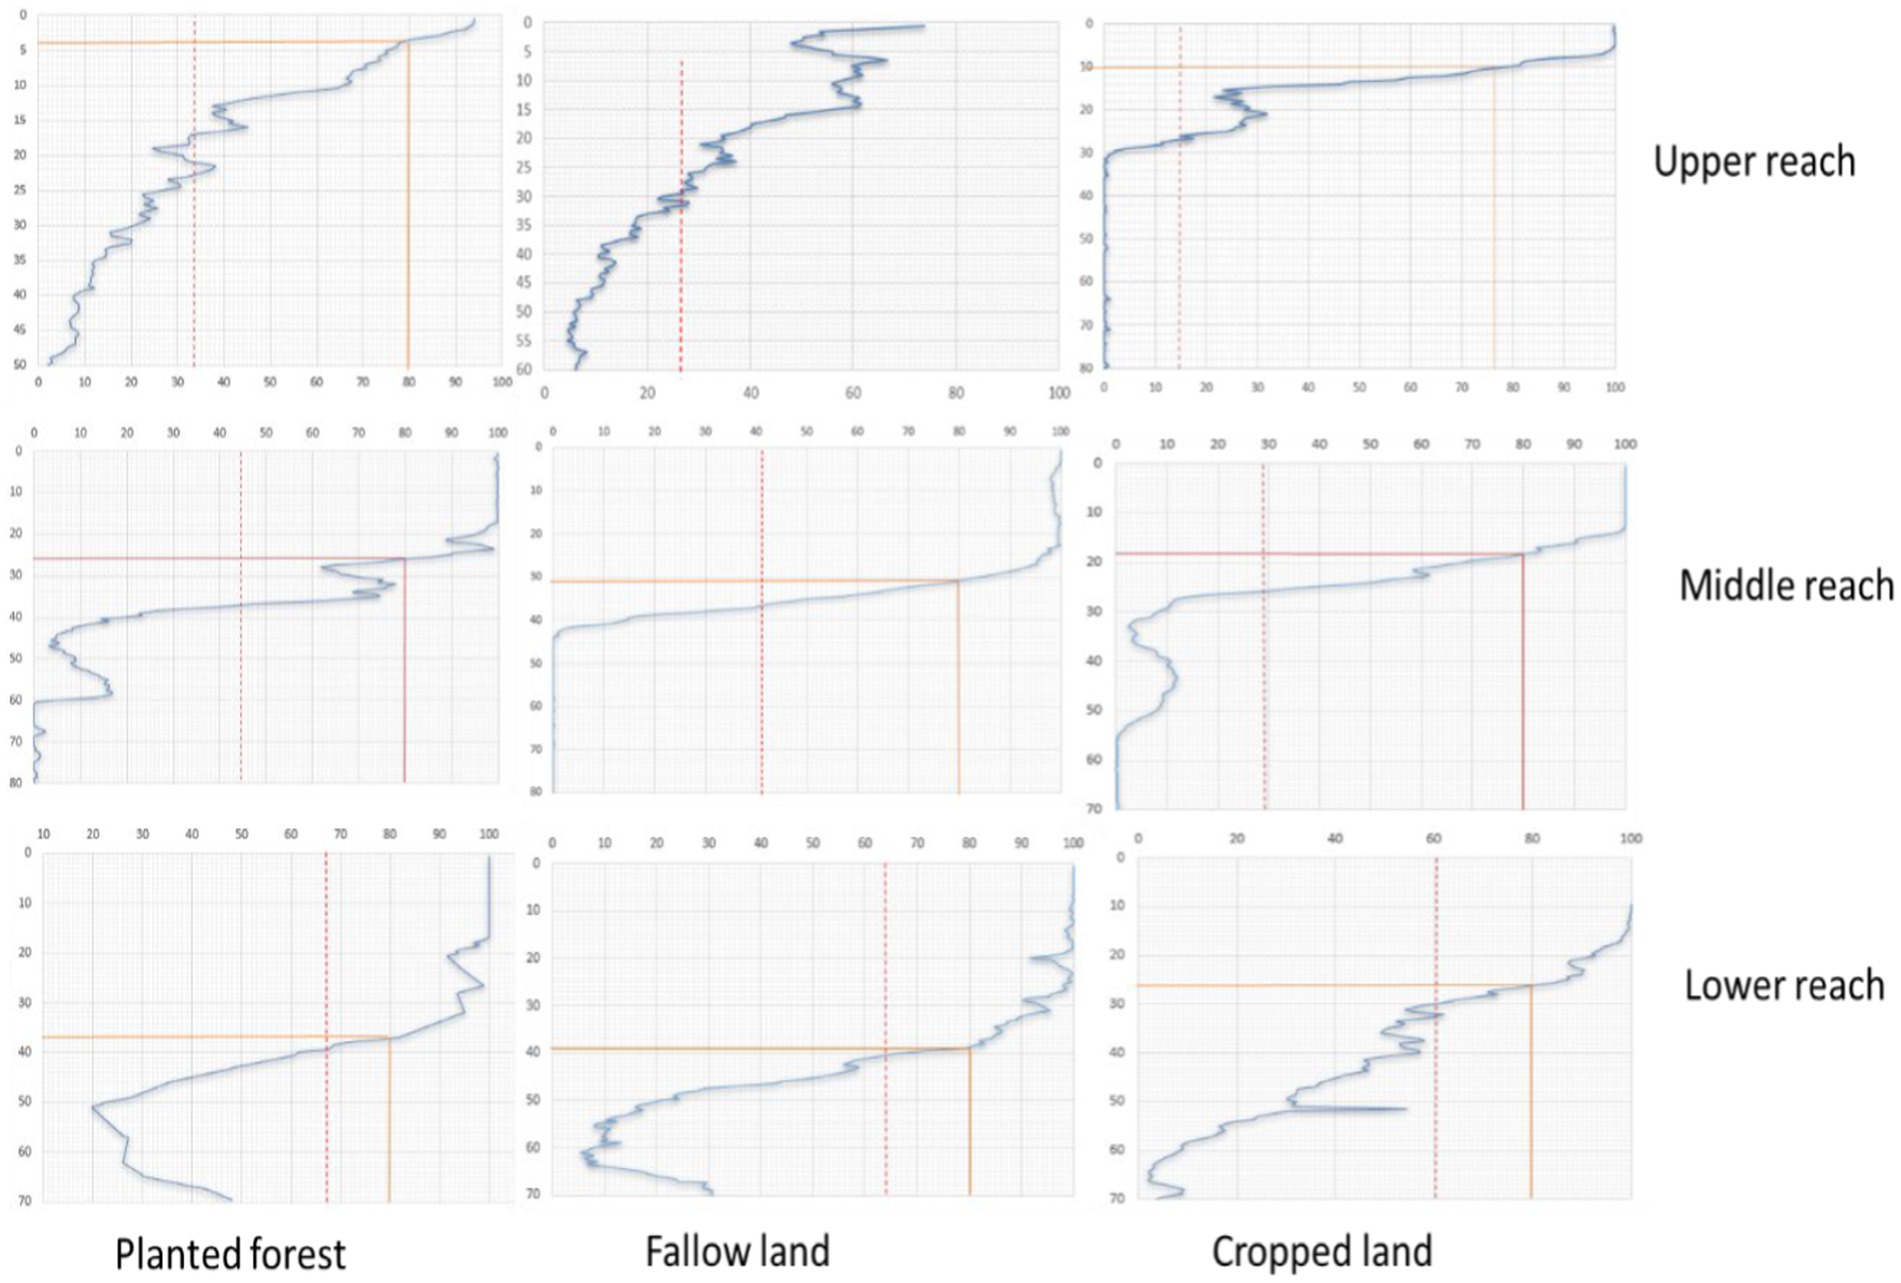
A qualitative analysis of the flow patterns was conducted based on binary images generated through supervised classification. The analysis involved visually examining the regions stained with dye, which represented the preferential flow areas, whereas the non-stained regions indicated a bypassed soil matrix. The findings indicated that, regardless of land-use type and elevation, dye coverage was higher (>50%) in the upper soil layer (0–10 cm) and gradually reduced to less than 30% at depths greater than 30 cm in the soil profile. Figure 8A illustrates the vertical distribution of dye across different land-use types. Cropped land showed more uniform dye coverage in the topsoil horizon compared to the forest and fallow land, across the upper, middle, and lower reaches. The funnel graph (Figure 8B) represents the soil profile dye coverage in different land-use systems at various elevations within the watershed. This revealed distinct dye movement patterns specific to each land-use type. The dye coverage on average varied between 20 and 50% in the upper reach, 30–60% in the middle reach, and 60–70% in the lower reach (Figure 9). The Wilcoxon signed-rank test (Figure 10) was used to analyze the difference in dye coverage with the hypothesis that there is no change in preferential flow with elevation and land use. The hypothesis was rejected with statistical significance at the upper reach (p = 0.002), middle reach (p = 0.008), and lower reach (p = 0.008). The sequence of dye coverage followed across the elevation was as follows.
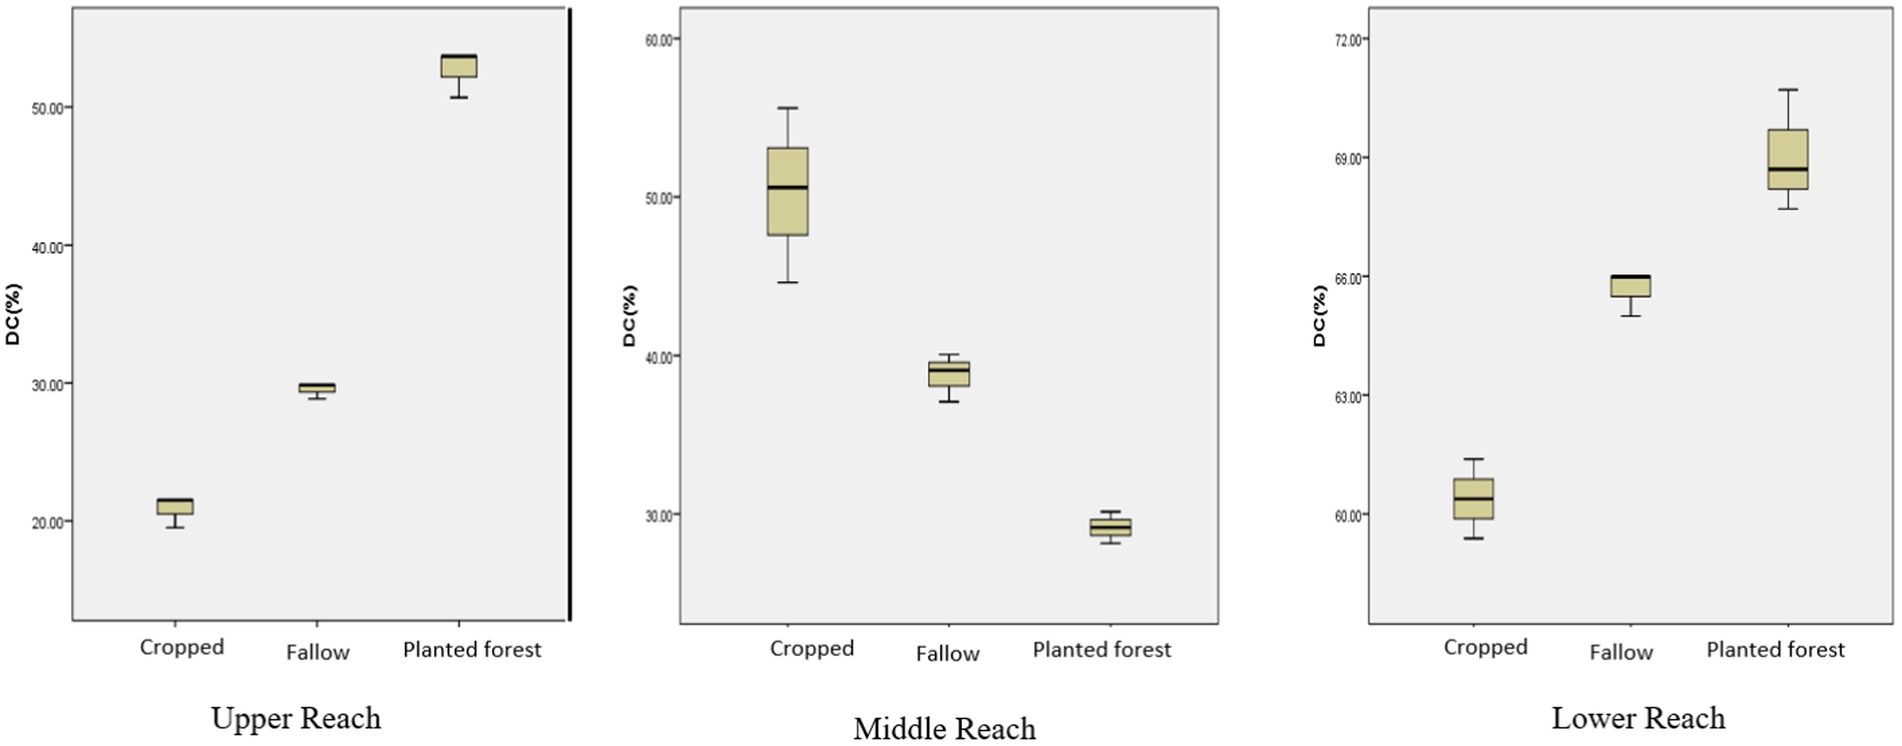
Figure 10. Dye coverage under different elevations and land uses. Wilcoxon signed-rank test-Significance at 0.05 level: Upper: 0.002**, Middle: 0.008**, Lower: 0.008**.
Upper reach: Planted forest > Fallow > Cropped land.
Middle reach: Cropped land > Fallow > Planted forest.
Lower reach: Planted forest > Fallow > Cropped land.
Upper reach and lower reach followed the same sequence. In the middle reach, there was more lateral flow due to soil compaction at 30–40 cm depth. High clay content at this depth was observed in undistributed soil of forest and fallow land while cropped land was disturbed at this depth by agricultural activities. Thus, by letting more dye water penetrate the profile, a similar finding was observed by Jačka et al. (2021). They observed dye coverage peaked at a soil depth of 15 cm is one of the profiles studied due to enhanced lateral infiltration.
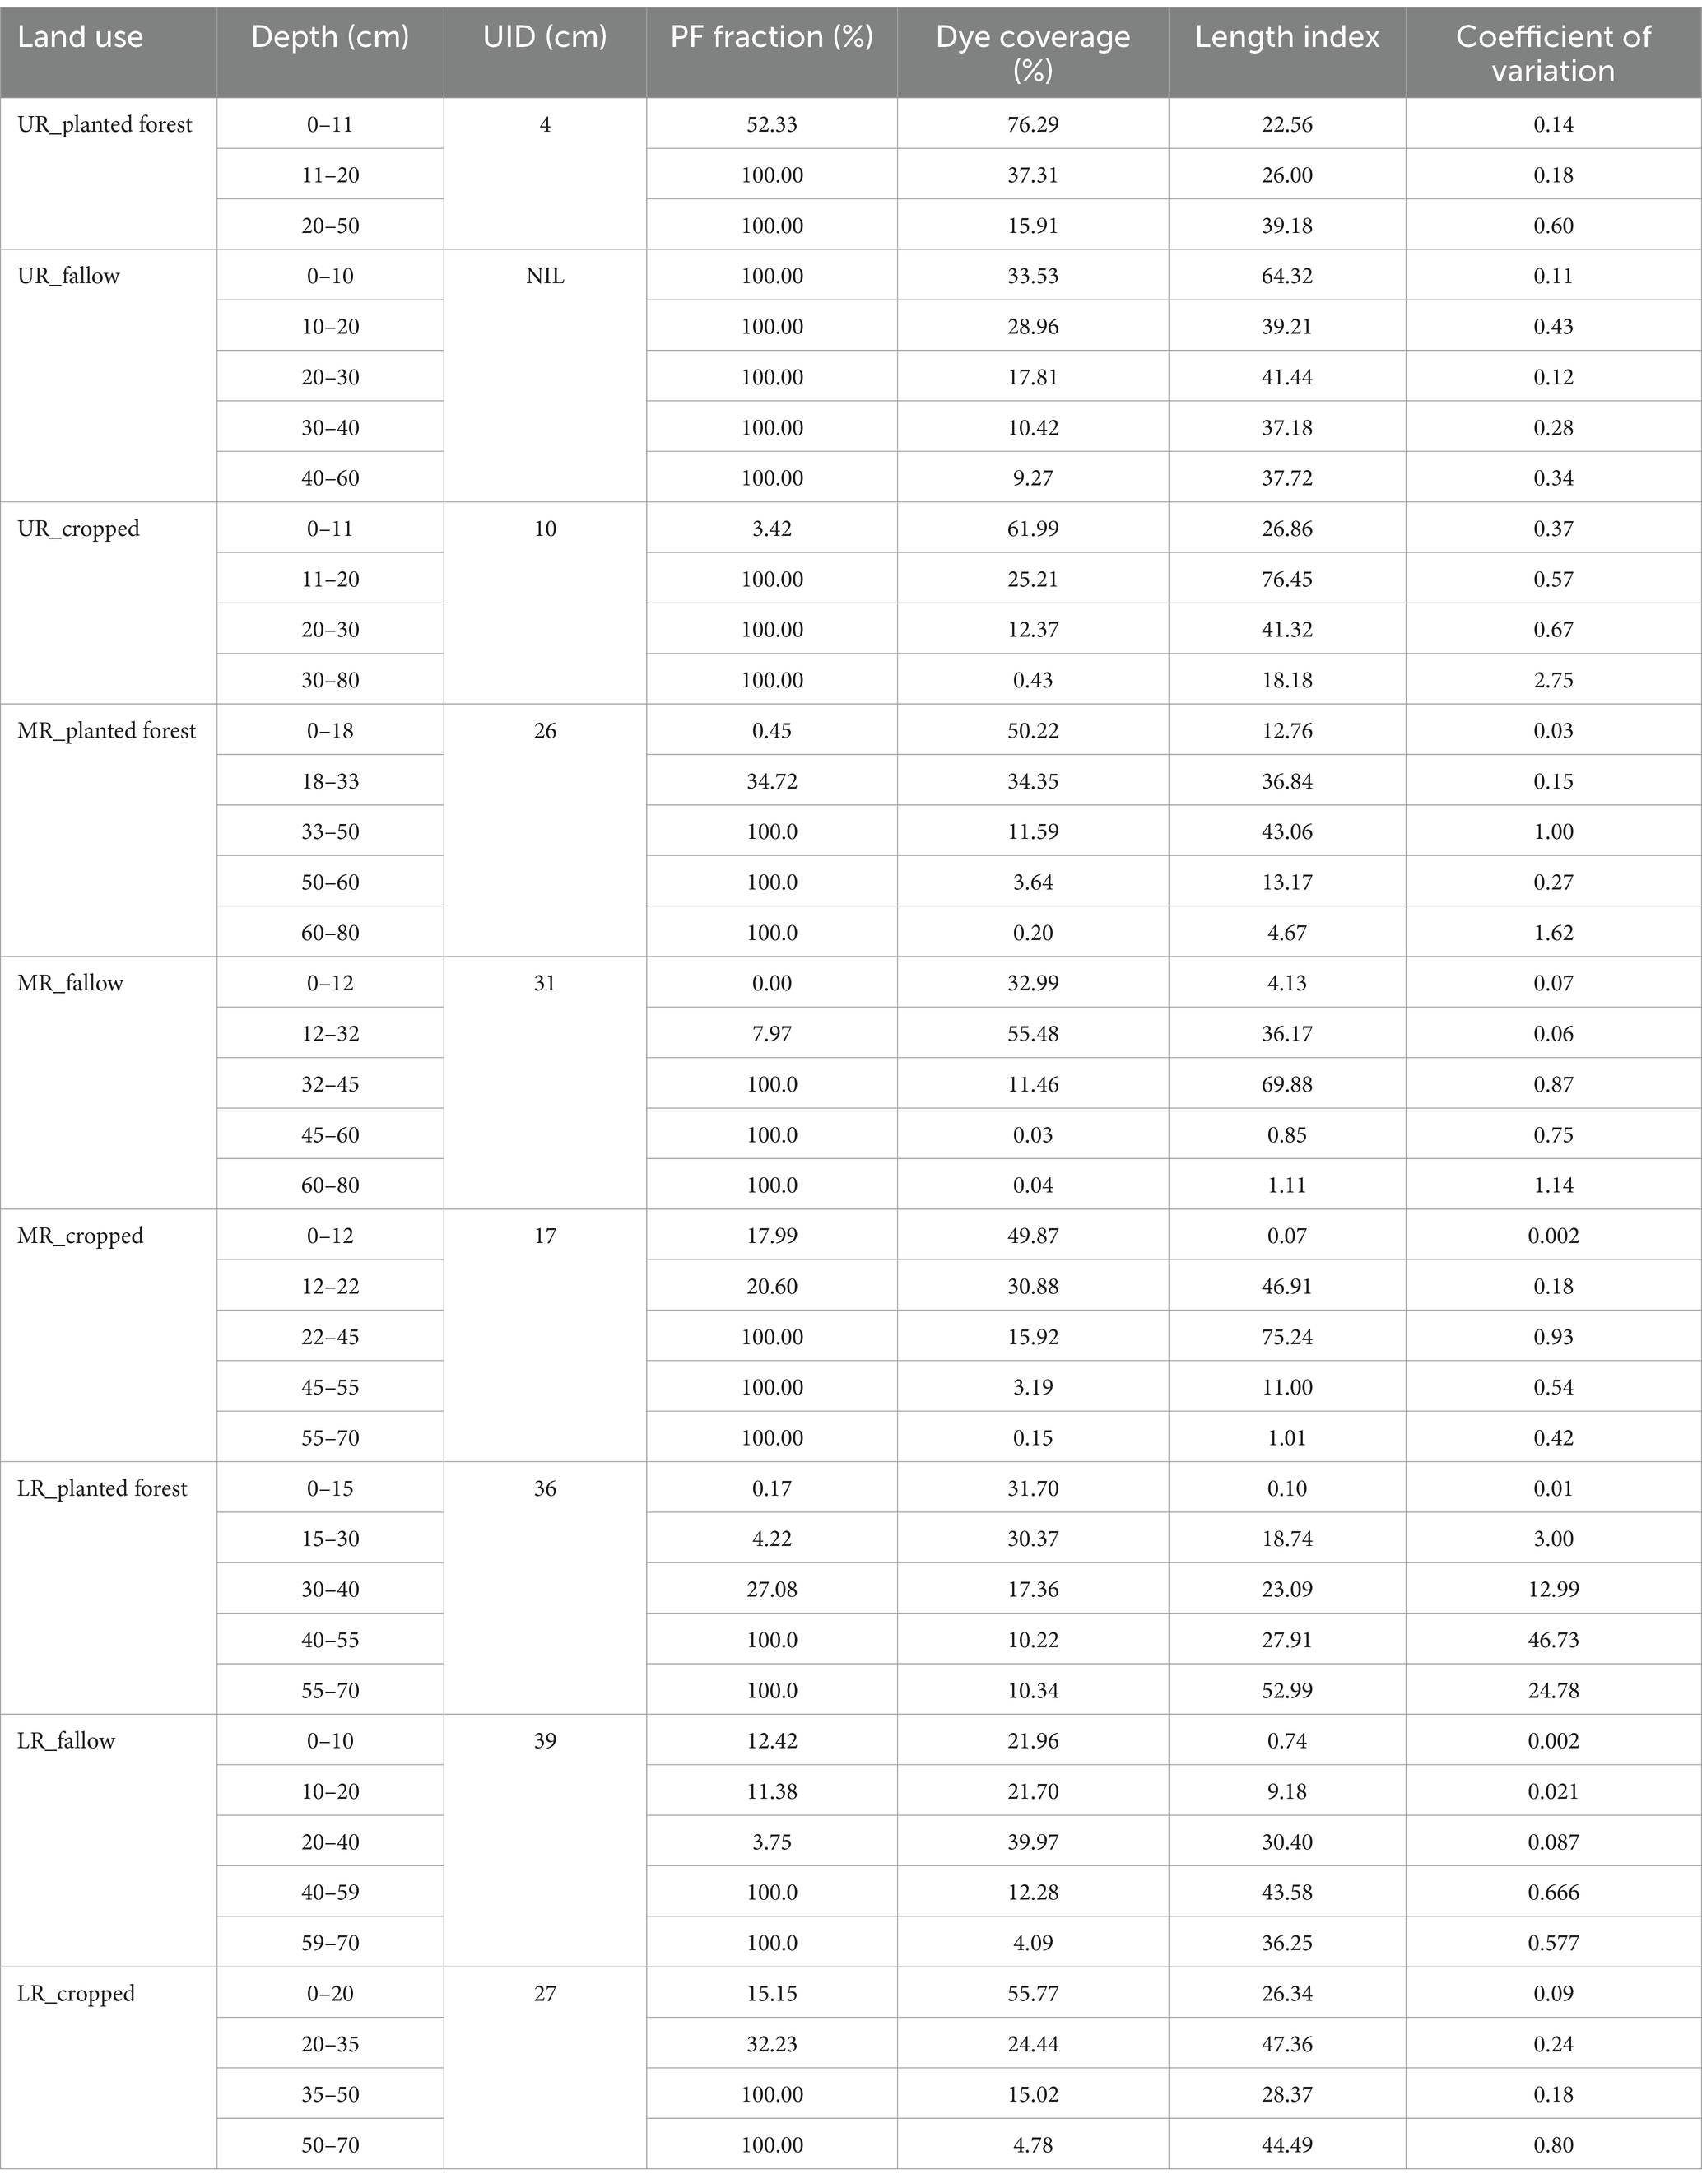
The uniform infiltration depth (UID) parameter provided insights into dye coverage, and the results varied based on elevation, as shown in Table 3, the upper reach exhibited the lowest UID, whereas the lower reach had the highest UID. All land-use types demonstrated an increasing trend in UID toward the lower reach. However, the preferential flow fraction (%) offers insights into the flow pattern, with the middle reach displaying the highest value (Table 3). This suggests that the middle reach has the highest proportion of preferential flow.
The preferential flow evaluation index at different elevations indicated that the middle reach had a maximum value of 0.49, thereby highlighting the prevalence of preferential flow in that particular reach. The lower reaches exhibited the highest dye coverage, correlating with high uniform infiltration depth (UID) values. Furthermore, the middle reaches displayed higher PF fraction values, which can be further explained by the preferential flow (PF) evaluation index (Table 4). The visual inspection of Figure 6 showed the overall dye movement, which also includes uniform infiltration depth (UID); thus, in the lower reach, uniform dye movement is more extensive than in the middle and upper reaches.
In all land-use systems, dye coverage patterns in the lower reach showed a dip at a depth of approximately 20 cm (Figure 8B). At approximately 30–33 cm, there was another dip in dye coverage due to the continuous presence of rocky fragments at this depth. Among the land-use systems, cropped land exhibited more pronounced funneling at lesser depths, specifically before reaching 15 cm. Forest soils in the middle reach also displayed slight funneling at approximately 20 cm, whereas in cropped land, funneling began earlier. Fallow land in the middle reach exhibited greater stability, as funneling started at approximately 30 cm. Below 30–40 cm, the soil profiles in all land-use systems were highly compacted. The majority (50–60%) of flow at this depth was attributed to stained path width (SPW) (Figure 11).
In the upper reach of planted forest land, SPW200 accounted for approximately 47.75% of the dye coverage in the topsoil horizon, while the second horizon consisted of SPW20–200 and SPW200, contributing 15.06 and 19.1%, respectively. The presence of SPW200 gradually decreased with increasing depth. In the middle reach of planted forest land, SPW200 accounted for approximately 87.67% of the dye coverage in the top horizon, while the second horizon was dominated by SPW20, which constituted more than 40% of the coverage (Figure 11). The sudden increase in SPW20 in the second and third horizons indicates restricted movement of dye water down the soil profile, leading to lateral water movement at depths of 20–40 cm. In the lower reach planted forest land, flow through SPW200 was 100% up to a depth of 15 cm and subsequently reduced to 44.78% (Figure 11). The significant reduction in SPW200 indicated the initiation of preferential flow through macropores with mixed interactions to the soil matrix. Similar trends were observed for SPW200 in the middle reach, whereas the upper reach had only 50% SPW200 at the uppermost depth of 0–15 cm. In the upper reach, fallow land, SPW20, and SPW20–200 lead to preferential flow, whereas in the middle reach fallow land, SPW200 was dominant up to a depth of 50 cm. In the lower reach of the fallow land, SPW20 was more at all depths, except for the uppermost horizon. In the lower reach of cropped land, the preferential flow was primarily governed by SPW200, and the presence of rock patches in the profiles supported these findings. This was in contrast to the upper reach cropped land, where SPW20 was dominant, while in the middle reach cropped land, SPW20 and SPW20–200 dominated the flow paths.
Discussion
Soil preferential flow refers to the movement of water through a heterogeneous soil matrix, where certain paths allow water to move faster than the surrounding soil, bypassing much of the soil matrix. This flow typically occurs through macropores, biopores, and cracks, which provide high-conductivity pathways relative to the surrounding soil, enabling rapid water movement that can bypass significant portions of the soil profile (Zhang et al., 2024; Liu et al., 2024). Accurate representation of preferential flow in watershed models can improve flood forecasting and management strategies (Smith et al., 2008). However, this process is highly variable and dependent on the extent of soil pore networks and soil conditions (Tromp-van Meerveld and McDonnell, 2006).
Preferential flow is inherently linked to the heterogeneity within the soil. Variations in soil texture, pore structure, biological activity, and overall soil architecture all combine to form a complex, uneven hydraulic environment. These heterogeneous conditions create preferential flow pathways, such as macropores, root channels, and cracks, that significantly affect the movement of water and solutes through the soil. As a result, PF can lead to non-uniform infiltration patterns that bypass large sections of the soil matrix, influencing both water retention and nutrient distribution.
To assess the degree of development of preferential soil flow at different slope positions, the preferential flow evaluation index (PFI) was compared at each elevation, namely, the upper, middle, and lower reaches. The PFI method, as described by Duo et al. (2020), was used to identify the parameter with the greatest influence on the preferential flow. Among all indices, dye coverage and preferential flow fraction played a more significant role in assessing the degree of development of preferential flow. These two indices effectively characterize the soil preferential flow within the watershed. However, it is important to note that the distribution of the parameter weight coefficients was relatively uniform without any single factor carrying excessive weight. This observation can be attributed to the substantial variation in the distribution characteristics of the preferential flow, as noted. The results (Table 4) revealed that the middle reach exhibited the highest degree of preferential soil flow development (PFI = 0.32), surpassing the values observed in the upper (PFI = 0.27) and lower reaches (PFI = 0.005).
Soil pore network and preferential flow
Land-use types have a significant impact on preferential flow paths. Pore size distribution, continuity, and connectivity are crucial factors that influence water flow and solute transport. An algorithm in the open-source software ImageJ was used to generate the skeletons of flow networks. Soil pore networks can consist of either an individual pore or multiple branches of interconnected pores. Nodes were defined as points where two branches of pores intersected (Figure 12). The local connectivity of the macropore network plays a key role in determining the extent of preferential transport, with poorer local connectivity leading to a greater degree of preferential flow.
In the case of the upper reach’s fallow lands, water flow through the macropores followed various irregular paths within the active soil pore network, exhibiting mixed interactions with the soil matrix. As a result, the infiltration patterns showed irregularities. Beven and Germann (1982) highlighted in their influential review paper that the size and number of pores alone do not indicate the occurrence of active preferential flow. Instead, the connectivity of the macropores determines hydraulic effectiveness.
Weiler (2001) proposed a classification scheme for flow types based on stained path width, which was useful in classifying the volume density pattern and identifying the predominant type of preferential flow in a watershed. The subsurface of the upper reach (20–50 cm) had more macropores with less interaction than the surface (0–20 cm), which mostly showed heterogeneous matrix flow and fingering (Figure 13). This resulted in poor permeability in the subsurface and flow instability owing to the coarse texture and water repellence in the surface soil (Wang et al., 2024; Zhang et al., 2024). The surface soil exhibited greater water retention variability and preferential flow patterns due to the presence of hydrophobic layers and the heterogeneity of pore distribution, which influenced the infiltration dynamics and flow stability (Liu et al., 2024; Feng et al., 2024).
The predominant surface flow types in the middle and lower reaches were heterogeneous matrix flow and fingering. Preferential flow can take the form of funneling, caused by variations in the hydraulic properties of soil or rock, or fingering, which results from differences in moisture distribution, flux patterns, macropore flow, or a combination of these factors (De Carlo et al., 2021). Whereas the subsurface soil profile exhibited macropores with mixed interactions. As a result, subsurface soils showed heterogeneity with respect to soil matrices and macropore flow variations. This condition mainly leads to lateral flow in the subsurface horizons (Figure 14), and unstable flow occurs when horizontal wetting fronts fragment into fingers or preferential flow paths during downward movement (Hendrickx and Flury, 2001; Wang et al., 2024). Several authors have suggested that spatial heterogeneity in water repellence can contribute to heterogeneous macropore flow, thereby enhancing preferential flow (Hendrickx and Hamminga, 1993; Jordán and Martínez-Zavala, 2008; Ritsema et al., 2001). Additionally, water repellence promotes preferential flow (Jarvis, 2007; Liu et al., 2024). Recent studies have further shown that macropore and matrix interactions in the subsurface can significantly affect flow stability and lateral movement, particularly in soils with high water repellence (Zhang et al., 2024).
Overall, the flow type within the watershed was primarily characterized by heterogeneous matrix flow on the surface, with land use indirectly influencing the distribution of flow, particularly at the soil profile level (Zhang et al., 2016).
Conclusion
The soil of the watershed, especially in the middle and lower reaches, displayed more heterogeneity and was characterized by a mixture of fingering flow on the surface and macropore flow on the sub-surface. Analysis using the PF evaluation index method and preferential flow type assessment indicated that the middle reach was more inclined to follow a preferential flow path for the distribution of water and nutrients. Sub-soiling and deep tillage once in 3 years is recommended for better crop production in these areas. These results indicate that the soil has entirely distinct channels that allow water along with nutrients to move within the soil horizons. A deeper understanding of preferential water flow within the soil would greatly benefit the study of soil’s ecological and hydrological functions, ultimately supporting improved agricultural management practices in India’s drylands.
Data availability statement
The original contributions presented in the study are included in the article/supplementary material, further inquiries can be directed to the corresponding author.
Author contributions
P: Conceptualization, Formal analysis, Methodology, Visualization, Writing – original draft, Writing – review & editing. KRe: Conceptualization, Supervision, Writing – review & editing. AD: Investigation, Methodology, Writing – review & editing. KK: Methodology, Writing – review & editing. JS: Methodology, Writing – review & editing. AR: Methodology, Resources, Writing – review & editing. NR: Methodology, Software, Writing – review & editing. KRa: Resources, Supervision, Writing – review & editing. PP: Formal analysis, Validation, Writing – review & editing. JR: Methodology, Writing – review & editing. MK: Investigation, Methodology, Writing – review & editing. VS: Supervision, Writing – review & editing.
Funding
The author(s) declare that no financial support was received for the research, authorship, and/or publication of this article.
Acknowledgments
The authors sincerely thank ICAR-CRIDA for supporting the institute project, “Characterizing Preferential Flow in Soils of Semi-arid Telangana,” from which this paper originates. Authors also extend their appreciation to the reviewers for their valuable and constructive feedback.
Conflict of interest
The authors declare that the research was conducted in the absence of any commercial or financial relationships that could be construed as a potential conflict of interest.
Publisher’s note
All claims expressed in this article are solely those of the authors and do not necessarily represent those of their affiliated organizations, or those of the publisher, the editors and the reviewers. Any product that may be evaluated in this article, or claim that may be made by its manufacturer, is not guaranteed or endorsed by the publisher.
References
Aeby, P., Schultze, U., Braichotte, D., Bundt, M., Moser-Boroumand, F., Wydler, H., et al. (2001). Fluorescence imaging of tracer distributions in soil profiles. Environ. Sci. Technol. 35, 753–760. doi: 10.1021/es000096x
Alaoui, A., and Goetz, B. (2008). Dye tracer and infiltration experiments to investigate macropore flow. Geoderma 144, 279–286. doi: 10.1016/j.geoderma.2007.11.020
Allaire, S. E., Roulier, S., and Cessna, A. J. (2009). Quantifying preferential flow in soils: a review of different techniques. J. Hydrol. 378, 179–204. doi: 10.1016/j.jhydrol.2009.08.013
AIS & LUS. (1971). Soil Survey Manual, All India Soil and Land Use survey (AIS & LUS) publication. New Delhi: IARI. 121p.
Anusha, B. N., Babu, K. R., Kumar, B. P., Sree, P. P., Veeraswamy, G., Swarnapriya, C., et al. (2023). Integrated studies for land suitability analysis towards sustainable agricultural development in semi-arid regions of AP, India. Geosyst. Geoenviron. 2:100131. doi: 10.1016/j.geogeo.2022.100131
Badapalli, P. K., Kottala, R. B., Madiga, R., and Mesa, R. (2021). Land suitability analysis and water resources for agriculture in semi-arid regions of Andhra Pradesh, South India using remote sensing and GIS techniques. Int. J. Energy Water Resour. 7, 205–220. doi: 10.1007/s42108-021-00151-3
Bargués Tobella, A., Reese, H., Almaw, A., Bayala, J., Malmer, A., Laudon, H., et al. (2014). The effect of trees on preferential flow and soil infiltrability in an agroforestry parkland in semiarid Burkina Faso. Water Resour. Res. 50, 3342–3354. doi: 10.1002/2013WR015197
Baveye, P., and Boast, C. W. (1998). Concepts of “fractals” in soil science: demixing apples and oranges. Soil Sci. Soc. Am. J. 62, 1469–1470. doi: 10.2136/sssaj1998.03615995006200050046x
Benegas, L., Ilstedt, U., Roupsard, O., Jones, J., and Malmer, A. (2014). Effects of trees on infiltrability and preferential flow in two contrasting agroecosystems in Central America. Agric. Ecosyst. Environ. 183, 185–196. doi: 10.1016/j.agee.2013.10.027
Beven, K., and Germann, P. (1982). Macropores and water flow in soils. Water Resour. Res. 18, 1311–1325. doi: 10.1029/WR018i005p01311
Cao, C., Yin, D., Gao, Y., and Xiang, G. (2023). Influence of soil heterogeneity on water flow and solute transport characterized by dye tracer experiments. J. Hydrol. Eng. 28:04022040. doi: 10.1061/JHYEFF.HEENG-5693
Caputo, M. C., De Carlo, L., Masciale, R., Perkins, K., Turturro, A. C., and Nimmo, J. R. (2024). Detection and quantification of preferential flow using artificial rainfall with multiple experimental approaches. Hydrogeol. J. 32, 467–485. doi: 10.1007/s10040-023-02733-3
Chen, X., Yu, Z., Yi, P., Aldahan, A., Hwang, H. T., and Sudicky, E. A. (2023). Disentangling runoff generation mechanisms: combining isotope tracing with integrated surface/subsurface simulation. J. Hydrol. 617:129149. doi: 10.1016/j.jhydrol.2023.129149
De Carlo, L., Perkins, K., and Caputo, M. C. (2021). Evidence of preferential flow activation in the vadose zone via geophysical monitoring. Sensors 21:1358. doi: 10.3390/s21041358
Duan, Z., Wang, C., Zhu, C., Chen, X., Zhai, Y., Ma, L., et al. (2024). Effects of straw incorporation and decomposition on soil preferential flow patterns using the dye-tracer method. Agriculture 14:201. doi: 10.3390/agriculture14020201
Duo, Y., Lin, Z., Fan, T., Xing, C., Yu, L., Wang, R., et al. (2020). The rise of 2D photothermal materials beyond graphene for clean water production. Adv. Sci. 7:1902236. doi: 10.1002/advs.201902236
Ewing, R. P., and Horton, R. (1999). Discriminating dyes in soil with color image analysis. Soil Sci. Soc. Am. J. 63, 18–24. doi: 10.2136/sssaj1999.03615995006300010004x
Feng, M., Li, T., Zeng, C., He, B., and Zhang, D. (2024). Changes in soil water repellency and soil erosion resistance as affected by land uses in karst environments. J. Environ. Manage. 368:122102.
Flury, M., and Flühler, H. (1995). Tracer characteristics of brilliant blue FCF. Soil Sci. Soc. Am. J. 59, 22–27. doi: 10.2136/sssaj1995.03615995005900010003x
Flury, M., Flühler, H., Jury, W. A., and Leuenberger, J. (1994). Susceptibility of soils to preferential flow of water: a field study. Water Resour. Res. 30, 1945–1954. doi: 10.1029/94WR00871
Forrer, L., Papritz, A., Kasteel, R., Flühler, H., and Luca, D. (2000). Quantifying dye tracers in soil profiles by image processing. Eur. J. Soil Sci. 51, 313–322.
Fuhrmann, I., Maarastawi, S., Neumann, J., Amelung, W., Frindte, K., Knief, C., et al. (2019). Preferential flow pathways in paddy rice soils as hot spots for nutrient cycling. Geoderma 337, 594–606. doi: 10.1016/j.geoderma.2018.10.011
Gou, J., Qu, S., Shi, P., Guan, H., Yang, H., Zhang, Z., et al. (2023). Comparison of transit time models for exploring seasonal variation of preferential flow in a Moso bamboo watershed. J. Hydrol. 626:130308. doi: 10.1016/j.jhydrol.2023.130308
Haas, C., Horn, R., Ellerbrock, R. H., and Gerke, H. H. (2020). Fluorescence imaging for mm-scale observation of macropore-matrix mass transfer: calibration experiments. Geoderma 360:114002. doi: 10.1016/j.geoderma.2019.114002
Hamed, H., Holli, K., Howell, A., and Forbes, J. F.IBIS-I Investigators (2015). Tamoxifen for prevention of breast cancer: extended long-term follow-up of the IBIS-I breast cancer prevention trial. Lancet Oncol. 16, 67–75. doi: 10.1016/S1470-2045(14)71171-4
Hendrickx, J. M., and Flury, M. (2001). “Uniform and preferential flow mechanisms in the vadose zone” in Conceptual models of flow and transport in the fractured vadose zone, Washington, DC: National Academy Press. 149–187.
Hendrickx, J. M. H., and Hamminga, W. (1993). Preferential flow mechanism in a water-repellent sandy soil. Water Resour. Res. 29, 2183–2193. doi: 10.1029/93WR00394
Jačka, L., Walmsley, A., Kovář, M., and Frouz, J. (2021). Effects of different tree species on infiltration and preferential flow in soils developing at a clayey spoil heap. Geoderma 403:115372.
Jarvis, N. J. (2007). A review of non-equilibrium water flow and solute transport in soil macropores: principles, controlling factors and consequences for water quality. Eur. J. Soil Sci. 58, 523–546. doi: 10.1111/j.1365-2389.2007.00915.x
Jordán, A., and Martínez-Zavala, L. (2008). Soil loss and runoff rates on unpaved forest roads in southern Spain after simulated rainfall. For. Ecol. Manag. 255, 913–919. doi: 10.1016/j.foreco.2007.10.002
Kimura, R., and Moriyama, M. (2024). Recent global distribution of aridity index and land use in arid regions. SOLA 20, 79–85. doi: 10.2151/sola.2024-011
Liu, L., Chen, R., Li, Z., Zhou, C., and Li, X. (2024). A new method for preventing sidewall preferential flow in the internal erosion simulation using un-resolved CFD–DEM. Acta Geophys. 72, 3595–3607. doi: 10.1007/s11600-023-01273-4
Liu, L., Liu, X., Yao, Y., Qi, W., and Guo, Y. (2023). Preferential flow in the understory soil of Hippophae rhamnoides at different stump heights. Front. Environ. Sci. 11:1183448. doi: 10.3389/fenvs.2023.1183448
Liu, T., Peng, X., Dai, Q., and Xu, S. (2022). Role of the preferential flow at rock–soil interface in the water leaking process in near-surface fissures filled with soils in the karst rock desertification area. Appl Water Sci 12:208. doi: 10.1007/s13201-022-01730-3
Liu, C., Yuan, Y., Zhou, A., Guo, L., Zhang, H., and Liu, X. (2022). Development trends and research Frontiers of preferential flow in soil based on CiteSpace. Water 14:3036. doi: 10.3390/w14193036
Makowski, V., Julich, S., Feger, K. H., and Julich, D. (2020). Soil phosphorus translocation via preferential flow pathways: a comparison of two sites with different phosphorus stocks. Front. For. Global Change 3:48. doi: 10.3389/ffgc.2020.00048
Morris, C., and Mooney, S. J. (2004). A high-resolution system for the quantification of preferential flow in undisturbed soil using observations of tracers. Geoderma 118, 133–143. doi: 10.1016/S0016-7061(03)00189-7
Pandey, V., Srivastava, P. K., Das, P., Behera, M. D., and Rajasekaran, E. (2024). Hydrological modelling for post-monsoon agricultural drought assessment and implications for the agro-economy. Hydrol. Sci. J. 69, 923–938. doi: 10.1080/02626667.2024.2347981
Persson, M. (2005). Image analysis in soil science. Lund, Sweden: Department of Water Resources Engineering, Lund University.
Pushpanjali,, Angayarkanni, A., Dhimate, A. S., and Kumar, S. A. (2022b). Watershed approach for studying soil preferential flow: a case study. Ann. Plant Soil Res. 24, 238–244. doi: 10.47815/apsr.2022.10155
Pushpanjali,, Osman, M. D., Reddy, K. S., Pankaj, P. K., Samuel, J., Karthikeyan, K., et al. (2022a). Land-use change mapping and analysis using remote sensing and GIS for watershed evaluation-a case study. J. Soil Water Conserv. 21, 1–6. doi: 10.5958/2455-7145.2022.00001.7
Ritsema, C. J., van Dam, J. C., Nieber, J. L., Dekker, L. W., Oostindie, K., and Steenhuis, T. S. (2001). “Preferential flow in water repellent sandy soils: principles and modeling approaches” in Preferential flow: water movement and chemical transport in the environment (St. Joseph, Michigan: American Society of Agricultural and Biological Engineers), 129.
Roy, A., Chatterjee, S., Sinha, U. K., Jain, A. K., Mohokar, H., Jaryal, A., et al. (2024). Recharge and vulnerability assessment of groundwater resources in north West India: insights from isotope-geospatial modelling approach. Geosci. Front. 15:101721. doi: 10.1016/j.gsf.2023.101721
Sander, T., and Gerke, H. H. (2007). Preferential flow patterns in paddy fields using a dye tracer. Vadose Zone J. 6, 105–115. doi: 10.2136/vzj2006.0035
Shahid, M., Niazi, N. K., Dumat, C., Naidu, R., Khalid, S., Rahman, M. M., et al. (2018). A meta-analysis of the distribution, sources and health risks of arsenic-contaminated groundwater in Pakistan. Environ. Pollut. 242, 307–319. doi: 10.1016/j.envpol.2018.06.083
Shougrakpam, S., Sarkar, R., and Dutta, S. (2010). An experimental investigation to characterise soil macroporosity under different land use and land covers of Northeast India. J. Earth Syst. Sci. 119, 655–674. doi: 10.1007/s12040-010-0042-5
Sivapalan, M. (2003). Process complexity at hillslope scale, process simplicity at watershed scale: is there a connection? EGS-AGU-EUG Joint Assembly :7973.
Smith, P., Martino, D., Cai, Z., Gwary, D., Janzen, H., Kumar, P., et al. (2008). Greenhouse gas mitigation in agriculture. Philos. Trans. R. Soc. B Biol. Sci. 363, 789–813. doi: 10.1098/rstb.2007.2184
Sohrt, J., Ries, F., Sauter, M., and Lange, J. (2014). Significance of preferential flow at the rock soil interface in a semi-arid karst environment. Catena 123, 1–10. doi: 10.1016/j.catena.2014.07.003
Teixeira, M. L., Cardoso, M. D. G., Figueiredo, A. C. S., Moraes, J. C., Assis, F. A., de Andrade, J., et al. (2014). Essential oils from Lippia origanoides Kunth. And Mentha spicata L.: chemical composition, insecticidal and antioxidant activities. Am. J. Plant Sci. Avilable at: https://link.springer.com/book/10.1007/978-3-319-06013-2
Tromp-van Meerveld, H. J., and McDonnell, J. J. (2006). Thresholds in subsurface stormflow. J. Hydrol. 321, 234–252. doi: 10.1029/2004WR003778
Van Schaik, N. L. M. B. (2009). Spatial variability of infiltration patterns related to site characteristics in a semi-arid watershed. Catena 78, 36–47. doi: 10.1016/j.catena.2009.02.017
Vogel, D. L., Wade, N. G., and Haake, S. (2006). Measuring the self-stigma associated with seeking psychological help. J. Couns. Psychol. 53, 325–337. doi: 10.1037/0022-0167.53.3.325
Wang, X., Fan, X., Jian, W., Wu, Z., and Lü, C. (2024). Migration characters of gravel soil fine particles and the formation path of preferential flow. J. Eng. Geol. 32, 387–396.
Wang, Q., Shaheen, S. M., Jiang, Y., Li, R., Slaný, M., Abdelrahman, H., et al. (2021). Fe/Mn-and P-modified drinking water treatment residuals reduced cu and Pb phytoavailability and uptake in a mining soil. J. Hazard. Mater. 403:123628. doi: 10.1016/j.jhazmat.2020.123628
Wei, H., Yang, Y., Wang, J., Meng, Q., and Deng, Y. (2024). A comparison of preferential flow characteristics and influencing factors between two soils developed in the karst region of Southwest China. Soil Tillage Res. 241:106132. doi: 10.1016/j.still.2024.106132
Weibel, E. R. (1979). Morphometry of the human lung: the state of the art after two decades. Bull. Eur. Physiopathol. Respiratoire 15, 999–1013
Weiler, M. H. (2001). Mechanisms controlling macropore flow during infiltration: dye tracer experiments and simulations. Doctoral dissertation Zurich, Switzerland: ETH Zurich.
Weiler, M., and Flühler, H. (2004). Inferring flow types from dye patterns in macroporous soils. Geoderma 120, 137–153. doi: 10.1016/j.geoderma.2003.08.014
Zhang, J., Lei, T., Qu, L., Zhang, M., Chen, P., Gao, X., et al. (2019). Method to quantitatively partition the temporal preferential flow and matrix infiltration in forest soil. Geoderma 347, 150–159. doi: 10.1016/j.geoderma.2019.03.026
Zhang, C., Nie, S., Liang, J., Zeng, G., Wu, H., Hua, S., et al. (2016). Effects of heavy metals and soil physicochemical properties on wetland soil microbial biomass and bacterial community structure. Sci. Total Environ. 557-558, 785–790. doi: 10.1016/j.scitotenv.2016.01.170
Zhang, Y., Niu, J., Zhang, M., Xiao, Z., and Zhu, W. (2017). Interaction between plant roots and soil water flow in response to preferential flow paths in northern China. Land Degrad. Dev. 28, 648–663. doi: 10.1002/ldr.2592
Zhang, T. Y., and Suen, C. Y. (1984). A fast-parallel algorithm for thinning digital patterns. Commun. ACM 27, 236–239. doi: 10.1145/357994.358023
Zhang, J., Sun, Q., Wen, N., Horton, R., and Liu, G. (2022). Quantifying preferential flows on two farmlands in the North China plain using dual infiltration and dye tracer methods. Geoderma 428:116205. doi: 10.1016/j.geoderma.2022.116205
Keywords: soil heterogeneity, land use, watershed, GIS, brilliant blue dye
Citation: Reddy KS, Dhimate AS, Karthikeyan K, Samuel J, Reddy AGK, Ravi Kumar N, Rao KV, Pankaj PK, Rohit J, Kumar M and Singh VK (2025) Soil preferential flow dynamics in the southern drylands of India—a watershed based approach. Front. Water. 6:1457680. doi: 10.3389/frwa.2024.1457680
Edited by:
Natthachet Tangdamrongsub, Asian Institute of Technology, ThailandReviewed by:
Hu Guo, Sinopec Research Institute of Petroleum Engineering (SRIPE), ChinaMaria Clementina Caputo, National Research Council (CNR), Italy
Copyright © 2025 Pushpanjali, Reddy, Dhimate, Karthikeyan, Samuel, Reddy, Ravi Kumar, Rao, Pankaj, Rohit, Kumar and Singh. This is an open-access article distributed under the terms of the Creative Commons Attribution License (CC BY). The use, distribution or reproduction in other forums is permitted, provided the original author(s) and the copyright owner(s) are credited and that the original publication in this journal is cited, in accordance with accepted academic practice. No use, distribution or reproduction is permitted which does not comply with these terms.
*Correspondence: Pushpanjali, cHVzaHBhbmphbGlAaWNhci5nb3YuaW4=
 Pushpanjali
 K. S. Reddy1