- 1Department of Geography, Kenyatta University, Nairobi, Kenya
- 2Department of Humanities, University of Embu, Embu, Kenya
The frequency and intensity of flooding have been increasing in urban watersheds. Urbanization disrupts natural landscapes by replacing vegetated areas with impervious surfaces, reducing infiltration and increasing runoff. The objective of this study was to evaluate the relationship between change in impervious surface area and runoff amount of Mihang’o watershed located in the outskirts of Nairobi for the period 2000–2022. The specific objectives of this study were as follows: To determine the change in the impervious surface area of Mihang’o watershed, the trend of precipitation amount in the watershed, and the trend in runoff amount, a major source of flood water from the watershed. Supervised classification was performed on land satellite (Landsat) images to determine percentages of impervious surface cover for the study period, and linear regression analysis was used to establish the trend. Climate Hazards Group InfraRed Precipitation with Station (CHIRPS) rainfall data were retrieved from Google Earth Engine, then processed to produce monthly and annual rainfall totals, and Mann–Kendall trend tests were used to establish the rainfall trend for the watershed. The Hydrologic Engineering Center’s Hydrologic Modeling System (HEC-HMS) model was used to simulate runoff from the watershed with the rainfall data and impervious surface area percentages as inputs; then, linear regression analysis was performed to establish the runoff trend. The impervious surface area increased by 87.03% from 2.88% (0.49 km2) of the total surface area of the watershed in 2000 to 22.21% (3.91 km2) in 2022, demonstrating an approximate increment of 3.96% (0.88 km2) each year. The Mann–Kendall trend test results (Sen’s slope results [β = 0.832], Kendall’s tau results [τb = 0.146], and p-value [0.625]) confirmed that there is no significant change in rainfall amounts. Runoff increased by 84.75% from 0.18 mm in 2000 to 1.18 mm in 2022; otherwise, an approximate increment of 3.85% (0.045 mm) was evident each year. Besides the impervious surface area, the HEC-HMS model factors in the length of slope, length of reach, soil type, size of subbasins, and longest flow path, thus producing accurate runoff estimations.
1 Introduction
Surfaces that restrict water penetration are referred to as impervious surfaces (Stanuikynas et al., 2000). However, in watershed management, natural conditions that restrict water movement, including very dense soil layers, hardpans, and bedrock are not considered impervious surfaces (Stanuikynas et al., 2000). Impervious surfaces are created by man, including buildings, tarmac roads or highways, rooftops, sidewalks, parking lots, lawns, patios, and paved surfaces, such as asphalt and concrete (Ebrahimian et al., 2016a; Tang et al., 2018).
According to O’Driscoll et al. (2010), urbanization increases a watershed’s impervious area. Shuster et al. (2005) describe urbanization as the disruption of natural landscapes, ultimately replacing vegetated areas with impermeable surfaces. Urbanization is fueled by population increase, which demands more residential and commercial space from the previously green spaces (Miller et al., 2014). The United Nations projected that roughly 68% of the world’s population will reside in urban areas by 2050 (United Nations, 2018). Therefore, impervious surface area in a watershed is anticipated to increase concurrently with urbanization.
The primary concern associated with urbanization and the resultant impervious surface increase is the disruption of the normal hydrological cycle in a watershed. Total impervious area decreases precipitation infiltration and surface storage while increasing runoff (Ebrahimian et al., 2016a). In undeveloped settings, trees, depressions, natural lands, bushes, and soil delay overland flow and enhance rain infiltration (O’Driscoll et al., 2010; Xu and Zhao, 2016). According to Ligtenberg (2017), approximately 10% of precipitation is transformed into runoff in a forested watershed, but approximately 55% becomes runoff in a 75% impervious watershed. According to Ebrahimian et al. (2016b), impervious surfaces in urban watersheds cause hydraulic efficiency, resulting in a shorter concentration and lag time. This reduces the ability to infiltrate precipitation but increases runoff or outflow from the catchment (Ebrahimian et al., 2016b). Nonetheless, other factors influencing runoff amount include the amount of precipitation, type of imperviousness, watershed’s soil type, slope of watershed, size of the watershed and subbasins, length of reaches, longest flow path, initial abstraction, catchment’s centroid positioning and elevation, and whether impervious surfaces are connected or not connected to a drainage channel U.S. Army Corps of Engineers (ACE), 2009; Chathuranika et al., 2022; Guo et al., 2019; Rezaei et al., 2019; Xu and Zhao, 2016].
Kenya is a developing country that is characterized by rapid urbanization (Bosco et al., 2011). Recently, there have been increasing development activities, mainly road and building constructions throughout major towns and their environments (Gachanja et al., 2023; Mbuthia et al., 2022). In Nairobi, the land use/land cover (LULC) has changed from forest, shrubs, plantations, bare land, and grassland to roads and built-up areas (Bosco et al., 2011).
The problem of rapid urbanization, impervious surface area increase, and consequently, increase in runoff and flooding is evident in Mihang’o watershed. The proximity of Mihang’o to Nairobi City and Jomo Kenyatta International Airport (JKIA) has influenced rapid urbanization. For instance, more tarmacked roads and residential and commercial buildings have been developed in Mihang’o since 2010. However, during rainy seasons, the frequency and magnitude of flooding downstream of River Mihang’o and at Kangudo Road – Eastern Bypass Highway junction has also become worrisome recently.
While poor urban planning and management could be a contributing factor to the problem in Mihang’o (Muli, 2008; Owuor and Mwiturubani, 2022; Tom et al., 2022), this study focused on establishing the relationship between impervious surface area increase and runoff amount. When this study was conducted, there was inadequate knowledge about the relationship between the impervious surface area increase and runoff amount from Mihang’o watershed.
Increased runoff from Mihang’o after rainfall events is an environmental hazard. The runoff causes flooding downstream of River Mihang’o and at the intersection of Kangudo Road – Eastern Bypass Highway. The floods in Mihang’o destroy property and lives and affect transport activities. There was, therefore, the need to understand the relationship between runoff and impervious surface area in Mihang’o watershed. This study’s results are foundational in creating evidence-based mitigation measures for increased runoff from Mihang’o watershed and other towns where similar problems are experienced.
The overall objective of this study was to evaluate the relationship between changes in impervious surface area and runoff amount in Mihang’o watershed from 2000 to 2022. Specifically, the study aimed to (1) quantify changes in impervious surface area, (2) analyze precipitation trends, and (3) evaluate trends in runoff amounts within the watershed over this period.
The hypotheses tested were: (1) there is no trend in the impervious surface area time series of Mihang’o watershed, (2) there is no trend in the rainfall data time series, and (3) there is no trend in the runoff time series.
2 Materials and methods
2.1 Materials
2.1.1 Study area
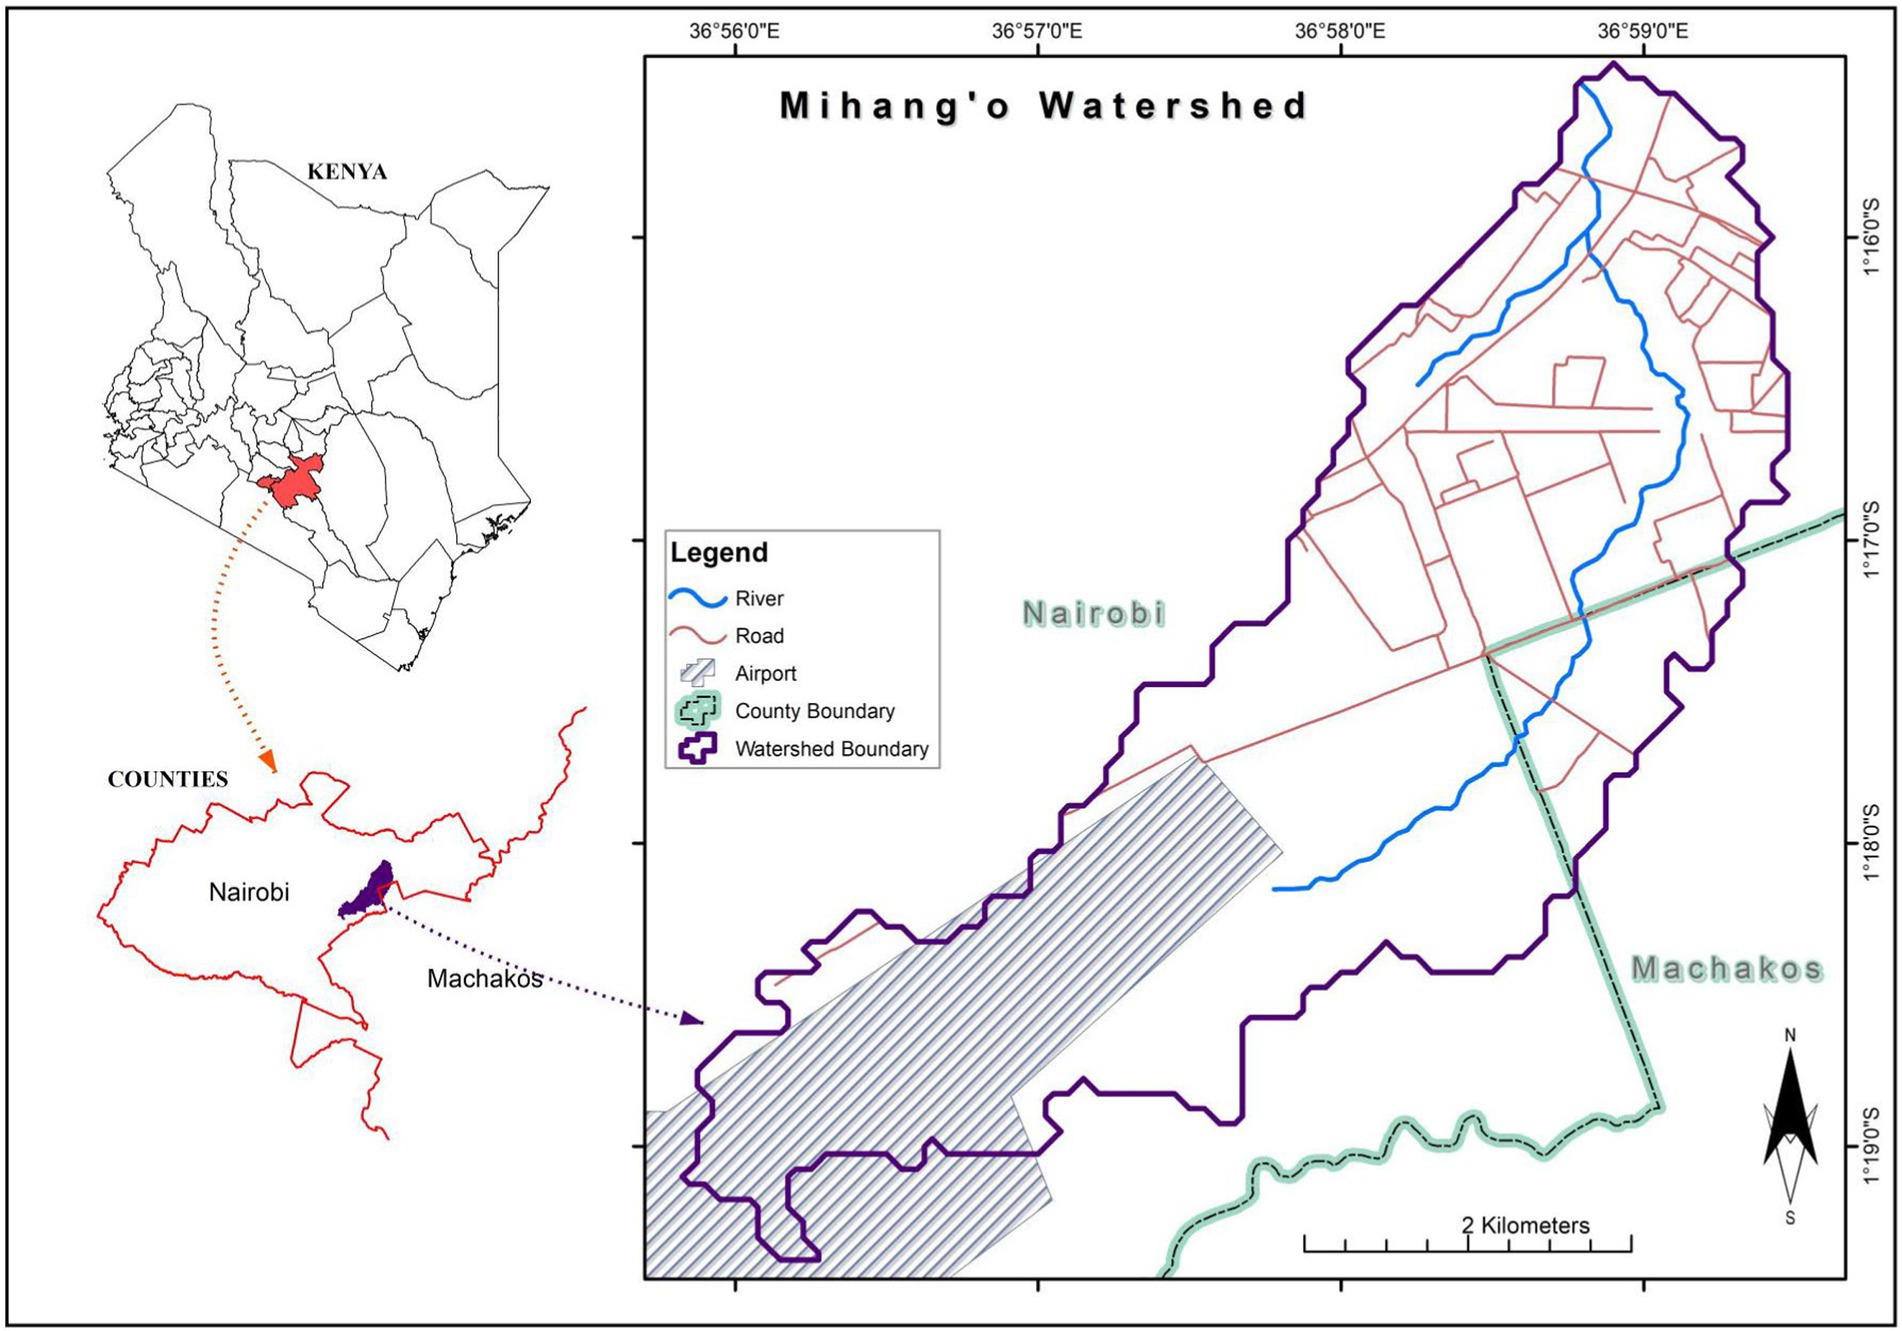
Mihang’o watershed, which hosts River Mihang’o, is located on the outskirts of Nairobi City, the capital city of Kenya. Nairobi is located south of the equator, lying between longitudes 36°55′ and 36°60′ east and latitudes 1°15′ and 1°20′. The watershed covers an approximate area of 17.6 km2 at the edge of Nairobi County and extends to Machakos County, as shown in Figure 1, with Ruai – Embakasi – Mihang’o sublocations in Nairobi County and Katani in Machakos county. The highest point of Mihang’o watershed is 1,624 m.a.s.l., which is JKIA, and the lowest is 1,499 m.a.s.l. at the outlet point at the Eastern Bypass-Kangundo Road junction. The watershed slopes gently from the south toward the north. The watershed is relatively long and narrow; the stretch from southwest to northeast is 8.8 km, and the maximum width of the watershed is 2.5 km. River Mihang’o has two tributaries that converge and drain into the Nairobi River, a drainage system in the upper Athi drainage basin. The watershed is a good study area due to its notable features, such as an international airport, the General Service Unit (GSU) Training School, the Eastern Bypass Highway, and the Administration Police Training Center (APTC), as well as the natural Earth and riverine areas.
2.1.2 Data
2.1.2.1 Land use/land cover
Mihang’o watershed was originally a shrubland, grassland, and bare land where wildlife roamed. However, over the years, man occupied the area and caused urbanization. Satellite images were used to determine changes in LULC in Mihang’o watershed over the years. Land satellite (Landsat) satellite images over Nairobi were obtained from the Regional Center for Mapping for Resource Development (RCMRD). Landsat images for 2000, 2003, 2006, 2009, 2012, 2015, 2018, and 2022 were singled out for the study to determine LULC change, or relatively impervious surface area trend. Studies recommend a 5–0-year time period as optimal for capturing land use changes (Liu et al., 2015; Seto and Shepherd, 2009). According to Seto and Shepherd (2009), shorter periods cannot capture all changes occurring, and longer periods may not demonstrate a traceable trend. The time frame of this study was 22 years, between 2000 and 2022, is short; therefore, a 3-year gap was suitable to show a clear trend.
2.1.2.2 Climate
Mihang’o watershed is part of the Nairobi region, which is classified under ecological zone five and falls under a sub-humid climate region with a subtropical highland climate (Muli, 2008). Rainfall varies strongly yearly (University of Cape Town, 2017). Typically, Nairobi’s annual total rainfall varies between approximately 300 and 900 mm/year, though it can be much higher during extreme rain event years. There are primarily two rainfall seasons (Muli, 2008). The long rains occurring in March–April–May (MAM) averagely record 310 mm/year, and the short rains experienced in November–December (ND) record approximately 200 mm/year.
The rainfall data were downloaded from Climate Hazards Group InfraRed Precipitation with Station (CHIRPS) dataset, which is contained in Google Earth. Google Earth is a geobrowser that renders a three-dimensional representation of the Earth primarily based on satellite imagery. In alignment with Objective Number 1, daily rainfall data for 2000, 2003, 2006, 2009, 2012, 2015, 2018, and 2022 were obtained. A customized JavaScript code was employed to extract CHIRPS rainfall data from Google Earth, providing estimates for daily rainfall in the Mihang’o watershed from 2000 to 2022. The data were exported as Excel files, allowing for further analysis. Subsequently, monthly and annual rainfall totals were calculated based on the extracted data for the specified years.
2.1.2.3 Soils
Being part of the Nairobi subcatchment area, Mihang’o watershed constitutes the area where volcanic activities dominated geological history and controlled the geomorphological evolution (Onyancha et al., 2011). As a result, Mihang’o watershed contains patches of vertisols soils, a complex of well-drained to imperfectly drained shallow to moderately very dark, greyish brown, firm, slightly to moderately calcareous, rock stony or gravelly clay (Akech et al., 2013). These soils combined have a permeability coefficient between 0.013 cm/h and 0.38 cm/h (Muli, 2008).
2.1.2.4 Digital elevation model (DEM)
This study used a GeoTIFF Nairobi DEM acquired from the United States Geological Survey (USGS) website. The spatial resolution for the DEM was 1 arcsec (30 m). The temporal resolution for the DEM was Shuttle Radar Topography Mission (SRTM) data collected in February 2000 (United States Geological Survey, 2023).
2.2 Methods
2.2.1 Impervious surface
With the Mihang’o watershed shapefile and tools in the Multivariate toolset of the ArcGIS (10.4) Spatial Analyst extension, supervised classification was completed for the Landsat images for each year of study. Though supervised classification is taxing and time-consuming, it is an accurate approach compared to unsupervised classification (Alves and Sanches, 2023). The following classes were selected based on the existing land LULC of Mihang’o watershed: water, buildings, vegetation, agriculture, bare land, and tarmac. Therefore, impervious surfaces in the watershed included rooftops (buildings), paved parking lots, driveways, tarmacked streets and roads, gravel and dirt roads, paved curbs and storm sewers, and paved open ditches. These impervious surfaces were dissolved into a single entity.
2.2.2 Precipitation
Rainfall data were extracted from the daily Climate Hazards Group InfraRed Precipitation with Station (CHIRPS) dataset. Monthly and annual rainfall totals were then calculated for the specified years based on this extracted data. To ensure data quality, rainfall data were collected from the Kenyatta University (KU) Weather Station, which is located 9 km north of Mihang’o watershed. These in situ data were analyzed alongside the CHIRPS data to assess consistency and reliability.
2.2.3 Runoff
The Hydrologic Engineering Center’s Hydrologic Modeling System (HEC-HMS) model was employed to simulate runoff from the watershed, utilizing precipitation and impervious surface coefficient as the fundamental input data (Naresh and Naik, 2023). Known for its efficiency in hydrological studies, the HEC-HMS model can conduct simulations, including rainfall-runoff modeling, meteorological data analysis, and parameter estimation (Alshammari et al., 2024). Its popularity in hydrological studies can be attributed to its capability to simulate runoff in both long-term and short-term events, its utilization of common methods, and its user-friendly interface (Alshammari et al., 2024). Before initiating an HEC-HMS project for runoff simulation, several supporting data must be determined based on predetermined loss, transform, and routing specifications (Guduru et al., 2023; Namwade et al., 2023). The configuration of the HEC-HMS model also comprises a basin model, a meteorological model, input data (time series data), and control parameters (Yu and Zhang, 2023).
2.2.3.1 HEC-HMS model calibration
2.2.3.1.1 Basin model
Basin information is the fundamental step in the HEC-HMS project. The basin model carries watershed physical parameters information (Guduru et al., 2023). The watershed physical parameters required in an HEC-HMS project include subbasins, river reaches, junction, sink, size of subbasins, and slope of the subbasins. ArcGIS was used to process the watershed physical parameters in a shapefile.
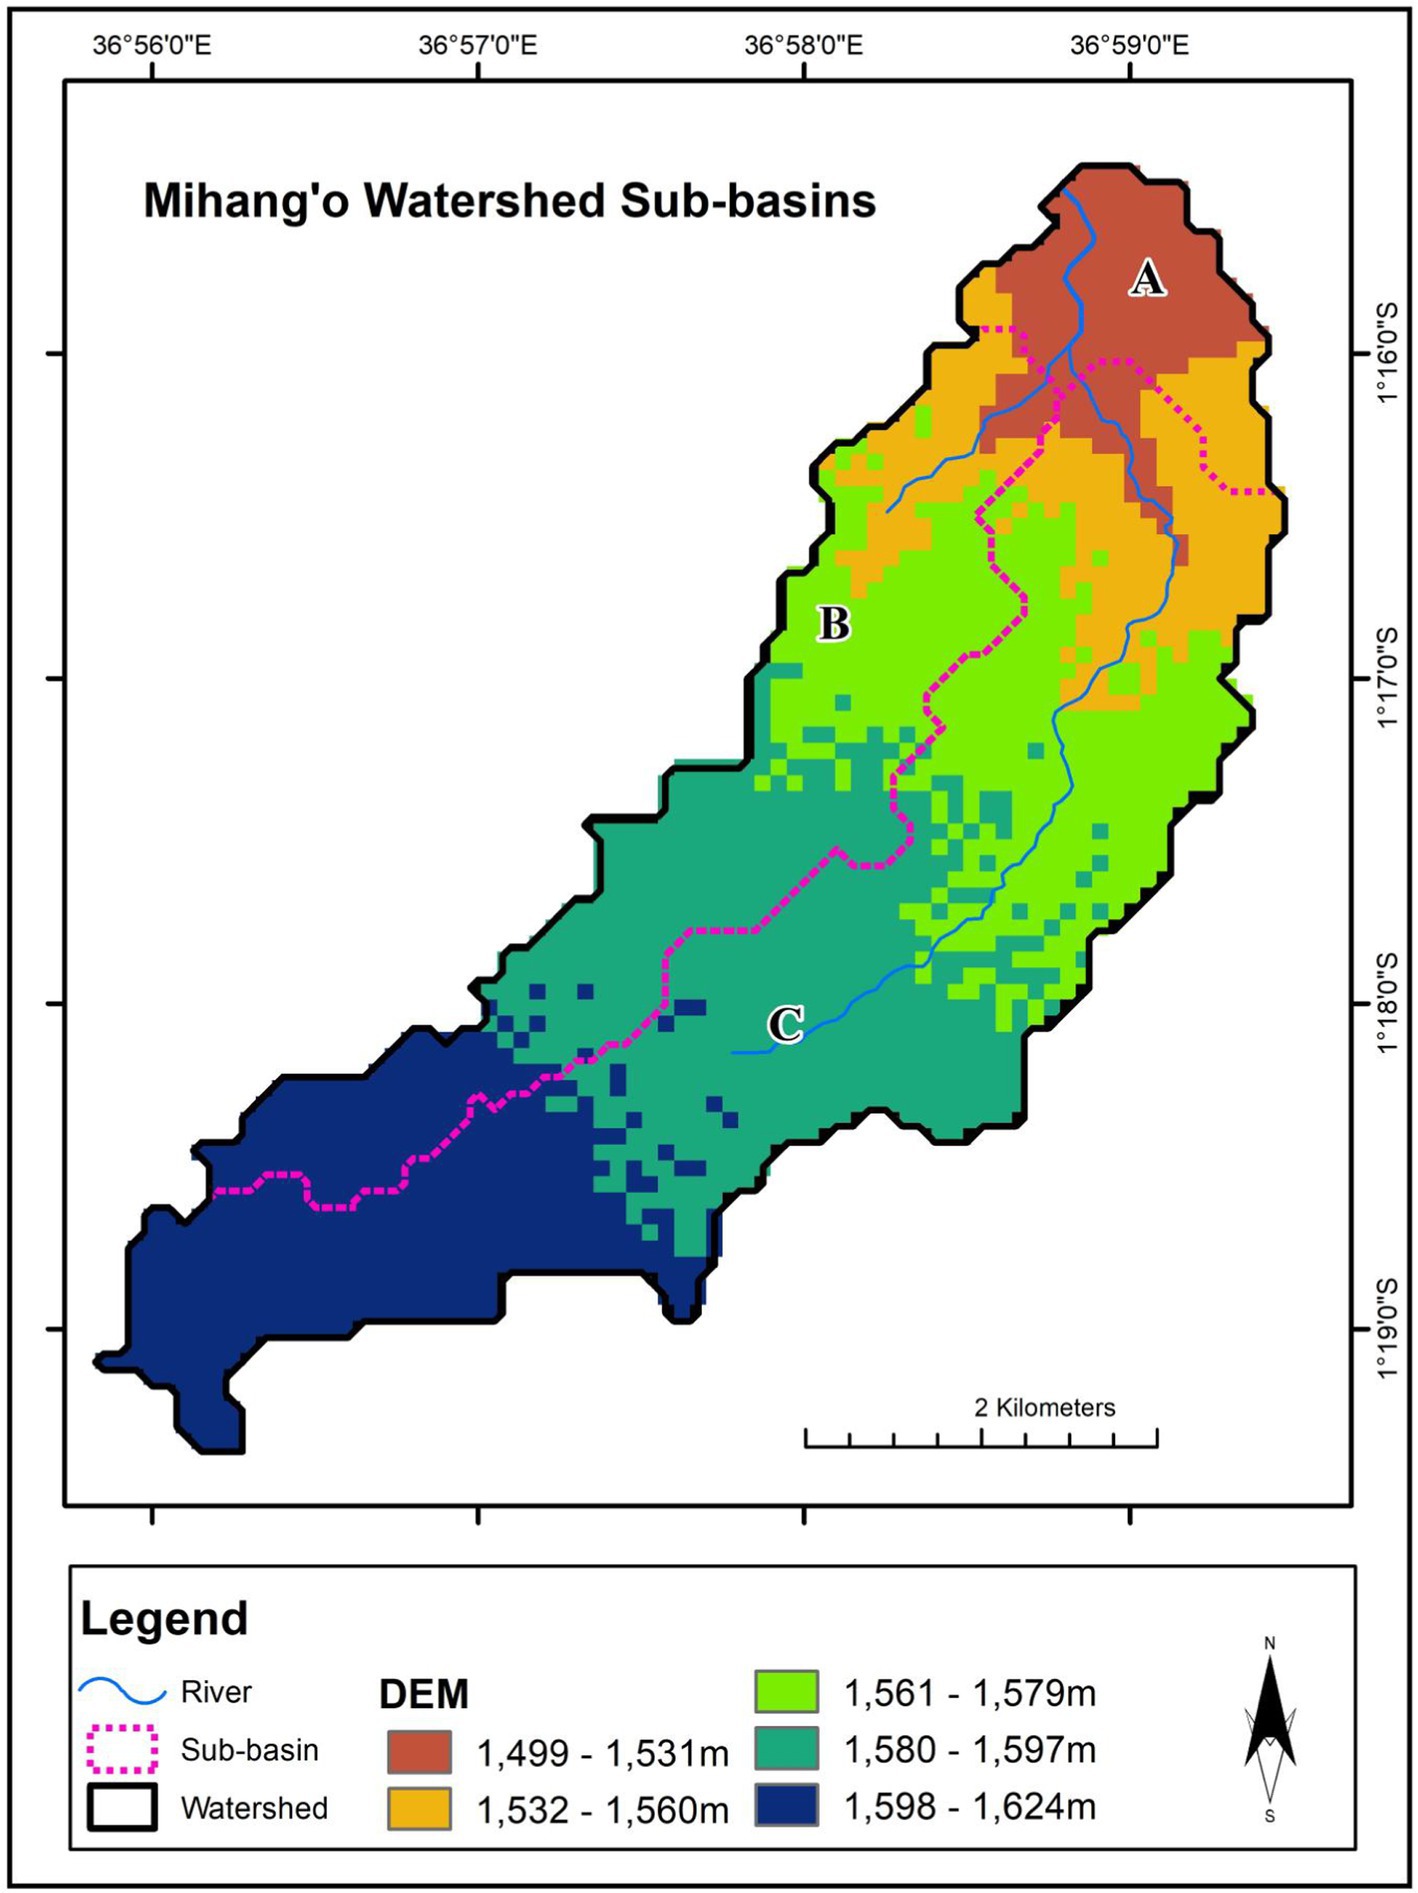
The basin model for Mihang’o watershed was produced using ArcGIS (Figure 2). Figure 2 shows the watershed disintegrated into subbasins based on the steam segments. The figure shows that Mihang’o watershed contains three subbasins labeled A, B, and C. Additionally, Mihang’o watershed has one river junction, one river reach, and one sink at the outlet point. The ArcGIS also produced the sizes of each subbasin. The sizes for subbasins A, B, and C are 2.3 km2, 5.4 km2, and 9.9 km2, respectively. These parameters were replicated in an HEC-HMS project’s watershed model. Figure 3 shows the modeled watershed in HEC-HMS based on the physical parameters.
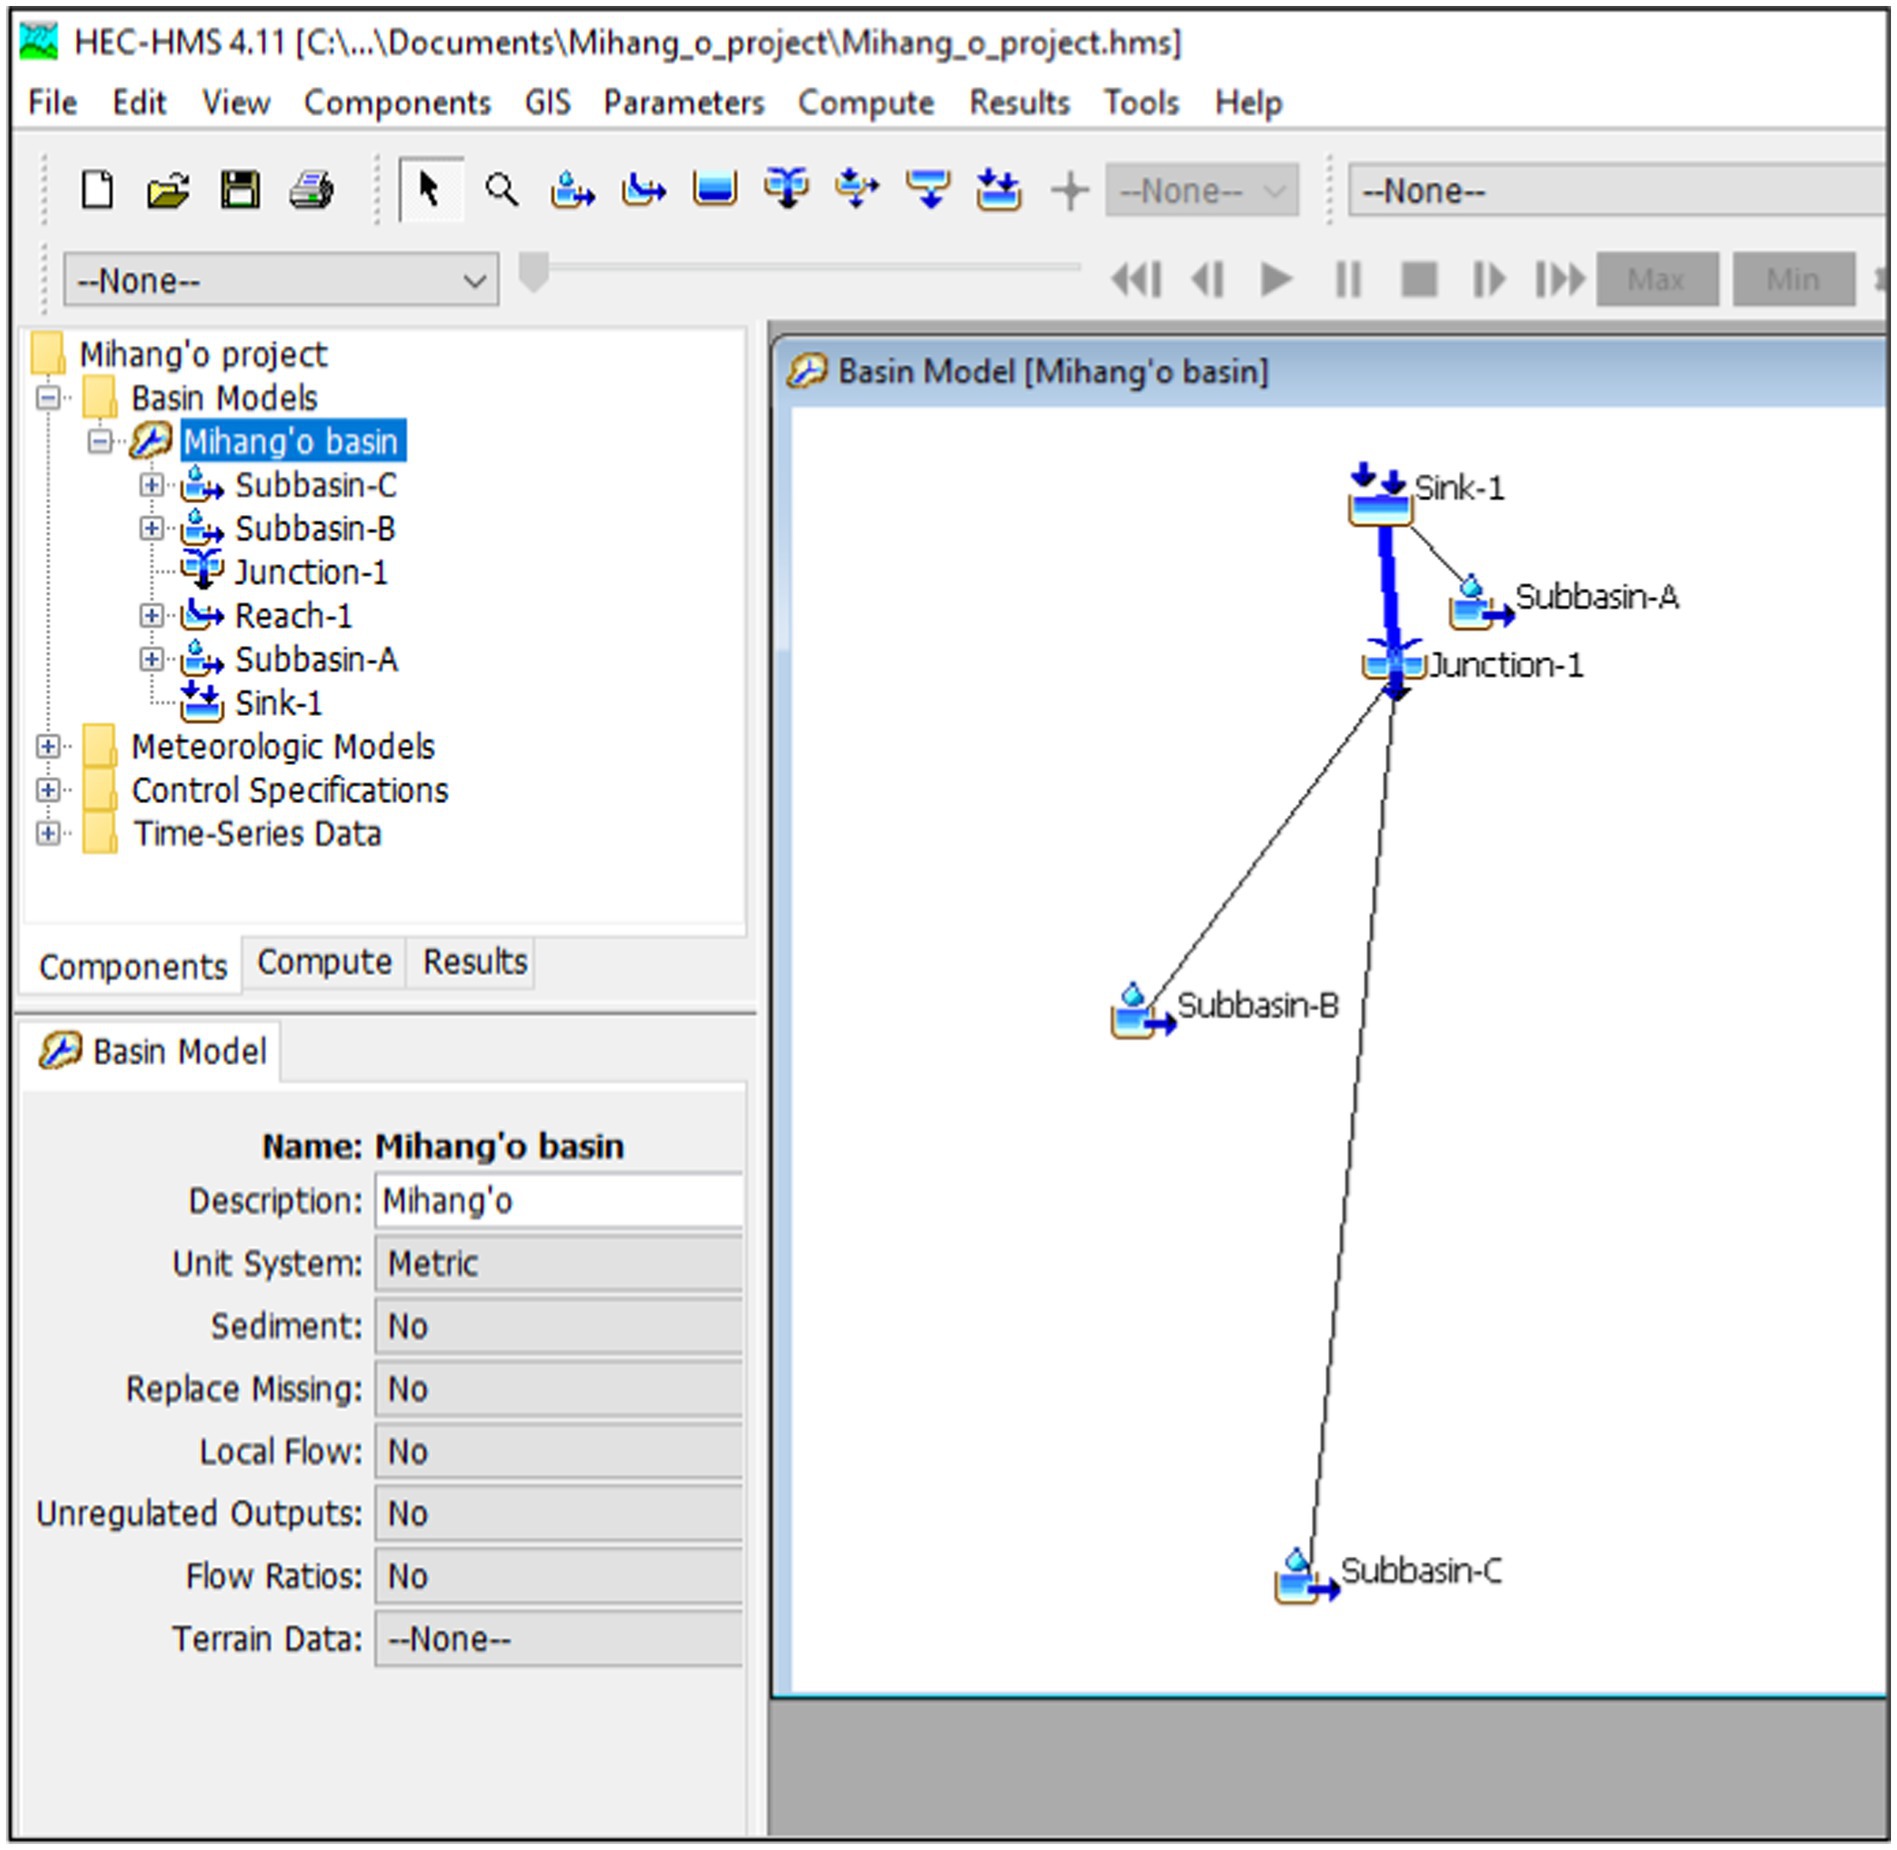
Figure 3. Screenshot of the HEC-HMS interface illustrating the setup of the model structure for Mihang’o Watershed. This schematic network represents the watershed configuration within the HEC-HMS software.
This schematic network of the watershed in Figure 3 is known as the basin model in HEC-HMS terms. The schematic network of the watershed shows that Sink I is downstream of subbasin A and Reach I. Also, Reach I is downstream of Junction I, which is downstream of subbasin B and C. After creating a basin model, HEC-HMS simulation also requires the loss, transform, and routing specifications (Guduru et al., 2023; Yu and Zhang, 2023).
2.2.3.1.2 Loss model
Runoff volume is generally calculated by subtracting the volume of water intercepted, infiltrated, stored, transpired, or evaporated from the precipitation. HEC-HMS has nine loss methods; the soil conservation service curve number (SCS-CN) loss method is commonly used. The advantage of the SCS-CN loss method is that it is a simple conceptual method for estimating the runoff amount from a rainfall event, and it is well supported by primary data (Alshammari et al., 2024; Guduru et al., 2023). The SCS-CN loss approach is solely based on the curve number, which is a function of the key runoff-producing watershed parameters of soil type, LULC, previous moisture content, and impervious surface coefficients (Naresh and Naik, 2023; Yu and Zhang, 2023).
The CN Tables in the HEC-HMS Technical Reference Manual, particularly the Curve Number for Urban Areas table, were referred to when computing CN value for Mihang’o watershed (Civil GEO, 2023; United States Geological Survey, 2023). According to literature, including the Farm Management Handbook of Kenya, soils in Mihang’o watershed are predominantly vertisols (Jaetzold and Schmidt, 1982; Muli, 2008; Muthu and Santhi, 2015; Onyancha et al., 2011). To validate the soil data obtained from the literature, soil samples were collected from five points within the watershed for soil analysis to determine soil texture (Figure 4). The coordinates of these sample points were as follows: 1 (36.9842, −1.2587), 2 (36.9795, −1.2627), 3 (36.9880, −1.2727), 4 (36.9694, −1.2912), and 5 (36.9576, −1.3120).
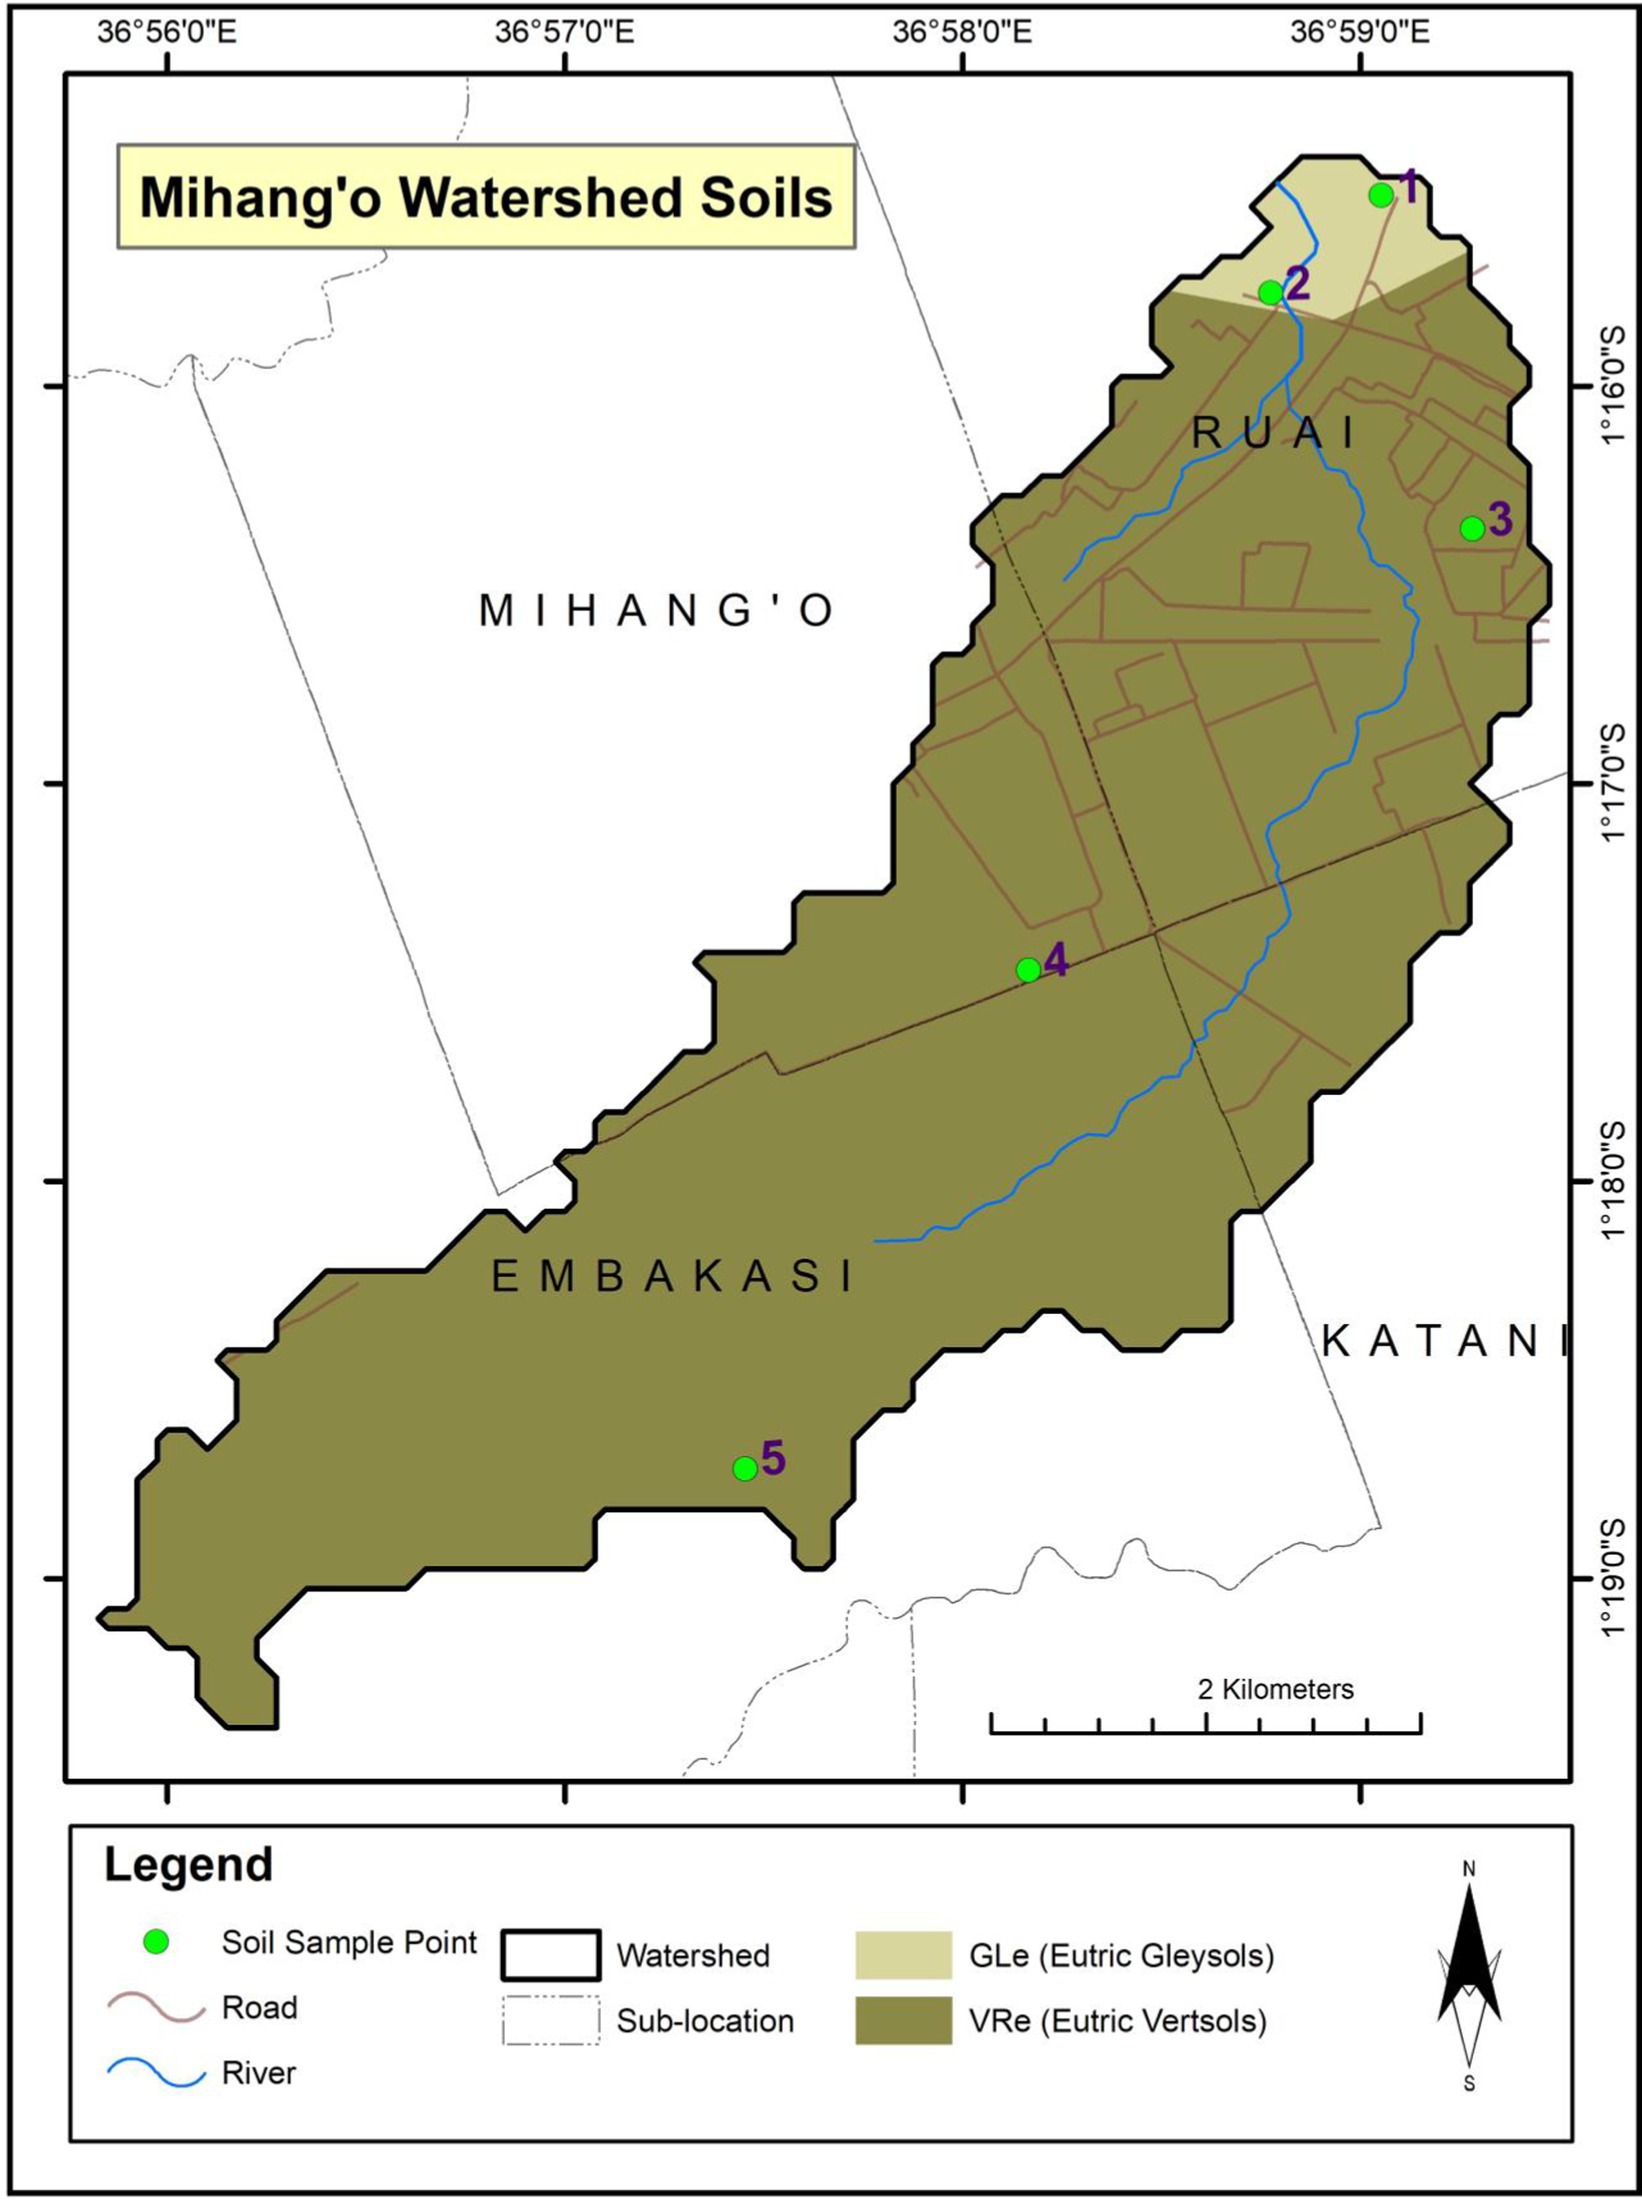
Figure 4. Soil sample points with auxiliary data layers, including roads, rivers, sublocation boundaries (sourced from Esri and the Humanitarian Data Exchange), and soil data from Distributed Active Archive Centers’ (DAAC’s) Global Hydrologic Soil Groups (HYSOGs) for Mihang’o Watershed, Kenya.
Consistent with the reviewed literature (Akech et al., 2013; Muli, 2008; Muthu and Santhi, 2015; Onyancha et al., 2011), only a small section of the watershed was found to contain gleysols, and the rest of the watershed contains vertisols. Soil samples at points 1 and 2 portrayed a wide range of unconsolidated materials, basically fluvial, with basic to acidic mineralogy, which are typical characteristics of eutric gleysols (Akech et al., 2013). Soils at sample points 3, 4, and 5 were a mixture of sediments from weathering rocks and gravelly clay material, which are typical features of eutric vertisols (Akech et al., 2013). Therefore, based on the United States Department of Agriculture (USDA)-SCS soil classification and NASA’s Distributed Active Archive Centers (DAACs) Global Hydrologic Soil Groups (HYSOGs250m) for Curve Number (Ross et al., 2018), Mihang’o watershed is predominantly Group D hydrological soil (Muthu and Santhi, 2015). Group D soils have high runoff potential and lowest permeability below 1.3 mm/h.
Regarding LU/LC, Mihang’o watershed transformed from a shrubland to a developing urban area. Literature evidence shows that the watershed has a mixture of land uses representing a developing urban watershed. Furthermore, Google Earth satellite image analysis and ground truthing confirmed that Mihang’o watershed encompasses residential units, commercial businesses, small industries, hotels, churches, schools, playgrounds, administrative centers, bus stations, kiosks, pubs, workshops, gas stations, and garages. Therefore, the impervious surfaces in Mihang’o watershed include paved parking lots, driveways, and roofs. There are tarmacked streets and roads, which have paved curbs and storm sewers and open ditches. There are also gravel and dirt roads in the watershed.
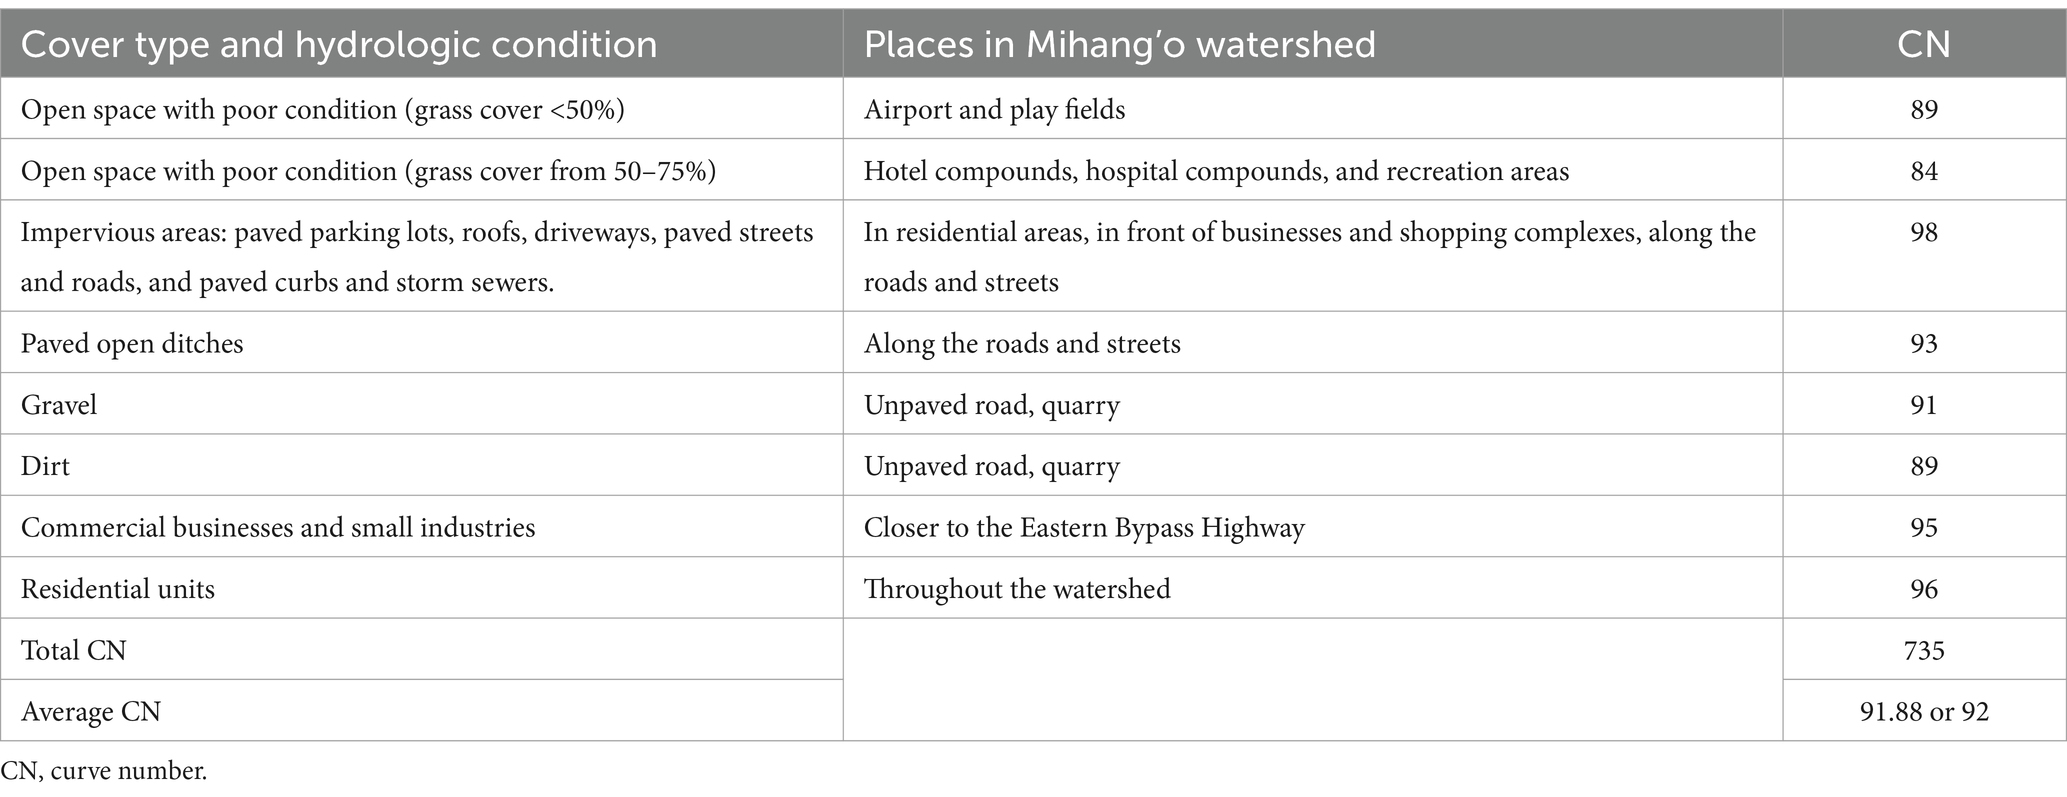
Because Mihang’o watershed has Group D soils but diverse land uses, several CNs for Group D soils were picked from the CivilGEO’s Table of Curve Number for Urban Areas (Civil GEO, 2023). Importantly, the CN for residential units was computed based on CivilGEO’s theory: To determine CN when all or part of the impervious area is not directly connected to the drainage system, a supplement matrix should be used if the total impervious area is equal to or greater than 30%percent because the absorptive capacity of the remaining pervious areas will not significantly affect runoff (Civil GEO, 2023). This approach was adopted because residential units in Mihang’o watershed are generally one-eighth of an acre, and in most cases, buildings occupy the entire plot. This translated to composite CN of 96 for residential units in Mihang’o watershed. Consequently, the average CN was 92, which was used in this study. Table 1 presents the computation results of CN for Mihang’o Watershed.
Besides the CN value, the SCS-CN loss model also requires impervious surface coefficients as an input. The impervious surface percentage for each year of study served as the impervious surface coefficient. The percentages for impervious surface area were used as the impervious surface coefficients.
2.2.3.1.3 Transform model
The HEC-HMS transform models simulate the transformation of excess precipitation to runoff in the watershed (Alshammari et al., 2024). There are seven transform models in HEC-HMS; the soil conservation service unit hydrograph (SCS-UH) model is one of them (Namwade et al., 2023). The only input for this method is the lag time (Tlag) (Yu and Zhang, 2023), thus making SCS-UH suitable for use in this small-scale study. Lag time is the time between the peak amount of rainfall and the peak discharge in the river and is calculated based on the time of concentration Tc, as shown in Equation 1 (Yu and Zhang, 2023).
The concentration time is estimated based on the basin’s characteristics, including the length of reach and topography, using Kirpich’s formula, as shown in Equation 2 (Yu and Zhang, 2023).
Where S is the slope (in ft/ft) and L is the reach length (in ft).
The slope length (S) and reach length (L) of each subbasin were retrieved from the ArcGIS’ results of basin physical parameters. Lag time (Tlag) and time of concentration (Tc) were calculated using Equation 1 and Equation 2. Table 2 summarizes the slope and tributary reach; the computed concentration time; and the lag time for each subbasin.
2.2.3.1.4 Routing model
Flood runoff attenuates while passing along the channel reach because of channel storage effects. This attenuation is accounted for by the routing models offered in HEC-HMS. The Muskingum method is a popular lumped flow routing technique that has been widely employed in river engineering since its creation (Yu and Zhang, 2023). The Muskingum routing approach approximates the downstream outflow hydrograph from the upstream input hydrograph of a channel reach (Yu and Zhang, 2023). Two parameters are required for this model calibration: the flood wave’s travel duration (K) through the routing reach and dimensionless weight (X), which corresponds to the flood wave’s attenuation as it goes through the reach (Yu and Zhang, 2023).
The approximation of inputs, including the flood wave’s travel duration (K) through the routing reach and dimensionless weight (X) were based on the previous studies. According to Yu and Zhang (2023), X = 0.5 indicates a full wedge, X = 0 indicates no wedge, such as a level pool reservoir, and X values for natural streams are between 0 and 0.3, with a mean of 0.2. However, studies have shown that X’s value does not matter much in the output (Baláž et al., 2010). Therefore, X = 0.2 was picked for this study. Because the reach is short (4101.05 ft) and joins a main tributary downstream, K was approximated as 0.5 based on the University of Colorado Boulder workings (Baláž et al., 2010).
2.2.3.1.5 Precipitation data
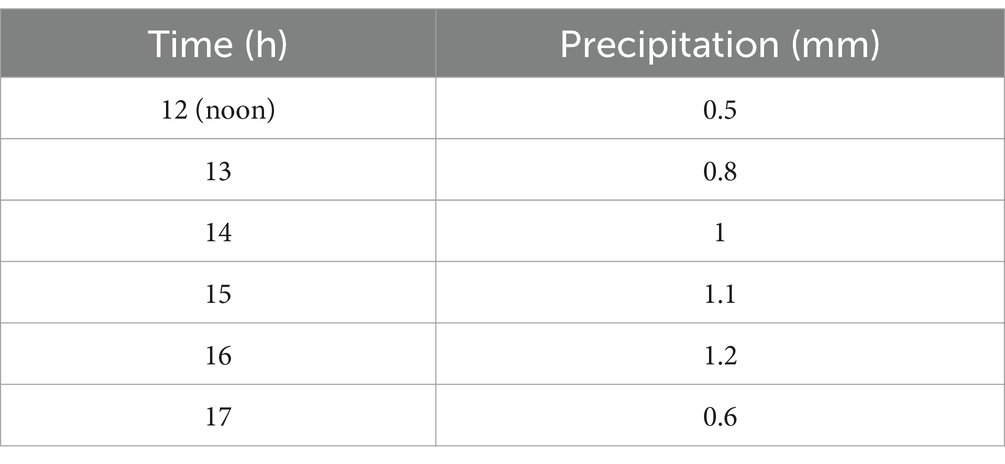
The single rainfall event used in this study was on 29 December 2022 between 12 noon and 6 pm (Table 3). The single rainfall event was tested against various impervious surface percentages to determine runoff trends. The precipitation data for the rainfall event were put in the time series file. The specified hyetograph method enabled specifying the precise time series for the hyetograph at subbasins (Naresh and Naik, 2023). The meteorologic model was used to set meteorologic boundary conditions for the subbasins. The control specifications file controlled a simulations’s start and stop time and time interval (Naresh and Naik, 2023).
Table 4 summarizes HEC-HMS calibration to simulate runoff from Mihang’o watershed. The table highlights the required input parameters and selected models and their respective input data. Other input data remaining constant, an HEC-HMS simulation produced peak discharge values for each paired data of impervious surface coefficient and rainfall. The flow chart in Figure 5 summarizes the methodology followed in this study. The flow chart shows that Objective 3 is dependent on input data from Objectives 1 and 2.
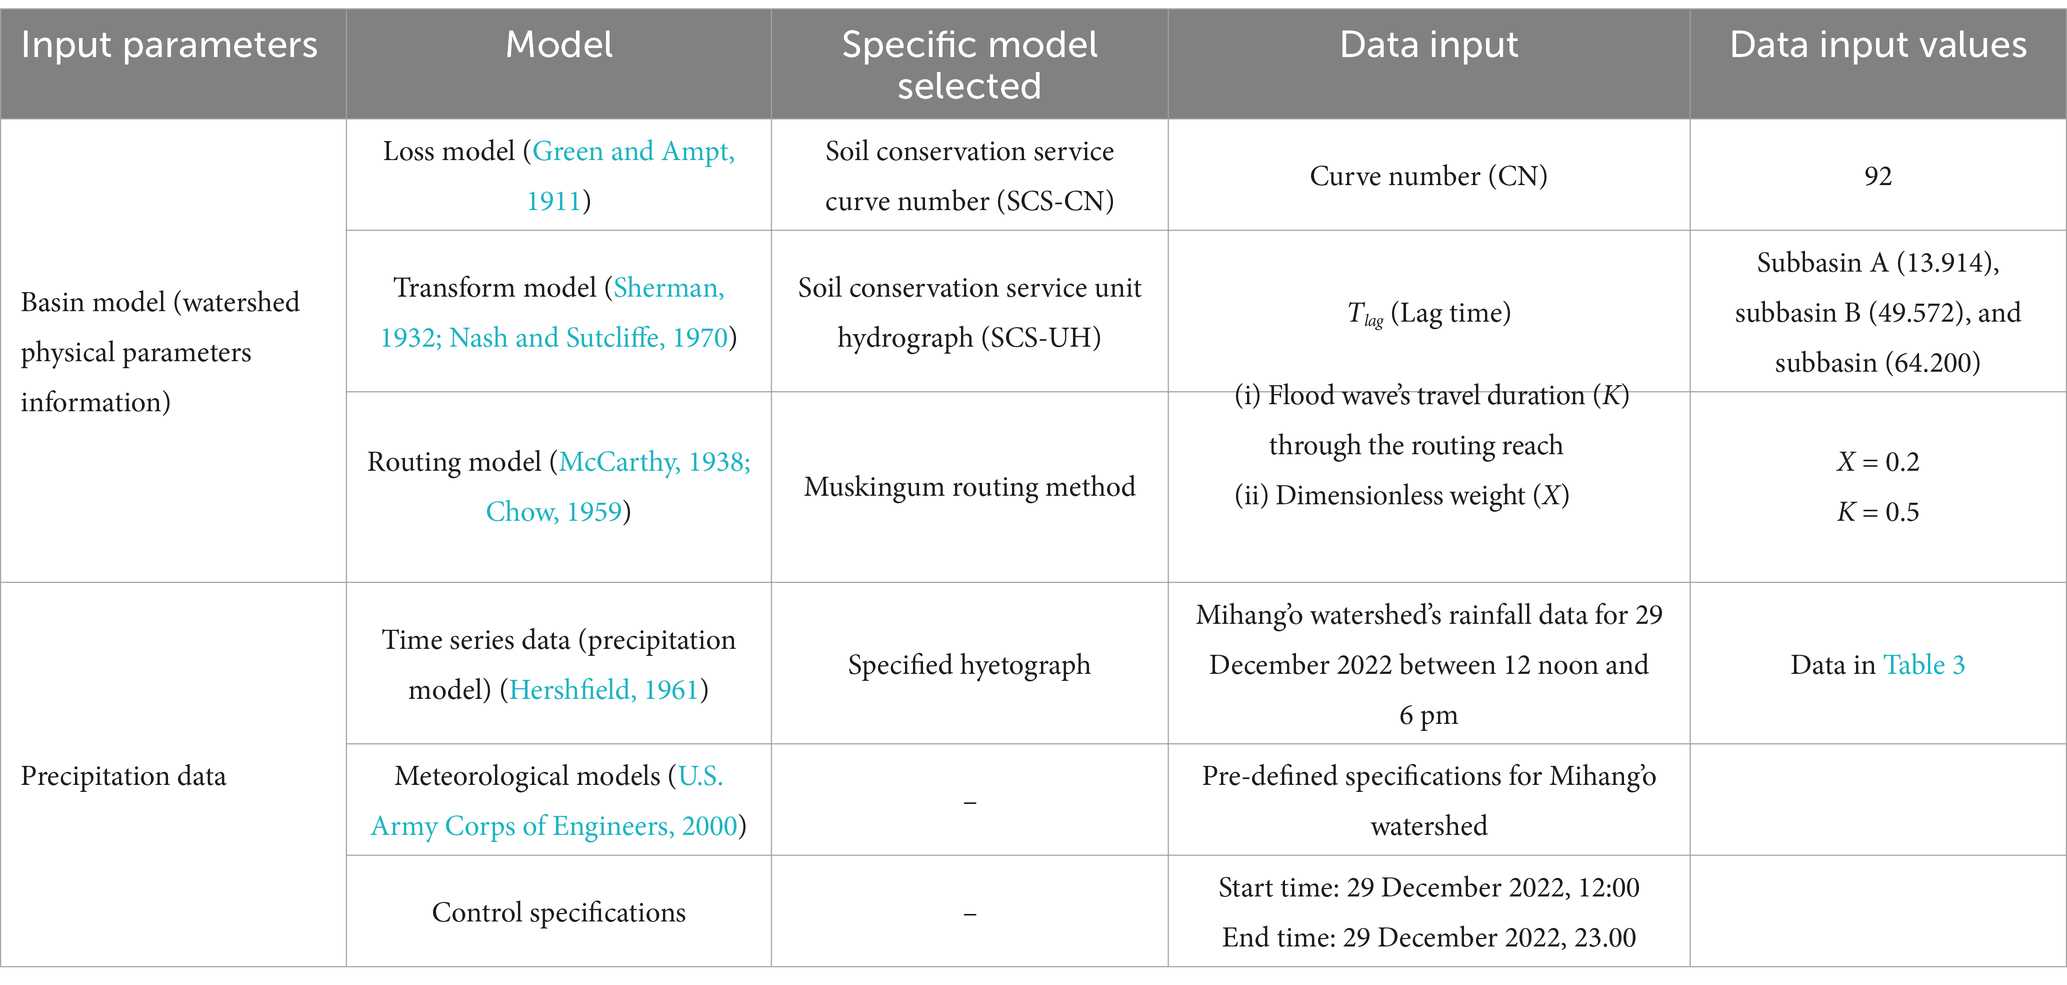
Table 4. Hydrologic Engineering Center’s Hydrologic Modeling System (HEC-HMS) model watershed physical parameterization and input data for the study.
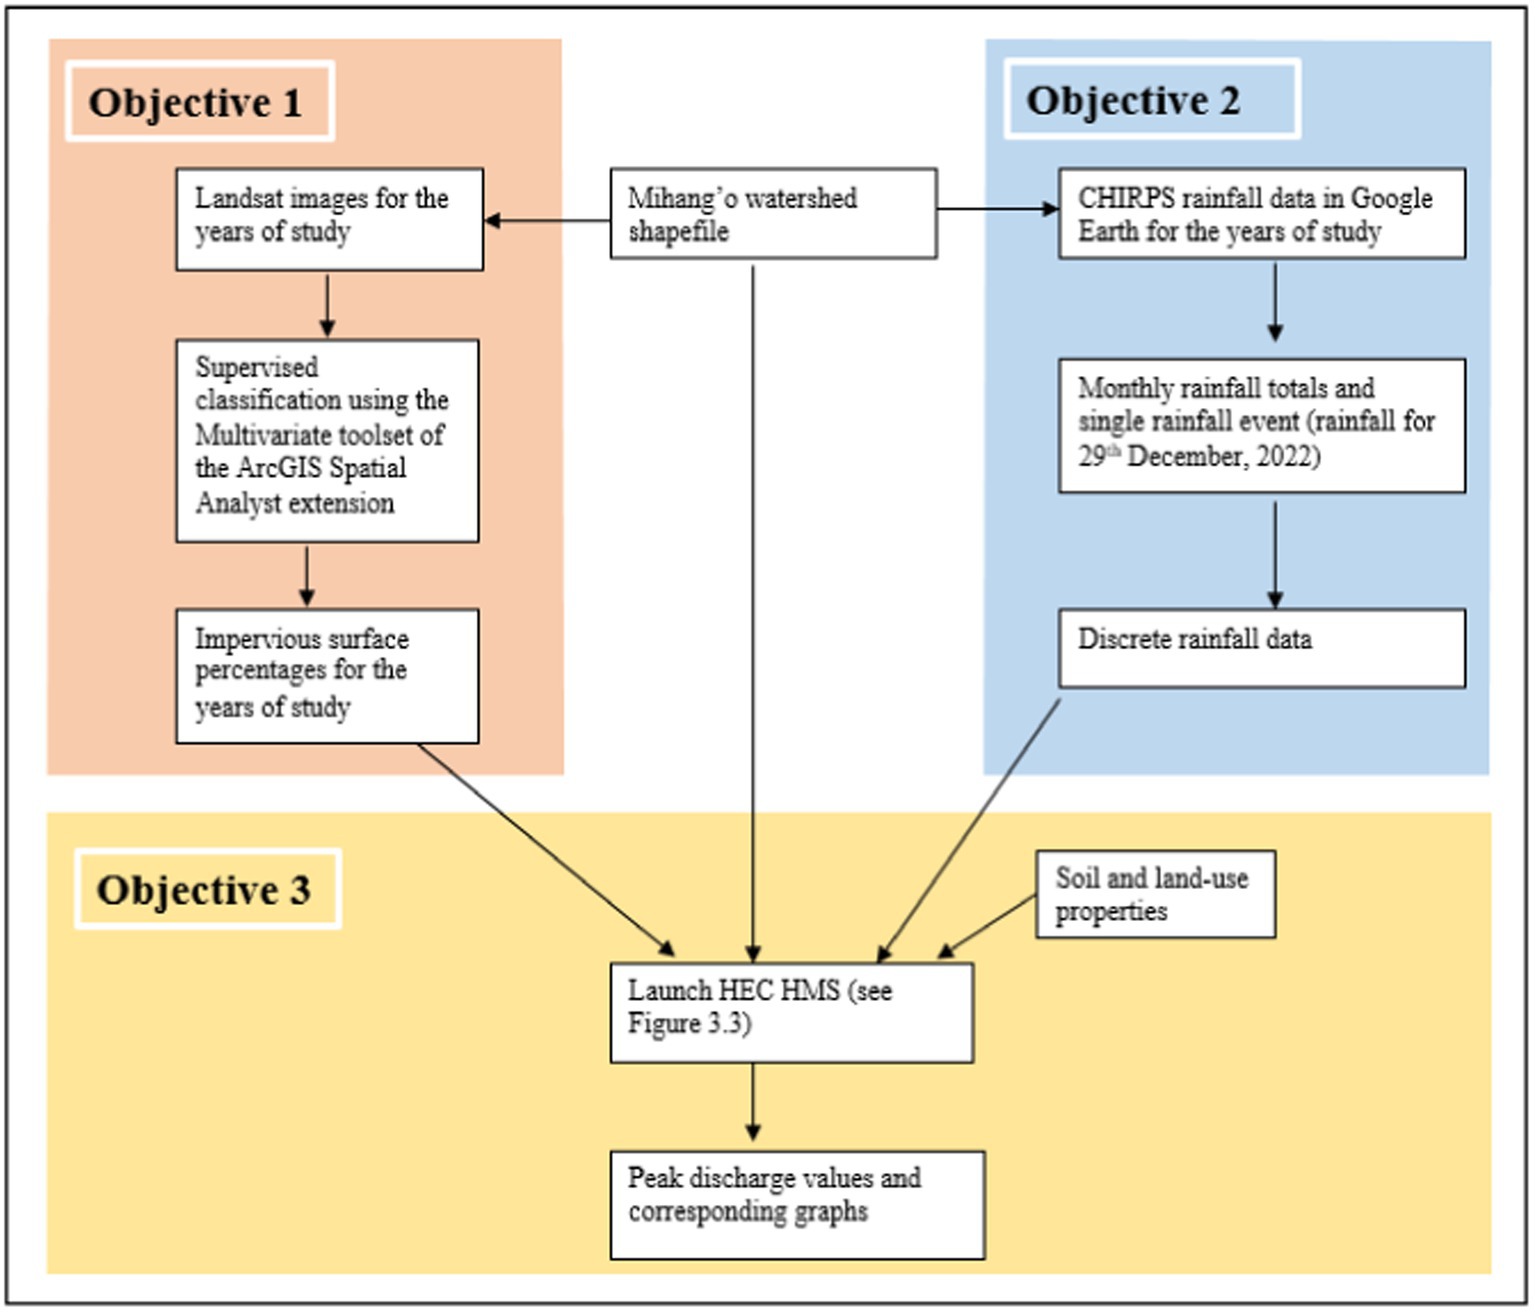
Figure 5. Methodology flow chart summarizing study approach. This flow chart illustrates the sequential methodology, showing that Objective 3 depends on input data from Objective 1 (image classification) and Objective 2 (meteorological data processing).
3 Results
3.1 Impervious surface area trend of Mihang’o watershed
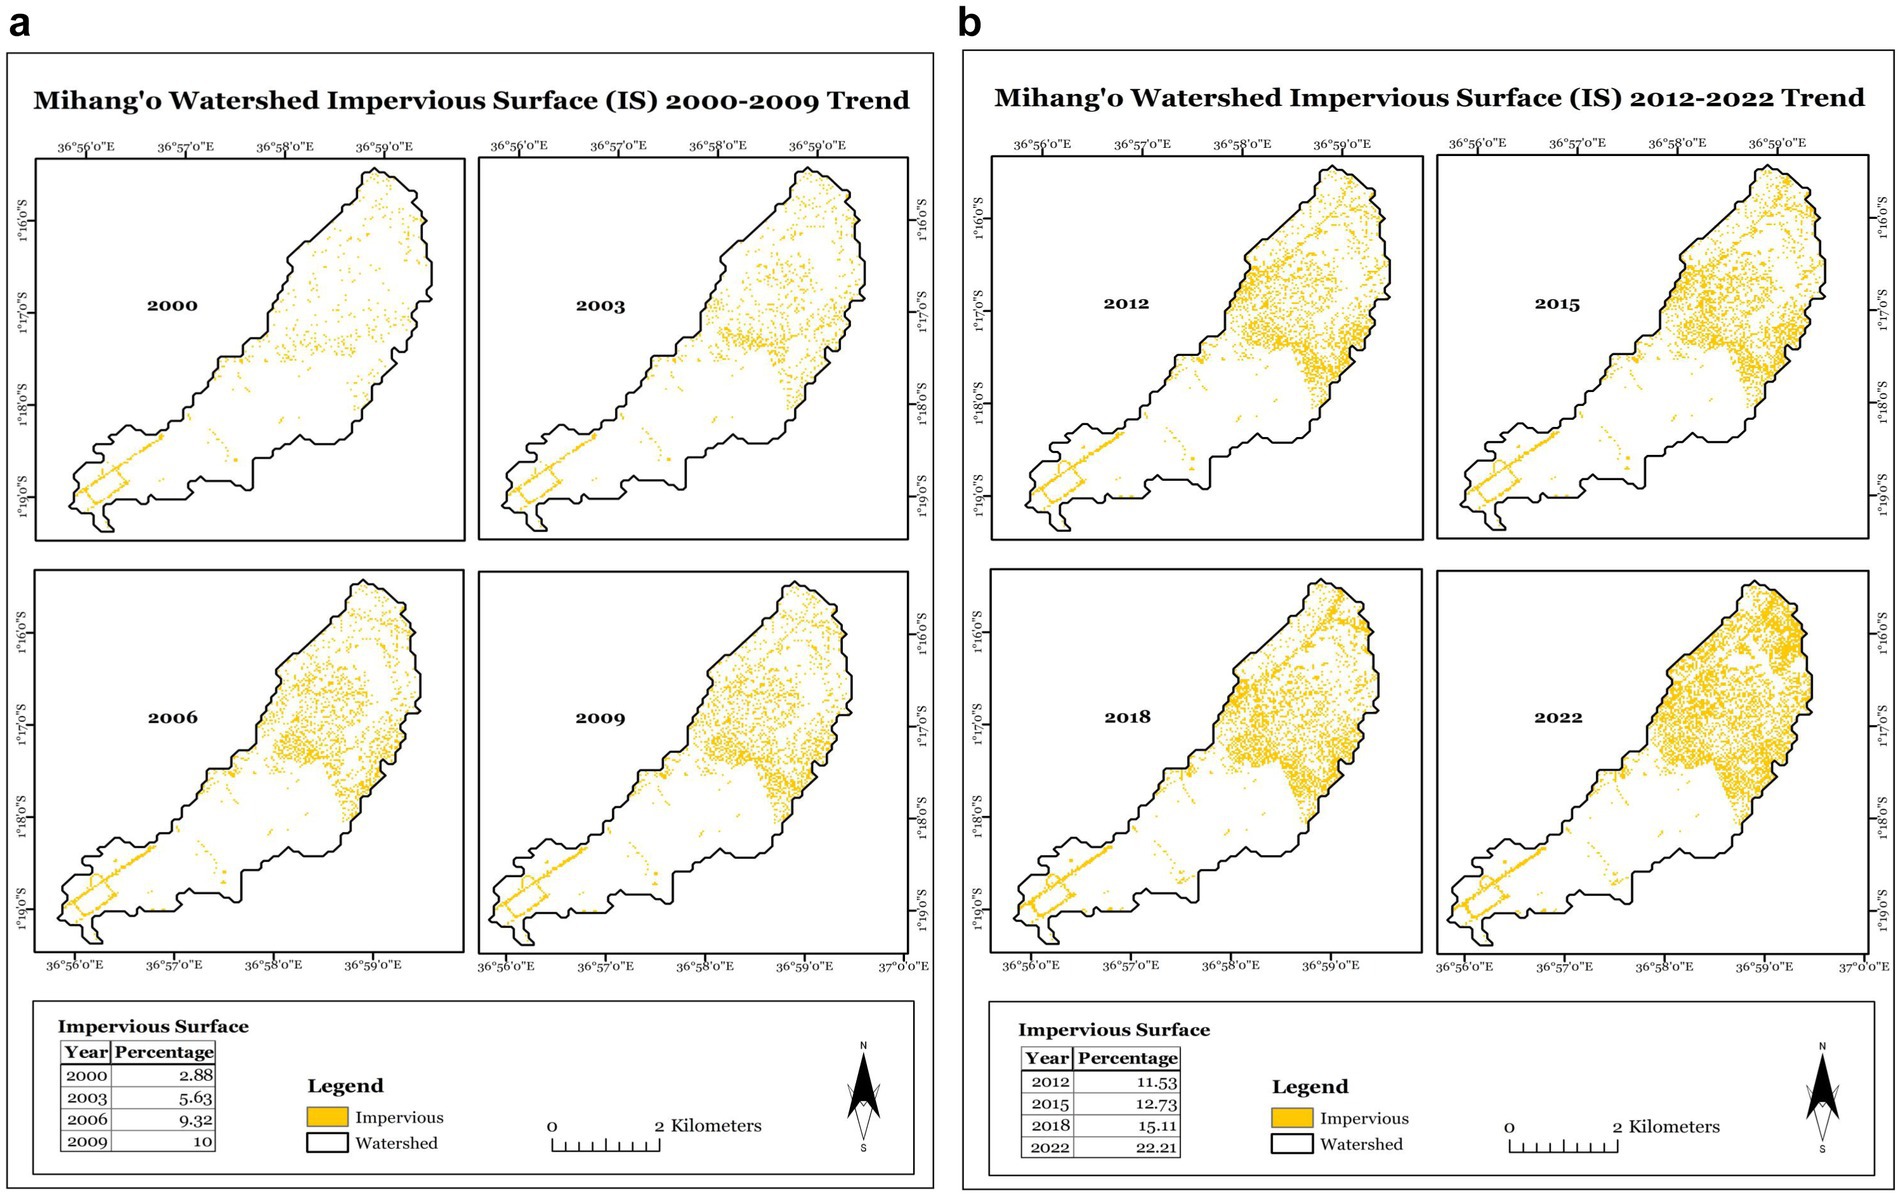
Figures 6a,b displays the distribution of impervious surfaces in Mihang’o watershed in the period 2000–2022. Figure 7 displays the results of data quality control that entailed counterchecking the resultant image of 2022’s supervised classification of Mihang’o watershed against 2022’s Google Earth satellite image and ground truthing. The figure shows the significant features in Mihang’o watershed, including features that influence urban growth, such as the roads, trading centers, learning institutions, and healthcare facilities, among others. Figure 6a shows an increasing trend of urbanization otherwise expansion of impervious surfaces around the roads, trading centers, learning institutions, and healthcare facilities in Mihang’o watershed.
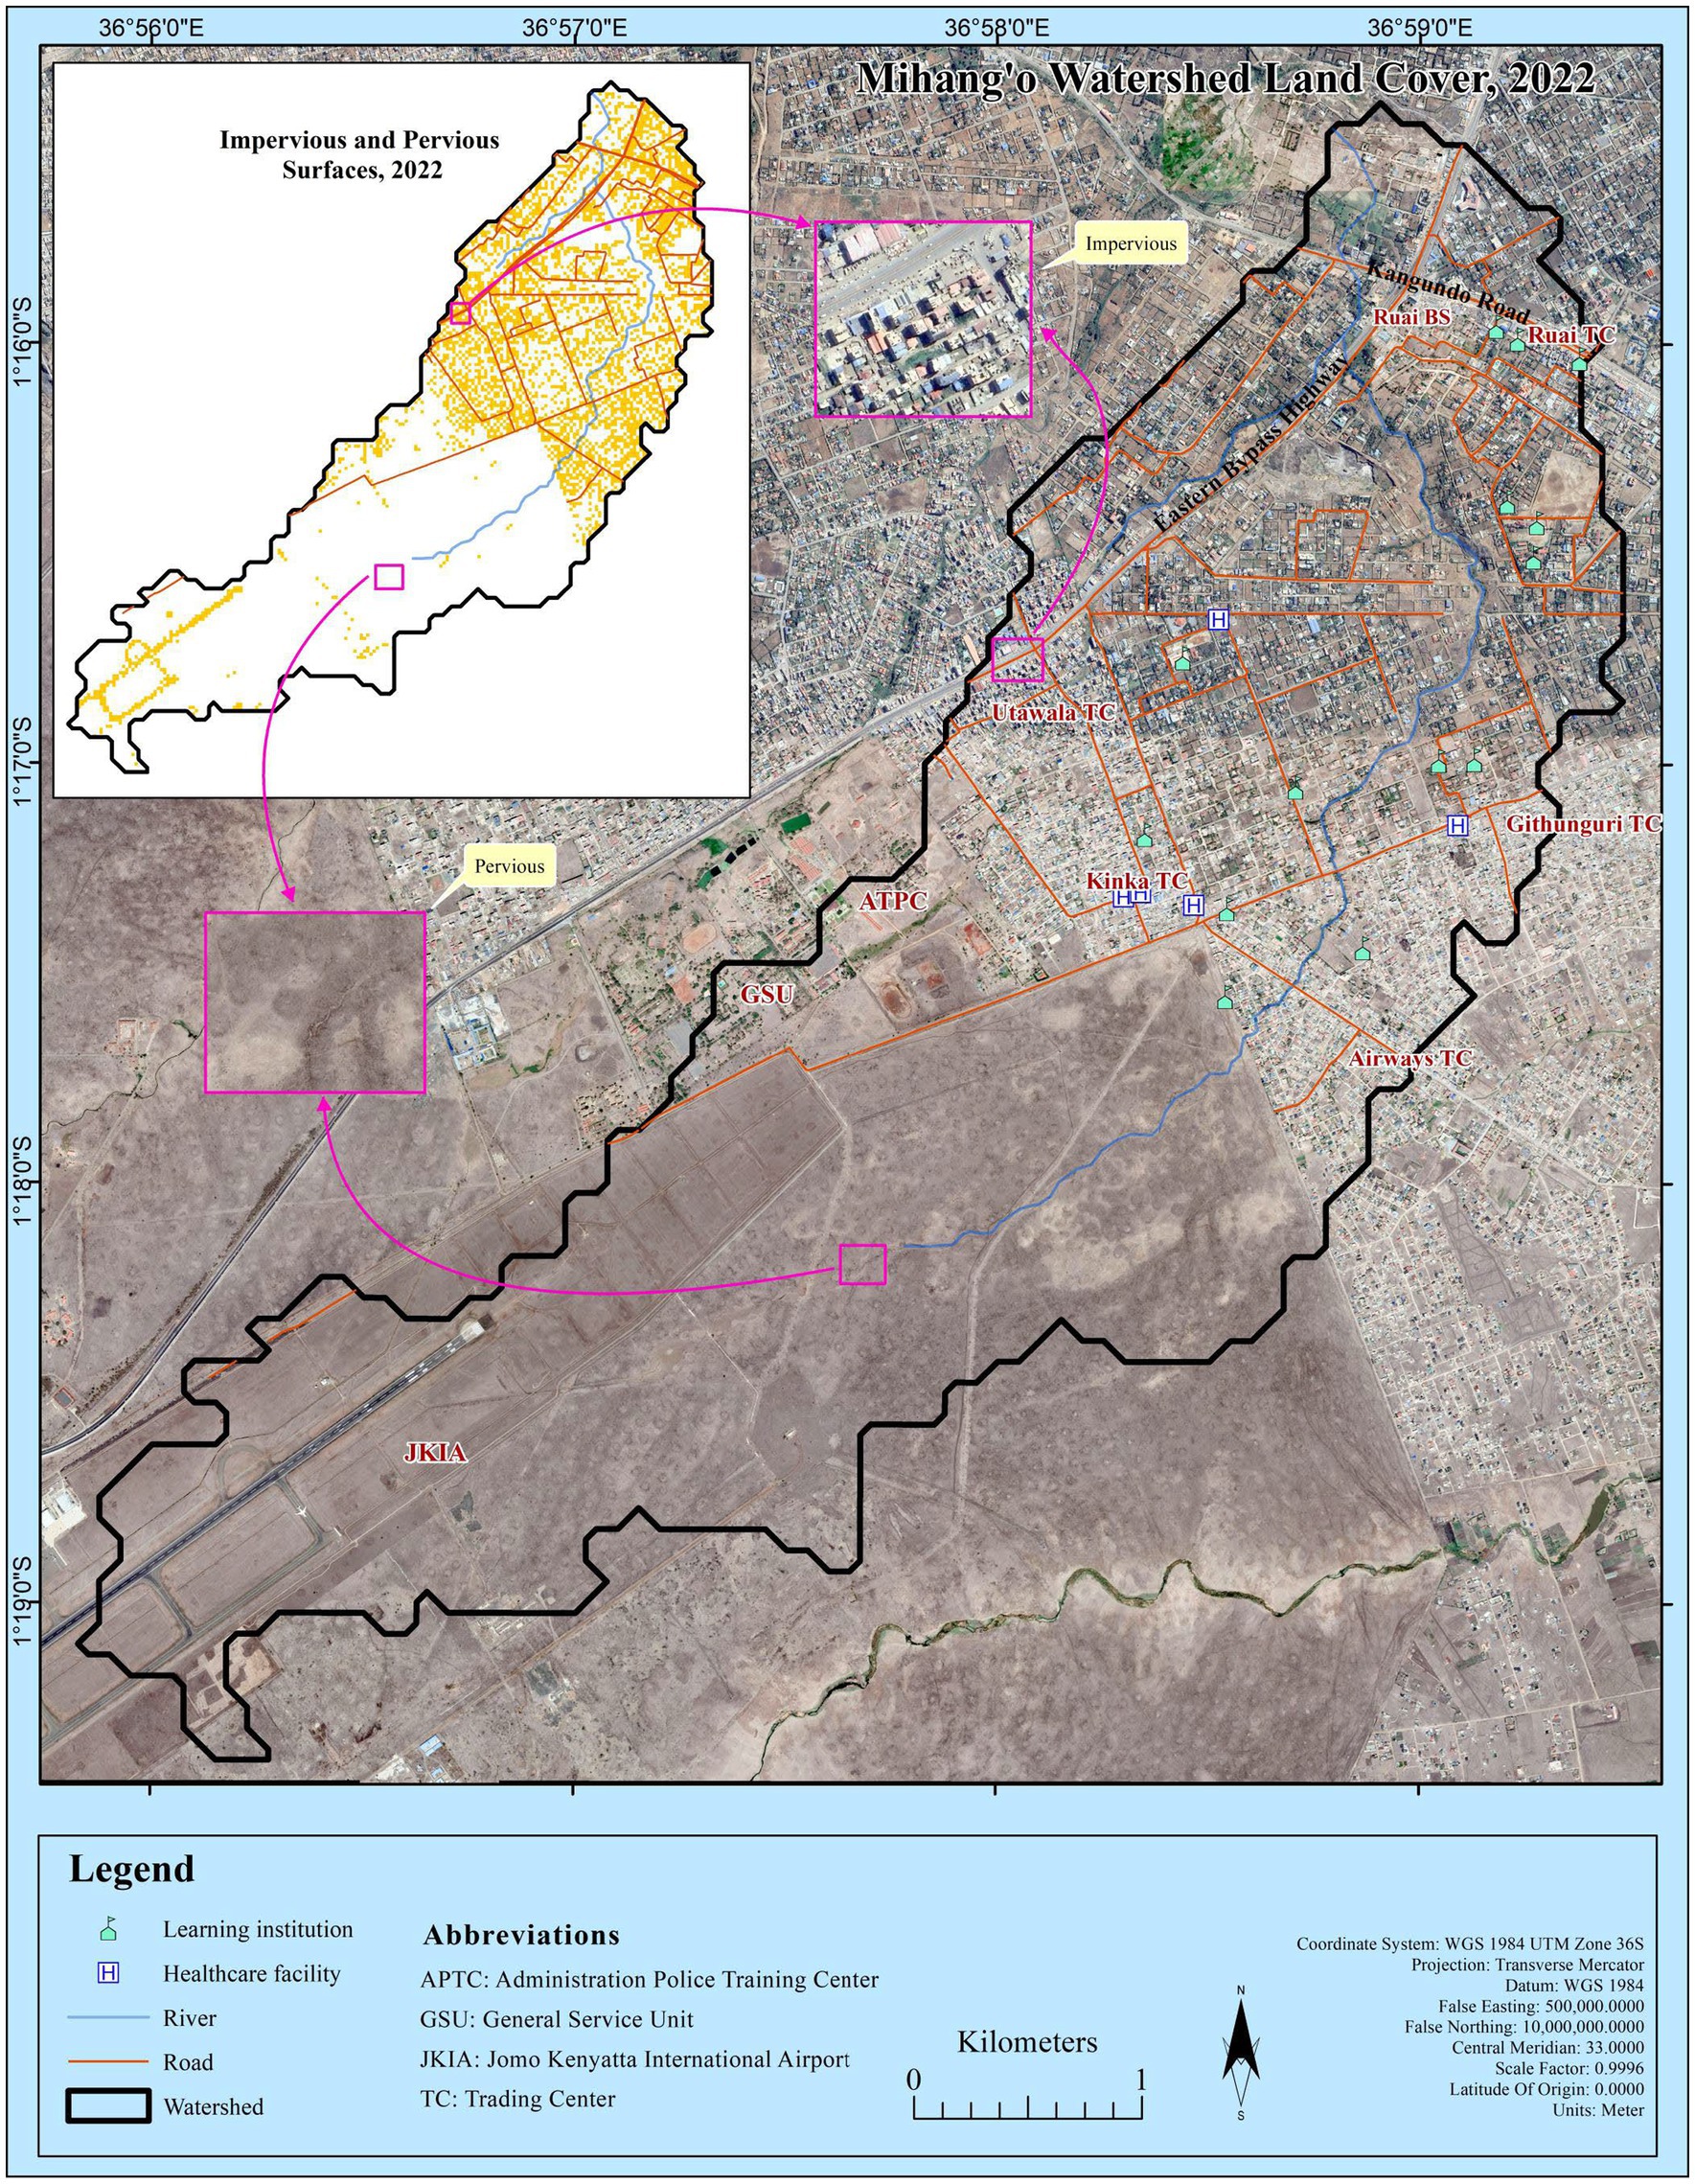
Figure 7. Mihang’o watershed land cover and supervised classification image for 2022. Areas predominantly covered by Earth at the general service unit (GSU) camp are highlighted in pink, indicating pervious surfaces, while built-up areas represent impervious surfaces. The imagery used includes Landsat data and images from Google Earth for 2022.
Besides displaying maps, supervised classification using ArcGIS also quantifies the area covered by impervious surfaces in a watershed. Table 5 shows the area (km2) of impervious surface in Mihang’o watershed across the years of study. Consequently, using the data of the area of impervious surface, the percentage of the area of impervious surface for each year of study was calculated as in Equation 3. Table 5 also displays the corresponding impervious surface percentages for each year of study.
3.2 Precipitation trend of Mihang’o watershed
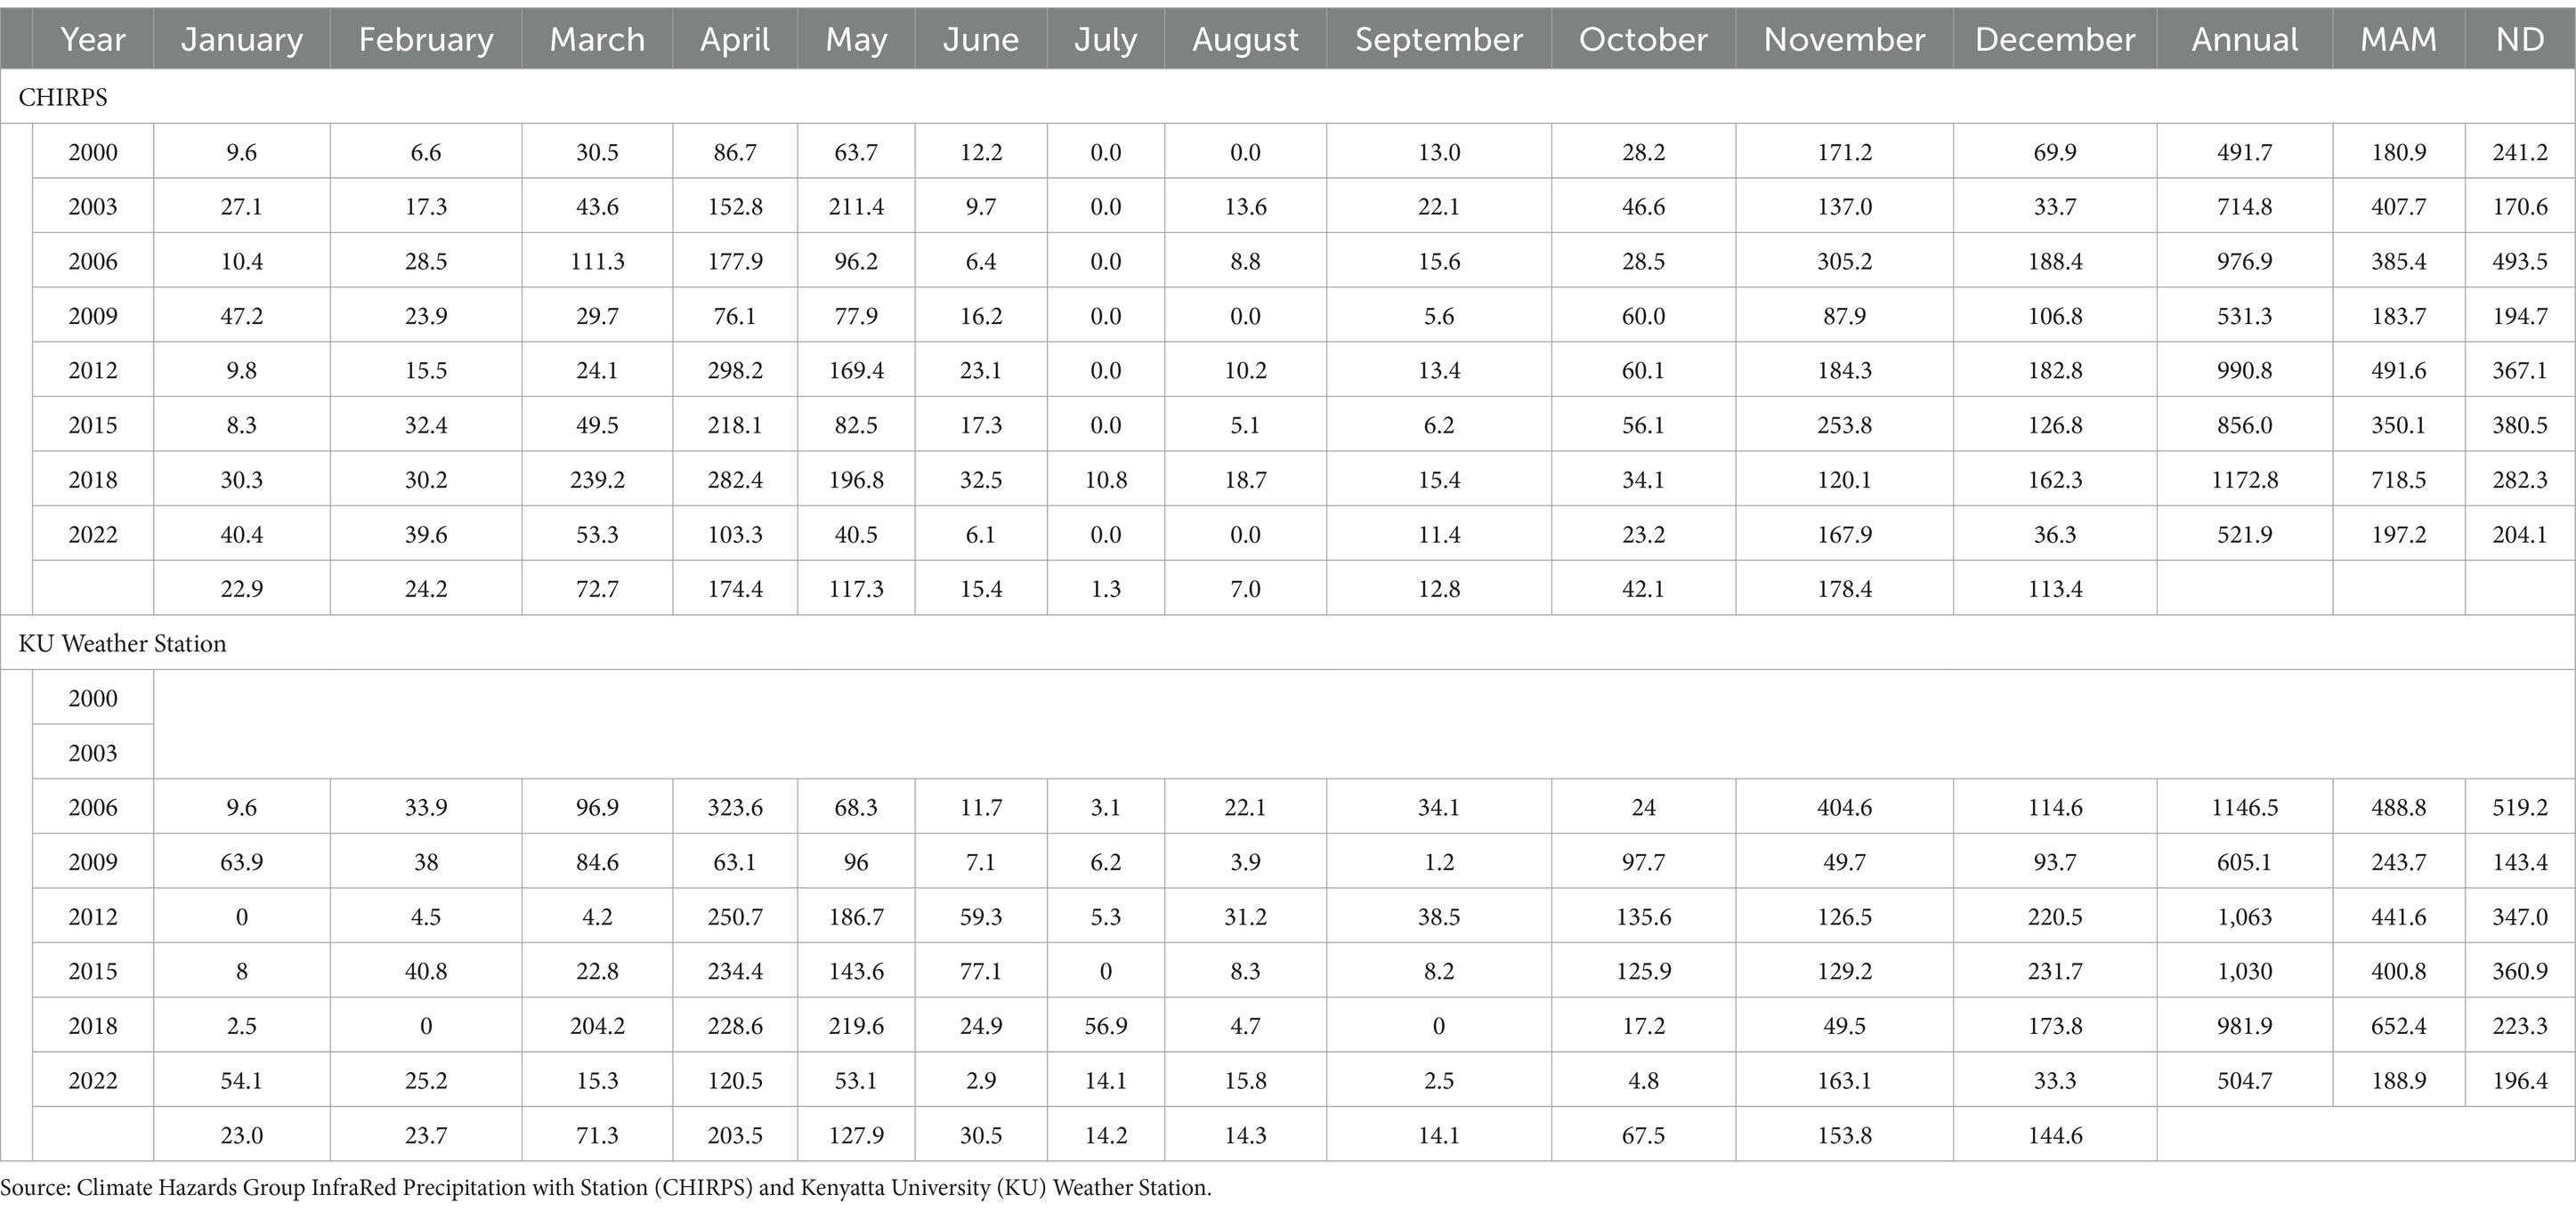
Daily rainfall data for Mihang’o watershed from 2000 to 2022 included 3,277 counts. The rainfall was processed into monthly and annual rainfall for the years of study. Kenyatta University (KU) Weather Station provided rainfall data for post–2005; therefore, prior years were left blank in the analysis (Table 6). Figures 8a,b is the graph displaying rainfall analysis for Mihang’o watershed derived from CHIRPS and KU Weather Station. Figure 8a displays annual rainfall data and Figure 8b displays the average rainfall. The rainfall analysis shows that data points for both CHIRPS and KU Weather Station are flowing consistently and close to each other. Therefore, the CHIRPS data collected were accurate and reliable for use in data analysis and interpretation. The mass curve analysis for annual rainfall for Mihang’o watershed showed a strong positive coefficient of determination (0.9 < R2 < 1), which reinforces the reliability of that data.
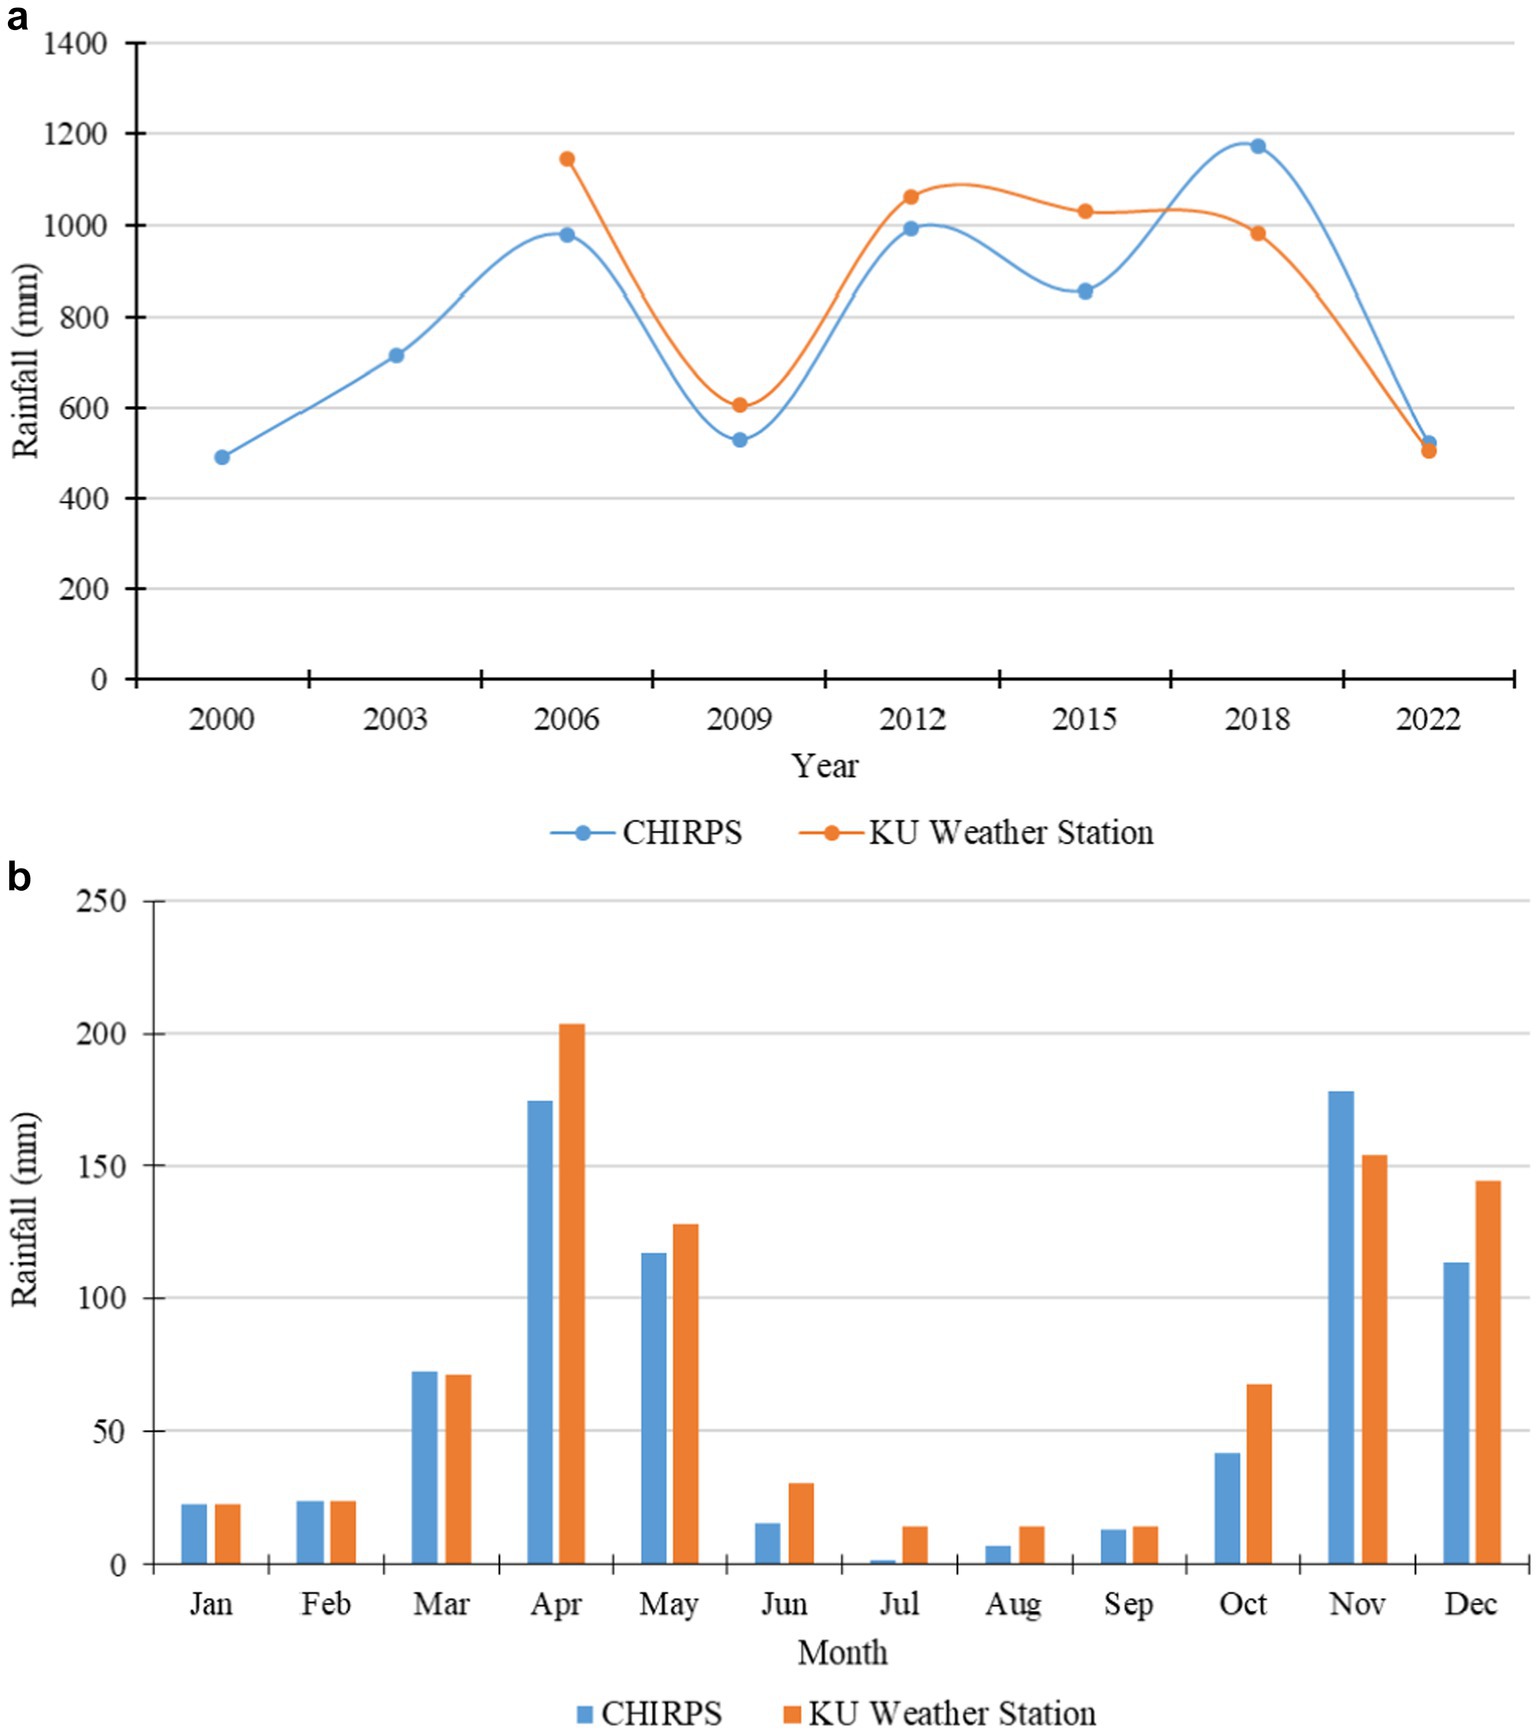
Figure 8. (A) Timeseries of annual rainfall from Kenyatta University (KU) Weather Station (2005–2022) and Climate Hazards Group InfraRed Precipitation with Station (CHIRPS) Satellite Data (2000–2022) (source: CHIRPS and KU Weather Station). (B) Histogram of average monthly rainfall from CHIRPS (2000–2022) and Kenyatta University Weather Station (2005–2022), illustrating the bimodal rainfall pattern with peaks during the March–May and October–December rainy seasons (source: CHIRPS and KU Weather Station).
Based on CHIRPS data, Mihang’o watershed received the highest rainfall amount in 2018, which totaled 1172.8 mm. The least rainfall was received in 2000, totaling 491.7 mm. The data indicate that Mihang’o’s average annual rainfall is approximately 779 mm. Figure 8b shows the two peak rainy seasons: long rains (MAM) and short rains (ND).
3.3 Runoff amount trend of Mihang’o watershed
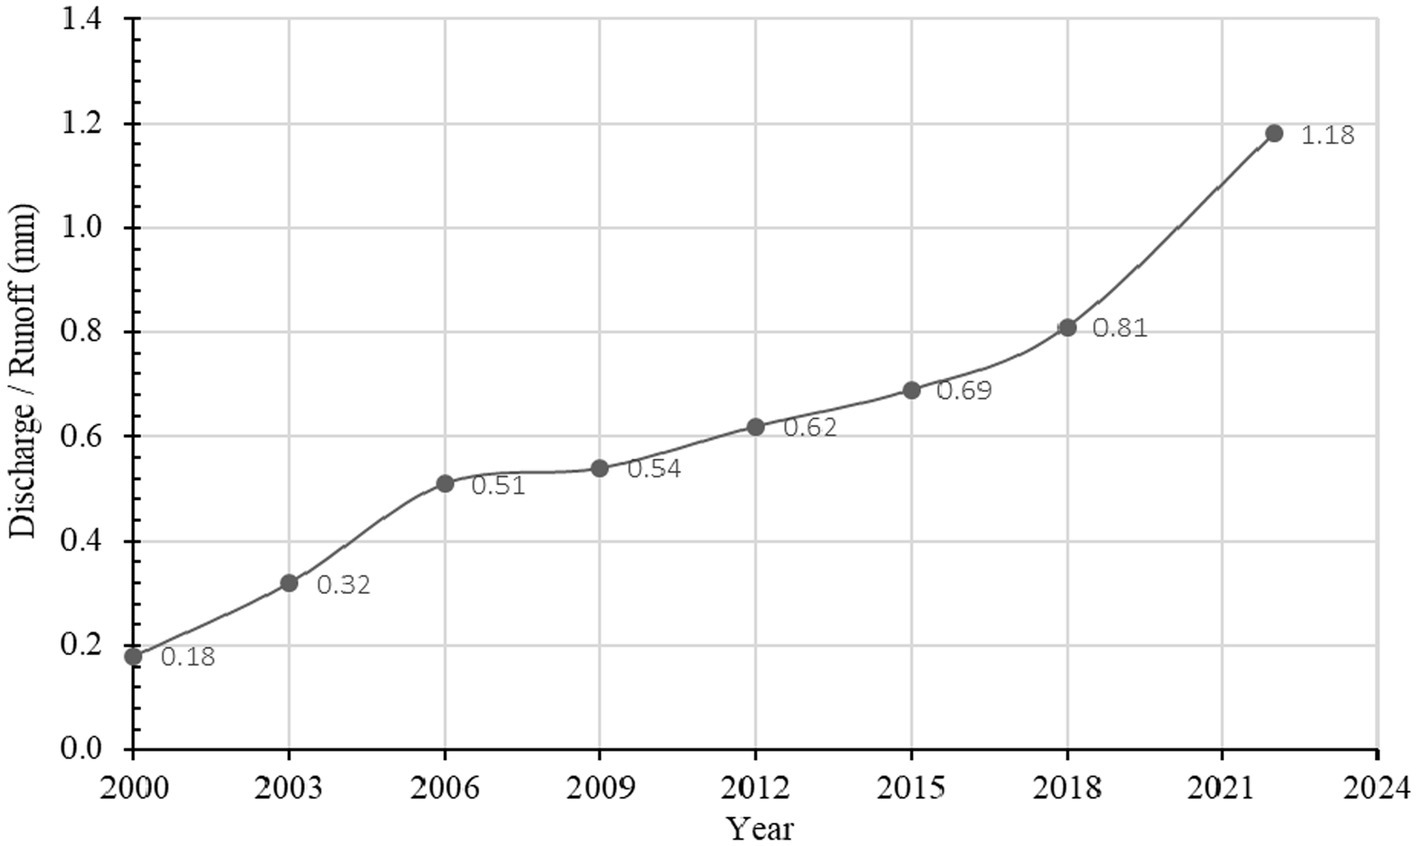
The HEC-HMS simulated runoff amounts from Mihang’o watershed for each year of study. After assembling the supporting data required for the basin model, time series data (precipitation model), meteorologic models, and control specifications, the HEC-HMS project was initiated. The simulation output, rather runoff amount was 0.18 mm in 2000, 0.32 mm in 2003, 0.51 in 2006, 0.54 in 2009, 0.62 mm in 2012, 0.69 in 2015, 0.81 in 2018, and 1.18 mm in 2022. The data were translated on a graph in Figure 9. The graph shows an increasing trend in the runoff amount over the years, drastically increasing post–2015–2022. For instance, in 2015, the runoff was 0.69 mm, which sharply increased to 1.18 mm by 2022.
4 Discussion
4.1 Impervious surface area trend of Mihang’o watershed
The impervious surface percentage data were subjected to quality control using a single mass curve technique. All impervious surface percentage points across the years of study were almost on a straight line. The coefficient of determination test results (0.9 < R2 < 1) is a strong positive, which confirmed a positive trend in the impervious surface percentage time series of Mihang’o watershed. The mass curve quality control results determined that the data were homogenous and reliable for use in this study for analysis and interpretation.
Consistent with the images in Figures 6a,b displaying the increase in the size of impervious surface in Mihang’o watershed, the data in Table 5 present the quantitative increase of impervious surface coverage in the watershed over the years. Mihang’o watershed’s total area is 17.6 km2. The results show that in 2000, the impervious surface area was 0.49 km2, representing 2.88% of the total surface area of the watershed. The impervious surface area of the watershed increased over the years to 3.91 km2 in 2022, representing 22.21% of the total surface area.
Figure 10 is a line graph created from data in Table 5, representing the percentage increase in impervious surface area of the watershed over the years. The line graph shows a slow, gradual increase in impervious surfaces between 2000 and 2015 and a drastic increase in the impervious surface between 2015 and 2022. The graph also shows a proportionate decrease in the previous surface of the watershed over the years.
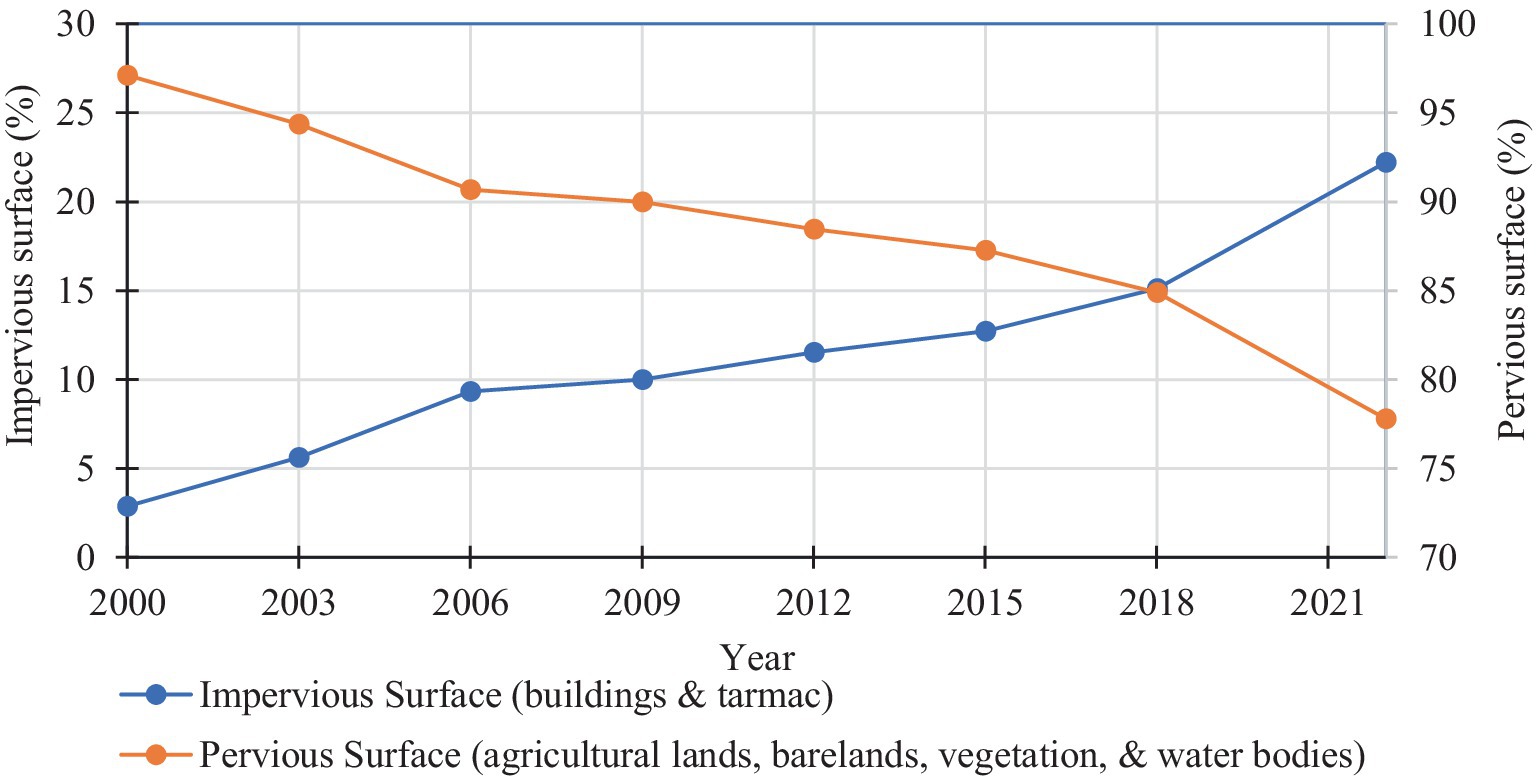
Figure 10. Impervious and pervious surface area (%) of Mihang’o watershed (2000–2022) The impervious surface percentage points across the years were nearly linear, with a strong positive trend confirmed by a coefficient of determination (0.9 < R2 < 1). Mass curve quality control results indicated that the data were homogeneous and reliable for analysis and interpretation.
Originally, Mihang’o watershed had large tracts of unoccupied land because a significant part was a ranch and government reserves for JKIA, APTC, and GSU. In the early 2000s, the area attracted settlement as the population of Nairobi expanded. Land property companies sold and distributed the land in plots. Mihang’o, as a settlement area, was attractive due to its affordability and proximity to Nairobi city. The prospect of Eastern Bypass cutting through Mihang’o made the area more appealing to people.
Over the years, urbanization has gradually increased in the watershed. According to Gachanja et al. (2023), industrialization, employment opportunities, commercialization, modernization, social benefits, and rural–urban transformation are the leading causes of urbanization. All these factors have been evident in Mihang’o post–2000. For instance, established businesses have branches, including banks, schools, hospitals, and hotels in Mihang’o. Mihang’o has also contributed to the city’s increasing population, which strongly indicates urbanization in the area (Gachanja et al., 2023).
Since 2015, the gradual expansion of the Eastern Bypass Highway led to a drastic increase in urbanization in the Mihang’o watershed. More residential units have been developed, more businesses have been established, and more road networks have been created and tarmacked, resulting in the rapid increase in impervious surface area in the watershed. Contrastingly, pervious surfaces, including the patches of agricultural lands, bare lands, vegetation, and water bodies in the watershed, have shrunk to give room to development. As of 2023, the Eastern Bypass Highway has been expanded to a 4-lane major highway in Kenya.
A simple linear regression was calculated to predict impervious surface area over the years. A significant regression equation was found (F (1.6) = 91.822, p < 0.001) with an R2 of 0.939. The statistical results confirm that the trend in impervious surface increment is significant, with an approximate increment of 3.96% (0.88 km2) each year. Therefore, based on the alternative hypothesis of this study, there is a positive trend in the impervious surface area time series of Mihang’o watershed.
4.2 Precipitation trend of Mihang’o watershed
The rainfall pattern in Mihang’o is consistent with the rainfall pattern of the larger Nairobi catchment. Like most parts of Horn of Africa, Nairobi has two rainy seasons and a single dry season (Kipkemoi, 2023). Nairobi’s subtropical highland climate is strongly influenced by its location at the eastern end of the East African Rift Valley and altitude of about 1700 m.a.s.l. (Kilavi et al., 2018). Rainfall seasonality in Nairobi is influenced by the Intertropical Convergence Zone (ITCZ) migration north–south over the region. Nairobi experiences short rains in ND as the ITCZ moves southward (Kilavi et al., 2018; University of Cape Town, 2017). Little rainfall of about 80 mm is received between January and February when the ITCZ is in the region’s south. Nairobi experiences long rains of about 310 mm in MAM as the ITCZ migrates northward. Little rain is received between June and October while the ITCZ remains in the north (Kilavi et al., 2018; University of Cape Town, 2017).
Interannual rainfall variability in Nairobi is significant because while the long-term average is 615 mm; some years may record below 370 mm or above 750 mm (University of Cape Town, 2017), which is comparable with rainfall data of Mihang’o watershed (Figures 8a,b). This is because though the period November–December is a short rain season, outbreaks of cold air from the middle latitudes, along with an influx of Congo air mass, may deliver rain in December (Kilavi et al., 2018). Also, after the long rainy season and as the ITCZ migrates northward, the Indian Monsoons’ advection of moisture from the Indian Ocean may result in heavy orographically associated rainfall throughout May and June (Kilavi et al., 2018). Consistent with Mihang’o rainfall data (Figures 8a,b), the seasonal rainfall totals fluctuate independently, with the long rains varying by 260 mm from the long-term average (310 mm), and the short rains varying by 250 mm from the long-term average (200 mm) (University of Cape Town, 2017).
Nonetheless, Nairobi may display decadal rainfall variability, but even a 35-year record is insufficient to identify this variability (University of Cape Town, 2017). Only El Niño-Southern Oscillation (ENSO) may cause rainfall that is above average, and La Nina may cause rainfall that is below average on a multiyear timescale in Nairobi. Also, Nairobi does not portray a significant linear trend for total rainfall of the short and long rains (University of Cape Town, 2017).
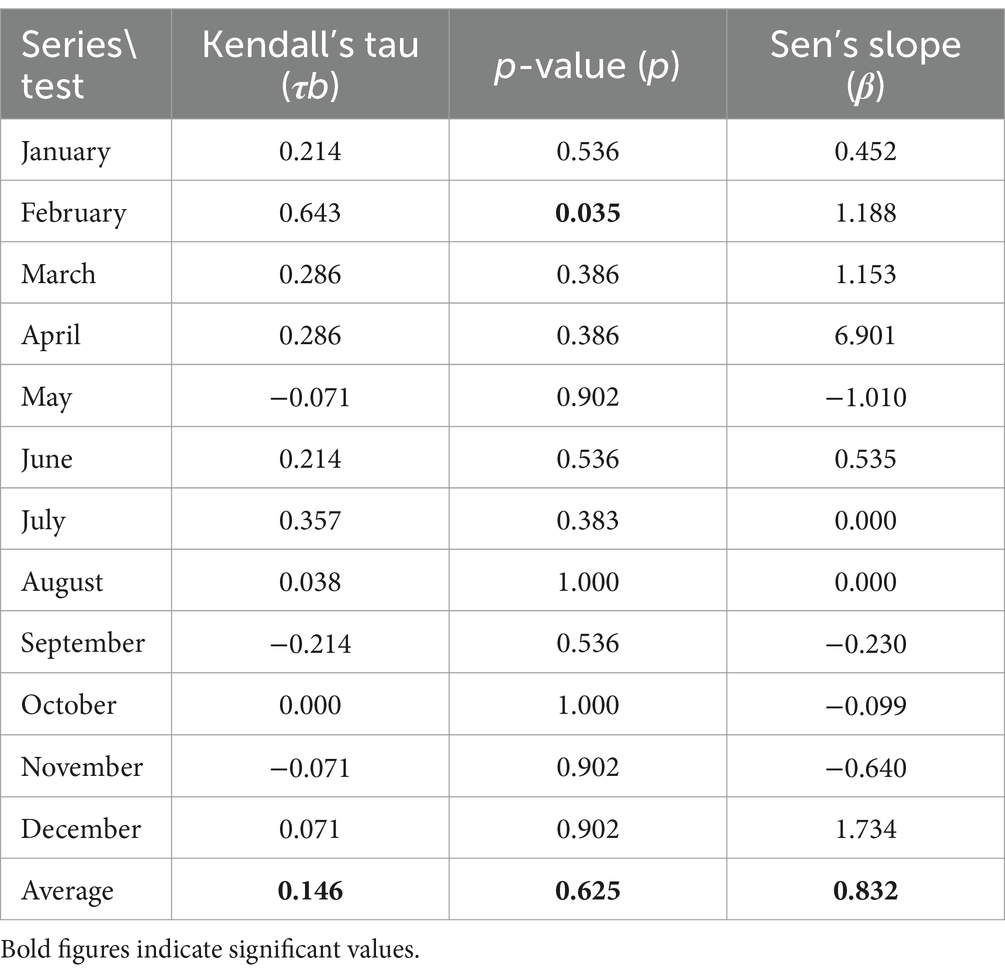
Based on the reviewed literature, Mihang’o watershed’s rainfall trend is aligned with the established climate data of the region. The region’s climate data demonstrate no significant linear trend in rainfall (University of Cape Town, 2017). Table 7 displays the results from Mann-Kendall trend tests for Mihang’o watershed rainfall. For the years of study, the average of Kendall’s tau test (τb) results is 0.146, the average p-value (p) is 0.625, and the average Sen’s slope test (β) is 0.832.
Though Sen’s slope results (β = 0.832) show a positive rainfall trend and Kendall’s tau results (τb = 0.146) show a slight correlation between rainfall amounts with time, the p-value (0.625) strongly confirms that the null hypothesis of this study that there is no trend in the rainfall data time series of Mihang’o watershed. Except for the month of February, p > 0.05 throughout, averaging p = 0.625. Additionally, the overall, or rather, established climate data of the region demonstrate no significant linear trend in rainfall (University of Cape Town, 2017). The p-value is the primary determinant of the trend; the positive results for Sen’s slope and Kendall’s tau are due to annual rainfall fluctuations (Aswad et al., 2020; Serinaldi et al., 2020). Overall, the Mann-Kendall trend tests (τb = 0.146, p = 0.625, β = 0.832) show p > 0.05; therefore, based on the null hypothesis (H0) of this study, there is no trend in the rainfall data time series of Mihang’o watershed. Importantly, having no trend in the rainfall data time series of Mihang’o watershed (p = 0.625) but an increasing trend in the impervious surface area time series (p < 0.001) reinforced the suitability of the approach of using a single rainfall event (on 29 December 2022) against various impervious surface coefficients.
4.3 Runoff amount trend of Mihang’o watershed
Quality control using the mass curve technique showed that data points for runoff were distributed in almost a straight line. This suggests that the data was homogenous and suitable for use in the analysis and interpretation of runoff in Mihang’o watershed. The strong positive coefficient of determination (0.9 < R2 < 1) reinforces the reliability of the data.
The runoff trend of the watershed (Figure 9) is consistent with the impervious surface area trend (Figures 6a,b, 10). The figures show a gradual increase in the respective variables between 2000 and 2015, then a sharp increase between 2015 and 2022. While the rainfall data input in HEC-HMS is a control variable, as in a single rainfall event, the impervious surface area coefficient is the independent variable causing the increasing runoff trend (dependent variable).
A correlation analysis found a significant positive relationship between impervious surface area and runoff, r (6) = 0.99, p < 0.000. These results are consistent with findings from similar studies that support a positive correlation between impervious surface area and runoff amount from a watershed (Alsubeai and Burckhard, 2021; Poudel et al., 2020; Rahajeng, 2010; Xu and Zhao, 2016). The reviewed literature collectively supports the Runoff Flow Changes resulting from Urbanization’s Impervious Surface Area conceptual framework adopted for this study (Paul and Meyer, 2001). The general concept is that in a natural ground cover, runoff is 10%; as impervious surface cover increases to between 10 and20%, runoff increases twice over forested catchments; in between 35 and 50% impervious surface cover, runoff increases threefold over forested catchments; and in between 75 and 100% impervious surface cover, runoff increases more than fivefold over forested catchments (Paul and Meyer, 2001).
Notably, several studies have concluded that HEC-HMS simulations show an increase in impervious land cover significantly increases the runoff volume (Naresh and Naik, 2023; Poudel et al., 2020; Yu and Zhang, 2023). According to Xu and Zhao (2016), urbanization not only indicates a country’s development level but also portrays human-environment interaction. The general trend of runoff rises with an increase in human development. This starts with converting a forested area into agricultural land. The agricultural land may develop further into an urban area, thus increasing the imperviousness of surface cover and resultant runoff. According to Xu and Zhao (2016), over half of the rainfall in highly urbanized areas is converted to surface runoff because only a small fraction infiltrates the small patches of natural land.
Similarly, the Mihang’o watershed initially consisted of large parcels of unoccupied scrubland and grassland, where more precipitation infiltrated, and runoff was minimal. For instance, in the early 2000s, Mihang’o watershed experienced low runoff. However, over the years, gradual increases in development activities have led to land use and land cover (LULC) changes. The watershed has seen an increase in the construction of residential houses, roads, and commercial businesses, resulting in a corresponding increase in impervious surface area. An increase in the amount of runoff as been consistently accompanied by this trend. The expansion of the Eastern Bypass Highway, starting in 2015, has further accelerated urbanization in the Mihang’o watershed, leading to a drastic increase in runoff observed from 2015 onward. A simple linear regression was conducted to predict runoff over the years. The analysis revealed a significant regression equation (F (1.6) = 91.215, p < 0.000) with an R2 of 0.938, confirming a significant increasing trend in runoff, with an approximate increment of 3.85% (0.045 mm) each year. Therefore, in line with the alternative hypothesis of this study, there is indeed a positive trend in the runoff time series of Mihang’o watershed.
5 Conclusions and recommendations
5.1 Quantification of changes in impervious surface area in Mihang’o watershed
The change in impervious surface area of Mihang’o watershed between 2000 and 2022 was quantified in this study. Impervious surface cover increased by 87.03% between 2000 and 2022. In 2000, the impervious surface area was 0.49 km2, representing 2.88% of the total surface area of Mihang’o watershed, which increased over the years to 3.91 km2 in 2022, representing 22.21% of the watershed’s total surface area. The linear regression results (F (1.6) = 91.822, p < 0.001) and R2 of 0.939 confirmed that the trend in impervious surface increment is significant, thus supporting the alternative hypothesis of this study that there is a positive trend in the impervious surface area time series of Mihang’o watershed.
5.2 Precipitation trends
The precipitation trend of Mihang’o watershed between 2000 and 2022 was analyzed in this study. The average annual rainfall for Mihang’o watershed is approximately 779 mm. The watershed has two rainfall seasons: long rains between March and May and short rains between November and December. The rainfall pattern in Mihang’o is consistent with the rainfall pattern and climate of the larger Nairobi catchment, which has no significant linear trend in rainfall. Furthermore, the Mann–Kendall trend test (p = 0.625) shows p > 0.05; therefore, based on the null hypothesis of this study, there is no trend in the rainfall data time series of Mihang’o watershed.
5.3 Runoff amount trend of Mihang’o watershed
The trend of the amount of runoff from Mihang’o watershed between 2000 and 2022 was evaluated in this study. Runoff increased by approximately 84.75% from 0.18 mm in 2000 to 1.18 mm in 2022. The linear regression results (F (1.6) = 91.215, p < 0.000) and R2 of 0.938 confirmed a significant increment in the runoff, thus supporting the alternative hypothesis of this study that there is a positive trend in the runoff time series of Mihang’o watershed.
5.4 Recommendations
To promote sustainable urban planning, land use zonation should be conducted to ensure a balanced distribution of pervious and impervious surfaces. Specifically, a significant percentage of land should remain pervious to enhance natural groundwater recharge and reduce surface runoff, urban areas have a variety of distinct LU/LCs within a smaller geographical area; therefore, higher resolution images enable more precise identification of the features on the ground, thus facilitating more accurate supervised classification.
Regarding objective two, the rainfall data series does not show a significant trend; therefore, it is suffice to use a single rainfall event against various impervious surface coefficients to simulate runoff when modeling hydrological events in urban watersheds.
The authors recommend installing runoff monitoring stations, including weather stations, in Kenya’s river channels. The data collected from these stations should be analyzed alongside simulation results from hydrological models. This approach would yield more accurate runoff predictions, enabling urban planners to make better-informed decisions.
Data availability statement
Publicly available datasets were analyzed in this study. This data can be found here: https://www.chc.ucsb.edu/data/chirps.
Author contributions
CO: Conceptualization, Data curation, Formal analysis, Investigation, Methodology, Resources, Software, Validation, Visualization, Writing – original draft, Writing – review & editing. MM: Conceptualization, Methodology, Software, Supervision, Writing – original draft, Writing – review & editing. KO: Conceptualization, Investigation, Methodology, Software, Supervision, Writing – original draft, Writing – review & editing. IK: Conceptualization, Formal analysis, Investigation, Methodology, Software, Visualization, Writing – original draft, Writing – review & editing. JD: Formal analysis, Software, Visualization, Writing – review & editing.
Funding
The author(s) declare that no financial support was received for the research, authorship, and/or publication of this article.
Acknowledgments
Publication of this paper was not funded. However, the first author (Cyrus Omwoyo Ongaga) gratefully acknowledges the support of the German Academic Exchange Service (DAAD) and the German government for providing an in-country scholarship. This scholarship covered tuition fees and living expenses during the Master’s studies at Kenyatta University, where the conceptualization and finalization of this work were carried out as part of the Master’s program.
Conflict of interest
The authors declare that the research was conducted in the absence of any commercial or financial relationships that could be construed as a potential conflict of interest.
Publisher’s note
All claims expressed in this article are solely those of the authors and do not necessarily represent those of their affiliated organizations, or those of the publisher, the editors and the reviewers. Any product that may be evaluated in this article, or claim that may be made by its manufacturer, is not guaranteed or endorsed by the publisher.
References
Akech, N. O., Omuombo, C. A., and Masibo, M. (2013). “General geology of Kenya” in Developments in earth surface processes. ed. J. W. Sears (Amsterdam, NL: Elsevier), 3–10.
Alshammari, E., Abdul Rahman, A., Rainis, R., Abu Seri, N., and Ahmad, F. (2024). Investigation of runoff and flooding in urban areas based on hydrological models: a literature review. Int. J. Geoinform. 20, 99–199. doi: 10.52939/ijg.v20i1.3033
Alsubeai, A., and Burckhard, S. (2021). Rainfall-runoff simulation and modelling using HEC-HMS and HEC-RAS models: case study Tabuk, Saudi Arabia. Nat. Res. 12, 321–338. doi: 10.4236/nr.2021.1210022
Alves, M. C., and Sanches, L. (2023). Remote sensing and digital image processing with R - lab manual. Boca Raton, FL: CRC Press.
Aswad, F. K., Yousif, A. A., and Ibrahim, S. A. (2020). Trend analysis using Mann-Kendall and Sen’s slope estimator test for annual and monthly rainfall for SINJAR district, IRAQ. J. Duhok Univ. 23, 501–508.
Baláž, M., Danáčová, M., and Szolgay, J. (2010). On the use of the Muskingum method for the simulation of flood wave movements. Slovak J. Civil Eng. 18, 14–20. doi: 10.2478/v10189-010-0012-6
Bosco, N. J., Geoffrey, M. M., and Kariuki, N. (2011). Assessment of landscape change and occurrence at watershed level in city of Nairobi. Afr. J. Environ. Sci. Technol. 5, 873–883.
Chathuranika, I. M., Gunathilake, M. B., Baddewela, P. K., Sachinthanie, E., Babel, M. S., Shrestha, S., et al. (2022). Comparison of two hydrological models, HEC-HMS and SWAT in runoff estimation: application to Huai bang Sai tropical watershed, Thailand. Fluids 7:267. doi: 10.3390/fluids7080267
Civil GEO . (2023). Curve numbers for urban impervious areas. Available at: https://knowledge.civilgeo.com/knowledge-base/curve-numbers-for-urban-impervious-areas/
Ebrahimian, A., Gulliver, J. S., and Wilson, B. N. (2016a). Effective impervious area for runoff in urban watersheds. Hydrol. Process. 30, 3717–3729. doi: 10.1002/hyp.10839
Ebrahimian, A., Wilson, B. N., and Gulliver, J. S. (2016b). Improved methods to estimate the effective impervious area in urban catchments using rainfall-runoff data. J. Hydrol. 536, 109–118. doi: 10.1016/j.jhydrol.2016.02.023
Gachanja, J., Karanja, J., Nato, J., Ngugi, R., Njogu, H., et al. (2023). Urban economic growth in Africa: a case study of Nairobi City county, Kenya. Kenya Institute for Public Policy Research and Analysis (KIPPRA) and Africa Growth Initiative (AGI). Available at: https://www.brookings.edu/wp-content/uploads/2023/02/2023_AGI_Nairobi-Case-Study_Final_23.02.16.pdf
Green, W. H., and Ampt, G. A. (1911). Studies on soil physics. J. Agric. Sci. 4, 1–24. doi: 10.1017/S0021859600000789
Guduru, J. U., Jilo, N. B., Rabba, Z. A., and Namara, W. G. (2023). Rainfall-runoff modeling using HEC-HMS model for Meki River watershed, rift valley basin, Ethiopia. J. Afr. Earth Sci. 197:104743. doi: 10.1016/j.jafrearsci.2022.104743
Guo, Y., Zhang, Y., Zhang, T., Wang, K., Ding, J., and Gao, H. (2019). “Surface runoff” in Observation and measurement of ecohydrological processes: Ecohydrology. eds. X. Li and H. Vereecken, vol. 2 (Berlin, Heidelberg: Springer).
Hershfield, D. M. (1961). Estimating the probable maximum precipitation. J Hydraul Div. 87, 99–116. doi: 10.1061/JYCEAJ.0000651
Jaetzold, R., and Schmidt, H. (1982). Farm management handbook of Kenya. Kenya: Ministry of Agriculture.
Kilavi, M., MacLeod, D., Ambani, M., Robbins, J., Dankers, R., Graham, R., et al. (2018). Extreme rainfall and flooding over Central Kenya including Nairobi city during the long-rains season 2018: causes, predictability, and potential for early warning and actions. Atmos. 9:472. doi: 10.3390/atmos9120472
Kipkemoi, I. (2023). Impacts of climate and climate change on water and vegetation dynamics in horn of Africa drylands. Bristol (UK): University of Bristol.
Ligtenberg, J. (2017). Runoff changes due to urbanization: a review. Available at: https://www.diva-portal.org/smash/get/diva2:1067287/FULLTEXT01.pdf
Liu, J., Seto, K. C., and Macomber, S. A. (2015). Global trends in urban land use change from 1970 to 2014. Nature 523, 190–193. doi: 10.1088/1748-9326/ab6669
Mbuthia, M., Kiroro, F., Malik, A., and Goldblatt, R. (2022). Mapping the impact of urbanization on vegetation in Nairobi, the 'green city in the sun’. International Initiative for Impact Evaluation. Available at: https://www.3ieimpact.org/blogs/mapping-impact-urbanization-vegetation-nairobi-green-city-sun
McCarthy, D. J. (1938). The Muskingum method of flood routing. Trans. Am. Soc. Civ. Eng. 103, 160–194. doi: 10.1061/TACEAT.0000551
Miller, J., Kim, H., Kjeldsen, T. R., Packman, J., Grebby, S., and Dearden, R. (2014). Assessing the impact of urbanization on storm runoff in a peri-urban catchment using historical change in impervious cover. J. Hydrol. 515, 59–70. doi: 10.1016/j.jhydrol.2014.04.011
Muli, N. M. (2008). Rainfall-runoff flood modelling in Nairobi urban watershed, Kenya. Kenya: Nairobi University.
Muthu, A. L., and Santhi, M. H. (2015). Estimation of surface runoff potential using SCS-CN method integrated with GIS. Indian J. Sci. Technol. 8, 1–5. doi: 10.17485/ijst/2015/v8i28/83324
Namwade, G., Trivedi, M. M., Tiwari, M. K., and Patel, G. R. (2023). Rainfall-runoff modelling using HEC-HMS model, remote sensing and GIS in middle Gujarat, India. Int. J. Environ. Clim. Change 13, 952–962. doi: 10.9734/ijecc/2023/v13i92317
Naresh, A., and Naik, M. G. (2023). Urban rainfall-runoff modeling using HEC-HMS and artificial neural networks: a case study. Int. J. Math. Eng. Manag. Sci. 8, 403–423. doi: 10.33889/IJMEMS.2023.8.3.023
Nash, J. E., and Sutcliffe, J. V. (1970). River flow forecasting through conceptual models, part I – a discussion of principles. J. Hydrol. 10, 282–290. doi: 10.1016/0022-1694(70)90255-6
O’Driscoll, M., Clinton, M., Jefferson, A., Manda, A., and McMillan, S. (2010). Urbanization effects on watershed hydrology and in-stream processes in the southern United States. Water 2, 605–648. doi: 10.3390/w2030605
Onyancha, C., Mathu, E., Mwea, S., and Ngecu, W. (2011). A study on the engineering behaviour of Nairobi subsoil. ARPN J. Eng. App. Sci. 6, 85–96.
Owuor, M. O., and Mwiturubani, D. A. (2022). Correlation between flooding and settlement planning in Nairobi. J. Water Clim. Change 13, 1790–1805. doi: 10.2166/wcc.2022.335
Paul, M. J., and Meyer, J. L. (2001). Streams in the urban landscape. Annu. Rev. Ecol. Syst. 32, 333–365. doi: 10.1146/annurev.ecolsys.32.081501.114040
Poudel, U., Ahmad, S., and Stephen, H. (2020). Impact of urbanization on runoff and infiltration in walnut gulch experimental watershed. Watershed management conference 219–232. doi: 10.1061/9780784483060.020
Rahajeng, E . (2010). Application HEC-HMS to predict hydrograph. Case Study in Lebak Petal Sub Basin. AFITA 2010 International Conference: The Quality Information for Competitive Agricultural Based System and Commerce.
Rezaei, A. R., Ismail, Z. B., Niksokhan, M. H., Ramli, A. H., Sidek, L. M., and Dayarian, M. A. (2019). Investigating the effective factors influencing surface runoff generation in urban catchments–a review. Desalin. Water Treat 164, 276–292. doi: 10.5004/dwt.2019.24359
Ross, C. W., Prihodko, L., Anchang, J., Kumar, S., Ji, W., and Hanan, N. P. (2018). HYSOGs250m, global gridded hydrologic soil groups for curve-number-based runoff modeling. Sci. Data 5, 1–9. doi: 10.1038/sdata.2018.91
Serinaldi, F., Chebana, F., and Kilsby, C. G. (2020). Dissecting innovative trend analysis. Stoch. Env. Res. Risk A. 34, 733–754.
Seto, K. C., and Shepherd, J. (2009). Global urban land-use trends and climate impacts. Curr. Opin. Environ. Sustain. 1, 89–95. doi: 10.1016/j.cosust.2009.07.012
Sherman, L. K. (1932). Streamflow from rainfall by the unit graph method. Trans. Am. Soc. Civ. Eng. 97, 1–22. doi: 10.1061/TACEAT.0001108
Shuster, W. D., Bonta, J., Thurston, H., Warnemuende, E., and Smith, D. R. (2005). Impacts of impervious surface on watershed hydrology: a review. Urban Water J. 2, 263–275. doi: 10.1080/15730620500386529
Stanuikynas, T. J., Van, D. J., and Newcomb, D. J. (2000). Impervious surface methodology: A methodology for defining and assessing impervious surfaces in the Raritan River basin. Clinton, NJ: Jersey Water Supply Authority.
Tang, W., Feng, W., Zheg, M., and Shi, J. (2018). “Land cover classification of fine-resolution remote sensing data” in Comprehensive remote sensing. ed. S. Liang (Amsterdam, NL: Elsevier), 17–28.
Tom, R. O., George, K. O., Joanes, A. O., and Haron, A. (2022). Review of flood modelling and models in developing cities and informal settlements: a case of Nairobi city. J. Hydrol. Reg. Stud. 43:101188. doi: 10.1016/j.ejrh.2022.101188
U.S. Army Corps of Engineers (2000). HEC-HMS: Hydrologic Modeling system - User's manual. Davis, CA: U.S. Army Corps of Engineers. HEC-HMS Documentation.
U.S. Army Corps of Engineers (ACE) . (2009). HEC-HMS: Hydrologic Modeling System - User’s Manual. Davis. CA: U.S. Army Corps of Engineers.
United Nations . (2018). 68% of the world population projected to live in urban areas by 2050, says UN. Available at: https://www.un.org/development/desa/en/news/population/2018-revision-of-world-urbanization-prospects.html
United States Geological Survey (2023). Available at: https://www.usgs.gov/the-national-map-data-delivery/gis-data-download
University of Cape Town . (2017). Nairobi climate profile: Full technical version. Available at: https://www.urbanark.org/sites/default/files/resources/Nairobi_climate_profile_full_technical_v2_0.pdf
Xu, Z., and Zhao, G. (2016). Impact of urbanization on rainfall-runoff processes: case study in the Liangshui River basin in Beijing, China. Proc. Int. Assoc. Hydrol. Sci. 373, 7–12. doi: 10.5194/piahs-373-7-2016
Keywords: HEC-HMS model, rainfall - runoff, impervious and pervious layers, urban, watershade, hydrological dynamics
Citation: Ongaga CO, Makokha M, Obiero K, Kipkemoi I and Diang’a J (2024) Urbanization and hydrological dynamics: a 22-year assessment of impervious surface changes and runoff in an urban watershed. Front. Water. 6:1455763. doi: 10.3389/frwa.2024.1455763
Edited by:
Akhouri Pramod Krishna, Birla Institute of Technology, Mesra, IndiaReviewed by:
Mekonnen Maschal Tarekegn, Ethiopian Civil Service University, EthiopiaDaniel Lirebo Sokido, Ethiopian Civil Service University, Ethiopia
Copyright © 2024 Ongaga, Makokha, Obiero, Kipkemoi and Diang’a. This is an open-access article distributed under the terms of the Creative Commons Attribution License (CC BY). The use, distribution or reproduction in other forums is permitted, provided the original author(s) and the copyright owner(s) are credited and that the original publication in this journal is cited, in accordance with accepted academic practice. No use, distribution or reproduction is permitted which does not comply with these terms.
*Correspondence: Cyrus Omwoyo, Ongagab213b3lvbmdhZ2FAZ21haWwuY29t
†ORCID: Cyrus Omwoyo Ongaga, https://orcid.org/0000-0002-2893-4388
Mary Makokha, https://orcid.org/0000-0003-1755-8089
Kennedy Obiero, https://orcid.org/0000-0003-3949-2703
Isaac Kipkemoi, https://orcid.org/0000-0003-2420-3366
Justus Diang’a, https://orcid.org/0000-0001-5746-2896
 Cyrus Omwoyo Ongaga1*†
 Isaac Kipkemoi