- 1Laboratoire de Physique de l'Atmosphere et de l'Ocean-Simeon Fongang, LPAO-SF, Universite Cheikh Anta Diop, Dakar, Senegal
- 2Institute of Meteorology and Climate Research (IMK-IFU), Karlsruhe Institute of Technology, Campus Alpin, Garmisch-Partenkirchen, Germany
- 3Institute of Geography, University of Augsburg, Augsburg, Germany
West African countries frequently experience extreme rainfall events during the monsoon season. On September 5, 2020, a significant event occurred in the Dakar region of Senegal with daily rainfall totals exceeding 90 mm, causing widespread flooding and displacing 1,000's of people. Despite the severity of this event, the physical mechanisms driving such extreme rainfall remain unexplored. This study aims to investigate the physical mechanisms associated with this event using multiple data sources, including satellite rainfall estimate products (GPM-IMERG, CHIRPS) and reanalysis data (ERA-5). By analyzing wind fields and mid-tropospheric moisture content from reanalysis data, we examined the synoptic-dynamic evolution of the atmosphere and the movement of the cyclonic vortex that transported moisture to the affected region, resulting in substantial rainfall measurements exceeding 100 mm. The analysis also revealed that a vortex over the ocean slowed down the vortex near Senegal, prolonging the rainfall over a total period of 10 h. Additionally, this study presents a comprehensive comparative analysis of state-of-the-art satellite rainfall estimates, assessing their accuracy and reliability in capturing extreme rainfall events both spatially and at specific rainfall gauges situated in Dakar. This evaluation revealed that while satellite rainfall estimates are valuable, they tended to underestimate (up to 40%) the actual rainfall observed at the Dakar-Yoff station. Furthermore, extreme value analysis showed that there is a tendency to underestimate return levels for high-intensity events, with some cases showing underestimations by up to twice the actual values. Thus, this research advances our understanding of extreme rainfall events in West Africa and improves our knowledge of satellite-based rainfall estimates, contributing to future monitoring and preparedness. Furthermore, these findings highlight the importance of monitoring cyclonic systems associated with African Easterly Waves, contributing to a better understanding of extreme rainfall events in West Africa.
1 Introduction
The frequency of extreme rainfall events has increased by more than one-third globally in recent decades (Sun et al., 2021; Gimeno et al., 2022; Papalexiou and Montanari, 2019). Similar trends have been observed in many Sahelian countries, leading to extreme flooding in urban and rural areas, exacerbating local vulnerabilities (Panthou et al., 2018; Sougué et al., 2024; Diémé et al., 2022). These floods have had a significant impacts on the economy, infrastructure, agriculture, and human health, further worsening the living conditions of the most vulnerable populations (Reed et al., 2022; Miller et al., 2022). There is also growing concern about the impact of climate change on extreme rainfall, with projections indicating an increase in the intensity and frequency of such events (Sylla et al., 2016; Marvel et al., 2019; Tabari, 2020). Future projections point to an increased risk of such events, highlighting the need for a better understanding of the associated risks and the development of management strategies to mitigate their effects. On September 5, 2020, the Dakar region experienced a significant rainfall event that led to widespread flooding, causing considerable damage to infrastructure and disruptions to daily life (Reuters, 2020; see Figure 1). An assessment by IFRC (2022) revealed that this flooding affected 1,475 households, or ~7,270 individuals, displacing 3,285 people. The severity of such events underscores the necessity for an in-depth investigation into the causes, impacts, and broader implications of extreme rainfall events in Dakar.
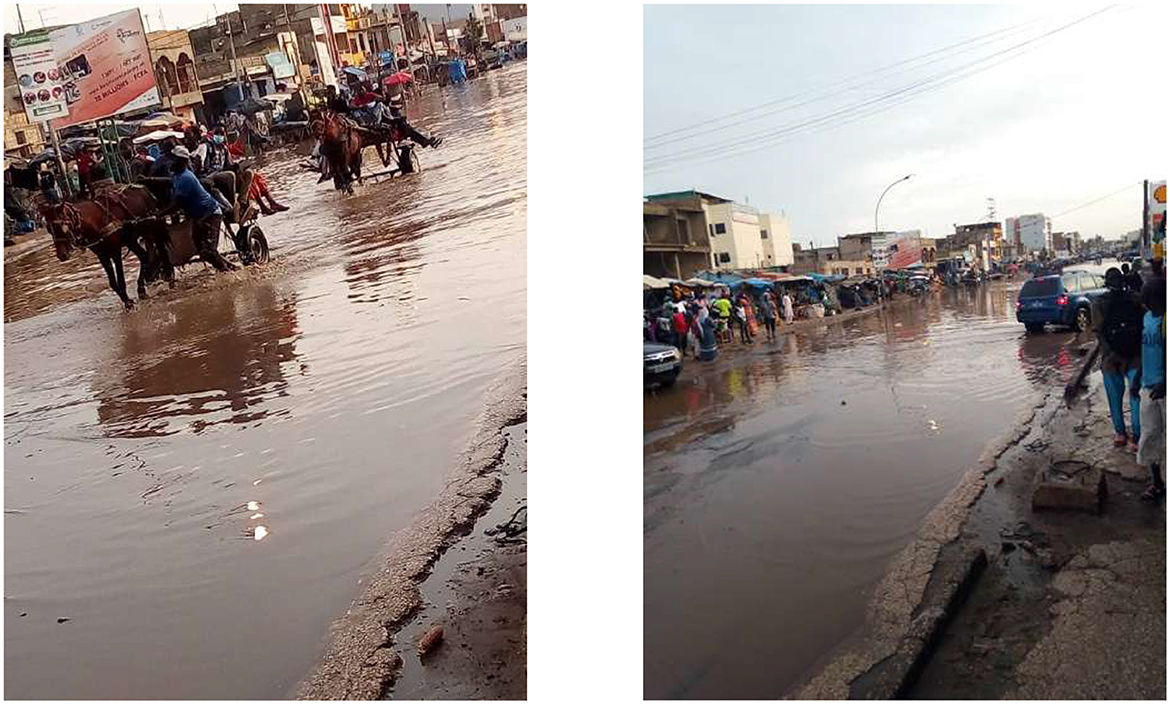
Figure 1. Flooded roads in the Grand Yoff neighborhood of Dakar due to the heavy rains on September 5, 2020. Source: Agence Nationale de l'Aviation Civile et de la Météorologie (ANACIM).
To thoroughly understand extreme events in data-scarce regions, it is crucial to analyze various data products, including reanalysis data, satellite rainfall estimates, and observations. However, while satellite and reanalysis products are commonly used to assess extreme events in data-scarce regions, they present significant challenges in terms of validation, particularly in capturing the true scale of such events (Engel et al., 2017; Agyekum et al., 2023). Satellite-derived rainfall data often underestimate the intensity of extreme rainfall, especially in tropical regions like Africa (Maranan et al., 2020; Ageet et al., 2022). Therefore, it is crucial to validate these products with local ground-based data where available to ensure accuracy. This validation gap is particularly critical in regions like West Africa, where extreme rainfall events driven by mesoscale convective systems (MCSs) have a profound impact on local communities and contribute to frequent flooding (Atiah et al., 2023).
The individual analysis of extreme events in the West African Monsoon region is relatively unexplored in the literature, highlighting the need for further research. The study by Engel et al. (2017) investigates two significant heavy rainfall and flooding events in West African cities (Ouagadougou on September 1, 2009, and Dakar on August 26, 2012), focusing on their atmospheric conditions and statistical return periods. Another study by Fall et al. (2020) focuses on a rainfall event in Linguére, Senegal, on August 26, 2017, aiming to analyze the synoptic conditions associated with this event and assess the predictive capability of numerical forecast models. Agyekum et al. (2023) analyzed the heavy rainfall event on June 28, 2018, in Kumasi using a high-resolution rain gauge network, satellite data, and reanalysis data. Maranan et al. (2019) described an intense MCS in the Guinea Coast region that caused one of the highest ever recorded daily rainfall amounts at the Nigerian station in Abakaliki on June 12, 2016 (223.5 mm), with an analysis of the meso- and synoptic-scale factors leading to this event. These studies emphasize the importance of analyzing individual events for a deeper understanding of the mechanisms and factors contributing to extreme weather events.
This study aims to perform a detailed investigation of a recent high-impact flood event in West Africa, specifically focusing on the Dakar flood that occurred on September 5, 2020. The study focuses therefore on the following objectives:
• Analyze the synoptic and dynamic atmospheric conditions associated with the September 5, 2020, Dakar flood event.
• Evaluate the performance and accuracy of the latest products of satellite-derived rainfall estimates from—Climate Hazards Group InfraRed Precipitation with Station data (CHIRPS) and the Integrated Multi-satellitE Retrievals for GPM (IMERG)—by comparing them with ground-based observations.
• Quantify the statistical return periods of extreme rainfall in order to gain a better understanding of the frequency and magnitude of extreme rainfall in this region.
The novelty of this study lies in its integration of state-of-the-art datasets to present a comprehensive analysis of the September 2020 Dakar flood, a recent high-impact flooding event in West Africa. This research fills a gap in the current literature by examining both the meteorological and statistical aspects of an extreme weather event in a data-scarce and understudied region. Additionally, it offers a valuable combination of dataset evaluation and statistical modeling, providing insights that can help policymakers, and local authorities on how to better understand and prepare for extreme rainfall events in Senegal and similar regions.
The article is structured as follows. First, we present material and methods in Section 2 including a description of the study area, the data products used, and the methodology applied. The main findings are presented in three points in Section 3. The first point examines the synoptic situation from September 4th to 7th, 2020 using reanalysis data. The second point focuses on the comparative analysis of CHIRPS and IMERG precipitation data, while the third emphasizes the analysis of extreme values. Section 4 provides an overview of the discussion, followed by conclusions and a summary in Section 5.
2 Materials and methods
2.1 Study area
This research investigates extreme rainfall in the Dakar region of Senegal, situated in West Africa. Dakar, located on the Cap-Vert peninsula—the westernmost point of Africa—is both the capital and the largest city of Senegal (Figure 2a). This region, falling within the Sahel zone (Omotosho and Abiodun, 2007; Akinsanola et al., 2017), is distinguished by its unique seasonal rainfall regime, typically peaking in August (Figure 3). These periods are frequently marked by extreme rainfall events. In the context of West Africa, and particularly in the Sahel region, MCSs are recognized as a primary mechanism for rain production (Mathon et al., 2002; Vischel et al., 2019). Characterized by their rapid eastward movement, MCSs are known for their intense rainfall, often exceeding 20 mm/h, and in the most extreme cases, reaching up to 100 mm/h (Fink et al., 2006; Fink, 2010; Maranan et al., 2018). The influence of these intense MCSs is significant, shaping both the seasonal and spatial patterns of extreme rainfall in the Dakar region. The West African Monsoon (WAM) system, governed by complex atmospheric, oceanic, and terrestrial interactions, further intensifies these effects. The interplay between the WAM and MCSs, especially in terms of system formation and intensity, is pivotal in determining the frequency and variability of extreme rainfall events in the region.
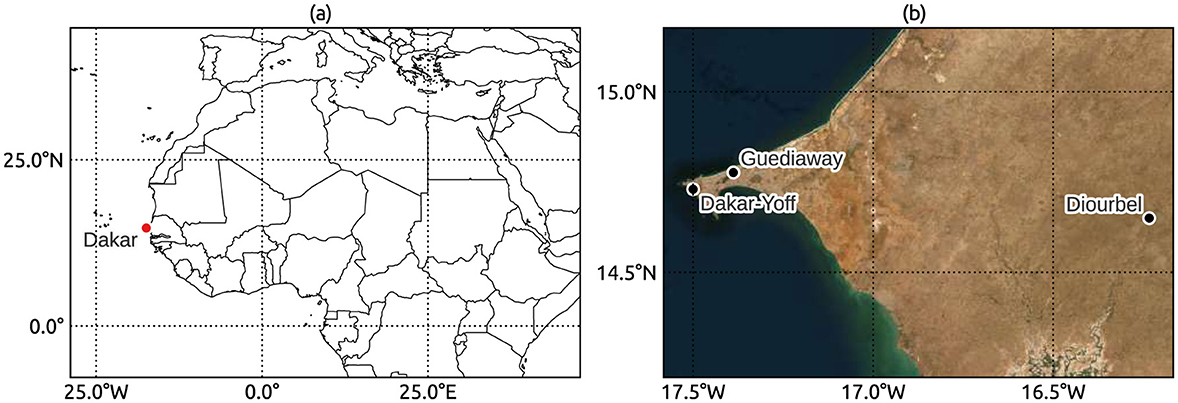
Figure 2. Geographic representation and location details of Dakar, Senegal. (a) Shows the position of Dakar (marked with a red dot) within the African continent, providing a broad spatial context. (b) Provides a satellite view of the Dakar region, indicating the locations of the rainfall observation stations at Dakar-Yoff and Guediawaye. Sources of the basemap in (b): Esri, DigitalGlobe, GeoEye, i-cubed, USDA FSA, USGS, AEX, Getmapping, Aerogrid, IGN, IGP, swisstopo, and the GIS User Community.
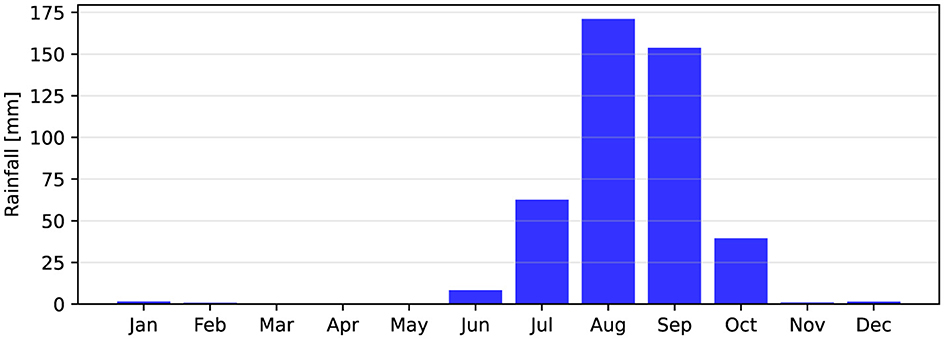
Figure 3. Average monthly rainfall for the Dakar-Yoff rainfall station. This bar chart represents the mean rainfall sum measured in mm for each month, averaged over 1950–2020. The data illustrate the pronounced seasonal variation characteristic of the Sahel climate, with a peak during the rainy season in August.
2.2 In-situ rainfall observations
This study utilizes daily rainfall data sourced from the West African Historical Precipitation Database (WAHPD, Bliefernicht et al., 2022b) and the Karlsruhe Surface Station Database (KASS-D, Vogel et al., 2018), focusing on the Dakar-Yoff and Diourbel rainfall stations (Figure 2b). These stations are notable in the West African context for their long-term historical records, with Diourbel's data spanning from 1920 to 2021 and Dakar-Yoff's from 1945 to 2021. The completeness of these records is remarkable, with < 2% of data points missing throughout their extensive recording periods. The time series from these stations are particularly crucial for contextualizing the extreme rainfall event that occurred on September 5, 2020.
To complement the the daily rainfall data, we also incorporated hourly rainfall measurements from the Guediawaye station (Figure 2b), provided by the Agence Nationale de l'Aviation Civile et de la Météorologie (ANACIM). This dataset spans a shorter period, from September 1, 2020, to September 7, 2020. The inclusion of this high-resolution data enriches our understanding of rainfall patterns during this period and aids in evaluating the representation of these patterns in satellite-derived products. For the daily data, stations record daily accumulated rainfall data from 06:00 UTC to 06:00 UTC the following day (Maranan 2023, personal communication).
2.3 GPM IMERG 6
The Integrated Multi-satellite Retrievals for GPM (IMERG) Version 6B, the final version (hereafter referred to as IMERG), is a globally gridded rainfall product developed as part of the Global Precipitation Measurement (GPM) mission (Huffman et al., 2015). This version incorporates data from various sources within the GPM satellite constellation. Its key components include the GPM Core Observatory satellite, equipped with a dual-frequency rainfall radar and a 13-channel passive microwave imager (GMI). Additionally, it integrates data from passive microwave (PMW) instruments and infrared inputs from geostationary satellites. IMERG provides rainfall estimates on a 0.1° (~10 km at the equator) and updates these estimates every 30 min, offering high spatial and temporal resolution. The dataset spans from June 2000 to September 2021. After this period, the subsequent iteration of the technology, IMERG7, commenced operation. For the comparison with the daily in-situ values, we aggregated the half-hourly values into daily accumulated rainfall totals from 06:00 UTC to 06:00 UTC, which were then assigned to the following day.
2.4 CHIRPS V2.0
The CHIRPS V2.0 Final is a gridded rainfall product derived from satellite measurements. CHIRPS integrates satellite infrared data with in-situ station data, employing “‘smart” interpolation techniques and high-resolution Cold Cloud Duration (CCD) observations. This integration process blends daily, pentadal, and monthly rainfall estimates from CCD data with station measurements, culminating in a quasi-global rainfall dataset (Funk et al., 2015). The CHIRPS product offers rainfall estimates on a 0.05° grid (~5 km at the equator) with daily resolution. The study by Dembélé and Zwart (2016) assessed the quality of several satellite-based rainfall products, including CHIRPS, Africa Rainfall Estimate Climatology (ARC 2.0), Precipitation Estimation from Remotely Sensed Information using Artificial Neural Networks (PERSIANN), African Rainfall Estimation (RFE 2.0), and the Tropical Rainfall Measuring Mission (TRMM). This assessment revealed a generally weak correlation between daily satellite-based rainfall products and rain-gauge data from Burkina Faso for the period 2001–2014. Notably, CHIRPS emerged as the most accurate, exhibiting the highest correlation coefficient (r) of 0.47. Furthermore, research by Kouakou et al. (2023) underscores the utility of CHIRPS, with a focus on hydrological modeling across West African and northern Central African regions.
2.5 Reanalysis data
The synoptic-dynamic analysis in this study is based on the ERA-5 reanalysis dataset from the European Center for Medium-Range Weather Forecasts (ECMWF). The ERA-5 dataset encompasses a broad range of atmospheric, terrestrial, and oceanic variables, providing a robust framework for climatological analysis (Hersbach et al., 2020). The data, sourced from the Climate Data Store of the Copernicus Climate Change Service, features a spatial resolution of ~0.25 degrees (~25 km) and a temporal resolution of 1 h, rendering it suitable for detailed synoptic-scale investigations. The chosen analysis period, spanning from September 4–7, 2020, aimed to cover the prelude, occurrence, and aftermath of the extreme rainfall event. To align temporally with the available rainfall data, ERA-5 datasets were averaged over 24-h periods from 06:00 UTC to 06:00 UTC, with the derived mean values then attributed to the following day. Key atmospheric variables from the ERA-5 dataset, such as temperature, horizontal winds, specific humidity, and relative vorticity, were analyzed at pressure levels ranging from 600 to 1,000 hPa. This analysis was instrumental in depicting the atmospheric environment during the extreme rainfall event and unraveling the underlying mechanisms that influenced its intensity.
2.6 Atmospheric analysis
MCSs are one of the primary mechanisms for extreme rainfall in the studied region (Vischel et al., 2019). These systems depend on high levels of atmospheric moisture, primarily sourced from the advection of humid air from the Atlantic Ocean, and, to a lesser extent, from evaporation over land surfaces. In this context, Precipitable Water Vapor (PWV) serves as a useful parameter for studying atmospheric moisture (Kim et al., 2022), representing the depth of water in a column of the atmosphere, thereby playing a crucial role in enhancing our understanding of cloud formation and rainfall processes. In our study, PWV is calculated by integrating the specific humidity over atmospheric pressure levels as:
q(p) denotes the specific humidity at pressure level p, and g represents gravitational acceleration, ~9.81m/s2 (Salby, 1996). The integration is applied from 600 to 1, 000hPa as the majority of PWV is typically found in the lower troposphere. This distribution pattern arises because the water vapor content in the atmosphere decreases with altitude, correlating with temperature and pressure changes.
Furthermore, we focus on analyzing atmospheric dynamics by calculating the mass-weighted atmospheric flow within these tropospheric pressure levels (Lafore et al., 2017; Maranan et al., 2019). This method provides a comprehensive view of the horizontal movement of air masses, accounting for variations in air density due to moisture content and altitude. It involves computing the virtual temperature (Tv) to reflect the influence of humidity on air density. The virtual temperature is determined by adjusting the actual air temperature (T) for the moisture content represented by the specific humidity (q), as per the equation: Tv = T(1+0.608q) (Doswell and Rasmussen, 1994). Following the determination of Tv, we calculate the air density (ρ) (Jones, 1978) at each specified pressure level. Then, the weights are assigned to each layer in the vertical profile, based on the relative air density. These weights are calculated using the formula: , with ρmax being the maximum density observed in the specified pressure range. With these weights, the mass-weighted average flow for both the zonal (u) and meridional (v) wind components can be determined. The integration is performed across the entire range of 600–1,000 hPa. The mass-weighted average horizontal wind components (Lafore et al., 2017; Maranan et al., 2019) are then computed as follows:
Here, U and V represent the mass-weighted atmospheric flow average zonal and meridional wind components. This approach allows a detailed examination of horizontal wind patterns in the troposphere, providing a more accurate representation of atmospheric motion than simple arithmetic averages. By considering air mass variations, this method captures the differential impacts of air movement at varying levels due to changes in density.
2.7 Extreme value analysis of precipitation
The study employs the block maxima approach for extreme value analysis of the annual daily rainfall maxima. According to Coles (2001), let X1, …, Xk be a sequence of k independent and identically distributed variables. The methodology involves defining blocks of n observations and selecting the maximum within each block (Ferreira and de Haan, 2015). This process yields a vector of N maxima Z1, …, ZN, where N is the total number of blocks. For a sufficiently large n, the distribution of block maxima can be approximated by the GEV which is characterized by three parameters: location μ, scale σ>0, and shape ξ (Otten and Van Montfort, 1980). It is widely used to describe the distribution of annual rainfall maxima (Panthou et al., 2012; Tramblay et al., 2012; Sane et al., 2018; Laux et al., 2023). The estimation of the parameters of the GEV distribution is done with maximum likelihood estimation (MLE, Pan and Fang 2002).
3 Results
On September 6, 2020, at 6:00 UTC, the rainfall recorded over the previous 24 h at Diourbel, Dakar-Yoff, and Guédiawaye was notable, with measurements of 135.0, 93.0, and 108.0 mm (Table 1). These totals represent approximately half of the average monthly peak rainfall typically experienced in August, the most intense month of the rainy season (Figure 3). At the Diourbel station, this amount ranks as the fourth highest in its recorded history, exceeded only on August 25, 1935 (175.2 mm), August 26, 1995 (147.1 mm), and September 25, 1978 (143.1 mm). The rainfall record at the Dakar-Yoff station also stands out, ranking as the 16th highest event on record. On the following day, September 7, conditions remained exceptionally wet, with Diourbel registering another 90.0 mm, contributing to a significant 5-day total of 225.45 mm. Similarly, the 5-day totals for Dakar-Yoff and Guédiawaye were 105.4 and 120.4 mm, respectively.
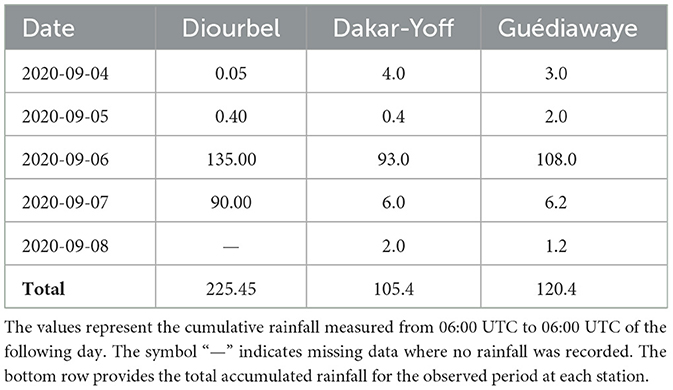
Table 1. Daily rainfall totals [mm] recorded at three different locations in Senegal, Diourbel, Dakar-Yoff, and Guédiawaye, from September 4 to September 8, 2020.
3.1 Synoptic situation from September 4th to September 7th, 2020
Cyclonic circulations in the troposphere over West Africa are often associated with troughs originating from African Easterly Waves (AEWs), which significantly enhance rainfall across the region (Fink, 2003; Berry et al., 2007; Engel et al., 2017; Maranan et al., 2019; Bliefernicht et al., 2022a). Figures 4, 5 illustrate the synoptic conditions and moisture transport, respectively, over consecutive days from September 4th to September 7th, 2020.
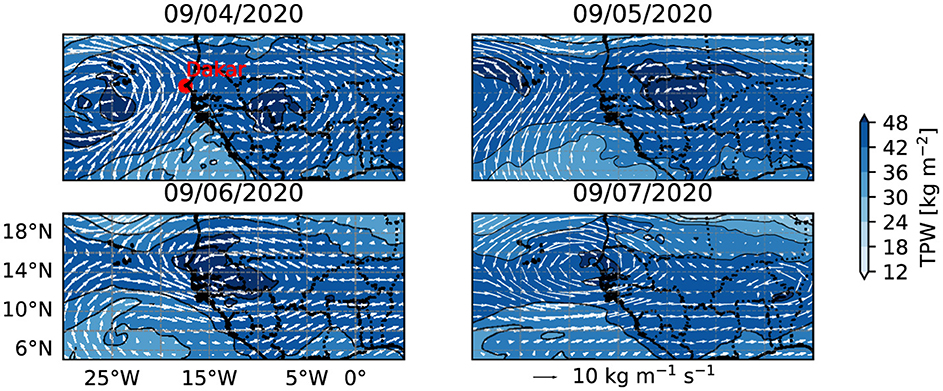
Figure 4. Atmospheric analysis of extreme rainfall. This series of panels visualizes the evolving meteorological conditions from September 4th to September 7th, 2020, leading to significant flooding in the Dakar region. Each panel displays the spatial distribution of total precipitable water (TPW) in the mid-tropospheric layer between 600 and 1,000 hPa. The intensity of the moisture content is denoted by the color shading, with darker regions indicating higher TPW levels. Streamlines trace the mass-weighted atmospheric flow, delineating the dynamic patterns associated with the African Easterly Wave (AEWs). This confluence of heightened TPW and coherent circulation is instrumental in driving the substantial rainfall that resulted in widespread flooding during the observed interval.
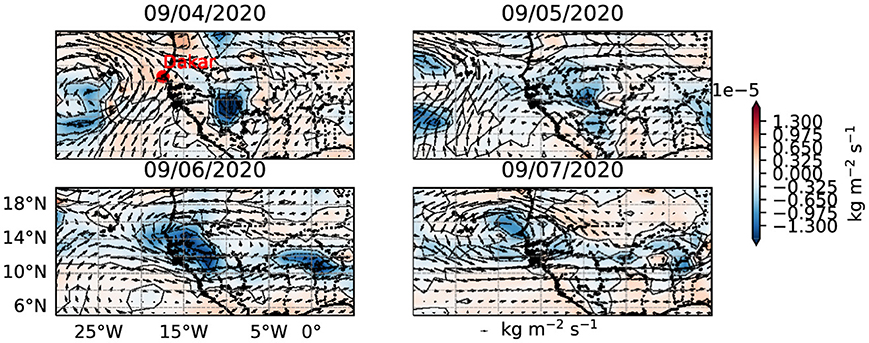
Figure 5. Moisture transport (vectors) and its divergence (contour) for September 4–7, 2020. Negative values of negative divergence represent convective zones. The vectors illustrate vertically integrated moisture transport between 950 and 600 hPa and the associated divergence, revealing significant moisture sources in the South Atlantic Ocean and their impact on precipitation patterns in the West African region, particularly in relation to the Gulf of Guinea monsoon flow and westward flow along the Atlantic coast.
Figure 4 shows the PWV values within the 600–1,000 hPa atmospheric layer, with blue shading indicating moisture levels—darker shades represent higher moisture levels. Streamlines chart the mass-weighted atmospheric flow at these pressure levels, tracing the progression and evolution of air masses. Figure 5 depicts the vertically integrated moisture transport between 950 and 600 hPa, shown as vectors, along with the associated flux divergence (contours) in blue for the same period.
On September 4th, two consecutive high cyclonic circulations associated with notable concentrations of PWV are observed. The first circulation is near the Cape Verde Islands (25°W, 15°N), while the second is over southeastern Mali (5°W, 15°N). This second cyclonic circulation is linked to flooding in Dakar 24 h later. These circulations, ~2,000 km apart, match the typical wavelength of an AEW, exhibiting its characteristic wave-like structure (Fink, 2003; Kiladis et al., 2006; Dieng et al., 2014). Concurrently, Figure 5 shows significant convergence with two maxima: one east of Senegal and the other in the tropical South Atlantic Ocean. This indicates the presence of humid and unstable air, driven by a strong moisture flux from the Gulf of Guinea associated with the summer rainy season in West Africa (Thorncroft et al., 2011). Additionally, weak divergence around Dakar suggests a lack of vertical atmospheric movement, promoting stagnant weather conditions.
By September 5th, the synoptic configuration advances northwestward. The first trough moves further toward the Atlantic basin, while the second, associated with extreme rainfall, intensifies, reaching Senegal. PWV values remain elevated, and the flow pattern becomes more distinct and structured, indicative of a well-defined and intensifying AEW that could enhance regional rainfall. In Figure 5, the northward advancement of the southwest monsoon flow carries moisture, reinforcing the displacement of the convergence observed the previous day, thereby promoting the system's progression.
On September 6th, the AEW's imprint is distinct, with a well-defined wave structure extending from the African mainland into the Atlantic. The peak PWV zone migrates westward, consistent with the wave's trajectory. A pronounced mass-weighted atmospheric flow near 14°N suggests a wave system likely contributing to substantial rainfall totals. This period marks the peak rainfall that led to the flood event, with the cyclonic vortex centered over Senegal and PWV values peaking above it. Concurrently, Figure 5 shows that a moisture flux from the north, often accompanied by dust, inhibits the system's progression by creating areas of relatively low pressure. This promotes the rise of humid air, leading to condensation and cloud formation, thus contributing to the heavy precipitation recorded during this extreme event.
On September 7th, the system gradually moves away from the Senegalese coast, later intensifying into Tropical Storm Rene near the Cape Verdean coast (Cangialosi, 2021). In Figure 5, a dissipation of the convergence system is observed, due to a reduced influx of moisture from the Gulf of Guinea and the introduction of dry air from the north, resulting in low precipitation. This is consistent with the work of Lélé et al. (2015), who found that as the monsoon retreats, harmattan winds bring back dry air and aerosols, contributing to the dissipation of convergence.
These observations are further supported by the Hovmöller diagrams showing the zonal progression of AEWs (Berry et al., 2007; Bain et al., 2011, 2014). In our study, we focus on the meridionally averaged relative vorticity at the 700 hPa pressure level, specifically between 5°N and 15°N. Figure 6 presents a sequence of distinct AEW vortices moving westward between September 4 and September 7, 2020. The diagram uses varying shades of red to signify the vorticity strength; deeper red tones correspond to more intense cyclonic activity. A vertical dashed line crosses the diagram at the longitude of Dakar, marking the transit of an AEW through this region on September 6, 2020. The passage of this vorticity event is a strong indicator of the AEW's evolution and its potential contribution to heightened cyclonic dynamics in the area.
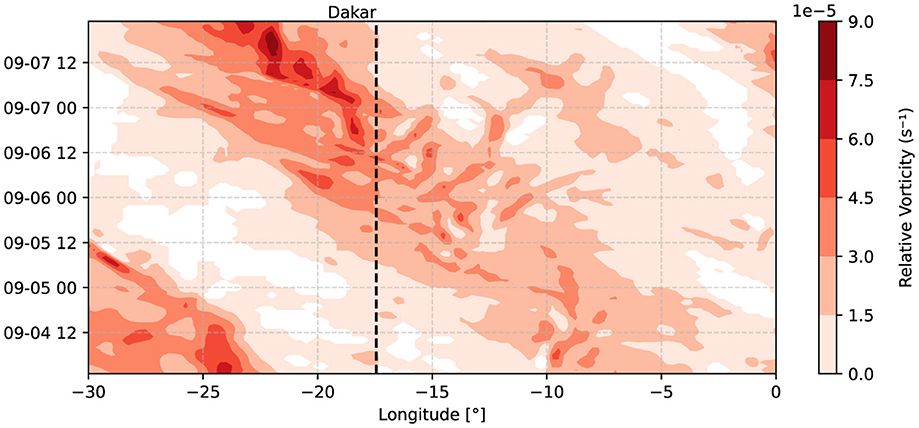
Figure 6. Hovmöller diagram of relative vorticity over West Africa. This diagram illustrates the longitudinal distribution of relative vorticity from September 4 to September 7, 2020. Shades of red indicate the strength of vorticity, with darker tones denoting higher values, suggestive of stronger cyclonic activity. Only positive values are displayed.
These results demonstrate how cyclonic circulations and AEWs interact to influence extreme rainfall events in West Africa, highlighting the importance of monitoring these systems for water resource management and flood prevention. They illustrate not only the evolution of the AEW but also its potential to intensify cyclonic dynamics in the area. The increase in vorticity at the time of this passage is a strong indicator that the AEW may have contributed to the extreme rainfall observed in Dakar and its surroundings. In other words, the vortices shown in these figures illustrate how AEWs can influence the formation of significant rainfall systems, emphasizing their key role in the climatic variability of the region.
3.2 Comparative analysis of CHIRPS and IMERG rainfall data
Figures 7, 8 illustrate the spatial distribution of daily rainfall accumulations over Senegal from September 4–7, 2020, as represented by IMERG and CHIRPS. Our analysis revealed distinct spatial and temporal rainfall patterns. CHIRPS shows a progressive increase in rainfall from September 4, reaching a peak on September 6. On September 4, moderate rainfall was observed, with the highest concentrations located southward in Senegal. By September 5, this evolved into a more intense and widespread event, with northward progression. The most substantial rainfall, according to CHIRPS, occurred on September 6, enveloping a vast region with heavy rainfall, especially central to Senegal. However, on September 7, there was a reduction in rainfall, with large areas showing minimal to no rainfall, coinciding with the post-event assessment period.
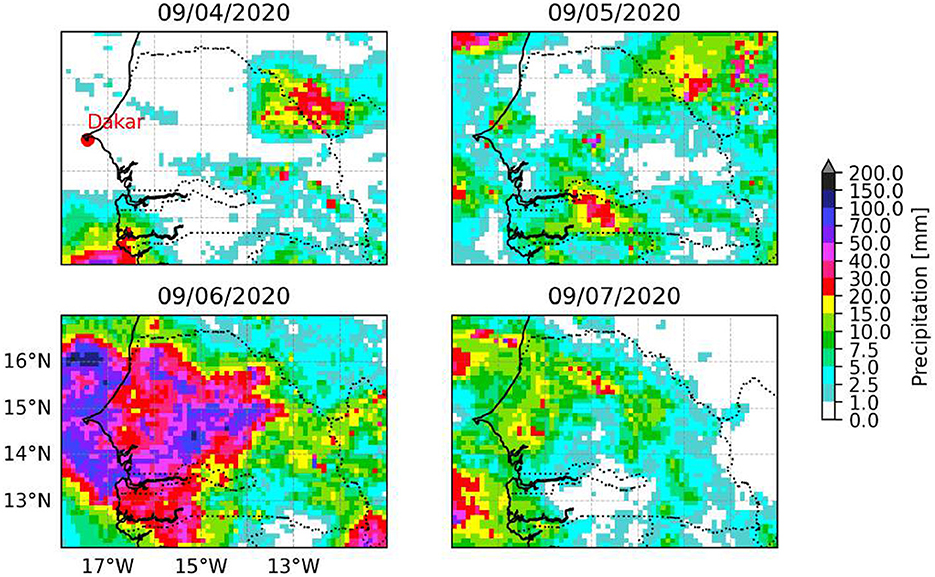
Figure 7. Spatial representation of daily rainfall accumulations [mm] from IMERG for September 4–7, 2020 over Senegal. Each panel displays the rainfall for a specific day, where the color coding—from light blue to red—denotes the intensity of rainfall, with red patches indicating areas of highest rainfall. The fine-scale resolution of the dataset reveals a detailed pattern of convective rainfall activities, particularly on September 6, which are not as extensively represented on September 7. These panels highlight the variability and localized nature of rainfall captured by the IMERG dataset, with Dakar indicated to provide a point of reference.
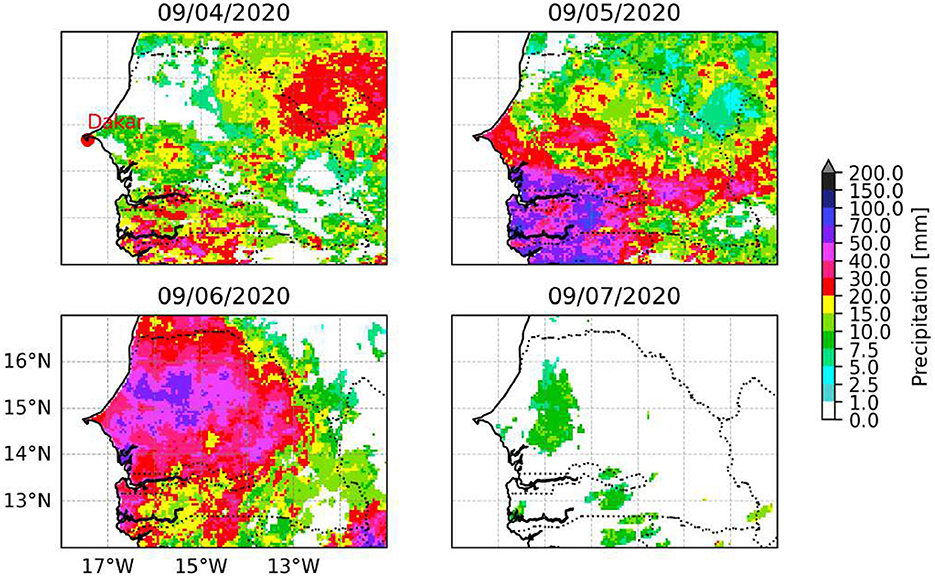
Figure 8. Spatial representation of daily rainfall accumulations [mm] from CHIRPS for September 4–7, 2020, over Senegal. Each panel corresponds to a single day, illustrating the spatial distribution of rainfall across the region. The color gradient represents total daily rainfall in millimeters, with blue indicating lower values and red to purple indicating higher values, reaching up to 200 mm. The peak of the rainfall event is captured on September 6, with a notable decrease by September 7. This sequence showcases the progression and regression of an extreme rainfall event impacting the region, with Dakar marked for geographic reference.
In contrast, IMERG presented a more granular and patchy distribution of rainfall. On September 4 and 5, localized intense rainfall events were scattered throughout the region, with IMERG capturing smaller-scale convective processes that CHIRPS generalized. On September 6, IMERG highlighted intense, localized events even more distinctly, though the coverage was less extensive than what CHIRPS depicted. Here, a strong increase in rainfall over the Dakar region can be observed. By September 7, similar to CHIRPS, IMERG showed a reduction in rainfall, yet with a continued presence of moderate rainfall in certain areas. In general, CHIRPS suggested a more generalized, region-wide rainfall event, as evidenced by the consistent spread of moderate to high rainfall across all 3 days. Conversely, IMERG depicted a sharper increase in rainfall, indicating intense, localized rainfalls, particularly on September 6.
A notable discrepancy emerged when comparing CHIRPS and IMERG with ground-based observations recorded at Diourbel, Dakar-Yoff, and Guédiawaye from September 4 to September 8, 2020. The observed data indicated significantly higher rainfall totals on September 6 and 7, particularly in Diourbel (135.00 and 90.00 mm) and Guédiawaye (108.00 and 6.20 mm). These totals contrast with those reported by CHIRPS and IMERG, which showed lower values for these dates (Figure 9). The total accumulated rainfall from September 4 to September 8, 2020, as per the observations, was 225.45 mm for Diourbel, 105.4 mm for Dakar-Yoff, and 120.4 mm for Guédiawaye. These totals are significantly higher than both the CHIRPS and IMERG estimates, highlighting a consistent underestimation of rainfall by the satellite datasets during this extreme rainfall event.
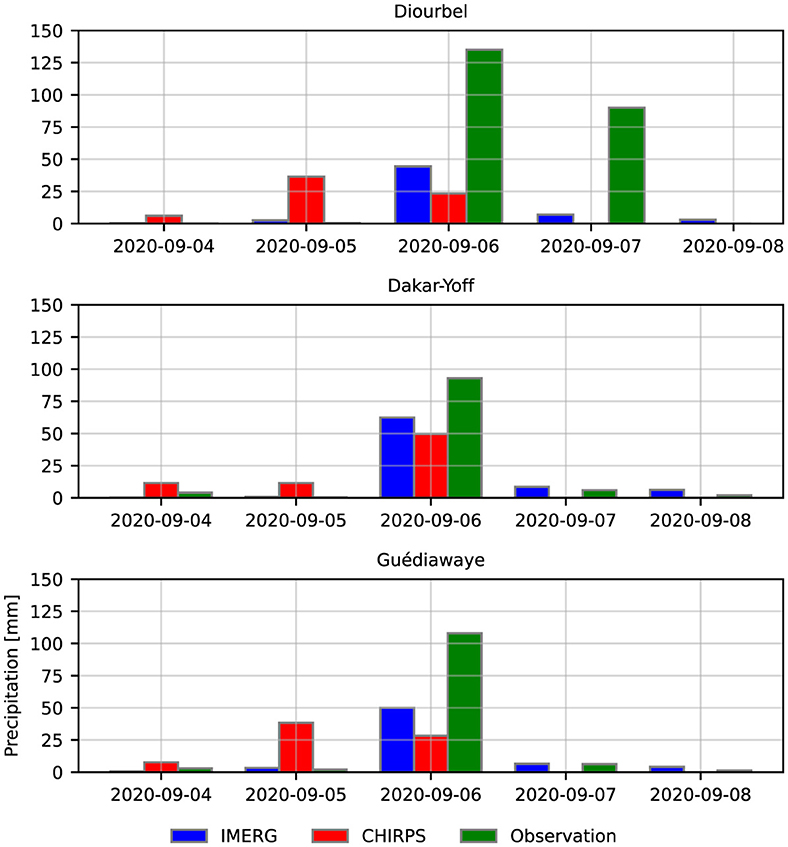
Figure 9. Point-to-pixel analysis from Diourbel, Dakar-Yoff, and Guédiawaye stations (green bars) with respect to CHIRPS (red bars) and IMERG (blue bars) of daily rainfall accumulations [mm] for September 4–7, 2020, over Senegal.
In the observed period from September 5 to September 6, 2020, Figure 10 compares the in-situ observations from Guédiawaye with IMERG on an hourly basis. The in-situ observations are depicted by the blue line with circular markers, while IMERG data are indicated by the red line with “x” markers. Initially, both datasets capture the first rainfall peak in the afternoon, although the IMERG estimates are lower. As the rainfall events progress, a second significant peak is observed after 18:00 on September 5, with the in-situ measurements showing a maximum of 47.7 mm at 20:00. However, IMERG does not reflect this second peak, suggesting a limitation in detecting certain high-intensity rainfall events. Apart from these peaks, both observation methods record low and comparable levels of rainfall.
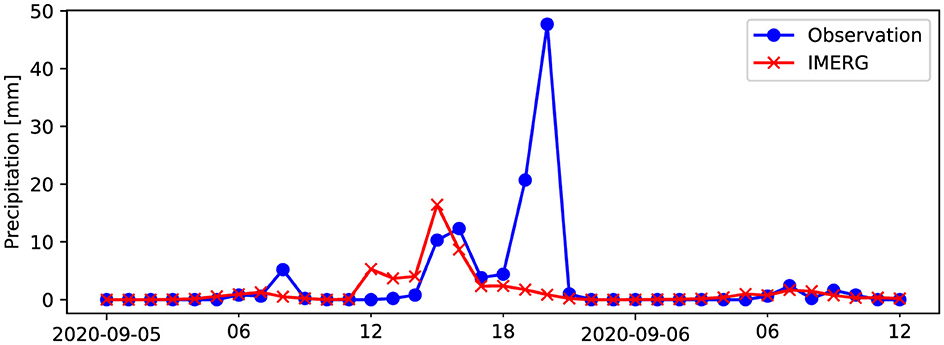
Figure 10. Comparative analysis of rainfall data from in-situ observations (blue line with circles) and IMERG satellite estimates (red line with “x” markers) from September 5 to September 6, 2020 based on a point-to-pixel analysis on hourly-basis. Both data sources capture the initial peak in rainfall, yet IMERG fails to detect the second, more pronounced peak observed at 18:00 on September 5. This discrepancy highlights potential limitations of the IMERG satellite in capturing high-intensity rainfall events.
Our results underscore the importance of combining satellite data with ground observations for an accurate assessment of extreme rainfall events. While CHIRPS provides an overview of regional trends, IMERG is able to capture localized intense events. However, the underestimation of rainfall by these remote sensing systems indicates a need for improvements in the models used to predict extreme rainfall events in West Africa.
3.3 Extreme value analysis
To detect the general use of CHIRPS and IMERG in representing extremes in their records, we use return level plots based on the GEV distribution. Figure 11 presents a direct comparative illustration of these products for two stations (Dakar-Yoff and Diourbel). In the case of Dakar-Yoff, it is observed that CHIRPS data tends to consistently underestimate return levels, a trend that becomes more pronounced with higher return periods. In contrast, IMERG overestimates return levels for Diourbel, indicating a regional overprediction. CHIRPS exhibits a persistent trend of underestimation in return levels at both locations, with deviations from ground observations becoming increasingly evident for events characterized by higher return levels. This underestimations intimates a systematic shortfall in the CHIRPS methodology regarding the quantification of extreme rainfall events. The dichotomous performance of IMERG—its underestimation at Dakar-Yoff and overestimation at Diourbel—draws attention to the inherent challenges of satellite rainfall estimation techniques, which may exhibit variable accuracies across diverse geographic settings. Such disparities accentuate the critical need for region-specific calibration of these satellite products to bolster their predictive veracity for analyzing extreme weather events.
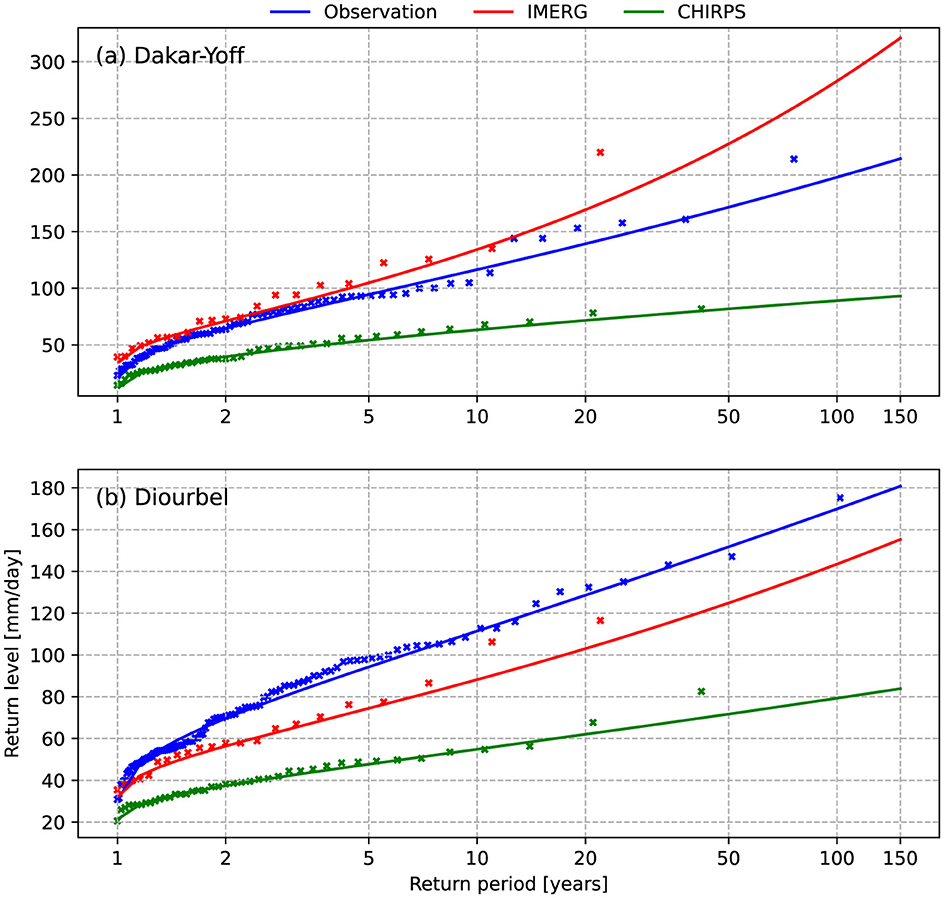
Figure 11. Return level plots for Dakar-Yoff (a) and Diourbel (b) comparing observed rainfall data with estimates from IMERG and CHIRPS on point-to-pixel comparison, based on the generalized extreme value (GEV) distribution. The return period in years is plotted against the return level in mm/day. The observed data (blue), IMERG estimates (red), and CHIRPS estimates (green) are shown. IMERG estimates exhibit a closer fit to the observed data, especially for higher return levels, while CHIRPS estimates show noticeable deviations.
4 Discussion
This study presents an in-depth investigation of a recent high-impact flooding event in West Africa, focusing on the Dakar flood that occurred on September 5, 2020. Using several key resources, we explored the synoptic-dynamic evolution of this event and derived robust statistical return values. The resources used include long-term daily rainfall records for Senegal, satellite-derived rainfall estimation datasets (CHIRPS and IMERG), and high-resolution reanalysis datasets from ERA5. These resources provided the foundation for a detailed analysis of the atmospheric conditions leading to the flood, particularly highlighting the movement of a cyclonic vortex in combination with an AEW that transported moisture to the affected region, resulting in rainfall measurements exceeding 100 mm.
The comparative analysis between CHIRPS and IMERG allowed us to map the daily rainfall accumulations over Senegal, enabling a spatial comparison of the rainfall during this critical period. A point-to-pixel analysis using local station data was conducted to assess the accuracy and reliability of the satellite-derived datasets. Additionally, an hourly-based analysis comparing in-situ observations with IMERG estimates for September 5–6 provided valuable insights into the temporal dynamics of the rainfall event. By applying GEV distribution, we generated return level plots for ground-based observations and compared them with CHIRPS and IMERG estimates. This provided a statistical framework for understanding the magnitude and likelihood of extreme rainfall events like the one observed in Dakar.
4.1 Synoptic dynamics and the progression of the cyclonic vortex
Our synoptic analysis indicates that cyclonic circulations (likely AEWs), played a significant role in enhancing rainfall intensity. The interaction of AEWs with local conditions, such as high PWV values and the convergence of moist air masses, generated the atmospheric instability necessary for heavy rainfall. This pattern is consistent with the findings of Fink (2003) and Bliefernicht et al. (2022a), who documented the critical role of AEWs and cyclonic circulations in modulating rainfall events across West Africa.
In this case, the interaction of successive AEWs appears to have been crucial in triggering the extreme rainfall. Specifically, the first vortex, located off the coast of Senegal, acted as a block to the second vortex situated directly over Senegal. The first vortex, associated with a strong low-level cyclonic circulation, enhanced the westerly flow, supplying additional moisture to the second vortex. This blocking effect likely slowed the eastward progression of the second vortex, allowing it to remain longer over Senegal, where it received a steady supply of moisture from the westerly flow. This stalling effect, combined with the added moisture, explains the prolonged rainfall (~10 h). These findings align with Dieng et al. (2017), who demonstrated that AEWs frequently evolve into tropical depressions off the West African coast, often interacting with another wave to the west. In fact, the second vortex in our case developed into Tropical Storm Rene 48 h later, off the coast of Dakar.
The structure of relative vorticity at 700 hPa allows tracking the evolution of the wave associated with tropospheric instability. The presence of two vortices, located northeast of Senegal, propagating westward, indicates increased atmospheric divergence, leading to drier conditions associated with high-pressure areas and more stable atmospheric conditions. The east-west propagation of the African equatorial wave over Senegal is associated with the occurrence and intensity of extreme rainfall events and is consistent with the studies of several authors (Lavaysse et al., 2006; Diedhiou et al., 1999; Semunegus et al., 2017). The presence of this wave has induced tropospheric moisture and provided synoptic forcing for the genesis of MCS. A significant incursion of monsoon flow was observed over southwest Senegal, extending into the lower levels at 925 hPa. This resulted in a significant presence of moisture, spreading westward and marked by high values of PWV. Lafore et al. (2017) established that a significant pre-existing penetration of monsoon flow into the eastern Sahel led to a large-scale wet period marked by high levels of PWV in the eastern Sahel region, gradually spreading westward. Additionally, moisture from the ocean and convergence of air masses from the east contributed to significant precipitation, enhanced by the monsoon influx. A significant moisture flux headed southwestward to Senegal, fueled by converging air currents from the east and south. This configuration favored the ascent of air masses, thus triggering strong convection, responsible for the intense rains observed during the extreme event in the central-western and southwestern regions of Senegal.
Moreover, similar to the study by Lafore et al. (2017) on the multi-scale analysis of the extreme rainfall event in Ouagadougou in 2009, our study also highlighted the role of AEWs in the intensification of precipitation on September 5. However, a significant limitation is the lack of a more detailed analysis of the interactions between AEWs and other meteorological factors, such as upper-level jets and sea surface temperature anomalies. Additionally, we did not examine other factors, such as the activity of various atmospheric waves, including Kelvin waves and equatorial Rossby waves. These meteorological elements are known to influence precipitation variability in West Africa, and future studies should also focus on their combined impact to improve our understanding of extreme rainfall events.
4.2 Satellite rainfall estimation
In this study, an analysis of rainfall data derived from gauge measurements, IMERG, and CHIRPS was conducted to assess their effectiveness in capturing extreme rainfall events. Our findings indicate that IMERG generally provides a better approximation of extreme rainfall events compared to CHIRPS, despite a tendency to underestimate rainfall amounts when benchmarked against gauge data from September 5, 2020. One notable limitation of IMERG, however, is its failure to capture the significant rainfall peak on September 5, 2020. This discrepancy may be attributed to the limitations of satellite sensors in detecting the rapid evolution of convective systems, particularly in regions with intense local precipitation. This finding is in line with Maranan et al. (2020), where they note that high rainfall intensities are negatively biased in IMERG based on evaluations using a mesoscale rain gauge network in Ghana. Interestingly, they state that IMERG overestimates the rainfall amount from frequently occurring weak convective events, while the rainfall from relatively rare but strong MCSs is underestimated.
Similarly, studies by Dinku et al. (2018) and Lu (2022) observed significant negative biases in regions with intense convective precipitation, further highlighting the difficulty satellite measurements face in accurately capturing peak rainfall intensities. However, other studies, such as Dembélé and Zwart (2016), have reported more robust performances of satellite rainfall estimates in geographical areas where strong convection has a lesser impact on precipitation. This divergence underscores the inherent limitations of satellite products like IMERG, which, while effective for certain types of events, struggle to capture the complex dynamics of high-intensity convective events, especially in environments like Dakar.
The use of return level plots based on the GEV distribution to compare observed rainfall data with estimates from IMERG and CHIRPS has provided quantitative insights into their comparative reliability. Notably, IMERG exhibits superior alignment with observed data, especially at the highest return levels, indicating its greater effectiveness in estimating extreme rainfall events compared to CHIRPS. This finding highlights the critical importance of selecting the appropriate datasets for the accurate assessment and prediction of extreme weather events. This aligns with a validation study from Equatorial East Africa that also concludes IMERG, among others, shows the closest agreement with rain gauges for return values analysis, while CHIRPS should be avoided for this purpose (Ageet et al., 2022). However, the application of CHIRPS with extreme rainfall indices (R10mm, PRCPTOT, R95p, etc.) may be suitable for Ghana (Atiah et al., 2020).
A pivotal consideration in this comparative analysis is the inherent disparity between point measurements (gauge data) and pixel-based estimates (IMERG and CHIRPS). The gauge data provide precise, location-specific rainfall measurements, offering a high-resolution view of rainfall at a particular point. In contrast, satellite-derived products like IMERG and CHIRPS aggregate rainfall over larger spatial scales, encapsulated within each pixel of their datasets. This fundamental difference in scale introduces a methodological challenge, rendering a direct comparison between these datasets somewhat inequitable.
Although various initiatives have made notable progress in enhancing meteorological networks (van de Giesen et al., 2014; Galle et al., 2018; Bliefernicht et al., 2018; Schunke et al., 2021; Sawadogo et al., 2023; Nadolski et al., 2024; Sy et al., 2024), the scarcity of in-situ observations continues to be a significant issue in West Africa (Salack et al., 2019; Bliefernicht et al., 2022b). Accurate observational data is essential not only for evaluating the hydrological impacts of extreme rainfall events (Beck et al., 2017) but also for ensuring reliable assessments and improvement of remote sensing products.
Although discrepancies exist, such as the timing mismatch of the second peak in GPM IMERG compared to in-situ observations, satellite products hold significant potential for early warning systems. They can help compensate for the lack of rain gauge data, enabling more effective monitoring of rainfall-related risks, delivering timely early warnings, and ultimately improving disaster risk management (Boluwade, 2020; Ma et al., 2020; Houngnibo et al., 2023). However, these biases, particularly the underestimation of intense convective events, could result in insufficient preparedness for extreme rainfall-related disasters, underscoring the need for continuous improvement and validation of these products in operational settings.
One limitation of our study is the lack of validation of satellite products over a more extended period or in geographically diverse areas. A longer-term analysis across different meteorological conditions could provide a more nuanced understanding of the performance of these products. Furthermore, although our results indicate that IMERG and CHIRPS underestimate precipitation, it is important to note that these products are continuously being improved, with recent versions showing significant enhancements in accuracy (Maranan et al., 2019). However, challenges remain, particularly in capturing extreme precipitation events, which are often associated with rapid and localized convective phenomena that are difficult for satellite sensors to detect. Future work should focus on integrating ground-based observations with innovative techniques to enhance the performance of satellite-based rainfall estimates in detecting extreme events. Machine learning approaches could help refine models by better accounting for local convective processes, thereby improving the detection and prediction of high-intensity rainfall.
5 Summary and conclusion
This work provides valuable insights into the extreme rainfall event that occurred on September 5, 2020, in the Dakar region of West Africa. From September 4 to 7, 2020, we illustrate the meteorological developments using ERA5 reanalysis data to demonstrate the spatial distribution of moisture content and the atmospheric mass-weighted wind fields in the mid-troposphere, elucidating the dynamic patterns associated with AEWs. This visual analysis provided a foundational understanding of the conditions leading up to the flooding. Notably, rainfall measurements on that day were significant, with Diourbel, Dakar-Yoff, and Guédiawaye recording 135.0, 93.0, and 108.0 mm of rainfall, respectively. These measurements were approximately half of the average monthly peak rainfall typically experienced in August, underscoring the intensity of the event. To better understand the meteorological conditions leading up to this event, the study conducted a detailed synoptic analysis from September 4 to September 7, 2020. Using PWV and atmospheric flow patterns, we tracked the progression and evolution of air masses associated with AEWs. The presence of high PWV values along the trajectory of the AEWs indicated the moisture-rich nature of this weather system, a key factor contributing to heavy rainfall. The study also performed a comparative analysis of rainfall data from two satellite sources, CHIRPS and IMERG, with ground-based observations. CHIRPS provided a more generalized, region-wide rainfall pattern, while IMERG highlighted intense, localized rainfall events. However, ground-based observations consistently recorded higher rainfall totals during the extreme event compared to both CHIRPS and IMERG, revealing an underestimation by the satellite datasets. To further assess the representation of extreme rainfall events, the study utilized GEV distribution and return level plots. These plots indicated that IMERG tended to consistently underestimate return levels at one station and overestimate them at another. Similarly, CHIRPS exhibited a persistent trend of underestimation in return levels at both locations, particularly for events characterized by higher return levels. In summary, this study provides a comprehensive overview of the extreme rainfall event in West Africa, emphasizing the need for accurate rainfall data and an understanding of synoptic conditions. This case study integrates the analysis of local meteorological phenomena, understanding of basic meteorological mechanisms, and assessment of the performance of satellite data products. Additionally, it emphasizes the importance of regional weather conditions (e.g., AEWs) in regulating extreme precipitation, which can have significant implications for climate risk management and adaptation planning in the region. The findings have implications for improving disaster preparedness and policy-making in a region increasingly vulnerable to the impacts of climate change.
Although this study provides valuable insights into the meteorological dynamics that led to this extreme event, several aspects could be expanded upon in future research. First, a more comprehensive validation of satellite products, using denser rain gauge networks over longer time periods, is essential for refining the accuracy and performance of satellite data. Second, relying on a single case study limits the generalizability of the findings; investigating additional events would help confirm and strengthen the results. Moreover, future studies should incorporate the analysis of other meteorological factors, such as upper-level jets, sea surface temperature anomalies, and atmospheric waves, including Kelvin and equatorial Rossby waves. Finally, a thorough assessment of the socio-economic impacts of extreme precipitation events, combined with hydraulic modeling, would provide critical insights for improving climate risk management policies. Such an approach would enhance early warning systems, bolster community adaptation strategies, and reinforce the resilience of infrastructure and populations. Addressing these research gaps will not only build on the findings of this study but also contribute to greater preparedness and resilience as extreme weather events become more frequent and intense due to climate change.
Data availability statement
The hourly in-situ rainfall data was generously provided by the Agence Nationale de l'Aviation Civile et de la Météorologie (ANACIM). The daily rainfall records were sourced from KASS-D and the WAHPD, neither of which is publicly accessible. The CHIRPS rainfall dataset can be accessed and downloaded at https://data.chc.ucsb.edu/products/CHIRPS-2.0/. The GPM IMERG rainfall dataset is available for download at https://doi.org/10.5067/GPM/IMERG/3B-HH/07. The reanalysis data from ERA5 can be accessed via the Copernicus Climate Data Store at https://cds.climate.copernicus.eu/.
Author contributions
SD: Conceptualization, Data curation, Formal analysis, Methodology, Software, Validation, Visualization, Writing – original draft, Writing – review & editing. MR: Conceptualization, Data curation, Formal analysis, Methodology, Software, Validation, Visualization, Writing – original draft, Writing – review & editing. AL: Formal analysis, Validation, Visualization, Writing – original draft, Writing – review & editing. JB: Formal analysis, Supervision, Validation, Visualization, Writing – original draft, Writing – review & editing. SSy: Writing – original draft, Writing – review & editing. SSa: Writing – original draft, Writing – review & editing. HK: Writing – original draft, Writing – review & editing.
Funding
The author(s) declare financial support was received for the research, authorship, and/or publication of this article. This study is part of the FURIFLOOD (Current and future risks of urban and rural flooding in West Africa, grant number: 01LG2086D) project and CONCERT project (Concerted Regional Modeling and Observation Assessment for Greenhouse Gas Emissions and Mitigation Options under Climate and Land Use Change in West Africa, grant number: 01LG2089A), which was funded by the Federal Ministry of Education and Research in Germany.
Acknowledgments
We would like to thank our partners involved in the FURIFLOOD project for their support. Special thanks to Andreas Fink and Marlon Maranan from Karlsruhe Institute of Technology for providing the additional rainfall data from KASS-D database for this analysis. Data processing, handling, and manipulation were done with xarray, numpy, and pandas in Python. The figures were generated using matplotlib. Manuscript drafting and formatting were done in LaTeX on the Overleaf platform. ChatGPT-4 assisted with spell-checking and grammar improvement. We also thank Dr. Youssouph Sané from ANACIM for providing the flood images shown in Figure 1.
Conflict of interest
The authors declare that the research was conducted in the absence of any commercial or financial relationships that could be construed as a potential conflict of interest.
Publisher's note
All claims expressed in this article are solely those of the authors and do not necessarily represent those of their affiliated organizations, or those of the publisher, the editors and the reviewers. Any product that may be evaluated in this article, or claim that may be made by its manufacturer, is not guaranteed or endorsed by the publisher.
References
Ageet, S., Fink, A. H., Maranan, M., Diem, J. E., Hartter, J., Ssali, A. L., et al. (2022). Validation of satellite rainfall estimates over equatorial East Africa. J. Hydrometeorol. 23, 129–151. doi: 10.1175/JHM-D-21-0145.1
Agyekum, J., Amekudzi, L. K., Stein, T., Aryee, J. N., Atiah, W. A., Adefisan, E. A., et al. (2023). Verification of satellite and model products against a dense rain gauge network for a severe flooding event in Kumasi, Ghana. Meteorol. Appl. 30:e2150. doi: 10.1002/MET.2150
Akinsanola, A. A., Ogunjobi, K. O., Ajayi, V. O., Adefisan, E. A., Omotosho, J. A., and Sanogo, S. (2017). Comparison of five gridded precipitation products at climatological scales over West Africa. Meteorol. Atmos. Phys. 129, 669–689. doi: 10.1007/s00703-016-0493-6
Atiah, W. A., Amekudzi, L. K., and Danuor, S. K. (2023). Mesoscale convective systems and contributions to flood cases in Southern West Africa (SWA): a systematic review. Weather Clim. Extr. 39:100551. doi: 10.1016/j.wace.2023.100551
Atiah, W. A., Tsidu, G. M., and Amekudzi, L. K. (2020). Investigating the merits of gauge and satellite rainfall data at local scales in Ghana, West Africa. Weather Clim. Extr. 30:100292. doi: 10.1016/J.WACE.2020.100292
Bain, C. L., Parker, D. J., Dixon, N., Fink, A. H., Taylor, C. M., Brooks, B., et al. (2011). Anatomy of an observed African easterly wave in July 2006. Quart. J. Royal Meteorol. Soc. 137, 923–933. doi: 10.1002/QJ.812
Bain, C. L., Williams, K. D., Milton, S. F., and Heming, J. T. (2014). Objective tracking of African Easterly Waves in Met Office models. Quart. J. Royal Meteorol. Soc. 140, 47–57. doi: 10.1002/QJ.2110
Beck, H. E., Vergopolan, N., Pan, M., Levizzani, V., van Dijk, A. I. J. M., Weedon, G. P., et al. (2017). Global-scale evaluation of 22 precipitation datasets using gauge observations and hydrological modeling. Hydrol. Earth Syst. Sci. 21, 6201–6217. doi: 10.5194/hess-21-6201-2017
Berry, G., Thorncroft, C., and Hewson, T. (2007). African easterly waves during 2004—analysis using objective techniques. Monthly Weather Rev. 135, 1251–1267. doi: 10.1175/MWR3343.1
Bliefernicht, J., Berger, S., Salack, S., Guug, S., Hingerl, L., Heinzeller, D., et al. (2018). The WASCAL hydrometeorological observatory in the Sudan Savanna of Burkina Faso and Ghana. Vadose Zone J. 17, 1–20. doi: 10.2136/vzj2018.03.0065
Bliefernicht, J., Rauch, M., Laux, P., and Kunstmann, H. (2022a). Atmospheric circulation patterns that trigger heavy rainfall in West Africa. Int. J. Climatol. 42, 6515–6536. doi: 10.1002/joc.7613
Bliefernicht, J., Salack, S., Waongo, M., Annor, T., Laux, P., and Kunstmann, H. (2022b). Towards a historical precipitation database for West Africa: overview, quality control and harmonization. Int. J. Climatol. 42, 4001–4023. doi: 10.1002/joc.7467
Boluwade, A. (2020). Remote sensed-based rainfall estimations over the East and West Africa regions for disaster risk management. ISPRS J. Photogram. Rem. Sens. 167, 305–320. doi: 10.1016/j.isprsjprs.2020.07.015
Cangialosi, J. P. (2021). Tropical Storm Rene—7–14 September 2020. National Hurricane Center. Available at: https://www.nhc.noaa.gov/data/tcr/AL182020_Rene.pdf
Dembélé, M., and Zwart, S. J. (2016). Evaluation and comparison of satellite-based rainfall products in Burkina Faso, West Africa. Int. J. Rem. Sens. 37, 3995–4014. doi: 10.1080/01431161.2016.1207258
Diedhiou, A., Janicot, S., Viltard, A., De Felice, P., and Laurent, H. (1999). Easterly wave regimes and associated convection over west Africa and tropical Atlantic: results from the NCEP/NCAR and ECMWF reanalyses. Clim. Dyn. 15, 795–822.
Diémé, L. P., Bouvier, C., Bodian, A., and Sidibé, A. (2022). Construction de la topologie de drainage à fine résolution spatiale en milieu urbain: exemple de l'agglomération de dakar (sénégal). LHB 108:2061313. doi: 10.1080/27678490.2022.2061313
Dieng, A. L., Eymard, L., Sall, S. M., Lazar, A., and Leduc-Leballeur, M. (2014). Analysis of strengthening and dissipating mesoscale convective systems propagating off the West African coast. Month. Weather Rev. 142, 4600–4623. doi: 10.1175/MWR-D-13-00388.1
Dieng, A. L., Sall, S. M., Eymard, L., Leduc-Leballeur, M., and Lazar, A. (2017). Trains of african easterly waves and their relationship to tropical cyclone genesis in the Eastern Atlantic. Month. Weather Rev. 145, 599–616. doi: 10.1175/MWR-D-15-0277.1
Dinku, T., Funk, C., Peterson, P., Maidment, R., Tadesse, T., Gadain, H., et al. (2018). Validation of the chirps satellite rainfall estimates over Eastern Africa. Quart. J. Royal Meteorol. Soc. 144, 292–312. doi: 10.1002/qj.3244
Doswell, C. A., and Rasmussen, E. N. (1994). The effect of neglecting the virtual temperature correction on CAPE calculations. Weather Forecast. 9, 625–629.
Engel, T., Fink, A. H., Knippertz, P., Pante, G., and Bliefernicht, J. (2017). Extreme precipitation in the West African cities of Dakar and Ouagadougou: atmospheric dynamics and implications for flood risk assessments. J. Hydrometeorol. 18, 2937–2957. doi: 10.1175/JHM-D-16-0218.1
Fall, M., Lahat Dieng, A., Sall, S. M., Sane, Y., and Diakhaté, M. (2020). Synoptic analysis of extreme rainfall event in West Africa: the case of Linguère. Am. J. Environ. Protect. 8, 1–9. doi: 10.12691/env-8-1-1
Ferreira, A., and de Haan, L. (2015). On the block maxima method in extreme value theory: PWM estimators. Annal. Stat. 43:1280. doi: 10.1214/14-AOS1280
Fink, A. H. (2003). Spatiotemporal variability of the relation between African Easterly Waves and West African Squall Lines in 1998 and 1999. J. Geophys. Res. 108:4332. doi: 10.1029/2002JD002816
Fink, A. H. (2010). “Atmosphere,” in Impacts of Global Change on the Hydrological Cycle in West and Northwest Africa (Berlin; Heidelberg: Springer), 132–163.
Fink, A. H., Vincent, D. G., and Ermert, V. (2006). Rainfall types in the West African Sudanian zone during the summer monsoon 2002. Month. Weather Rev. 134, 2143–2164. doi: 10.1175/MWR3182.1
Funk, C., Peterson, P., Landsfeld, M., Pedreros, D., Verdin, J., Shukla, S., et al. (2015). The climate hazards infrared precipitation with stations—a new environmental record for monitoring extremes. Sci. Data 2, 1–21. doi: 10.1038/sdata.2015.66
Galle, S., Grippa, M., Peugeot, C., Moussa, I. B., Cappelaere, B., Demarty, J., et al. (2018). AMMA—CATCH, a critical zone observatory in West Africa monitoring a region in transition. Vadose Zone J. 17, 1–24. doi: 10.2136/vzj2018.03.0062
Gimeno, L., Sorí, R., Vazquez, M., Stojanovic, M., Algarra, I., Eiras-Barca, J., et al. (2022). Extreme precipitation events. Wiley Interdiscipl. Rev. 9:e1611. doi: 10.1002/wat2.1611
Hersbach, H., Bell, B., Berrisford, P., Hirahara, S., Horányi, A., Muñoz-Sabater, J., et al. (2020). The ERA5 global reanalysis. Quart. J. Royal Meteorol. Soc. 146, 1999–2049. doi: 10.1002/QJ.3803
Houngnibo, M. C. M., Minoungou, B., Traore, S. B., Maidment, R. I., Alhassane, A., and Ali, A. (2023). Validation of high-resolution satellite precipitation products over West Africa for rainfall monitoring and early warning. Front. Clim. 5. doi: 10.3389/fclim.2023.1185754
Huffman, G. J., Bolvin, D. T., Braithwaite, D., Hsu, K.-L., Joyce, R. J., Kidd, C., et al. (2020). “Integrated multi-satellite retrievals for the global precipitation measurement (GPM) mission (IMERG),” in Satellite Precipitation Measurement. Advances in Global Change Research, Vol. 67, eds. V. Levizzani, C. Kidd, D. B. Kirschbaum, C. D. Kummerow, K. Nakamura, and F. J. Turk (Cham: Springer). doi: 10.1007/978-3-030-24568-9_19
IFRC (2022). Senegal: Floods in Dakar, Thiès, and Matam Emergency Plan of Action (EPoA) DREF Operation n° MDRSN019—Senegal. ReliefWeb. Available at: https://reliefweb.int/report/senegal/senegal-floods-dakar-thies-and-matam-emergency-plan-action-epoa-dref-operation-ndeg-mdrsn019
Jones, F. (1978). The air density equation and the transfer of the mass unit. J. Res. Natl. Bureau Stand. 83:419.
Kiladis, G. N., Thorncroft, C. D., and Hall, N. M. (2006). Three-dimensional structure and dynamics of African easterly waves. part I: observations. J. Atmos. Sci. 63, 2212–2230. doi: 10.1175/JAS3741.1
Kim, S., Sharma, A., Wasko, C., and Nathan, R. (2022). Linking total precipitable water to precipitation extremes globally. Earth's Fut. 10:2473. doi: 10.1029/2021EF002473
Kouakou, C., Paturel, J. E., Satgé, F., Tramblay, Y., Defrance, D., and Rouché, N. (2023). Comparison of gridded precipitation estimates for regional hydrological modeling in West and Central Africa. J. Hydrol. 47:101409. doi: 10.1016/J.EJRH.2023.101409
Lafore, J.-P., Beucher, F., Peyrillé, P., Diongue-Niang, A., Chapelon, N., Bouniol, D., et al. (2017). A multi-scale analysis of the extreme rain event of Ouagadougou in 2009. Quart. J. Royal Meteorol. Soc. 143, 3094–3109. doi: 10.1002/qj.3165
Laux, P., Weber, E., Feldmann, D., and Kunstmann, H. (2023). The robustness of the derived design life levels of heavy precipitation events in the pre-alpine Oberland Region of Southern Germany. Atmosphere 14:1384. doi: 10.3390/atmos14091384
Lavaysse, C., Diedhiou, A., Laurent, H., and Lebel, T. (2006). African easterly waves and convective activity in wet and dry sequences of the West African monsoon. Clim. Dyn. 27, 319–332. doi: 10.1007/s00382-006-0137-5
Lélé, M. I., Leslie, L. M., and Lamb, P. J. (2015). Analysis of low-level atmospheric moisture transport associated with the West African monsoon. J. Clim. 28, 4414–4430. doi: 10.1175/JCLI-D-14-00746.1
Lu, N. (2022). Evaluation of imerg precipitation products in the southeast costal urban region of China. Rem. Sens. 14:4947. doi: 10.3390/rs14194947
Ma, M., Wang, H., Jia, P., Tang, G., Wang, D., Ma, Z., et al. (2020). Application of the GPM-IMERG products in flash flood warning: a case study in Yunnan, China. Rem. Sens. 12:1954. doi: 10.3390/rs12121954
Maranan, M., Fink, A. H., and Knippertz, P. (2018). Rainfall types over southern West Africa: objective identification, climatology and synoptic environment. Quart. J. Royal Meteorol. Soc. 144, 1628–1648. doi: 10.1002/qj.3345
Maranan, M., Fink, A. H., Knippertz, P., Amekudzi, L. K., Atiah, W. A., and Stengel, M. (2020). A process-based validation of GPM IMERG and its sources using a mesoscale rain gauge network in the West African Forest Zone. J. Hydrometeorol. 21, 729–749. doi: 10.1175/JHM-D-19-0257.1
Maranan, M., Fink, A. H., Knippertz, P., Francis, S. D., Akpo, A. B., Jegede, G., et al. (2019). Interactions between convection and a Moist Vortex associated with an extreme rainfall event over Southern West Africa. Month. Weather Rev. 147, 2309–2328. doi: 10.1175/MWR-D-18-0396.1
Marvel, K., Cook, B. I., Bonfils, C. J., Durack, P. J., Smerdon, J. E., and Williams, A. P. (2019). Twentieth-century hydroclimate changes consistent with human influence. Nature 569, 59–65. doi: 10.1038/s41586-019-1149-8
Mathon, V., Laurent, H., and Lebel, T. (2002). Mesoscale convective system rainfall in the Sahel. J. Appl. Meteorol. 41, 1081–1092. doi: 10.1175/1520-0450(2002)041<1081:MCSRIT>2.0.CO;2
Miller, J., Taylor, C., Guichard, F., Peyrillé, P., Vischel, T., Fowe, T., et al. (2022). High-impact weather and urban flooding in the West African Sahel–a multidisciplinary case study of the 2009 event in Ouagadougou. Weather Clim. Extr. 36:100462. doi: 10.1016/j.wace.2022.100462
Nadolski, L., Bliefernicht, J., Petrovic, D., Rauch, M., Sy, S., Guug, S., et al. (2024). Exploring and closing the energy balance of eddy covariance measurements along a land use gradient in the West African Sudanian Savanna. Front. Water 6:1393884. doi: 10.3389/frwa.2024.1393884
Omotosho, J. B., and Abiodun, B. J. (2007). A numerical study of moisture build-up and rainfall over West Africa. Meteorol. Appl. 14, 209–225. doi: 10.1002/met.11
Otten, A., and Van Montfort, M. (1980). Maximum-likelihood estimation of the general extreme-value distribution parameters. J. Hydrol. 47, 187–192.
Pan, J. X., and Fang, K. T. (2002). “Maximum likelihood estimation,” in Growth Curve Models and Statistical Diagnostics. Springer Series in Statistics (New York, NY: Springer). doi: 10.1007/978-0-387-21812-0_3
Panthou, G., Lebel, T., Vischel, T., Quantin, G., Sane, Y., Ba, A., et al. (2018). Rainfall intensification in tropical semi-arid regions: the Sahelian case. Environ. Res. Lett. 13:e064013. doi: 10.1088/1748-9326/aac334
Panthou, G., Vischel, T., Lebel, T., Blanchet, J., Quantin, G., and Ali, A. (2012). Extreme rainfall in West Africa: a regional modeling. Water Resour. Res. 48:12052. doi: 10.1029/2012WR012052
Papalexiou, S. M., and Montanari, A. (2019). Global and regional increase of precipitation extremes under global warming. Water Resour. Res. 55, 4901–4914. doi: 10.1029/2018WR024067
Reed, C., Anderson, W., Kruczkiewicz, A., Nakamura, J., Gallo, D., Seager, R., et al. (2022). The impact of flooding on food security across Africa. Proc. Natl. Acad. Sci. U. S. A. 119:e2119399119. doi: 10.1073/pnas.2119399119
Salack, S., Bossa, A., Bliefernicht, J., Berger, S., Yira, Y., Sanoussi, K. A., et al. (2019). Designing transnational hydroclimatological observation networks and data sharing policies in West Africa. Data Sci. J. 18, 1–15. doi: 10.5334/dsj-2019-033
Sane, Y., Panthou, G., Bodian, A., Vischel, T., Lebel, T., Dacosta, H., et al. (2018). Intensity–duration–frequency (IDF) rainfall curves in Senegal. Nat. Hazard. Earth Syst. Sci. 18, 1849–1866. doi: 10.5194/nhess-18-1849-2018
Sawadogo, W., Bliefernicht, J., Fersch, B., Salack, S., Guug, S., Diallo, B., et al. (2023). Hourly global horizontal irradiance over West Africa: a case study of one-year satellite- and reanalysis-derived estimates vs. in situ measurements. Renew. Energy 216:119066. doi: 10.1016/j.renene.2023.119066
Schunke, J., Laux, P., Bliefernicht, J., Waongo, M., Sawadogo, W., and Kunstmann, H. (2021). Exploring the potential of the cost-efficient TAHMO observation data for hydro-meteorological applications in sub-saharan Africa. Water 13:3308. doi: 10.3390/W13223308
Semunegus, H., Mekonnen, A., and Schreck III, C. J. (2017). Characterization of convective systems and their association with African easterly waves. Int. J. Climatol. 37, 4486–4492. doi: 10.1002/joc.5085
Sougué, M., Merz, B., Nacanabo, A., Yangouliba, G. I., Pouye, I., Sogbedji, J. M., et al. (2024). Assessment of rural flood risk and factors influencing household flood risk perception in the haut-bassins region of Burkina Faso, West Africa. Climate 12:80. doi: 10.3390/cli12060080
Sun, Q., Zhang, X., Zwiers, F., Westra, S., and Alexander, L. V. (2021). A global, continental, and regional analysis of changes in extreme precipitation. J. Clim. 34, 243–258. doi: 10.1175/JCLI-D-19-0892.1
Sy, S., Madonna, F., Serva, F., Diallo, I., and Quesada, B. (2024). Assessment of NA-cordex regional climate models, reanalysis and in situ gridded-observational data sets against the U.S. climate reference network. Int. J. Climatol. 44, 305–327. doi: 10.1002/joc.8331
Sylla, M. B., Nikiema, P. M., Gibba, P., Kebe, I., and Klutse, N. A. B. (2016). Climate change over West Africa: recent trends and future projections. Adapt. Clim. Change Variabil. Rural West Africa 3, 25–40. doi: 10.1007/978-3-319-31499-0_3
Tabari, H. (2020). Climate change impact on flood and extreme precipitation increases with water availability. Sci. Rep. 10:13768. doi: 10.1038/s41598-020-70816-2
Thorncroft, C. D., Nguyen, H., Zhang, C., and Peyrillé, P. (2011). Annual cycle of the West African monsoon: regional circulations and associated water vapour transport. Quart. J. Royal Meteorol. Soc. 137, 129–147. doi: 10.1002/qj.728
Tramblay, Y., Badi, W., Driouech, F., El Adlouni, S., Neppel, L., and Servat, E. (2012). Climate change impacts on extreme precipitation in Morocco. Glob. Planet. Change 82-83, 104–114. doi: 10.1016/j.gloplacha.2011.12.002
van de Giesen, N., Hut, R., and Selker, J. (2014). The trans—African hydro—meteorological observatory (TAHMO). WIREs Water 1, 341–348. doi: 10.1002/wat2.1034
Vischel, T., Panthou, G., Peyrillé, P., Roehrig, R., Quantin, G., Lebel, T., et al. (2019). Precipitation extremes in the West African Sahel. Trop. Extr. 2, 95–138. doi: 10.1016/B978-0-12-809248-4.00004-2
Keywords: extreme rainfall, flooding, moisture transport, precipitation, humidity, wind, Dakar, Senegal
Citation: Diedhiou S, Rauch M, Lahat Dieng A, Bliefernicht J, Sy S, Sall SM and Kunstmann H (2024) Extreme rainfall in Dakar (Senegal): a case study for September 5, 2020. Front. Water 6:1439404. doi: 10.3389/frwa.2024.1439404
Received: 27 May 2024; Accepted: 22 October 2024;
Published: 20 November 2024.
Edited by:
Viviana Maggioni, George Mason University, United StatesReviewed by:
Rana Muhammad Adnan Ikram, Hohai University, ChinaSeifu Admassu Tilahun, International Water Management Institute (IWMI), Ghana
Copyright © 2024 Diedhiou, Rauch, Lahat Dieng, Bliefernicht, Sy, Sall and Kunstmann. This is an open-access article distributed under the terms of the Creative Commons Attribution License (CC BY). The use, distribution or reproduction in other forums is permitted, provided the original author(s) and the copyright owner(s) are credited and that the original publication in this journal is cited, in accordance with accepted academic practice. No use, distribution or reproduction is permitted which does not comply with these terms.
*Correspondence: Salif Diedhiou, c2FsaWYxLmRpZWRoaW91QHVjYWQuZWR1LnNu
 Salif Diedhiou
 Manuel Rauch
 Abdou Lahat Dieng1
 Souleymane Sy
 Harald Kunstmann