 Kim Thien Nguyen Le1*
 Juan Francisco Guerra Maldonado1Thanh-Luan Nguyen1Eyerusalem Goitom2Hana Trigui1Ndèye Adiara Ndiaye3Yves Terrat4B. Jesse Shapiro4,5
 Barry Husk6
 Arash Zamyadi7
 Sébastien Sauvé8
 Michèle Prévost1Sarah Dorner1
- 1Department of Civil, Geological and Mining Engineering, Polytechnique de Montréal, Montréal, QC, Canada
- 2Department of Geography and Environmental Studies, Toronto Metropolitan University, Toronto, ON, Canada
- 3Department of Chemical Engineering and Applied Biology, École Supérieure Polytechnique de Dakar, Dakar, Senegal
- 4Department of Biological Sciences, University of Montréal, Montréal, QC, Canada
- 5Department of Microbiology and Immunology, McGill University, Montréal, QC, Canada
- 6BlueLeaf Inc., Drummondville, QC, Canada
- 7Department of Civil Engineering, Monash University, Clayton, VIC, Australia
- 8Department of Chemistry, University of Montréal, Montréal, QC, Canada
Toxic cyanobacterial blooms are a worldwide concern. Nutrients are among the numerous factors that trigger cyanobacterial blooms and the production of cyanotoxins. This study aimed to assess the effect of nitrogen on cyanobacteria and cyanotoxins through a short-term mesocosm experiment. To achieve this, mesocosms were installed in situ in two lakes (the Missisquoi Bay of Lake Champlain and Petit-Lac-St-François) and received 700 μg/L of ammonium or 500 μg/L of nitrate. A shift to Microcystis in the mesocosms with nitrogen addition was observed 2 days after the addition in Missisquoi Bay, where nitrogen was more limited than Petit-Lac-St-François based on nutrient ratios. There was a significant increase of extracellular ΣMCs and MC-LR in mesocosms with the addition of ammonium or nitrate after 48 h compared to control mesocosms. Intracellular and extracellular microcystin concentrations were associated with Microcystis. Microcystis presence was associated with ammonium 48 h after N was added at both sites. Therefore, toxin production following sudden nitrogen addition can occur on short time scales relevant to drinking water treatment plant operations. This information will help treatment plant operators better anticipate the arrival of potentially higher concentrations of cyanotoxins.
1 Introduction
Harmful cyanobacterial blooms are becoming more common in surface waters worldwide (Paerl et al., 2011). Several toxin-producing cyanobacterial genera are of concern in water supplies. The most common cyanobacterial toxins include hepatotoxins (microcystins and nodularins), neurotoxins (e.g., anatoxin-a), cytotoxins (cylindrospermopsins), dermatotoxins (e.g., lyngbyatoxin) (Carmichael, 1992; Svirčev et al., 2019), which are among the most frequently measured toxins produced by the cyanobacteria genera Microcystis, Planktothrix, and Dolichospermum (Al-Sammak et al., 2014; Harke et al., 2016). Cyanobacterial toxins are a potential threat to aquatic organisms and human health (Lévesque et al., 2014).
In a previous study, the addition of nitrate (NO3−) and ammonium (NH4+) to hypereutrophic water bodies increased the abundance of total phytoplankton and increased microcystin production by up to 13 times in 21 days in the mesocosm experiments (Donald et al., 2011). A recent study conducted mesocosm bioassays to determine the effect of different concentrations of nitrogen (N) (3, 6, 9, and 15 mg/L) and phosphorus (P) (0.01, 0.02, 0.05, 0.1 and 0,2 mg/L) on algal growth over 10 days. The results indicated that nitrogen treatment stimulated cyanobacteria growth (mainly Microcystis aeruginosa) more than phosphorus (Kim et al., 2020). Moreover, a recent study showed that ammonium favored amino acid synthesis in M. aeruginosa; thus, cells developed under high concentrations of ammonium (7 mg N/L) led to microcystin production in 5 days (Chen et al., 2019). Recently, high throughput sequencing has been applied to evaluate the impact of NO3− andNH4+ on the microbial community structure of freshwater (Reynoso et al., 2019) and showed no significant shift in the diversity of the bacterial community following the addition of NO3− and NH4+ (Reynoso et al., 2019).
To our knowledge, no in-situ mesocosm experiment using fresh blooms has been conducted to investigate the short-term effects of NO3− and NH4+ on cyanobacterial cells and their toxins. Although long-term effects of nutrients on blooms and toxin production have been well established, there is a need for data on shorter time scales to manage drinking water sources that must continuously respond to fluctuations of water quality in real-time. Furthermore, no study has examined the differences in the cyanobacterial community assessed using microscopic and shotgun metagenomic techniques after adding NH4+ and NO3−. In this context, the main objective of this research was to determine the effects of NH4+ and NO3− on cyanobacterial community composition and their related toxins on a short time scale, replicating a sudden increase in nitrogen that could occur as the result of the addition of stormwater with agricultural runoff or municipal effluents. Drinking water treatment plants operate continuously, and such information is needed for the short-term prediction of bloom toxicity in source waters affected by cyanobacterial blooms. In many jurisdictions, including Québec, regulations to limit the eutrophication of water bodies focus predominantly on phosphorus and nitrogen, which are regulated primarily for their concentrations without considering overall loads. This research also broadly aims to provide data in support of decision-making with regard to nitrogen regulation in drinking water sources.
2 Materials and methods
2.1 Study sites
Two selected sites were Petit-Lac-St-François (PLSF) and the Missisquoi Bay of Lake Champlain (MB). PLSF is located in south-western Quebec [Canada; 45°32′16´´ N; 72°02′11´´ W; max depth (Z) = 1.8 m]. The PLSF is relatively small and shallow and half of its watershed is occupied by agricultural areas, resulting in excessive concentrations of phosphorus and cyanobacterial blooms (Monchamp et al., 2014; Le et al., 2022). Missisquoi Bay is a eutrophic and shallow [max. Depth (Z) = 4.75 m] embayment of Lake Champlain in southern Québec (Canada; 45°02′23´´ N; 73°04′41´´ W; McQuaid et al., 2011). These two sites were chosen because of their high nutrient concentration and frequent cyanobacterial presence (Medalie et al., 2012; Wheeler et al., 2012).
2.2 Nutrient addition experiments
We conducted in-situ mesocosm experiments over eight different cyanobacterial bloom events, and each experiment lasted for 48 h (Supplementary Tables S1, S2). The short-term frame represents a pulse of nutrients that occurs during rainfall-runoff events. The mesocosm structure was based on the study of Wood et al. (2012), and the experimental procedure was based on the study of Le et al. (2021). Before the experiment, a large container was filled with lake water and fresh cyanobacteria scum was harvested at the field sites (Supplementary Figure S1). They were mixed gently to achieve a homogeneous mixture. Then, we filled duplicate mesocosms (n = 6) with that mixture which were left unamended (controls) or amended with nitrate or ammonium.
2.3 Preparation and application of nutrients
KNO3 and NH4Cl stock solutions were prepared, and different volumes of these solutions were injected into the mesocosms to achieve a final NO3− concentration of 500 μg N/L and NH4+ concentration of 700 μg N/L. The final concentrations of NO3− and NH4+ after additions were in the range that enhance cyanobacterial growth according to references (Monchamp et al., 2014; De Boutray, 2017).
2.4 Sampling, filtration procedure
2.4.1 Sampling procedure
Water samples were collected from the center of each mesocosm using two 1-L sterilized high-density polyethylene (HPDE) bottles before adding the nutrients (KNO3 and NH4Cl) at time zero (T0) and after the addition of the nutrients at 48 h (T48). Samples were used to analyze genomics, taxonomy, cyanotoxins (intracellular and extracellular), and nutrients, including total nitrogen (TN), total phosphorus (TP), dissolved nitrogen (DN), dissolved phosphorus (DP), oxidized nitrogen (NO3− + NO2−), ammonia and ammonium (NH3 + NH4+), total Kjeldahl nitrogen (TKN), soluble reactive phosphorus (SRP), dissolved organic carbon (DOC) and total organic carbon (TOC).
2.4.2 Filtration procedure
Samples for genomic and cyanotoxin analysis were filtered immediately at field sites and kept in a dry ice box during transport to the laboratory. For genomic analyses, a subsample of 50 mL was filtered through a 0.22 μm membrane (Millipore Sigma, Oakville, ON) under sterile conditions. The filter membrane was kept in a 50 mL Falcon tube (VWR, Radnor, PA, United States) and frozen at -80°C prior to analysis.
For toxins, a 120 mL subsample was filtered on a hydrophilic polypropylene (GHP) 0.45 μm membrane (PALL, Mississauga, ON). A Petri dish (Millipore SAS, France) was used to keep the filter (for intracellular toxins), and the filtrate (for extracellular toxins) was kept in a 125 mL amber Nalgene™ polyethylene terephthalate glycol (PETG) bottle (Thermo Scientific Nalgene, Waltham, MA, United States). They were stored at −25°C prior to analysis.
For the enumeration of cyanobacteria, water samples were taken in 40 mL vials and preserved in “Lugol’s iodine solution. TN and TP were collected in 120 mL HPDE bottles. A 0.45 μm membrane (Merck Millipore, Ireland) was used for NO3− + NO2−, NH3 + NH4+, SRP and DN/DP. TN/TP/DN/DP were stored at 4°C, NO3− + NO2−, NH3 + NH4+, and SRP were frozen at −25°C prior to analysis. More details are provided in (Le et al., 2022).
2.5 Sample analyses
2.5.1 Taxonomic cell counts
Taxonomic identification and counts were identified using inverted microscopy in a Sedgwick-Rafter counting chamber with 40x magnification (Leica Microsystems GmbH, Wetzlar, Germany; Edler and Elbrächter, 2010; Zamyadi et al., 2013; Le et al., 2021).
2.5.2 Cyanotoxins
The samples were quenched, filtered, and directly analyzed through solid phase extraction (SPE) and desalting coupled to ultra-high performance liquid chromatography tandem mass spectrometry (UHPLC–MS/MS). The online sample loading volume of 5 mL was achieved at a 2,500 μL/min flow rate into a Thermo Hypersil Gold aQ column (C18, 20 mm × 2 mm, 12 μm particle size) hereafter named online SPE column. After sample loading, analyses were injected into a Thermo Hypersil Gold column with C18 selectivity (100 mm × 2.1 mm, 1.9 μm particle size), hereafter named analytical column, at 500 μL/min. Then, samples were analyzed for total microcystins by UHPLC–MS/MS. More details are provided in (Munoz et al., 2017; Roy-Lachapelle et al., 2019).
2.5.3 Nutrients
Method 415.1 was used to analyze TOC and DOC (United States Environmental Protection Agency, 1974). Total nitrogen, dissolved nitrogen, nitrate, nitrite and ammonia were analyzed according to Standard Methods 353.2 and 350.1 (United States Environmental Protection Agency, 1993a,b). Standard Method 365.3 was applied for total and dissolved phosphorus and soluble reactive phosphorus (United States Environmental Protection Agency, 1978).
The sampling, filtration and analysis procedure followed a method described elsewhere (Le et al., 2022).
2.5.4 DNA extraction, metagenomics preparation and sequencing
Total nucleic acid was extracted from the frozen filter using the RNeasy PowerWater Kit (Qiagen Group, Germantown, MD, United States). Dithiothreitol (DTT) was added into the RNeasy PowerWater Kit solution PM1 buffer to avoid the formation of disulfide bond protein residuals. Total nucleic acid was eluted with 60 μL nuclease-free water, and 30 uL was used for DNA. For pyrosequencing (Roche 454 FLX instrumentation with titanium chemistry), 30 μL of DNA was sent to the Genome Quebec Innovation Center for sequencing.
An Illumina NovaSeq 6,000 S4 (Illumia Inc., San Diego, CA, United States) was used to sequence DNA libraries. A homemade bioinformatic pipeline was applied to analyze Paired-end raw reads of 150 base pairs (bp). Raw reads trimming quality was first performed using SolexaQA v3.1.7.1, default parameters (Cox et al., 2010). Predicted protein fragments were then clustered at 90% similarity using cd-hit v4.8.1 (Fu et al., 2012). More details are in (Le et al., 2022).
2.5.5 Statistical analysis
Statistical analysis was performed by R (R Core Team, 2020). All of the plots in this paper were generated by the ggplot2 package in R.1 Principal component analysis (PCA) was performed to evaluate the impact of environmental conditions on the cyanobacterial community and cyanotoxins with the vegan package.2 Statistical tests were determined using the Kruskal-Wallis test. Statistical significance was established at a 0.05 p-value cutoff (p < 0.05).
3 Results and discussion
3.1 The concentration of various forms of nutrients
3.1.1 Initial conditions (T0), before adding nitrogen
The nitrogen fractions (dissolved organic nitrogen (DON), ammonia and ammonium (NH3 + NH4+), total Kjeldahl nitrogen (TKN), oxidized nitrogen (NO3− + NO2−), total nitrogen (TN), dissolved nitrogen (DN)) and phosphorus fractions (soluble reactive phosphorus (SRP), dissolved organic phosphorus (DOP), dissolved phosphorus (DP), particulate P (PP), total P (TP)) were measured for the samples taken in all mesocosms at the start of the sampling period (T0) on 31 July and 24 September 2018, 13 August and 20 September 2019 in Missisquoi Bay (MB) (Supplementary Table S1) and on 26 June, 24 July, 05 August and 09 October 2019 in Petit-Lac-St-François (PLSF) (Supplementary Table S2).
In MB, in both 2018 and 2019, the concentrations of TN and TP in the mesocosms were higher in mid-summer and lower in early fall (Supplementary Table S1). On 31 July 2018, TN and TP reached 5.8 mg N/L and 1,311 μg P/L, respectively, before dropping to 2.82 mg N/L and 337 μg P/L on 24 September 2018. Similarly, TN and TP concentrations peaked at 8.8 mg N/L and 3,101 μg P/L on 13 August 2019 before rapidly declining to 0.59 mg N/L and 780 μg P/L on 20 September 2019 (Supplementary Table S1). At T0, the most dominant fractions of N and P at both studied sites were TKN and PP, respectively (Supplementary Table S1).
A different trend in TN and TP was observed at PLSF, where the concentrations of TN and TP in the mesocosms were lower in mid-summer and higher in early fall and early summer (Supplementary Table S2). TN concentrations were exceptionally high on 26 June 2019 (11.45 mg N/L) and 09 October 2019 (30.0 mg N/L), but they were significantly lower on 24 July 2019 (1.21 mg N/L) and 05 August 2019 (1.12 mg N/L) (Supplementary Table S2). TKN and DON were the most prevalent N fractions found, while NO3− + NO2− and NH3 + NH4+ levels were lower. The high concentration of TKN suggested that the primary forms of N were organic (Celikkol et al., 2021). PP was the most common form of P. In June, July, August, and October of 2019, TP followed the same trends as TN. The TP concentration was high on 26 June 2019 (670 μg P/L), then decreased on 24 July 2019 (111 μg P/L), remained lower on 05 August 2019 (137 μg P/L), before again increasing on 09 October 2019 (1,550 μg P/L) (Supplementary Table S2). In both MB and PLSF, a linear association was observed between TKN and PP with total cyanobacterial biomass (R2 ≥ 0.98) (Supplementary Figures S2–S5). During cyanobacterial blooms, the organic and particulate fractions of N and P fractions have been linked to cyanobacterial biomass rather than the amount of bioavailable compounds in water (Celikkol et al., 2021).
We also looked at the ratios of several N and P components in the mesocosms at T0 in MB and PLSF (Supplementary Tables S1, S2), focusing on the TN:TP ratio as a general indicator and the DIN:SRP ratio as a measure of readily accessible nutrients (Celikkol et al., 2021). In MB and PLSF, the TN:TP ratio ranged between 0.76 and 8.37 (Supplementary Table S1) and 8.17 and 19.35 (Supplementary Table S2), respectively. A low N:P ratio (<30) has been shown to promote the growth of cyanobacterial blooms (Harris et al., 2014; Li et al., 2018) and TN:TP < 22 can indicate N-limitation in fresh water (Hecky et al., 1993; Celikkol et al., 2021). However, the organic and particulate forms of N and P in cyanobacterial cells can influence TN and TP concentrations (Celikkol et al., 2021); therefore, the ratio TN:TP was a by-product of cyanobacterial blooms. The DIN:SRP ratio in MB was low on 31 July 2018 (4.56), 13 August 2019 (1.86) and 20 September 2019 (2.79), while it was higher on 24 September 2018 (24.8) (Supplementary Table S1). In PLSF, the DIN:SRP ratio was in the range of 2.2 to 2.8 on 24 July and 05 August 2019 and higher on 26 June (13.56) and 09 October (9.86) 2019 (Supplementary Table S2). DIN:SRP ratios of less than 10:1 have previously been shown to suggest significantly N-limiting circumstances that favor the growth and proliferation of N2-fixing cyanobacteria (Havens et al., 2003; Celikkol et al., 2021).
3.1.2 After 2 days of exposure (T48)
In MB, at T48, the DIN:SRP ratio was stable in the control mesocosm (Supplementary Table S3) but higher than its initial conditions in the mesocosms which had added NH4+ 700 μg/L (95.13–118.19) (Supplementary Table S5) and NO3− 500 μg/L (27.72–49.32) (Supplementary Table S7). Similarly, the same trend was observed in PLSF (Supplementary Tables S6, S8). In general, the DIN:SRP ratio changed from less than 13 (nitrogen-limited conditions) at T0 which favors the growth of N2-fixing cyanobacteria to greater than 50 (phosphorus-limited conditions) at T48 which favors the growth of non-N2-fixing cyanobacteria in the mesocosms containing nutrients at both studied sites (Havens et al., 2003; Celikkol et al., 2021).
As planned, there was a significant change in NH4+ concentration in the mesocosms to which NH4+ 700 μg/L was added compared to the control mesocosms at T48 in MB. In PLSF, both NH4+ and NO3− concentrations changed significantly in the mesocosms which had added NH4+ 700 μg/L and NO3− 500 μg/L, respectively (Supplementary Table S9). Thus, the quantity of N added to the mesocosm was sufficient to change the concentrations in amended mesocosms.
3.2 The impact of NH4+ and NO3− on total taxonomic cell counts
In both PLSF and MB, the initial average taxonomic cell counts fluctuated between the experimental events but were greater than 104 cells/mL in all mesocosms (Figure 1). In MB, on 31 July 2018, Dolichospermum was the most numerous genera in all mesocosms, accounting for almost 85% of total taxonomic cell counts (Supplementary Figure S6). On 24 September 2018, the dominant genera were more diverse, including Dolichospermum (35.1% of total taxonomic cell counts), Microcystis (23.2%), and Aphanothece (25.1%) in all the mesocosms. Interestingly, Aphanizomenon and Aphanothece were the most abundant genera on 13 August and 20 September 2019, respectively (Supplementary Figure S6). Our findings were in line with a short- to long-term study of cyanobacterial dynamics in MB assessed by taxonomy cell counts and shotgun metagenomics (Moradinejad et al., 2020; Jalili et al., 2021; Le et al., 2021).
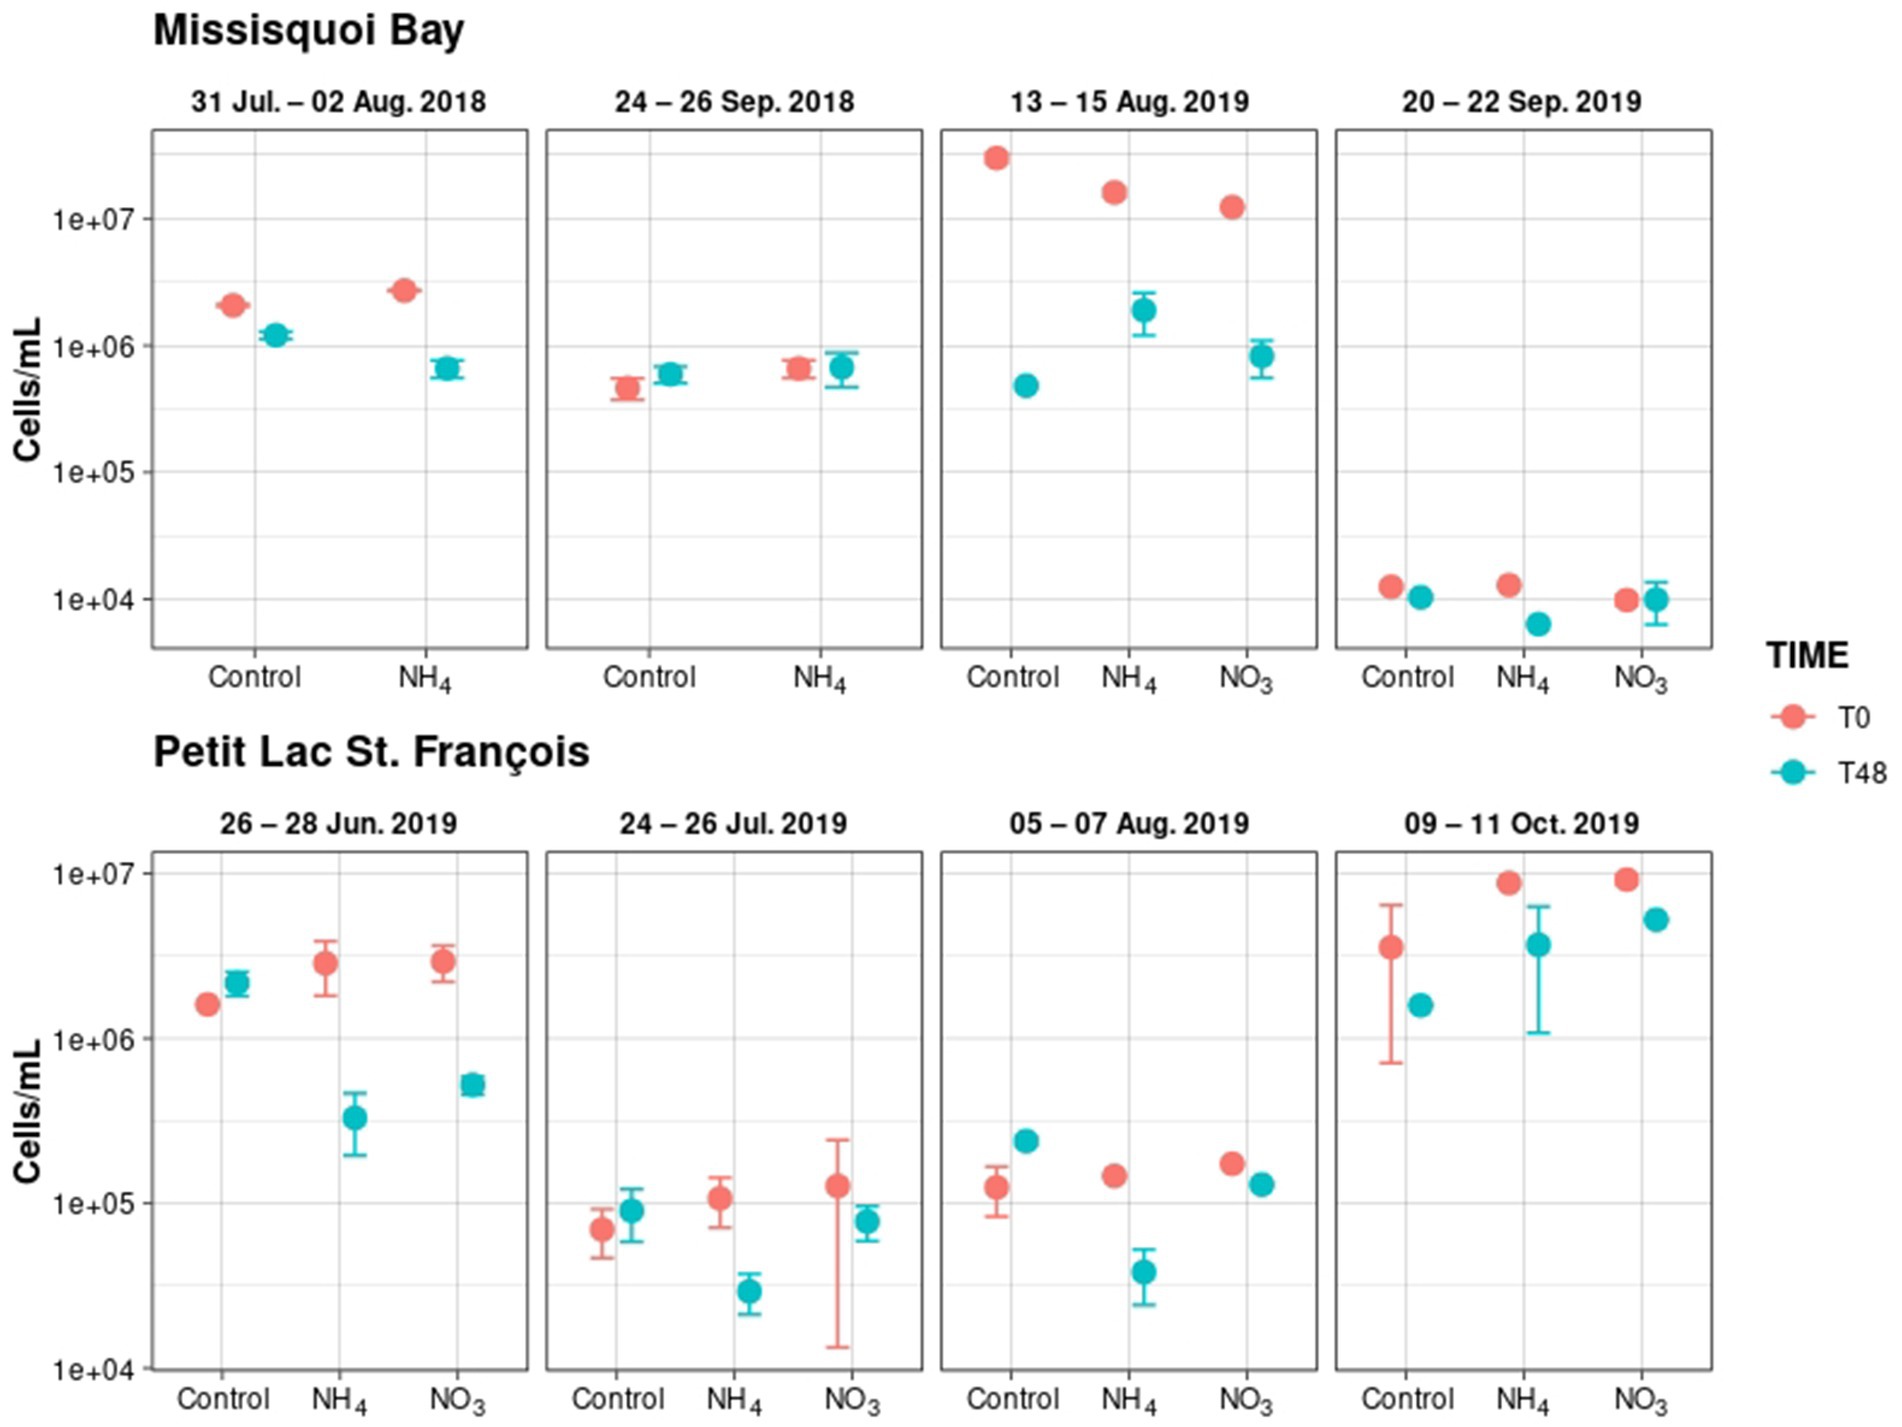
Figure 1. Total taxonomic cell counts in the control, NO3− (500 μg N/L) and NH4+ (700 μg N/L) mesocosms (Mean ± standard deviation). The events are on 31 July – 02 August 2018, 24 – 26 September 2018, 13 – 15 August 2019, 20 – 22 September 2019; 26 – 28 June 2019; 24 – 26 July 2019; 05 – 07 August 2019; 09 – 11 October 2019. Data of mesocosms NO3− at events 31 July – 02 August and 24 – 26 September 2018 were excluded because of unexpected conditions. T0 is 238 for before adding nitrogen, and T48 is for after two days following nitrogen addition.
Dolichospermum and Microcystis were the most common bloom-forming cyanobacteria in PLSF mesocosms at T0 (Supplementary Figure S7). We found that Dolichospermum was the representative and dominant genus on 26 June 2019 and 09 October 2019 (more than 73% of total taxonomic cell counts), respectively, while Microcystis dominated on 24 July 2019 and 05 August 2019 (around 50–75% of total taxonomic cell counts; Supplementary Figure S7). Our findings were consistent with previous findings that Dolichospermum peaked in early spring and late fall, but Microcystis dominated during the summer season in eutrophic lakes (Shan et al., 2019; Zhang et al., 2020). For both the 24 July 2019 and 05 August 2019 experiments, Aphanizomenon (5–10% of total cell counts) and Aphanothece (10–25%) were also present.
After 2 days of exposure (T48), the total taxonomic cell counts decreased significantly (p-value <0.05) in the mesocosms with added NH4+ 700 μg/L or NO3− 500 μg/L (Figure 1). Dolichospermum and Aphanizomenon cell counts declined significantly (p-value <0.05) relative to the mesocosm with NH4+ 700 μg/L enrichment, while no changes were observed with NO3− 500 μg/L enrichment (Supplementary Table S10).
The relative cell abundance of individual cyanobacterial species remained stable in all mesocosms after 48 h except for mesocosms containing NH4+ on 28 June 2019 in PLSF, where Microcystis became the dominant genus (Supplementary Figure S7). In MB, Microcystis became dominant in the mesocosms containing NO3− on 15 August 2019 (Supplementary Figure S6). These observations agree with several previous studies reporting that adding NO3− or NH4+ to lakes can promote Microcystis proliferation on a long-term time scale (Harke et al., 2016; Chen et al., 2019; Swarbrick et al., 2019; Andersen et al., 2020; Trommer et al., 2020). In addition, multiple laboratory investigations have shown that adding NH4+ and NO3− to the Microcystis species can help them develop faster (Erratt et al., 2018; Chen et al., 2019). In addition, Microcystis blooms occurred in the presence of high concentrations of NH3 in the water column (Gobler et al., 2016; Celikkol et al., 2021).
Although NH4+ is a good source of N for cyanobacterial growth, concentrations of NH4+ greater than 1.44 mg N/L have been demonstrated to suppress cyanobacterial growth due to toxicity (Britto and Kronzucker, 2002; Dai et al., 2012; Collos and Harrison, 2014; Erratt et al., 2018). In our study, five samples of NH4+ + NH3 in the mesocosms with added NH4+ at T48 were higher than 1.44 mg N/L (Supplementary Tables S5, S6). It could be a reason for observing that total cell counts declined in the mesocosms adding NH4+ compared to the control mesocosms in several events. Moreover, NH4+ is more bioavailable to cyanobacterial growth at lower concentrations (Glibert et al., 2016).
3.3 The impacts of NH4+ and NO3− on cyanobacterial relative abundance assessed by shotgun metagenomic sequencing
The composition of the cyanobacteria assessed by comparative metagenomics read levels of genus during sampling periods is presented in Figures 2, 3. Results passing quality standards for DNA sequencing were available for 24–26 September 2018 and 13–15 August 2019 in MB and 26–28 June, 24–26 July and 05–07 August 2019 in PLSF.
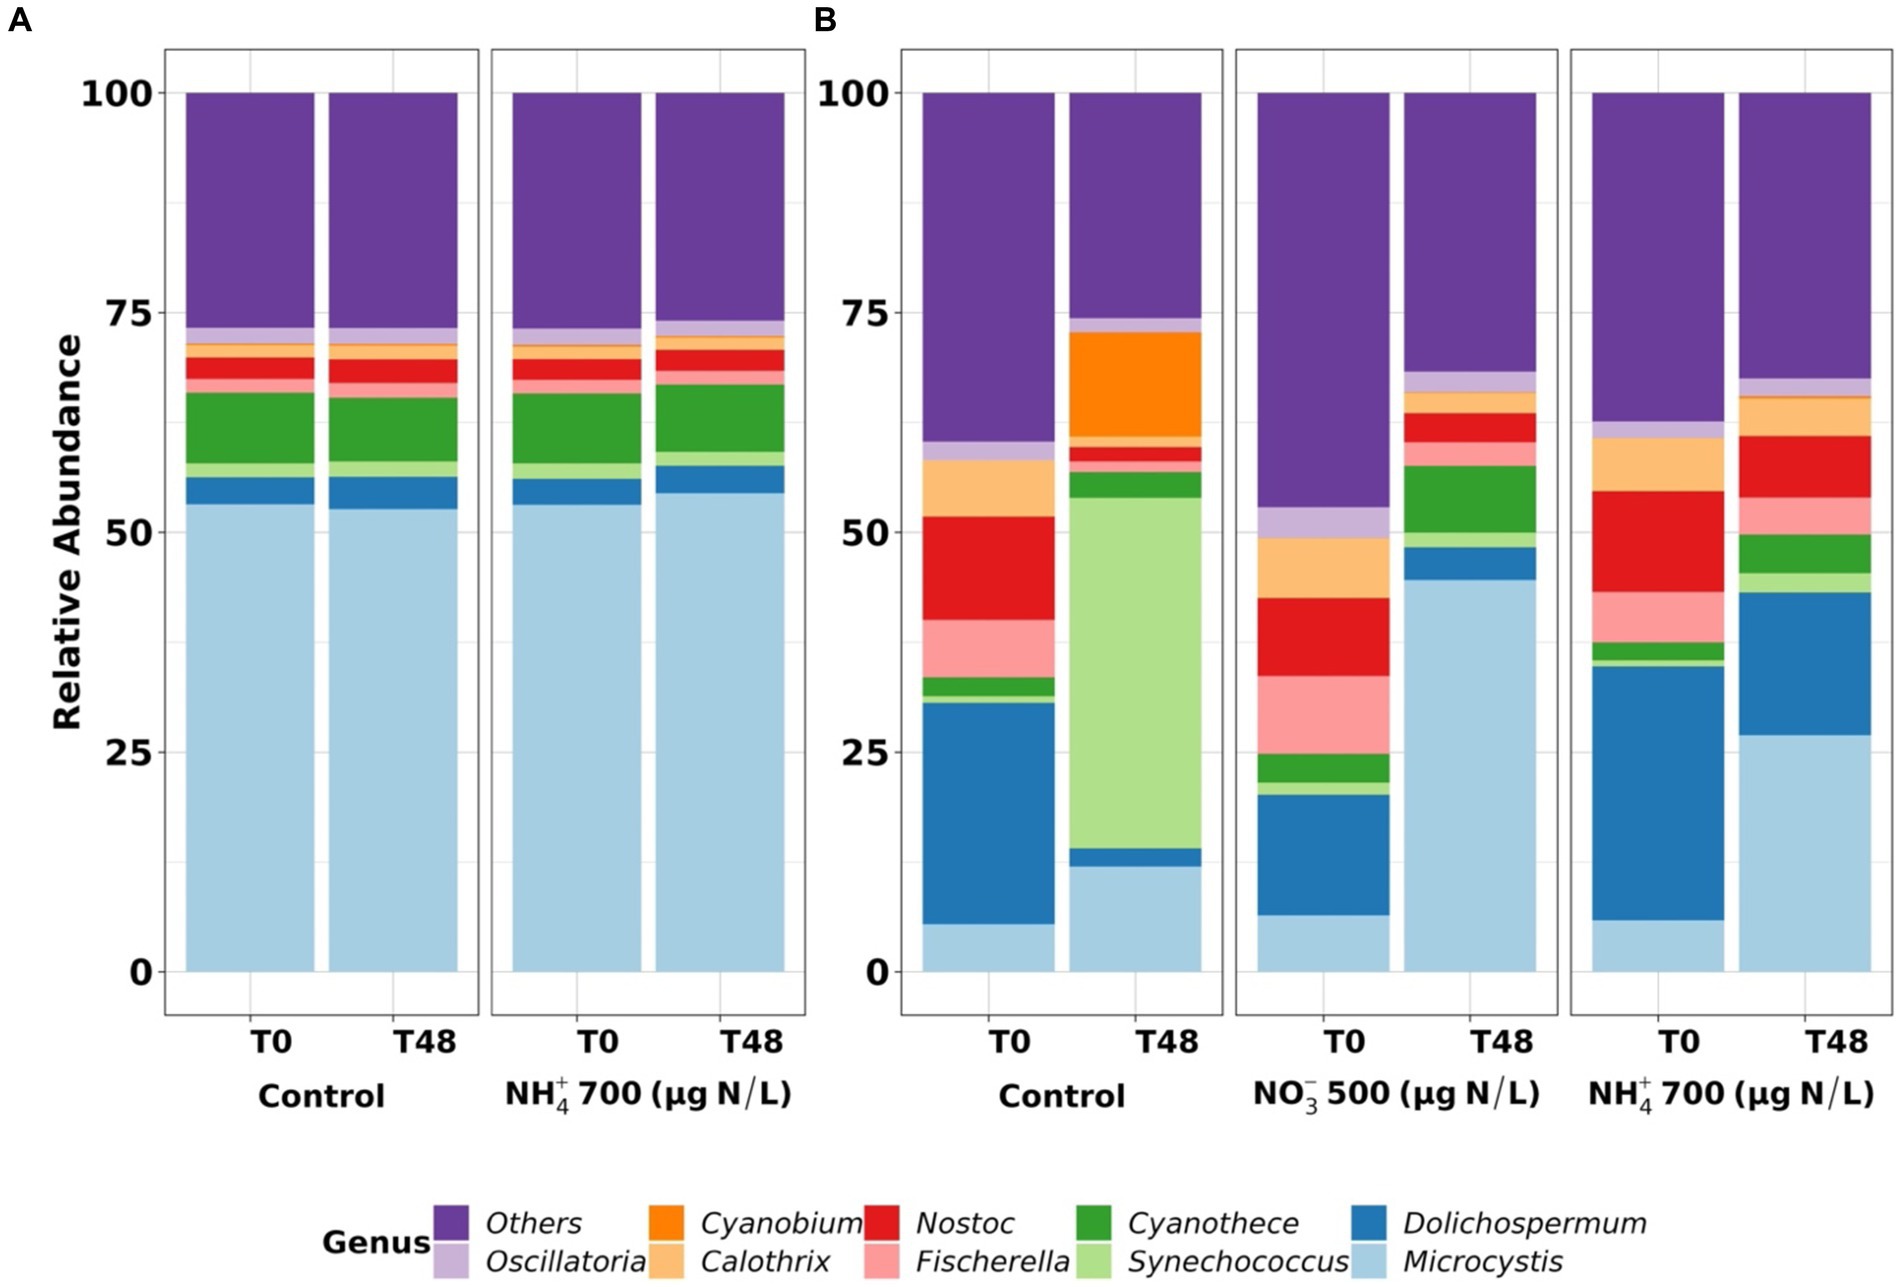
Figure 2. The cyanobacterial community at genus level in the mesocosms on 24–26 September 2018 (A) and 13–15 August 2019 (B) in Missisquoi Bay. T0 is for before adding nitrogen, and T48 for 2 days following nitrogen addition.
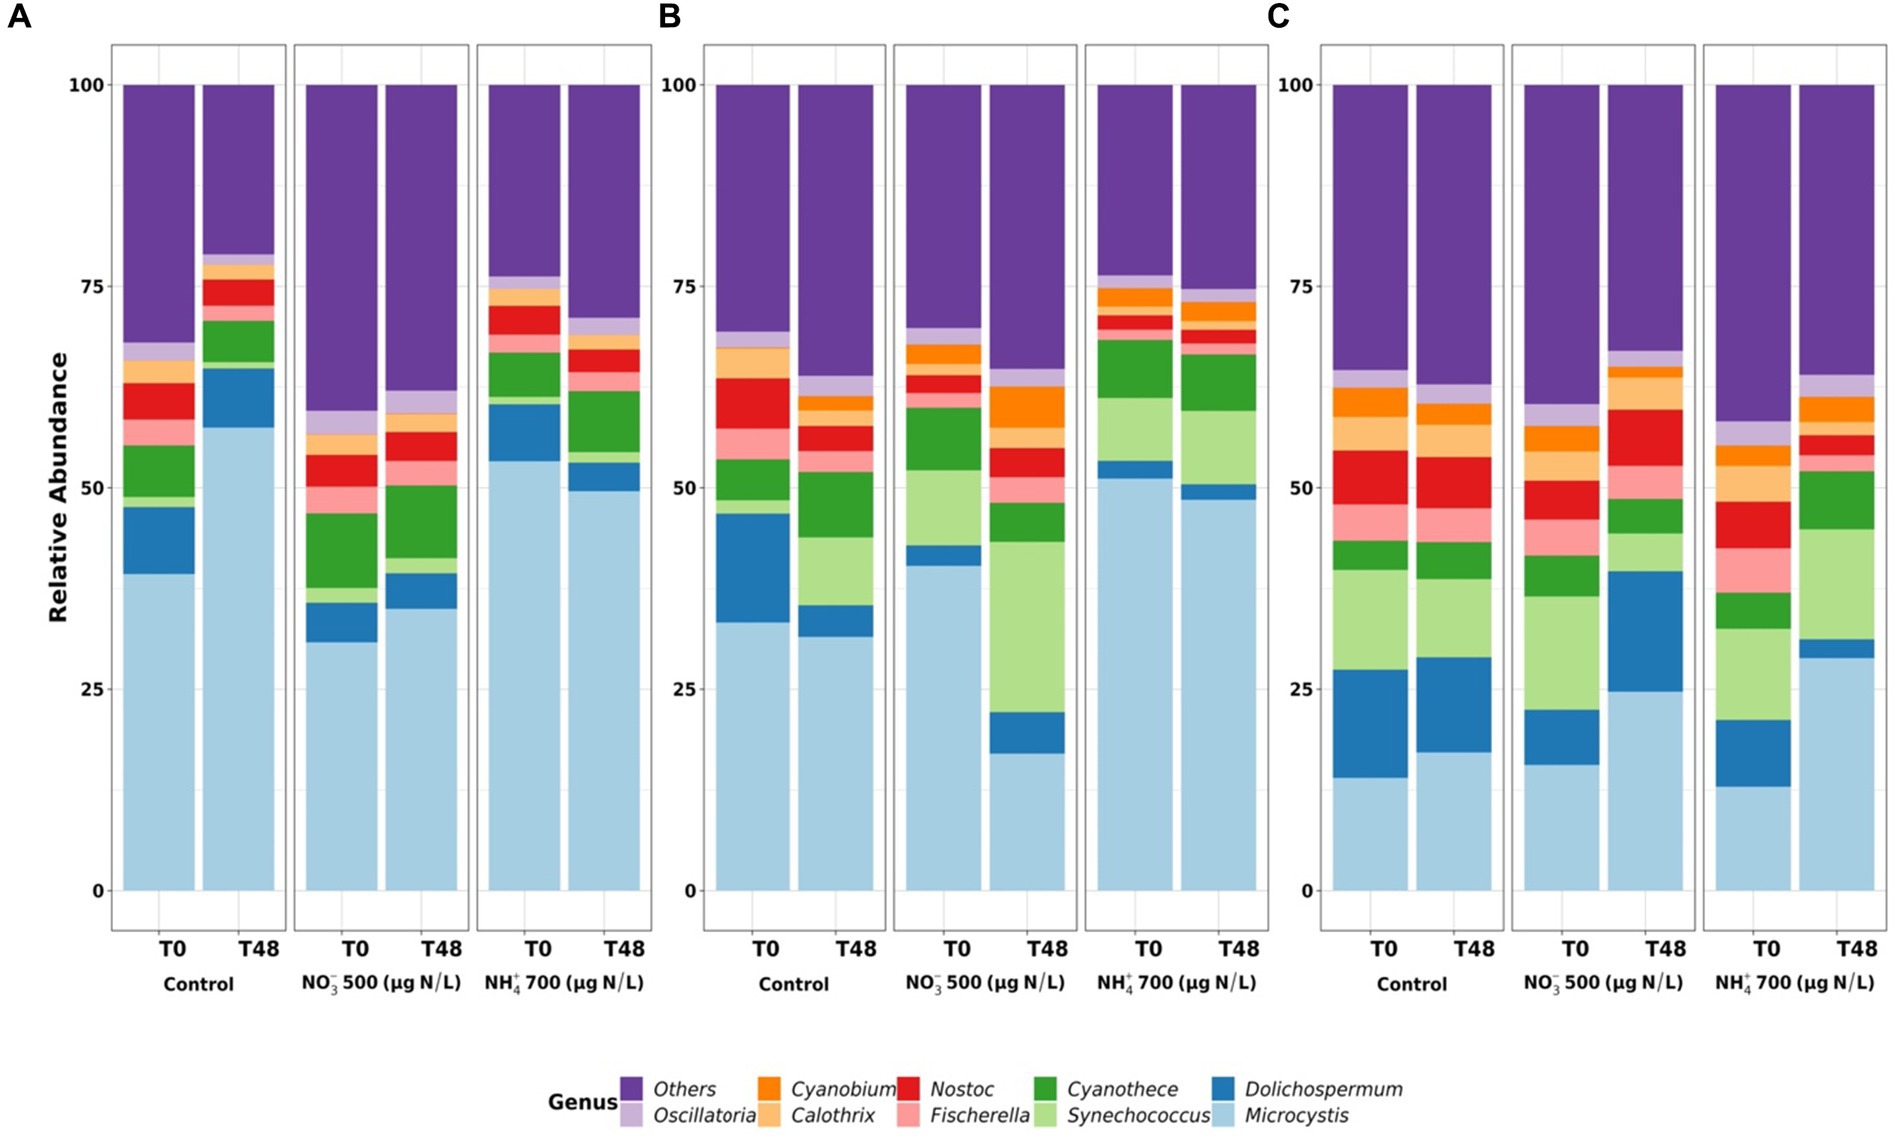
Figure 3. The cyanobacterial community at genus level in the mesocosms on 26–28 June 2019 (A), 24–26 July 2019 (B), and 05–07 August 2019 (C) in Petit-Lac-St-François. T0 is for before adding nitrogen, and T48 is for after 2 days following nitrogen addition.
Based on high-throughput sequencing data, analysis of the relative abundance of the cyanobacterial community at the genus level in MB revealed that Microcystis (approximately 55% of total relative abundance) and Dolichospermum (25% of total relative abundance) were the dominant genera at T0 on 24 September 2018 and 13 August 2019, respectively (Figure 2). Our findings are consistent with prior research that found that Dolichospermum and Microcystis dominated the cyanobacterial community at the same location in MB (McQuaid et al., 2011; Zamyadi et al., 2012; Moradinejad et al., 2020; Jalili et al., 2021). After 48 h of exposure (on 24 September 2018), the cyanobacterial relative abundance remained stable in all mesocosms (Figure 2A). In contrast, the experiment starting on 13 August 2019 (Figure 2B) showed shifts to Microcystis in mesocosms with nutrient addition, whereas the shift was most notable to Synechococcus in the control mesocosm. Previous investigations in MB documented Synechococcus alternating before, during or after Dolichospermum and Microcystis blooms (Jalili et al., 2021). Microcystis has been associated with toxin production in MB (Le et al., 2022).
In PLSF, at T0, Microcystis was the predominant genus, accounting for more than 30–50% of the total relative abundance at T0 on 26 June 2019 and 24 July 2019, while Synechococcus (13.5% total relative abundance), Microcystis (12.5%) and Dolichospermum (12.4%) were the predominant genera on 05 August 2019 (Figure 3). After 48 h of exposure, the relative abundance of cyanobacteria regarding community composition had changed in all mesocosms, depending on the sampling date. For example, at T48, Microcystis remained dominant, and their relative abundance increased in all mesocosms on 28 June 2019 (Figure 3A). On 07 August 2019, the relative abundance of Microcystis, Synechococcus and Dolichospermum did not markedly change in the control mesocosms, while the abundance of Microcystis was higher in the mesocosms with added nutrients (Figure 3C). Interestingly, Synechococcus became dominant in the mesocosms with added NO3− on 26 July 2019 (Figure 3B). This shift could be the result of random variability. Synechococcus can utilize various nitrogen sources for growth, and there was no correlation between the abundance of Synechococcus and concentrations of inorganic nutrients (NO3−, NO2−, NH4+ and PO4−) (Collier et al., 1999; Moore et al., 2002; Wang et al., 2011). The change in cyanobacteria composition in the control mesocosms after 2 days agreed with other reported results on the changes in cyanobacterial composition and variation in the cyanobacterial community in the lake (Ndong et al., 2014; Moradinejad et al., 2020).
The change to Microcystis dominance likely causes the species-specific interaction between Microcystis spp. and related bacteria. Some bacteria phyla, such as Proteobacteria and Bacteroidetes, have played important roles in enhancing the adaptation of Microcystis within cyanobacterial blooms, like maintaining redox balance and coping with chemical stress (Li et al., 2018; Moradinejad et al., 2020). Moreover, several organisms may release bioactive substances that could affect the successional dominance of Microcystis in aquatic systems (Wacklin et al., 2009). In addition, Microcystis has numerous competitive advantages over other plankton in terms of extreme environmental changes (Wilhelm et al., 2020).
The genera observed from microscopic cell counts do not match the results of shotgun metagenomic sequencing completely (Supplementary Figures S6, S7; Figures 2, 3). The limitations of these methods could be the reason for the difference in the community composition structure (Moradinejad et al., 2020). For microscopic taxonomic cell counts, low-abundance species or similar morphology among cyanobacterial taxa may lead to the misidentification of cyanobacteria (Kim et al., 2018; Casero et al., 2019; Moradinejad et al., 2020; Le et al., 2022). In the case of shotgun metagenomic sequencing, the limitations can include incomplete DNA sequencing libraries or the use of different libraries (Moradinejad et al., 2020; Jalili et al., 2021; Le et al., 2022).
3.4 Impact of NH4+ and NO3− on cyanotoxins
At the beginning of the sampling period, the concentration of total intracellular microcystins (intracellular ΣMCs) varied around 101–105 ng/L while total extracellular microcystins (extracellular ΣMCs) was around 102–104 ng/L in MB and PLSF (Figures 4, 5). Twelve microcystins (MC) including MC-LR, MC-YR, MC-HtyR, MC-RR, MC-HilR, MC-WR, MC-LA, MC-LY, MC-LW, MC-LF, [Asp3]MC-RR and [Asp3]MC-LR, and some cyanopeptides (anabaenopeptin A (AP-A) and anabaenopeptin B (AP-B)) were detected at both sites (Supplementary Figures S8, S9). In MB, MC-LR, MC-RR and APA were the most abundant intracellular and extracellular cyanotoxins observed (Supplementary Figures S8, S10). MC-LR was the most common in both intracellular and extracellular cyanotoxins, accounting for greater than 75% of total relative abundance in all mesocosms at T0 in PLSF (Supplementary Figures S9, S11).
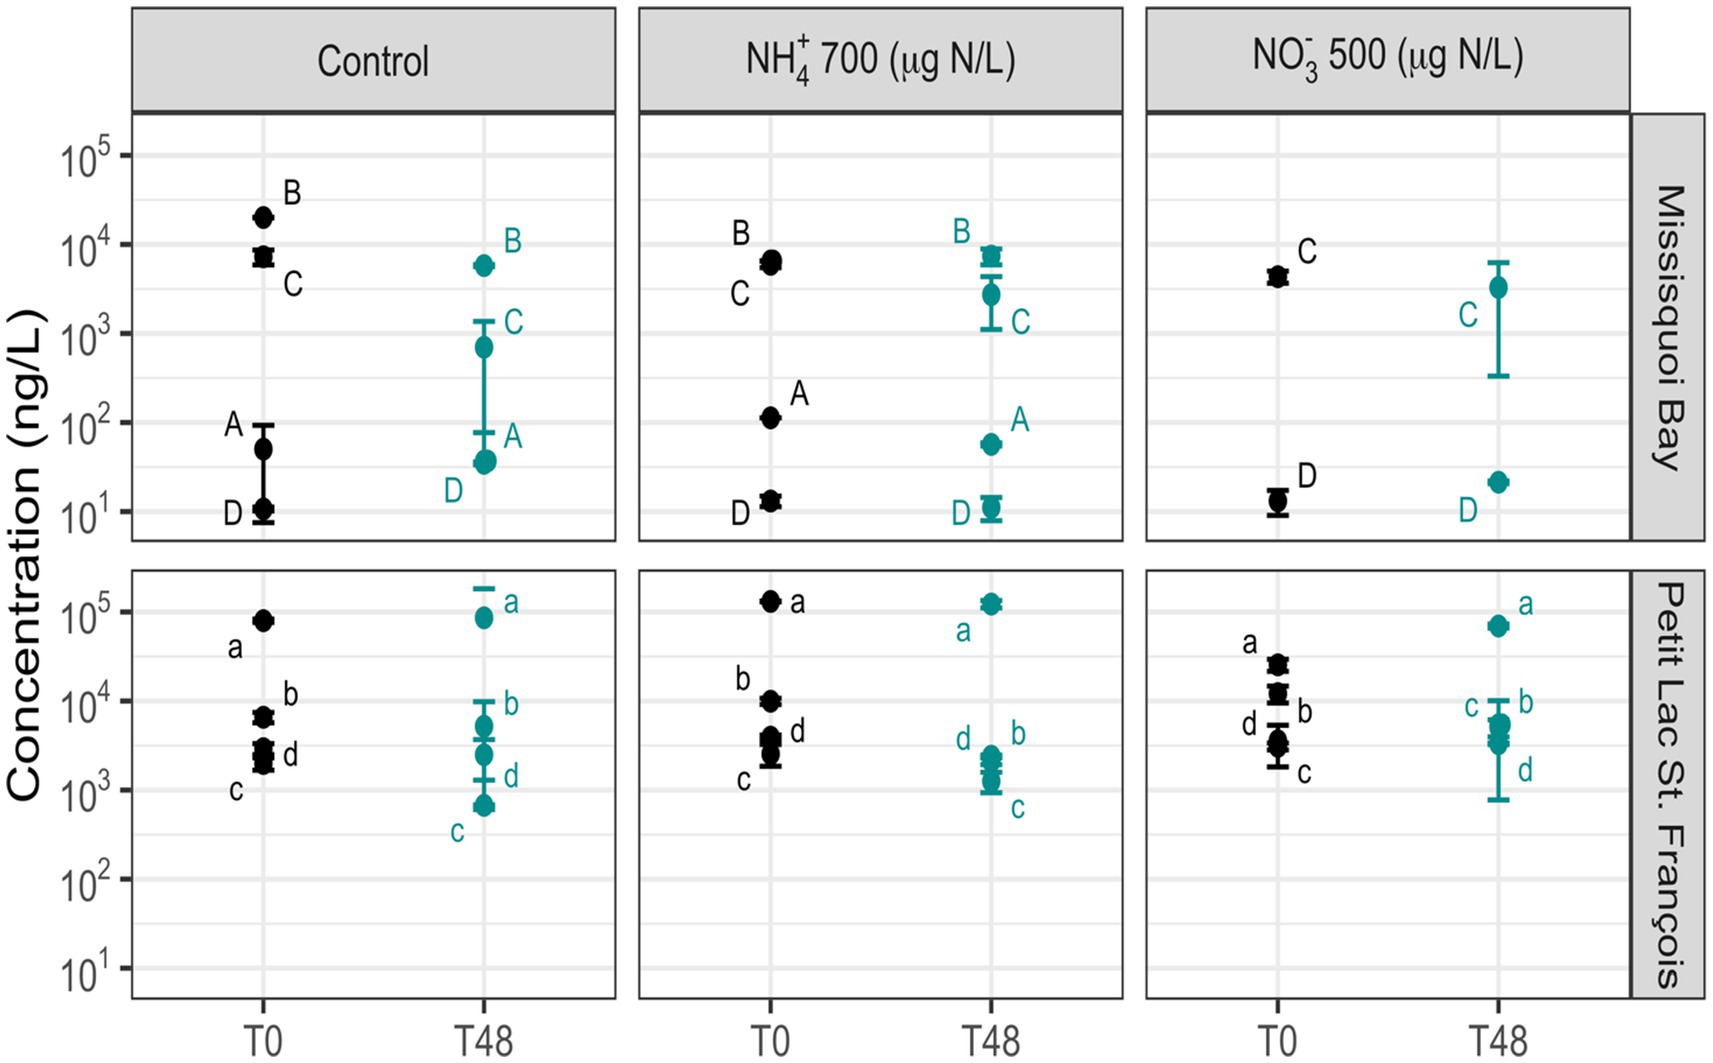
Figure 4. The concentration of total intracellular microcystins in the control, NO3– (500 μg N/L) and NH4+ (700 μg N/L) mesocosms (Mean ± standard deviation). The events are (A) 31 July – 02 August 2018, (B) 24 – 26 September 2018, (C) 322 13 – 15 August 2019, (D) 20 – 22 September 2019; (a) 26 – 28 June 2019; (b) 24 – 26 July 2019; (c) 05 – 07 August 2019; 323 (d) 09 – 11 October 2019. T0 is for before adding nitrogen, and T48 is for after two days following nitrogen addition.
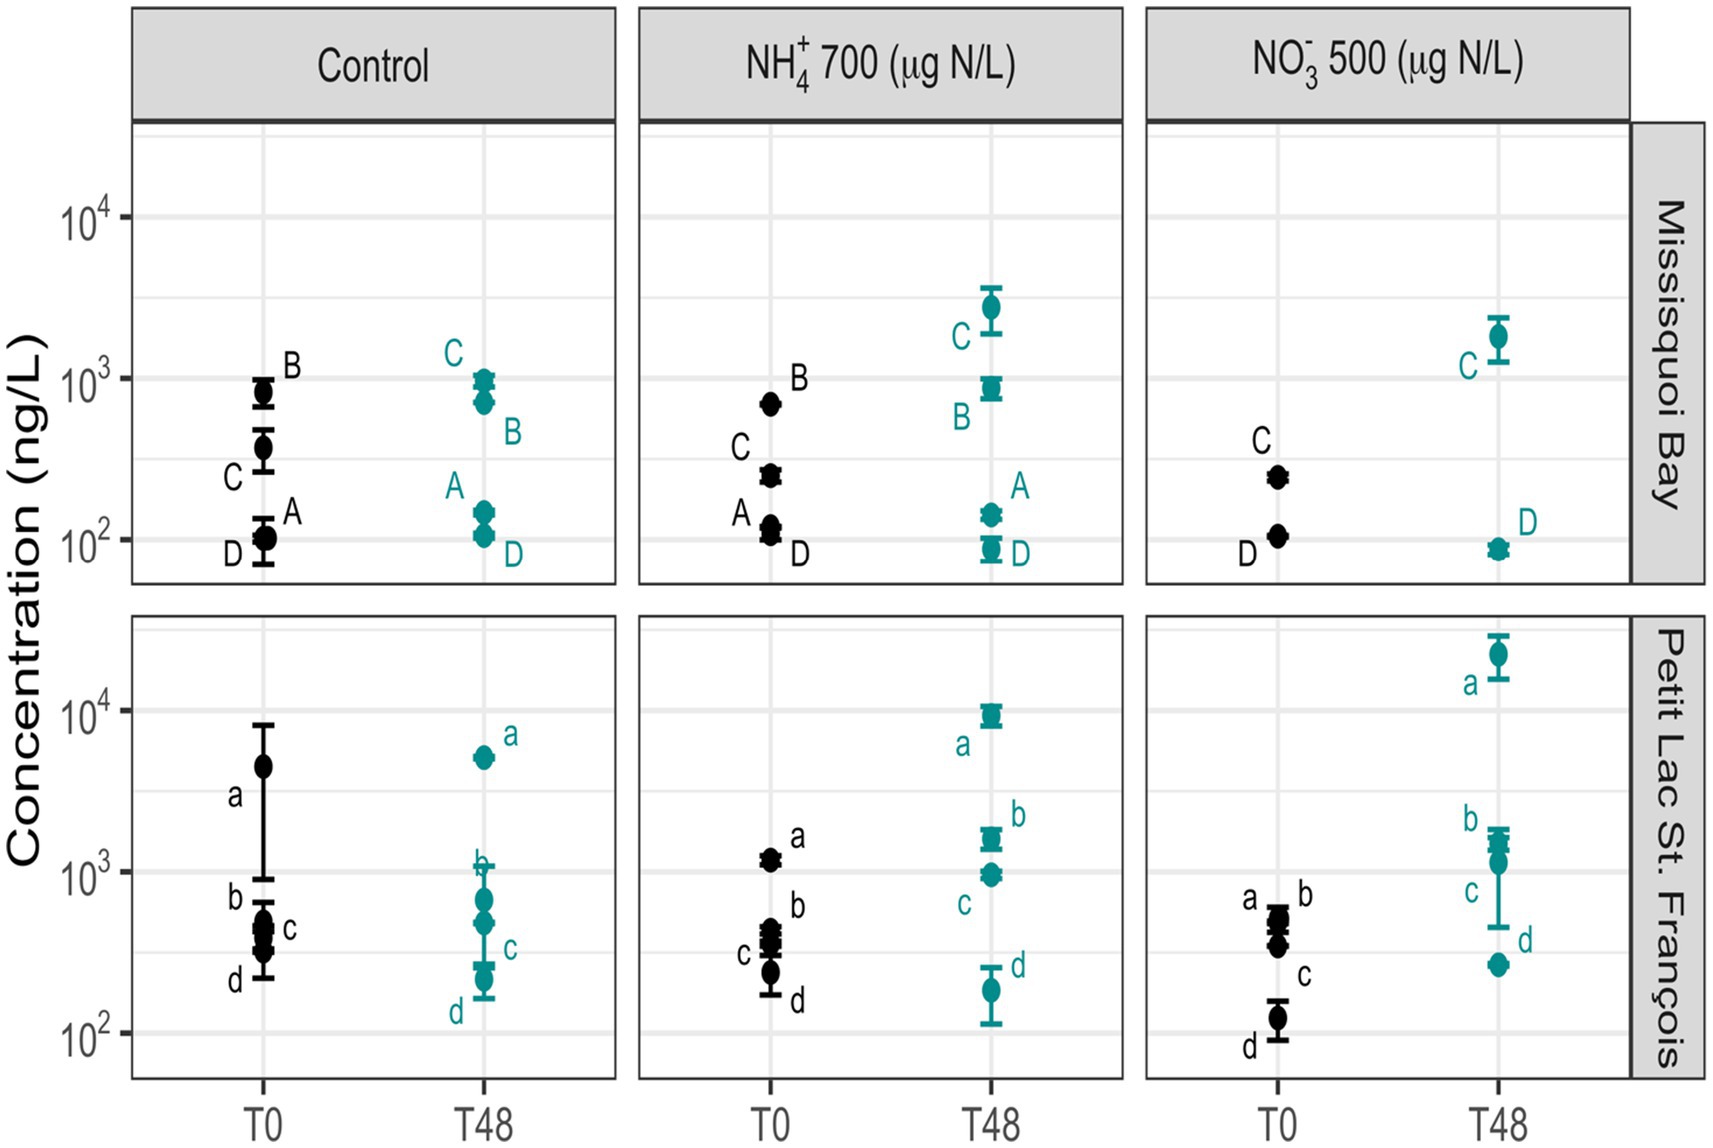
Figure 5. The concentration of total extracellular microcystins in the control, NO3− (500 μg N/L) and NH4+ (700 μg N/L) mesocosms (Mean ± standard deviation). The events are (A) 31 July – 02 August 2018, (B) 24 – 26 September 2018, (C) 337 13 – 15 August 2019, (D) 20 – 22 September 2019; (a) 26 – 28 June 2019; (b) 24 – 26 July 2019; (c) 05 – 07 August 2019; 338 (d) 09 – 11 October 2019. T0 is for before adding nitrogen, and T48 is for after two days following nitrogen addition.
After 48 h, the concentration of intracellular ΣMCs did not change significantly in the mesocosms with added nutrients compared to the control mesocosms at both sites. However, there was a significant increase in extracellular ΣMCs and extracellular MC-LR in the mesocosms containing NO3− 500 μg/L and NH4+ 700 μg/L compared to the control mesocosms (Supplementary Table S11). For the individual intracellular toxins, MC-LY and AP-B significantly changed in the mesocosms with added NO3− compared to the control mesocosms, and there were no significant differences in individual cyanotoxins between the control mesocosms and the mesocosm containing NH4+ (Supplementary Table S11). The composition of intracellular cyanotoxins remained generally stable after 48 h in all mesocosms in almost all events in MB and PLSF (Supplementary Figures S8, S9), while the composition of extracellular cyanotoxins varied at both sites (Supplementary Figures S10, S11).
The increase of extracellular ΣMCs can result from intracellular toxin release following cell death or active toxin production by cyanobacteria. The extracellular ΣMCs did not significantly change in the control mesocosms after 2 days (Figure 5), and Microcystis (the main microcystin-producing cyanobacteria) cells remained intact even with the harsh conditions of parallel coagulation mesocosms over the 2 days (Li et al., 2015; Xu et al., 2016). Therefore, the increase in extracellular ΣMCs was likely enhanced by active toxin production rather than cell death. N enrichment has been associated with the production of cyanotoxins, such as the MCs produced by Microcystis spp. and other bloom-forming cyanobacteria (Donald et al., 2011, 2013; Chen et al., 2019; Krausfeldt et al., 2020). Moreover Carmichael and Boyer (2016) demonstrated that N availability plays an important role to some extent in producing MCs in nature through seven amino acids. On a cellular level, N assimilation in cyanobacteria is carried out by the transcription factor ntcA (Flores and Herrero, 2005; Pimentel and Giani, 2014), and ntc A binds to the mcyD (microcystin biosynthesis gene cluster) promoter region and has direct relevance for the regulation of microcystin synthetase of Microcystis spp (Ginn et al., 2010).
3.5 Impact of environmental conditions on cyanobacterial community in the mesocosms before and after addition
Redundancy analysis (RDA) was performed to evaluate the relationships among nitrogen, the relative abundance of dominant cyanobacteria, and cyanotoxins in Missisquoi Bay and Petit-Lac-St-François. PC1 and PC2 represented 69.1 and 26% of the variation, respectively, at T0. PC1 and PC2 represented 69.1 and 26% of the variation, respectively, at T48 (Figure 6).
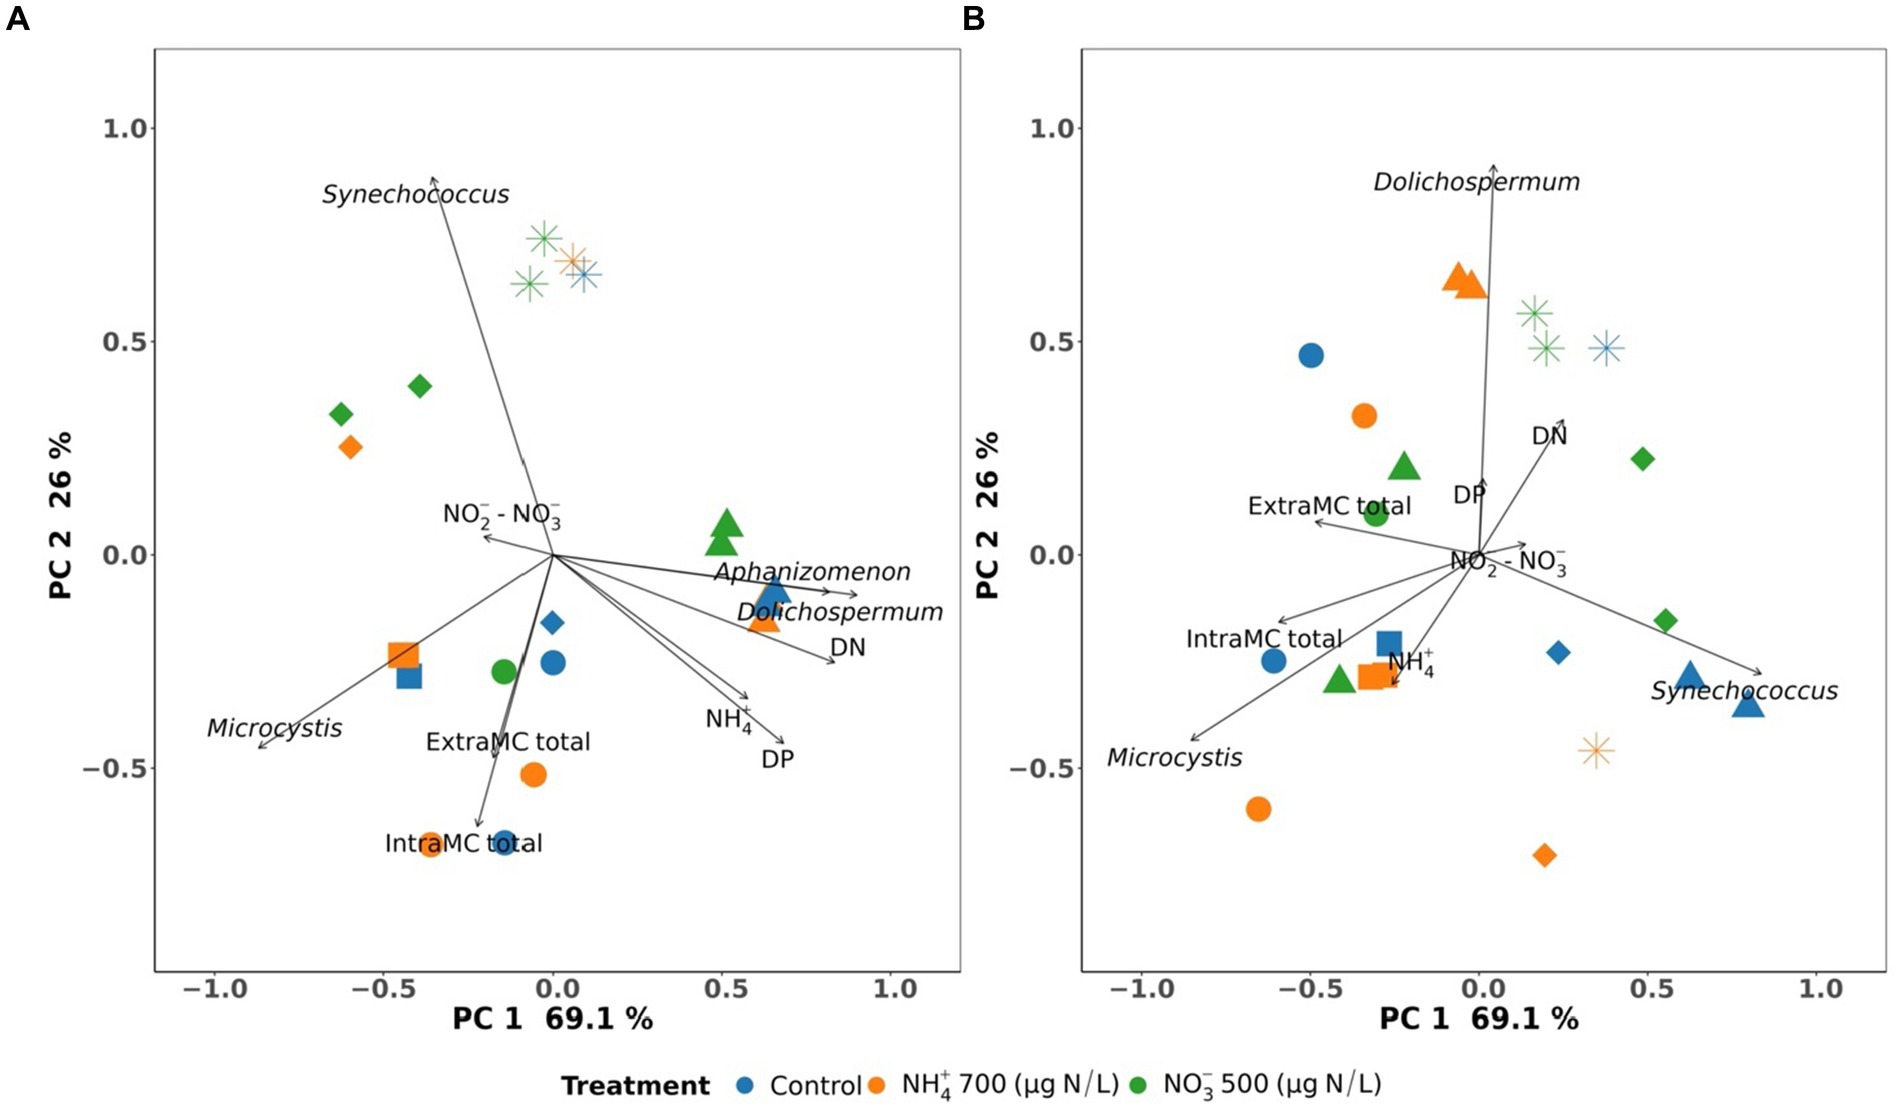
Figure 6. Redundancy analysis (RDA) of environmental parameters concerning cyanobacterial communities in the control, NH4+ and NO3− mesocosms in Missisquoi Bay (■: 24–26 September 2018 and ▲: 13–15 August 2019) and Petit-Lac-St-François (●: 26–28 June 2019; ◆: 24–26 July 2019 and *: 05–07 August 2019). (A) is for sampling before adding nitrogen, and (B) is for sampling after two days following nitrogen addition. Only significant parameters (p < 0.05) are shown, with the exception of NO2− + NO3− parameters.
A relationship was observed between Dolichospermum and Aphanizomenon with NH4+, DN, and DP at the beginning of the studied period (T0), where Dolichospermum and Aphanizomenon were the predominant genera in all mesocosms on 13 August 2019 in MB (Figure 6A). In contrast, the association between Microcystis and Synechococcus and NH4+ was not observed at T0 in other events. After 2 days of exposure (T48), NH4+ was associated with Microcystis in the mesocosm containing NH4+ at T48 on 26 September 2018 in MB, and 28 June, 26 July, and 07 August in 2019 in PLSF (Figure 6B). In addition, Microcystis was associated with intra-and extracellular ΣMCs at both T0 and T48 in this study (Figures 6A,B).
Numerous previous studies showed that the addition of NH4+ promoted the presence of cyanobacteria, especially Microcystis. A recent study by Monchamp and Pick evaluated the effects of different nitrogen forms on the cyanobacterial community in PLSF and found that NH4+ substantially impacted the relative abundance of Microcystis (Monchamp et al., 2014). Moreover, Microcystis is known to have a high affinity for NH4+ (McCarthy et al., 2009; Glibert et al., 2016), and an increase of NH4+ concentrations through decomposition processes could be related to the frequent dominance of Microcystis in the middle of summer (Wetzel and Likens, 2001; Zhang et al., 2008; Gobler et al., 2016). Microcystis has been considered the major producer of MC, and Microcystis is strongly related to microcystin concentrations (Chorus and Bartram, 1999; Rinta-Kanto et al., 2009). This could be a reason for the association between Microcystis and intra-and extracellular ΣMCs at T0 and T48 in this study.
4 Conclusion
• Cyanobacterial species present in Petit-Lac-St-François were less sensitive to the addition of nitrogen, given the higher ratios of N:P at the beginning of the study period.
• Intracellular and extracellular microcystin concentrations were related to the appearance of Microcystis.
• NH4+ was associated with the presence of Microcystis 48 h after the addition of N at both sites.
• Precipitation events leading to increased nitrogen loads in source waters (e.g., stormwater, agricultural runoff, untreated municipal effluents) could result in higher bloom toxicity within a short time frame. Drinking water treatment plants receiving water from surface waters with recurrent blooms should remain vigilant, particularly in the days following such events during cyanobacterial blooms.
• Future research needs include expanding to other forms of nitrogen (e.g., urea) and additional sampling times (e.g., 12 h or 24 h); applying metatranscriptomic analysis to understand the correlations among functional profiles and metabolite release.
Data availability statement
The original contributions presented in the study are included in the article/Supplementary material, further inquiries can be directed to the corresponding author.
Author contributions
KL: Conceptualization, Formal analysis, Methodology, Software, Writing – original draft, Writing – review & editing. JM: Software, Writing – review & editing. T-LN: Formal analysis, Writing – review & editing. EG: Formal analysis, Writing – review & editing. HT: Methodology, Writing – review & editing. NN: Methodology, Writing – review & editing. YT: Software, Writing – review & editing. BS: Writing – review & editing. BH: Formal analysis, Writing – review & editing. AZ: Writing – review & editing. SS: Project administration, Writing – review & editing. MP: Project administration, Writing – review & editing. SD: Project administration, Supervision, Writing – review & editing.
Funding
The author(s) declare that financial support was received for the research, authorship, and/or publication of this article. This research was carried out as a part of the Algal Blooms, Treatment, Risk Assessment, Prediction and Prevention through Genomics Project (ATRAPP) with the financial support of Genome Canada and Génome Québec, grant number Genome Canada/NOA 10512.
Acknowledgments
The authors acknowledge support from Algal Blooms, Treatment, Risk Assessment, Prediction and Prevention through Genomics Project (ATRAPP). The authors sincerely thank the staff at NSERC Industrial Chair on Drinking Water at Polytechnique Montreal, GRIL lab, Dana F. Simon, Quoc-Tuc Dinh and Sung Vo Duy (University of Montréal), Irina Moukhina (Université du Québec à Montréal), Martin (University of Montréal), Kim Gariépy (Polytechnique Montréal), Léonie Lambert-Gosselin (Polytechnique Montréal) and staff at the Philipsburg drinking water treatment plant for their valuable contributions to this research.
Conflict of interest
BH is a president of BlueLeaf Inc.
The remaining authors declare that the research was conducted in the absence of any commercial or financial relationships that could be construed as a potential conflict of interest.
Publisher’s note
All claims expressed in this article are solely those of the authors and do not necessarily represent those of their affiliated organizations, or those of the publisher, the editors and the reviewers. Any product that may be evaluated in this article, or claim that may be made by its manufacturer, is not guaranteed or endorsed by the publisher.
Supplementary material
The Supplementary material for this article can be found online at: https://www.frontiersin.org/articles/10.3389/frwa.2024.1432183/full#supplementary-material
Footnotes
1. ^https://ggplot2.tidyverse.org, accessed on 01 March 2024.
2. ^https://cran.r-project.org/package=vegan, accessed on 10 April 2024.
References
Al-Sammak, M. A., Hoagland, K. D., Cassada, D., and Snow, D. D. (2014). Co-occurrence of the cyanotoxins BMAA, DABA and Anatoxin-a in Nebraska reservoirs, fish, and aquatic plants. Toxins 6, 488–508. doi: 10.3390/toxins6020488
Andersen, I. M., Williamson, T. J., González, M. J., and Vanni, M. J. (2020). Nitrate, ammonium, and phosphorus drive seasonal nutrient limitation of chlorophytes, cyanobacteria, and diatoms in a hyper-eutrophic reservoir. Limnol. Oceanogr. 65, 962–978. doi: 10.1002/lno.11363
Britto, D., and Kronzucker, H. (2002). NH4+ toxicity in higher plants: a critical review. J. Plant Physiol. 159, 567–584. doi: 10.1078/0176-1617-0774
Carmichael, W. (1992). Cyanobacteria secondary metabolites—the cyanotoxins. J. Appl. Bacteriol. 72, 445–459. doi: 10.1111/j.1365-2672.1992.tb01858.x
Carmichael, W. W., and Boyer, G. L. (2016). Health impacts from cyanobacteria harmful algae blooms: implications for the north American Great Lakes. Harmful Algae 54, 194–212. doi: 10.1016/j.hal.2016.02.002
Casero, M. C., Velázquez, D., Medina-Cobo, M., Quesada, A., and Cirés, S. (2019). Unmasking the identity of toxigenic cyanobacteria driving a multi-toxin bloom by high-throughput sequencing of cyanotoxins genes and 16S rRNA metabarcoding. Sci. Total Environ. 665, 367–378. doi: 10.1016/j.scitotenv.2019.02.083
Celikkol, S., Fortin, N., Tromas, N., Andriananjamanantsoa, H., and Greer, C. W. (2021). Bioavailable nutrients (N and P) and precipitation patterns drive cyanobacterial blooms in Missisquoi Bay, Lake Champlain. Microorganisms 9:2097. doi: 10.3390/microorganisms9102097
Chen, Q., Wang, M., Zhang, J., Shi, W., Mynett, A. E., Yan, H., et al. (2019). Physiological effects of nitrate, ammonium, and urea on the growth and microcystins contamination of Microcystis aeruginosa: implication for nitrogen mitigation. Water Res. 163:114890. doi: 10.1016/j.watres.2019.114890
Chorus, I., and Bartram, J. (1999). Toxic cyanobacteria in water: A guide to their public health consequences, monitoring and management/edited by Ingrid Chorus and Jamie Bertram. Geneva: World Health Organization.
Collier, J. L., Brahamsha, B., and Palenik, B. (1999). The marine cyanobacterium Synechococcus sp. WH7805 requires urease (urea amiohydrolase, EC 3.5.1.5) to utilize urea as a nitrogen source: molecular-genetic and biochemical analysis of the enzyme. Microbiology 145, 447–459. doi: 10.1099/13500872-145-2-447
Collos, Y., and Harrison, P. J. (2014). Acclimation and toxicity of high ammonium concentrations to unicellular algae. Mar. Pollut. Bull. 80, 8–23. doi: 10.1016/j.marpolbul.2014.01.006
Cox, M. P., Peterson, D. A., and Biggs, P. J. (2010). Solexa QA: at-a-glance quality assessment of Illumina second-generation sequencing data. BMC Bioinformatics 11:485. doi: 10.1186/1471-2105-11-485
Dai, G.-Z., Shang, J.-L., and Qiu, B.-S. (2012). Ammonia may play an important role in the succession of cyanobacterial blooms and the distribution of common algal species in shallow freshwater lakes. Glob. Chang. Biol. 18, 1571–1581. doi: 10.1111/j.1365-2486.2012.02638.x
De Boutray, M. L. (2017). Les cyanobacteries et leur toxines dans les source d’eau potable: Polytechnique Montréal.
Donald, D. B., Bogard, M. J., Finlay, K., Bunting, L., and Leavitt, P. R. (2013). Phytoplankton-specific response to enrichment of phosphorus-rich surface waters with ammonium, nitrate, and urea. PLoS One 8:e53277. doi: 10.1371/journal.pone.0053277
Donald, D. B., Bogard, M. J., Finlay, K., and Leavitt, P. R. (2011). Comparative effects of urea, ammonium, and nitrate on phytoplankton abundance, community composition, and toxicity in hypereutrophic freshwaters. Limnol. Oceanogr. 56, 2161–2175. doi: 10.4319/lo.2011.56.6.2161
Edler, L., and Elbrächter, M. (2010). The Utermöhl method for quantitative phytoplankton analysis. Microscopic and molecular methods for quantitative phytoplankton. Analysis 55, 13–20.
Erratt, K. J., Creed, I. F., and Trick, C. G. (2018). Comparative effects of ammonium, nitrate and urea on growth and photosynthetic efficiency of three bloom-forming cyanobacteria. Freshw. Biol. 63, 626–638. doi: 10.1111/fwb.13099
Flores, E., and Herrero, A. (2005). Nitrogen assimilation and nitrogen control in cyanobacteria. Biochem. Soc. Trans. 33, 164–167. doi: 10.1042/BST0330164
Fu, L., Niu, B., Zhu, Z., Wu, S., and Li, W. (2012). CD-HIT: accelerated for clustering the next-generation sequencing data. Bioinformatics 28, 3150–3152. doi: 10.1093/bioinformatics/bts565
Ginn, H. P., Pearson, L. A., and Neilan, B. A. (2010). Ntc a from Microcystis aeruginosa PCC 7806 is autoregulatory and binds to the microcystin promoter. Appl. Environ. Microbiol. 76, 4362–4368. doi: 10.1128/AEM.01862-09
Glibert, P. M., Wilkerson, F. P., Dugdale, R. C., Raven, J. A., Dupont, C. L., Leavitt, P. R., et al. (2016). Pluses and minuses of ammonium and nitrate uptake and assimilation by phytoplankton and implications for productivity and community composition, with emphasis on nitrogen-enriched conditions. Limnol. Oceanogr. 61, 165–197. doi: 10.1002/lno.10203
Gobler, C. J., Burkholder, J. M., Davis, T. W., Harke, M. J., Johengen, T., Stow, C. A., et al. (2016). The dual role of nitrogen supply in controlling the growth and toxicity of cyanobacterial blooms. Harmful Algae 54, 87–97. doi: 10.1016/j.hal.2016.01.010
Harke, M. J., Davis, T. W., Watson, S. B., and Gobler, C. J. (2016). Nutrient-controlled niche differentiation of Western Lake Erie cyanobacterial populations revealed via Metatranscriptomic surveys. Environ. Sci. Technol. 50, 604–615. doi: 10.1021/acs.est.5b03931
Harke, M. J., Steffen, M. M., Gobler, C. J., Otten, T. G., Wilhelm, S. W., Wood, S. A., et al. (2016). A review of the global ecology, genomics, and biogeography of the toxic cyanobacterium, Microcystis spp. Harmful Algae 54, 4–20. doi: 10.1016/j.hal.2015.12.007
Harris, T. D., Wilhelm, F. M., Graham, J. L., and Loftin, K. A. (2014). Experimental manipulation of TN:TP ratios suppress cyanobacterial biovolume and microcystin concentration in large-scale in situ mesocosms. Lake Reserv. Manage. 30, 72–83. doi: 10.1080/10402381.2013.876131
Havens, K. E., James, R. T., East, T. L., and Smith, V. H. (2003). N:P ratios, light limitation, and cyanobacterial dominance in a subtropical lake impacted by non-point source nutrient pollution. Environ. Pollut. 122, 379–390. doi: 10.1016/S0269-7491(02)00304-4
Hecky, R. E., Campbell, P., and Hendzel, L. L. (1993). The stoichiometry of carbon, nitrogen, and phosphorus in particulate matter of lakes and oceans. Limnol. Oceanogr. 38, 709–724. doi: 10.4319/lo.1993.38.4.0709
Jalili, F., Trigui, H., Guerra Maldonado, J. F., Dorner, S., Zamyadi, A., Shapiro, B. J., et al. (2021). Can cyanobacterial diversity in the source predict the diversity in sludge and the risk of toxin release in a drinking water treatment plant? Toxins (Basel) 13:10025. doi: 10.3390/toxins13010025
Kim, K., Mun, H., Shin, H., Park, S., Yu, C., Lee, J., et al. (2020). Nitrogen stimulates Microcystis-dominated blooms more than phosphorus in river conditions that favor non-nitrogen-fixing genera. Environ. Sci. Technol. 54, 7185–7193. doi: 10.1021/acs.est.9b07528
Kim, K. H., Yoon, Y., Hong, W.-Y., Kim, J., Cho, Y.-C., and Hwang, S.-J. (2018). Application of metagenome analysis to characterize the molecular diversity and saxitoxin-producing potentials of a cyanobacterial community: a case study in the North Han River, Korea. Appl. Biol. Chem. 61, 153–161. doi: 10.1007/s13765-017-0342-4
Krausfeldt, L. E., Farmer, A. T., Castro, H. F., Boyer, G. L., Campagna, S. R., and Wilhelm, S. W. (2020). Nitrogen flux into metabolites and microcystins changes in response to different nitrogen sources in Microcystis aeruginosa NIES-843. Environ. Microbiol. 22, 2419–2431. doi: 10.1111/1462-2920.15032
Le, K. T., Goitom, E., Trigui, H., Sauvé, S., Prévost, M., and Dorner, S. (2021). The effects of ferric sulfate (Fe2 (SO4)3) on the removal of Cyanobacteria and cyanotoxins: a Mesocosm experiment. Toxins. 13:753. doi: 10.3390/toxins13110753
Le, K. T. N., Maldonado, J. F. G., Goitom, E., Trigui, H., Terrat, Y., Nguyen, T.-L., et al. (2022). Shotgun metagenomic sequencing to assess cyanobacterial community composition following coagulation of cyanobacterial blooms. Toxins 14:688. doi: 10.3390/toxins14100688
Lévesque, B., Gervais, M.-C., Chevalier, P., Gauvin, D., Anassour-Laouan-Sidi, E., Gingras, S., et al. (2014). Prospective study of acute health effects in relation to exposure to cyanobacteria. Sci. Total Environ. 466-467, 397–403. doi: 10.1016/j.scitotenv.2013.07.045
Li, J., Hansson, L.-A., and Persson, K. M. (2018). Nutrient control to prevent the occurrence of cyanobacterial blooms in a eutrophic Lake in southern Sweden, used for drinking water supply. Water 10:919. doi: 10.3390/w10070919
Li, Q., Lin, F., Yang, C., Wang, J., Lin, Y., Shen, M., et al. (2018). A large-scale comparative metagenomic study reveals the functional interactions in six bloom-forming Microcystis-Epibiont communities. Front. Microbiol. 9:746. doi: 10.3389/fmicb.2018.00746
Li, X., Pei, H., Hu, W., Meng, P., Sun, F., Ma, G., et al. (2015). The fate of Microcystis aeruginosa cells during the ferric chloride coagulation and flocs storage processes. Environ. Technol. 36, 920–928. doi: 10.1080/09593330.2014.966768
McCarthy, M., James, R., Chen, Y., East, T., and Gardner, W. (2009). Nutrient ratios and phytoplankton community structure in the large, shallow, eutrophic, Subtropical Lakes Okeechobee (Florida, USA) and Taihu (China). Limnology 10, 215–227. doi: 10.1007/s10201-009-0277-5
McQuaid, N., Zamyadi, A., Prevost, M., Bird, F., and Dorner, S. (2011). Use of in vivophycocyanin fluorescence to monitor potential microcystin-producing cyanobacterial biovolume in a drinkingwater source. J. Environ. Monit. 13, 455–463. doi: 10.1039/C0EM00163E
Medalie, L., Hirsch, R. M., and Archfield, S. A. (2012). Use of flow-normalization to evaluate nutrient concentration and flux changes in Lake Champlain tributaries, 1990–2009. J. Great Lakes Res. 38, 58–67. doi: 10.1016/j.jglr.2011.10.002
Monchamp, M.-E., Pick, F., Beisner, B., and Maranger, R. (2014). Nitrogen forms influence microcystin concentration and composition via changes in cyanobacterial community structure. PLoS One 9:e85573. doi: 10.1371/journal.pone.0085573
Moore, L. R., Post, A. F., Rocap, G., and Chisholm, S. W. (2002). Utilization of different nitrogen sources by the marine cyanobacteria Prochlorococcus and Synechococcus. Limnol. Oceanogr. 47, 989–996. doi: 10.4319/lo.2002.47.4.0989
Moradinejad, S., Trigui, H., Guerra Maldonado, J. F., Shapiro, J., Terrat, Y., Zamyadi, A., et al. (2020). Diversity assessment of toxic cyanobacterial blooms during oxidation. Toxins (Basel) 12:728. doi: 10.3390/toxins12110728
Munoz, G., Vo Duy, S., Roy-Lachapelle, A., Husk, B., and Sauvé, S. (2017). Analysis of individual and total microcystins in surface water by online preconcentration and desalting coupled to liquid chromatography tandem mass spectrometry. J. Chromatogr. A 1516, 9–20. doi: 10.1016/j.chroma.2017.07.096
Ndong, M., Bird, D., Nguyen-Quang, T., de Boutray, M.-L., Zamyadi, A., Vinçon-Leite, B., et al. (2014). Estimating the risk of cyanobacterial occurrence using an index integrating meteorological factors: application to drinking water production. Water Res. 56, 98–108. doi: 10.1016/j.watres.2014.02.023
Paerl, H. W., Hall, N. S., and Calandrino, E. S. (2011). Controlling harmful cyanobacterial blooms in a world experiencing anthropogenic and climatic-induced change. Sci. Total Environ. 409, 1739–1745. doi: 10.1016/j.scitotenv.2011.02.001
Pimentel, J. S. M., and Giani, A. (2014). Microcystin production and regulation under nutrient stress conditions in toxic microcystis strains. Appl. Environ. Microbiol. 80, 5836–5843. doi: 10.1128/AEM.01009-14
R Core Team (2020). R: A Language and Environment for Statistical Computing. Available at: https://www.R-project.org/
Reynoso, G., Smith, M. R., Holmes, C. P. 2nd, Keelan, C. R., McGrath, S. E., Alvarez, G. H., et al. (2019). Bacterial community structure and response to nitrogen amendments in Lake Shenandoah (VA, USA). Water Sci. Technol. 80, 675–684. doi: 10.2166/wst.2019.311
Rinta-Kanto, J. M., Konopko, E. A., DeBruyn, J. M., Bourbonniere, R. A., Boyer, G. L., and Wilhelm, S. W. (2009). Lake Erie Microcystis: relationship between microcystin production, dynamics of genotypes and environmental parameters in a large lake. Harmful Algae 8, 665–673. doi: 10.1016/j.hal.2008.12.004
Roy-Lachapelle, A., Vo Duy, S., Munoz, G., Dinh, Q. T., Bahl, E., Simon, D., et al. (2019). Analysis of multiclass cyanotoxins (microcystins, anabaenopeptins, cylindrospermopsin and anatoxins) in lake waters using online SPE liquid chromatography high-resolution Orbitrap mass spectrometry. Anal. Methods 11, 5289–5300. doi: 10.1039/C9AY01132C
Shan, K., Song, L., Chen, W., Li, L., Liu, L., Wu, Y., et al. (2019). Analysis of environmental drivers influencing interspecific variations and associations among bloom-forming cyanobacteria in large, shallow eutrophic lakes. Harmful Algae 84, 84–94. doi: 10.1016/j.hal.2019.02.002
Svirčev, Z., Lalić, D., Bojadžija Savić, G., Tokodi, N., Drobac Backović, D., Chen, L., et al. (2019). Global geographical and historical overview of cyanotoxin distribution and cyanobacterial poisonings. Arch. Toxicol. 93, 2429–2481. doi: 10.1007/s00204-019-02524-4
Swarbrick, V. J., Simpson, G. L., Glibert, P. M., and Leavitt, P. R. (2019). Differential stimulation and suppression of phytoplankton growth by ammonium enrichment in eutrophic hardwater lakes over 16 years. Limnol. Oceanogr. 64, S130–S149. doi: 10.1002/lno.11093
Trommer, G., Poxleitner, M., and Stibor, H. (2020). Responses of lake phytoplankton communities to changing inorganic nitrogen supply forms. Aquat. Sci. 82:22. doi: 10.1007/s00027-020-0696-2
United States Environmental Protection Agency (1974). Method 415.1. Organic carbon, total (combustion or oxidation).
United States Environmental Protection Agency (1978). Method 365.3: Phosphorous, all forms (colorimetric, ascorbic acid, two reagent).
United States Environmental Protection Agency (1993a). Method 353.2, revision 2.0: Determination of nitrate-nitrite nitrogen by automated colorimetry.
United States Environmental Protection Agency (1993b). Method 350.1: Determination of ammonia nitrogen by semi-automated colorimetry.
Wacklin, P., Hoffmann, L., and Komárek, J. (2009). Nomenclatural validation of the genetically revised cyanobacterial genus Dolichospermum (Ralfs ex Bornet et Flahault) comb. nova. Fottea 9, 59–64. doi: 10.5507/fot.2009.005
Wang, K., Wommack, K. E., and Chen, F. (2011). Abundance and distribution of Synechococcus spp. and cyanophages in the Chesapeake Bay. Appl. Environ. Microbiol. 77, 7459–7468. doi: 10.1128/AEM.00267-11
Wetzel, R. G., and Likens, G. E. (2001). Limnology: Lake and river Ecosystems. Amsterdam, Netherlands: Elsevier Science.
Wheeler, S. M., Morrissey, L. A., Levine, S. N., Livingston, G. P., and Vincent, W. F. (2012). Mapping cyanobacterial blooms in Lake Champlain's Missisquoi Bay using quick Bird and MERIS satellite data. J. Great Lakes Res. 38, 68–75. doi: 10.1016/j.jglr.2011.06.009
Wilhelm, S. W., Bullerjahn, G. S., and McKay, R. M. L. (2020). The complicated and confusing ecology of Microcystis blooms. MBio 11:20. doi: 10.1128/mBio.00529-20
Wood, S., Dietrich, D. R., Cary, S. C., and Halmiton, D. P. (2012). Increasing Microcystis cell density enhances microcystin synthesis: A mesocosm study. Inland Waters 2, 17–22. doi: 10.5268/IW-2.1.424
Xu, H., Pei, H., Xiao, H., Jin, Y., Li, X., Hu, W., et al. (2016). Behaviors of Microcystis aeruginosa cells during floc storage in drinking water treatment process. Sci. Rep. 6:34943. doi: 10.1038/srep34943
Zamyadi, A., Dorner, S., Sauvé, S., Ellis, D., Bolduc, A., Bastien, C., et al. (2013). Species-dependence of cyanobacteria removal efficiency by different drinking water treatment processes. Water Res. 47, 2689–2700. doi: 10.1016/j.watres.2013.02.040
Zamyadi, A., Mac Leod, S. L., Fan, Y., McQuaid, N., Dorner, S., Sauvé, S., et al. (2012). Toxic cyanobacterial breakthrough and accumulation in a drinking water plant: a monitoring and treatment challenge. Water Res. 46, 1511–1523. doi: 10.1016/j.watres.2011.11.012
Zhang, H., Culver, D. A., and Boegman, L. (2008). A two-dimensional ecological model of Lake Erie: application to estimate dreissenid impacts on large lake plankton populations. Ecol. Model. 214, 219–241. doi: 10.1016/j.ecolmodel.2008.02.005
Keywords: cyanobacteria blooms, mesocosms, microcystins, nitrogen, shotgun metagenomic
Citation: Le KTN, Maldonado JFG, Nguyen T-L, Goitom E, Trigui H, Ndiaye NA, Terrat Y, Shapiro BJ, Husk B, Zamyadi A, Sauvé S, Prévost M and Dorner S (2024) The short-term effect of nitrogen on freshwater cyanobacteria and cyanotoxins. Front. Water. 6:1432183. doi: 10.3389/frwa.2024.1432183
Edited by:
Prabhakar Sharma, Nagaland University, IndiaReviewed by:
Matthew Daniel Stocker, Agricultural Research Service (USDA), United StatesMai-Lan Pham, University for Continuing Education Krems, Austria
Copyright © 2024 Le, Maldonado, Nguyen, Goitom, Trigui, Ndiaye, Terrat, Shapiro, Husk, Zamyadi, Sauvé, Prévost and Dorner. This is an open-access article distributed under the terms of the Creative Commons Attribution License (CC BY). The use, distribution or reproduction in other forums is permitted, provided the original author(s) and the copyright owner(s) are credited and that the original publication in this journal is cited, in accordance with accepted academic practice. No use, distribution or reproduction is permitted which does not comply with these terms.
*Correspondence: Kim Thien Nguyen Le, dGhpZW4ta2ltLmxlLW5ndXllbkBwb2x5bXRsLmNh