- 1Department of Water Resources, Changjiang River Scientific Research Institute, Wuhan, China
- 2Science and Technology Promotion Centre, Ministry of Water Resources, Beijing, China
Background: Rapid population growth, urbanization, and high-intensity infrastructure development have challenged cities sustainable development. Surface water flooding occurs as a result of heavy rainfall which generates runoff that exceeds infiltration rates and local drainage capacity. In China, 70 cities have been chosen as pilot cities for sponge city construction building to address this challenge.
Method: This paper takes the South Trunk Canal in Qingshan Demonstration Area of Wuhan Sponge City as the study area. Based on construct a Stormwater Management Model (SWMM), simulate and analyze the runoff process and the drainage capacity of the pipe network before and after the construction of the sponge city in typical years with high, normal and low water flows and different return periods.
Result: The results show that the construction of sponge cities can significantly regulate the annual runoff in various typical target years and mitigate the overflow in 1- and 5- year return period. However, when faced with the short-duration storm events, the measures involved in urban sponge regulations are only effective for rainfall with 1-year return period. As the scale of the flood events increases, the effectiveness of urban sponge regulations becomes more limited.
Discussion: To address these issues, the National Water Network Project is proposed for the construction of water system connections. The aim of this project is to rectify the shortcomings of sponge cities while also making better use of water resources to improve overall resilience.
1 Introduction
In recent years, rapid population growth, urbanization, and high-intensity infrastructure development have challenged sustainable development. In many cities, permeable vegetated surfaces have been replaced by impervious surfaces, resulting in poor drainage and heat dissipation (Guan et al., 2021). As a result, urban flooding has become a major problem in China. Given that the drainage systems designed in the Outdoor Drainage Design Code are only suitable for rainstorms with a maximum return period of 3–5 years, persistent flooding has occurred following extreme rainstorms, resulting in numerous deaths and injuries and affecting many more people. Various studies have reported that flooding is expected to occur more frequently in the context of global climate change (Jia et al., 2021). Thus, effective flood risk management is imperative (Chan Shun et al., 2018). To address such problems, China has developed a solution that involves the construction of “sponge cities.”
The concept of sponge cities is somewhat similar to low-impact development (LID) in the US (Pyke et al., 2011), sustainable drainage systems in the UK (Mitchell, 2005), and water-sensitive urban design (Morison and Brown, 2011) in Australia. However, unlike LID, which aims to solve the runoff and pollution problems arising from heavy rainfall, sponge cities are not entirely focused on restoring the original hydrological environment of the site. Additionally, sponge cities are not focused on adjusting the overall drainage facilities and optimizing the hydrological environment through a combination of water management, water quality management, and water landscape recreation, as in the case of sustainable drainage systems. The concept of sponge cities is to build urban areas that can cope with various changes in the water environment and freely realize the process of storing and releasing rainwater (Wang et al., 2020). Sponge cities are intended to incorporate wetlands, forests, lakes, green roofs, and permeable pavements. LID features such as bioswales, rain gardens, permeable pavements, and green roofs can reduce the peak flows experienced by urban runoff land drainage systems, while also increasing soil infiltration and stormwater retention, recharging groundwater, and improving runoff quality. Increasing the area of urban greenspace creates new habitats for a wide range of organisms, thus improving the diversity of urban ecosystems, and well-planned infrastructure of this type can also enhance the livability of an area through the creation of larger recreational spaces (e.g., urban wetland parks), providing multiple benefits to the general public (Wang et al., 2017).
Based on the many advantages of sponge cities, pilot schemes have gradually expanded from the first batch of 16 cities to include 70 cities in China today. According to the Guidelines for the Construction of Sponge Cities, the objective of this approach was to increase the area of urban land capable of absorbing surface water discharges by about 20% by 2020 and to retain or reuse about 70% of urban rainwater; by 2030, it is intended that up to 80% of rainwater will be recycled (Chan Shun et al., 2018). Currently, after more than 8 years of construction, many sponge facilities have been implemented. This paper analyzes the completed sponge facilities in the Qingshan Demonstration Area of Wuhan City, China, through the stormwater management model (SWMM). We study the effectiveness of the construction of this sponge city, identify any deficiencies, and make recommendations for improvements. It is hoped that this paper will provide insights into urban renewal planning for future sponge cities.
2 Study area and method
2.1 Overview of study area
2.1.1 Geographic location and rainfall
The study area, the South Trunk Canal Park, is located in Qingshan District of Wuhan City. The Qingshan Sponge City Demonstration Area of Wuhan was one of the first batch of pilot sponge city schemes in China. The area covers a total area of 3.84 km2, within the hardened pavements covers an area of 3.11 km2, which is part of the Gangxi Drainage System, has a catchment area of 9.5 km2, located in the middle reach of the Gangxi rainwater drainage system. This area receives the confluent rainwater from the upper reaches in the south. The rainwater is regulated and stored in Heping Park before being transferred to the Gangxi Pumping Station in the north and finally discharged into the Changjiang River (Figure 1). The total length of the pipes within the System is 39 km and the pipe density is 5.1 km/km2.
2.1.2 Rainfall scenarios
The rainfall is concentrated in early summer (the rainy season), and the annual precipitation is about 1,200 mm. According to statistical analysis, the 24-h rainfall with a return period of 1 year is 95 mm and that with a return period of 50 years is 291 mm in Wuhan. Rainfall of different return periods in Wuhan are based on data collated by the Hubei Provincial Hydrology and Water Resources Investigation Bureau (Table 1).
Using annual rainfall data for typical years with high, normal, and low water flows, the daily rainfall was calculated and used as the model input. The output from the SWMM enabled us to obtain the runoff process in typical years.
The rainfall data of various return periods is based on the Standards for Planning and Design of Drainage and Food Control System of Wuhan (Draft for Comments) (October 2013) and relevant reference materials. The short-duration rainstorm intensity formulas for Wuhan are as follows (Equation 1):
where is the design rainstorm intensity [L/(s·hm2)]; is the return period (y); and is the rainfall duration (min). According to these rainstorm intensity formulas, the 2-h rainfall was calculated for various return periods and used to model the corresponding runoff process.
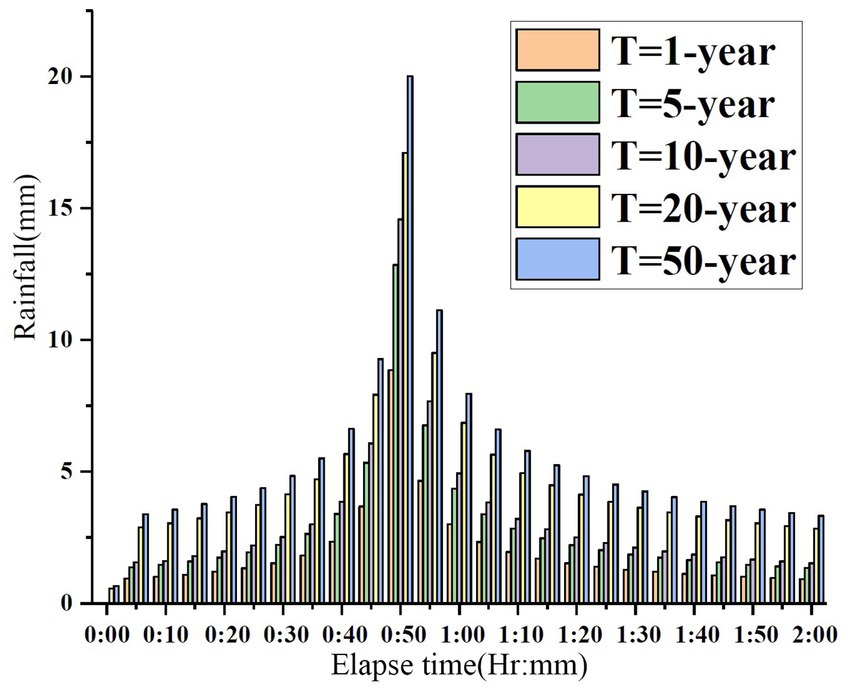
The Chicago storm hyetograph model is adopted for short-duration storms in Wuhan. Based on multi-year regression analysis and empirical induction, the rain peak coefficient r is set to 4. Taking 5 min as the time step, the 2-h rainfall distribution for different return periods in Wuhan is shown in Figure 2.
The main purpose of building sponge cities is to alleviate urban waterlogging, which is primarily caused by rainfall runoff and insufficient pipe network drainage capacity. Therefore, this study uses the runoff volume, peak value, and pipe network drainage capacity as indicators and conducts a quantitative assessment regarding the effectiveness of sponge city construction specifications.
2.1.3 Land use
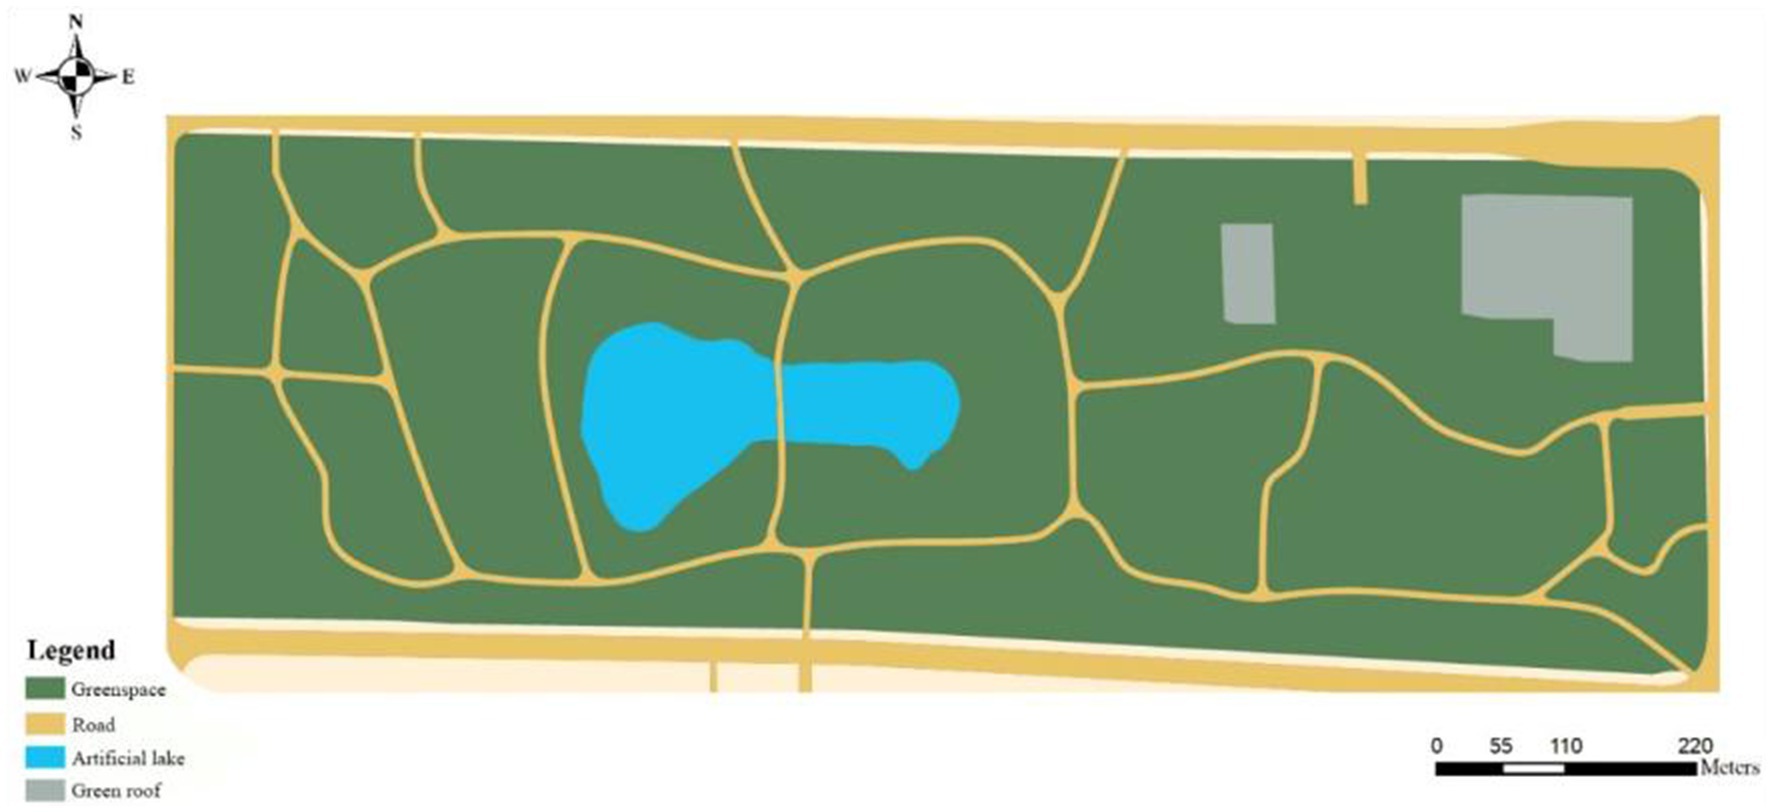
According to the design requirements, the main purpose of sponge cities renovation is to cope with a return period of 5 years and facilitate the conveyance of rainwater into the reservoir area and its connection to the municipal drains through the overflow facilities. This includes the transformation of impermeable pavement into a permeable surface and the conversion of hard berms into vegetated ditches and low-lying grassed catchment areas. Utilization of lands at the study area is mainly obtained through field investigation for the program, which is mainly classified into four major categories, namely, green space, roads, artificial lake and squares. Based on statistics, the planned area is 51,470 m2 in total, including 42681m2, for green spaces, 3,444 m2 for water area and 5,345 m2 for roads and green roof area (Figure 3).
2.2 Model and scheme construction
2.2.1 Model introduction
The SWMM was initially developed by the US Environmental Protection Agency in 1971. This dynamic rainfall runoff simulation model is mainly used at the planning and design stage. In sponge cities, the runoff response to rainfall exhibits significant nonlinear characteristics, which can be directly depicted by the SWMM (Yang et al., 2023). Additionally, the SWMM can simulate and assess the regulating effect of LID measures on urban surface runoff water quality and basins of various sizes based on surface information and underground pipe data (Zhang et al., 2012). The SWMM provides three infiltration models, namely, the Horton model, Green–Ampt model, and SCS-CN model. Soil data from the study area are limited, and the study area is relatively small and located in a city. Thus, the Horton infiltration model is most suitable. This is an empirical formula used to describe the exponential decrease in the infiltration rate with the rainfall duration (Equation 2):
where is the infiltration rate of the study area at time t, mm/h; is the stable infiltration rate, mm/h; is the initial infiltration rate, mm/h; is the infiltration attenuation coefficient, h−1; and is the rainfall duration, h.
The SWMM adopts the nonlinear reservoir method for surface confluence calculations. Each sub-catchment area is used as a nonlinear reservoir, with inflow items including rainwater and water from upstream sub-catchment areas and outflow items including infiltration, evaporation, surface runoff, and maximum depression storage capacity (nonlinear reservoir capacity). Surface runoffs can only be produced when the water depth d of the nonlinear reservoir exceeds the maximum depression storage water depth dp. The surface runoff volume is calculated with the continuity equation and the Manning formula as follows (Equation 3):
where V is the volume of surface water accumulated, V = Ad; d is the water depth; t is time; A is the ground area; i is the net rainfall; and Q is the outflow quantity (Equation 4).
where W is the width of the sub-confluence area; is the Manning coefficient; d is the water depth; is the maximum depression storage depth; and is the slope of the sub-catchment area.
Based on the pipe network conditions of the study area and the calculation accuracy requirements, we adopt the widely applied kinematic wave method, which uses the continuous momentum conservation equation to calculate the water flow in each conduit and considers the water surface slope to be the same as the conduit slope.
2.2.2 Model generalization and parameter calibration
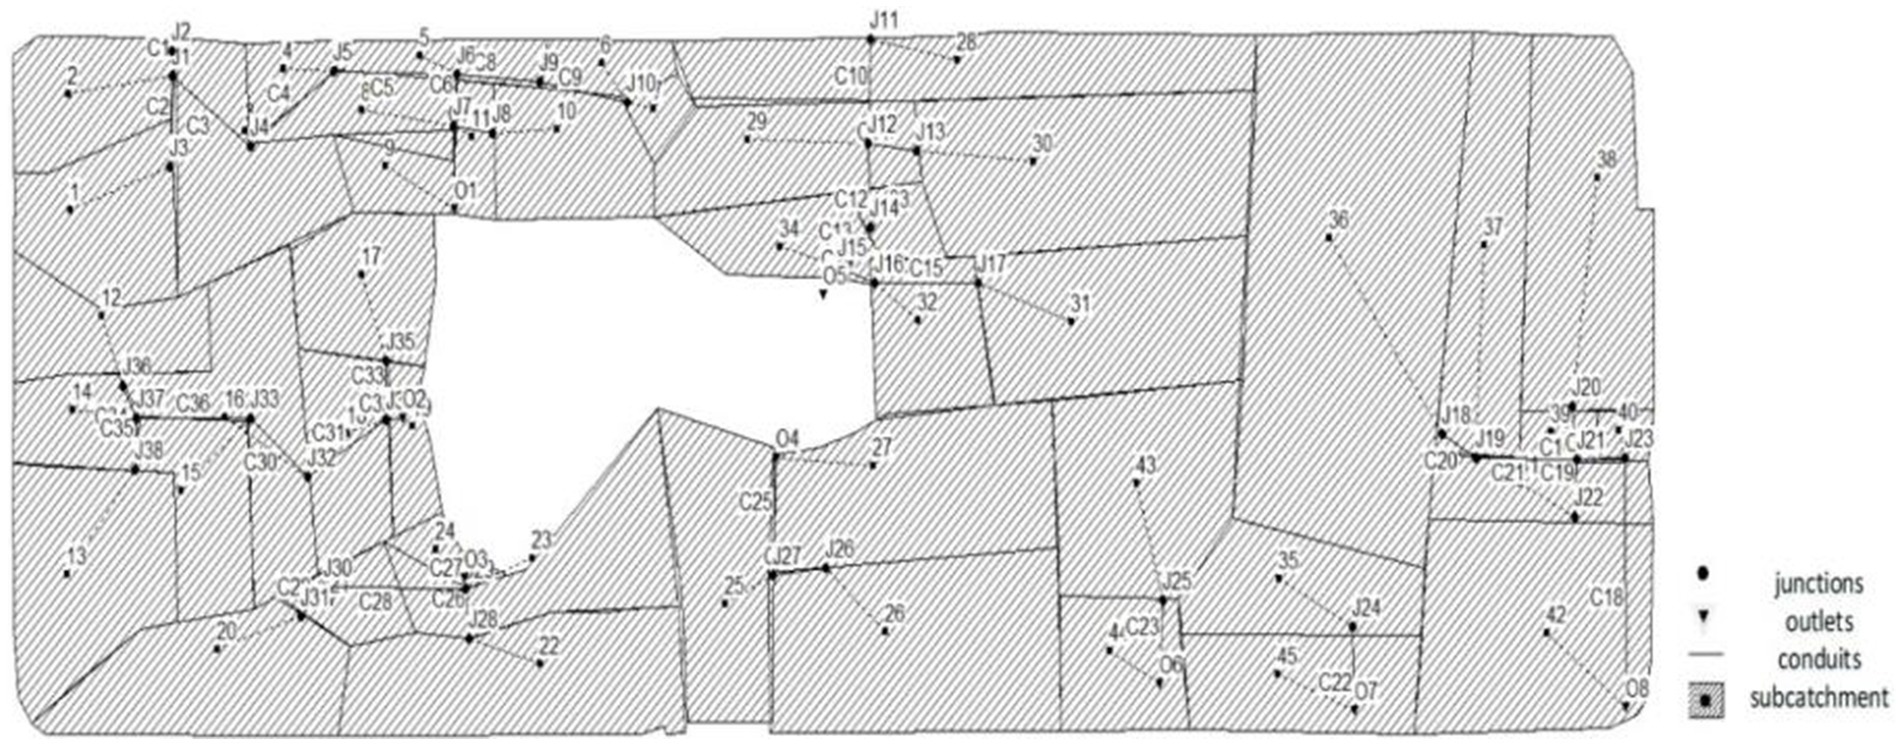
Considering the underlying surface, planned land uses, and drainage pipe network data of the pilot area, an SWMM covering a building area of about 51,420 m2 is constructed. This includes 45 sub-catchment areas, 36 pipe sections, 38 nodes, and 8 outlets. Figure 4 shows the generalized model of the pilot area.
The necessary hydrological parameters include climate parameters such as rainfall and evaporation, plot characteristic parameters such as the sub-catchment areas, impermeability rates, confluence width and slope, Manning roughness, surface depression storage capacity, and infiltration model parameters, which are set according to the typical ranges provided in the SWMM manual. The hydraulic parameters include the drainage pipe network characteristics. These can be obtained from the pipe network materials. The various hydrological and hydraulic parameters used in our model are as follows:
2.2.2.1 Sub-catchment area parameters
For each sub-catchment area, the following input parameters are required: the area of the sub-catchment, the confluence width, the percentage of the surface that is impervious to water (%Imperv), the slope (%Slope), the Manning coefficients for the impervious and pervious areas (N-imperv and N-perv), the depression storage capacity of pervious and impervious surfaces (Des-imperv and Des-perv), the percentage of the impervious area with no depression storage (%Zero-imperv), and the pervious surface infiltration model. We adopt the Horton infiltration model, the main parameters of which are the maximum infiltration (Max.Infil), minimum infiltration (Min.Infil), decay constant, and drying time. The sub-catchment area, confluence width, %Imperv, and %Slope can be obtained through direct calculations in ArcGIS using basic data of the study area. The Manning coefficient, surface depression storage capacity, and infiltration model parameters can be adjusted according to typical values provided in the SWMM manual and test values. The specific values used in our simulations are listed in Table 2.
2.2.2.2 Hydraulic parameters
The main hydraulic parameters are the drainage pipe network characteristics, including the Manning coefficient of the pipes, the pipe property parameters, and the joint property parameters. The rainwater pipes in the area are round, and the pipe diameter can be obtained directly from the pipe network design materials. The rainwater open channel values are obtained from the design materials, and the pipe length is obtained via the model’s automatic measuring tool. Based on the SWMM manual, the Manning coefficient of the rainwater pipes is 0.013 and that of the rainwater open channels is 0.025. Among the inspection well parameters of the area, the pipe invert elevation is determined from the pipe network design materials and the maximum depth is determined from the difference between the ground elevation of a particular node and the pipe invert elevation.
2.2.2.3 LID settings
The construction of LID areas is based on the Technical Guideline for Sponge City—Construction of A Low Influence Development Rainwater System (Tentative) (October, 2014). Green roofs are adopted in residential and commercial areas, pervious surfaces are used for pavements or squares, and rainwater gardens are implemented for roadside lawns or parks. The number and area of LID facilities deployed are based on the current state of construction in the study area.
2.3 Simulation scheme
The SWMM and the rainfall conditions of typical years and various return periods were used to conduct simulations and analysis of the runoff process and pipe network drainage capacity before and after the construction of the Qingshan Sponge City Demonstration Area.
Before the construction of the sponge city, the Qingshan Demonstration Area was mostly hard paved and had poor water permeability. The rainwater system was built a long time ago, and so the drainage capacity was inadequate. The area, and particularly the low-lying South Trunk Canal Area, was often faced with the risk of waterlogging, with depths of 80–90 cm in serious cases. This study compares the drainage capacity of the area before and after construction for different typical target years and for rainstorm events with different return periods. According to the frequency curve of annual precipitation in Wuhan city (Figure 5). During years with high water flows (p ≤ 25%), the average precipitation is 1398.38 mm, with 2013 as the reference year; during years with normal water flows (25% < p < 75%), the average annual precipitation is 1205.82 mm, with 2021 as the reference year; and during years with low water flows (p ≥ 75%), the average annual precipitation is 725.81 mm, with 2012 as the reference year. In order to ensure consistency, the day with the maximum rainfall in each typical target year was selected as the study subject. These are July 7, 2013 (high flow year) with the daily rainfall of 248.1 mm, August 12, 2021 (medium flow year) with the daily rainfall of 105 mm, and September 9, 2012 (low flow year) with the daily rainfall of 83 mm.
3 Analyzations and results
3.1 Analysis of drainage capacity in typical target year
3.1.1 Runoff reduction ratio
We simulated the runoff processes in the study area for the typical target years after the sponge city had been built. The results are compared with the corresponding data before construction of the sponge city in Figure 6 and Tables 3, 4. The following conclusions can be stated: in the high flow year, the average flow rate is reduced from 0.82 m3/s to 0.50 m3/s, a reduction ratio of 39.02%, and the runoff decreases from 25.70 × 10⁶ m3 to 15.60 × 10⁶ m3, a reduction ratio of 39.30%. In the medium flow year, the average flow rate is reduced from 0.64 m3/s to 0.38 m3/s, a reduction ratio of 40.63%, and the runoff is reduced from 20.20 × 10⁶ m3 to 12.01 × 10⁶ m3, a reduction ratio of 40.54%. In the low flow year, the average flow rate decreases from 0.53 m3/s to 0.31 m3/s, a reduction ratio of 41.51%, and the runoff is reduced from 16.80 × 10⁶ m3 to 9.70 × 10⁶ m3, a reduction ratio of 42.26%.
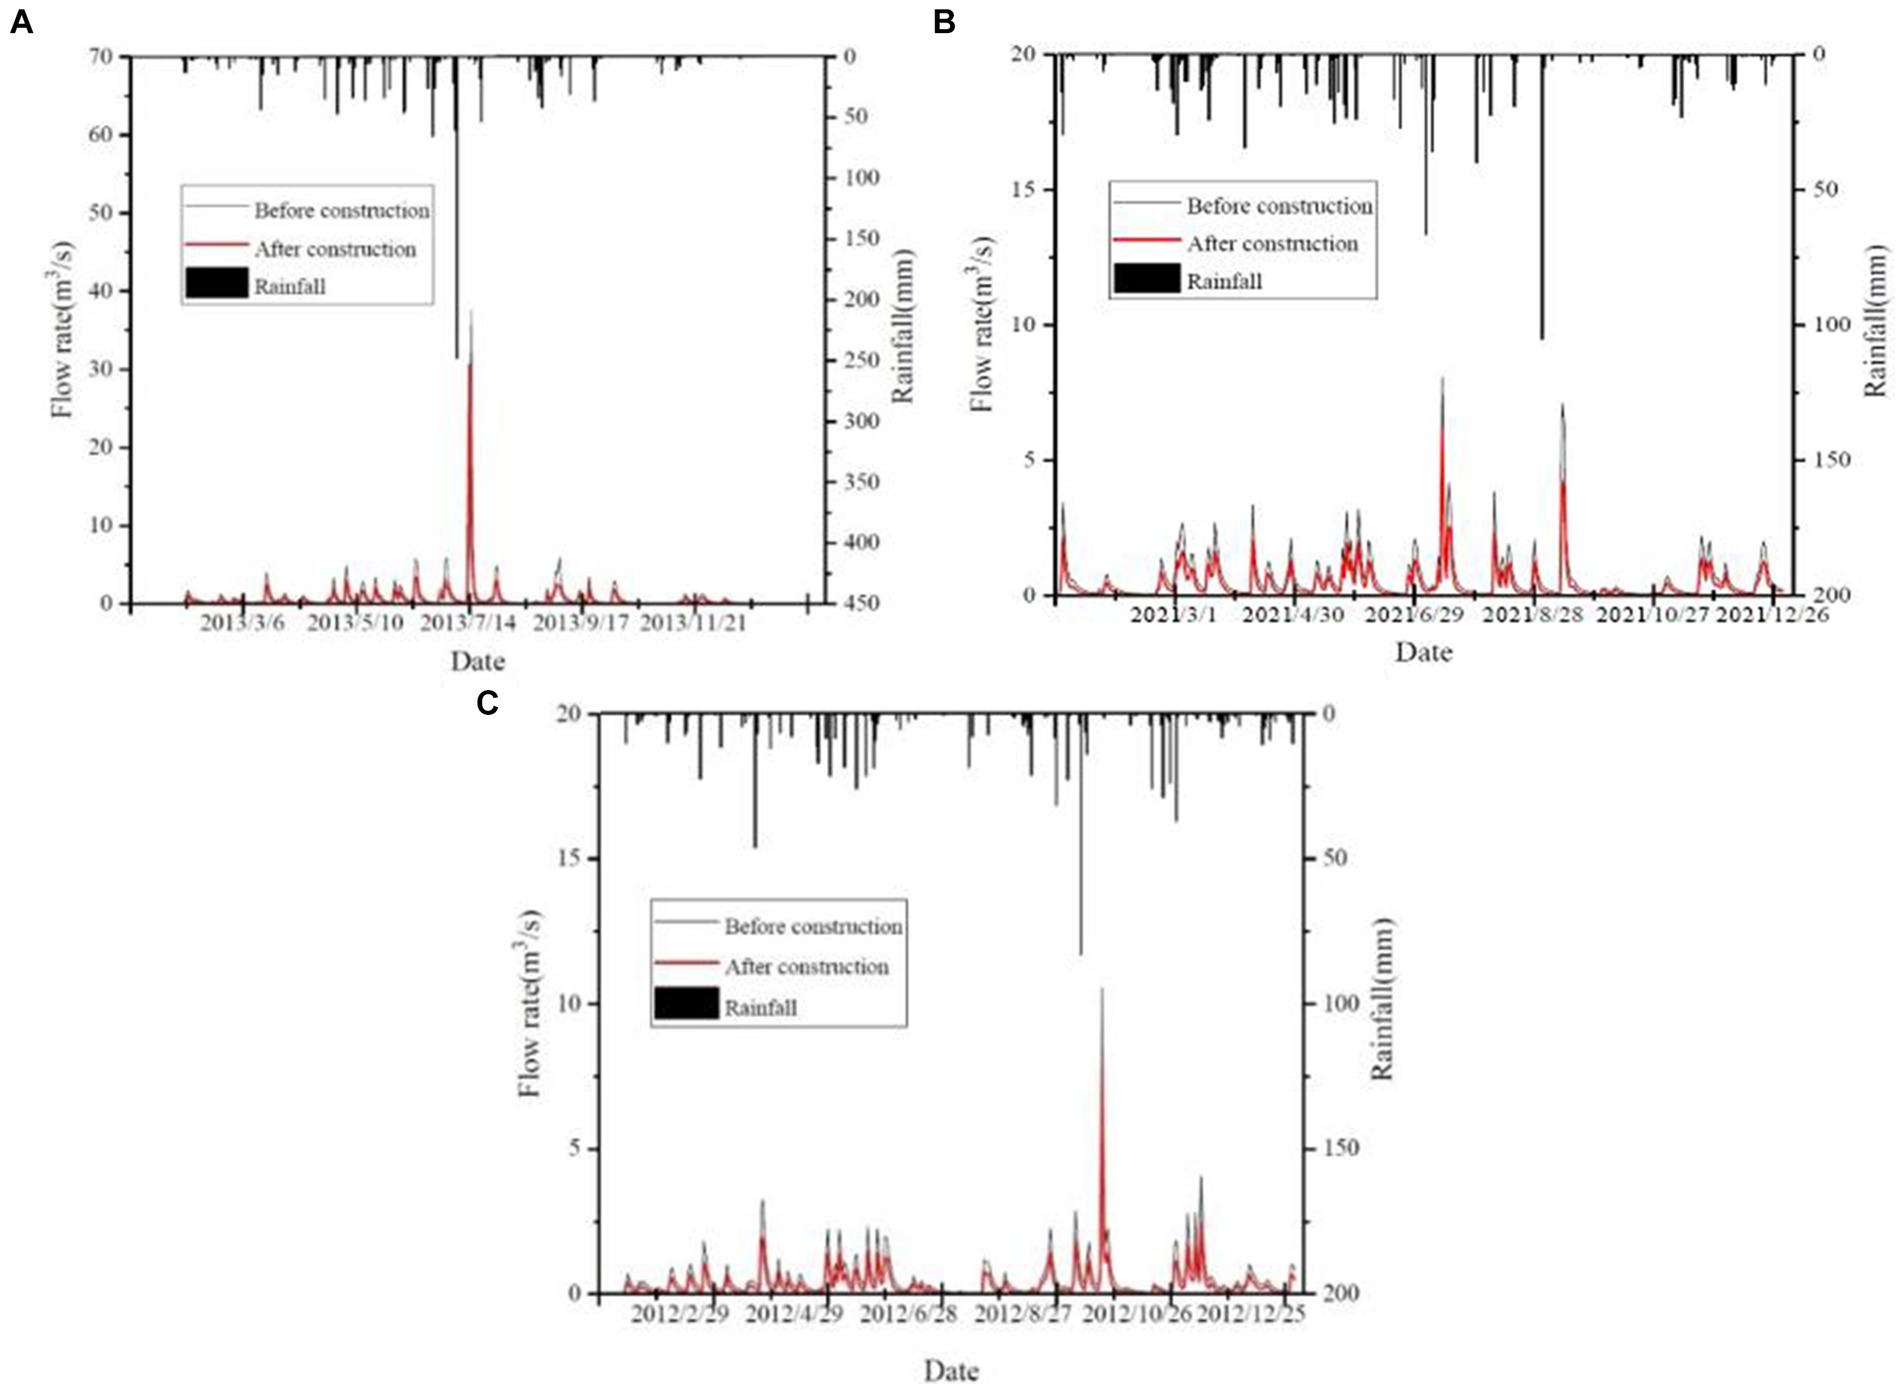
Figure 6. Comparison of runoff processes under typical target year conditions before and after building the sponge city: (A) high flow year, (B) medium flow year, (C) low flow year.
3.1.2 Drainage capacity of pipe networks
The original drainage capacity of the pipe networks was analyzed in terms of overflows and pipeline overloading at different places (Figure 7).
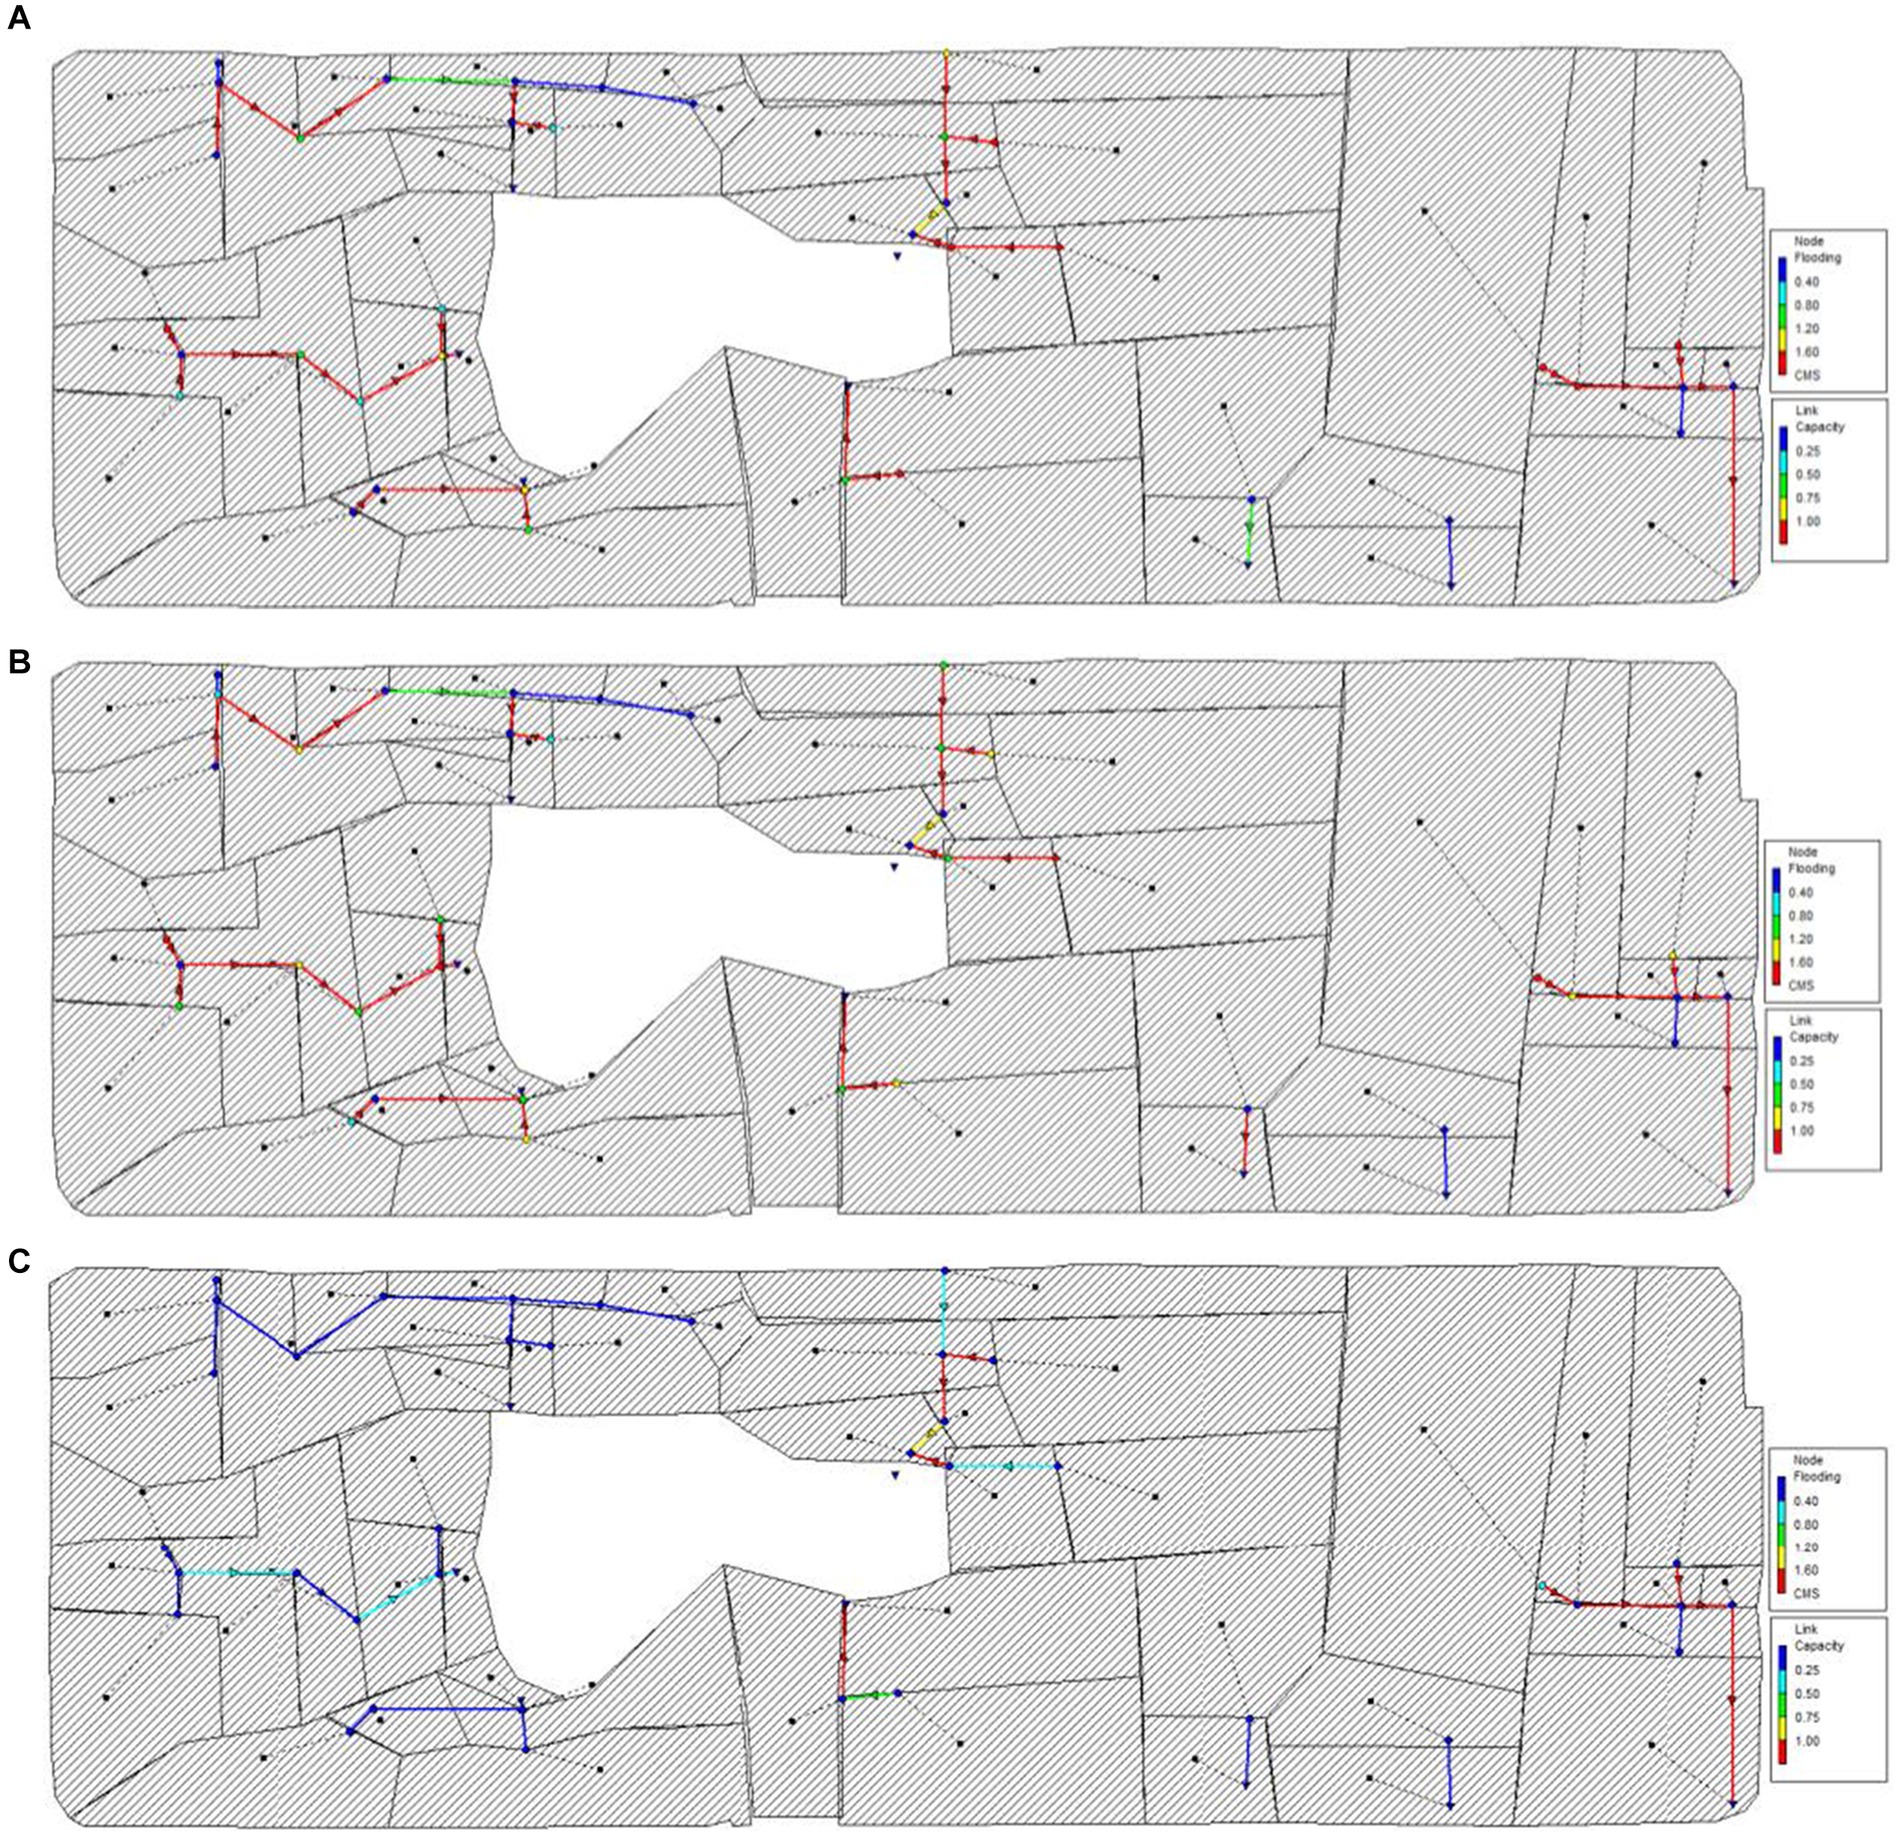
Figure 7. Analysis of drainage capacity of pipe networks in typical target years before building the sponge city: (A) high flow year (condition of July 7, 2013), (B) medium flow year (condition of August 12, 2021), (C) low flow year (condition of September 9, 2012).
According to our analysis, in the event of September 9, 2012 (the low flow year). There were no locations with overflows and eight places at which pipeline overloading occurred in the study area. Thus, the original pipeline capacity was reasonable for the drainage requirements of the study area. However, in the event of September 2, 2018 (the medium flow year) there were four places with overflows and 26 places at which pipeline overloading occurred in the study area, a pipeline overload rate of 84%. And the Event of September 7, 2013 (the high flow year) there were nine locations with overflows and 26 places at which pipeline overloading occurred. The overflows are concentrated around relatively low-lying areas.
Then based on the simulation results for the typical target years after building the sponge city (Figure 8), we analyze the overflows and pipeline overloading at different locations. The following conclusions can be drawn: after building the sponge city, the number of locations with overflows decreases from 9 to 3 in the high flow year, a reduction ratio of 66.67%, and from 4 to 0 in the medium flow year, a reduction ratio of 100%. In the high flow year, the number of locations at which pipe overloading occurs decreases from 26 to 16, a reduction ratio of 38.46%. In the medium flow year, the same indicator decreases from 26 to 7, a reduction ratio of 73.08%, and in the low flow year, the indicator decreases from 8 to 4, a reduction ratio of 50% (Table 5). The preceding analysis indicates that the construction of sponge cities plays a significant role in mitigating the impact of heavy rainfall with a return period of 1 and 5 years. However, as the return period increases to 10 years, the effect is found to be relatively limited. Furthermore, it is informative to observe that the reduction in overflows were concentrated in the vicinity of the retrofitted artificial lake.
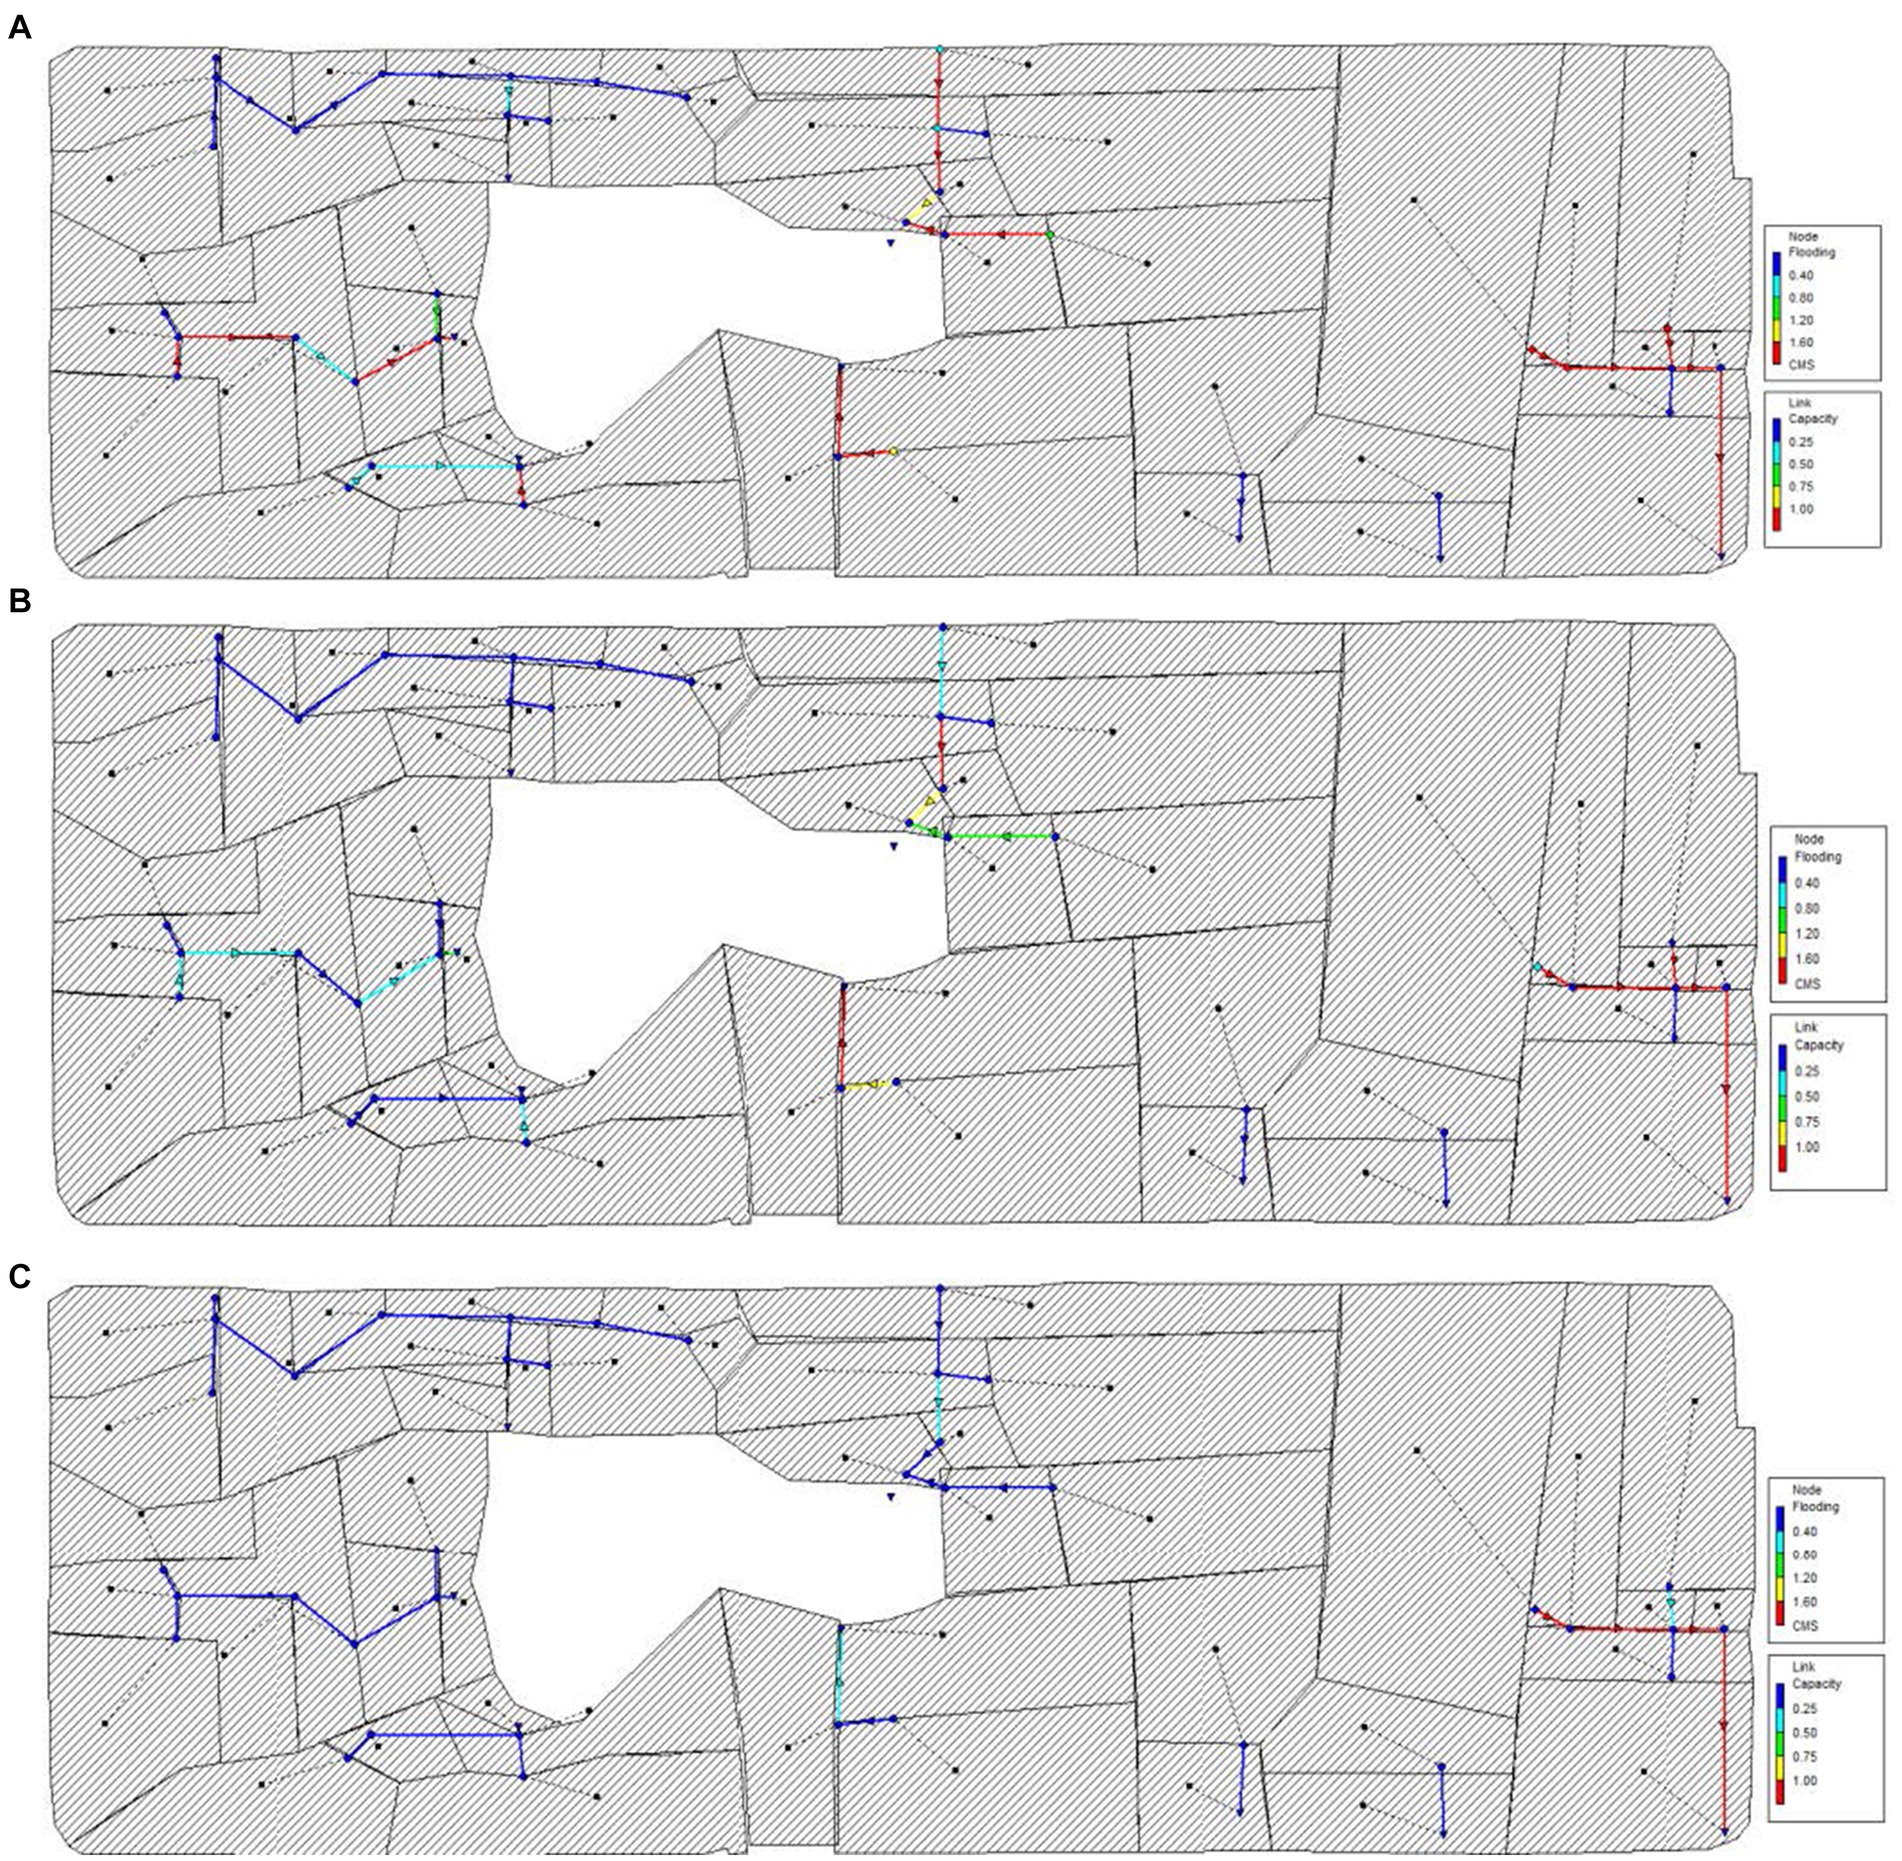
Figure 8. Analysis of drainage capacity of pipe networks in typical target years after building the sponge city: (A) high flow year (condition of July 7, 2013), (B) medium flow year (condition of August 12, 2021), (C) low flow year (condition of September 9, 2012).
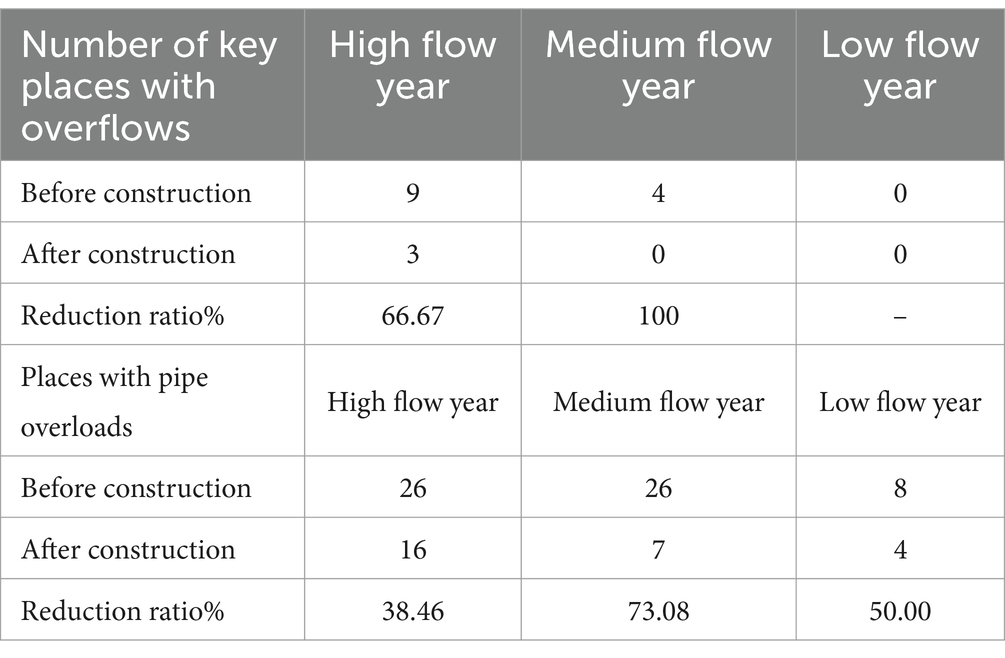
Table 5. Key places with overflows and places with pipe overloading before and after building the sponge city.
3.2 Analysis of drainage capacity with different return periods
3.2.1 Runoff reduction ratio
The rainfall runoff processes after building the sponge city are shown for different return periods in Figure 9 and Table 6. By comparing the rainfall runoff processes before and after building the sponge city, the following conclusions can be stated. For the 1-year return period, building the sponge city produces a good reduction in runoff; the peak decreases from 9.68 m3/s to 7.55 m3/s, a reduction ratio of 22%, and the total runoff decreases from 5.15 × 10⁵ m3 to 3.87 × 10⁵ m3, a reduction ratio of 24.85%. For the 5-year return period, the peak decreases from 16.9 m3/s to 16 m3/s, a reduction ratio of 5.33%, while the total runoff decreases from 7.08 × 10⁵ m3 to 6.71 × 10⁵ m3, a reduction ratio of 5.23%. For the 10-year return period, the peak decreases from 20.45 m3/s to 19.36 m3/s, a reduction ratio of 5.33%, and the total runoff decreases from 8.18 × 10⁵ m3 to 7.73 × 10⁵ m3, a reduction ratio of 5.50%.
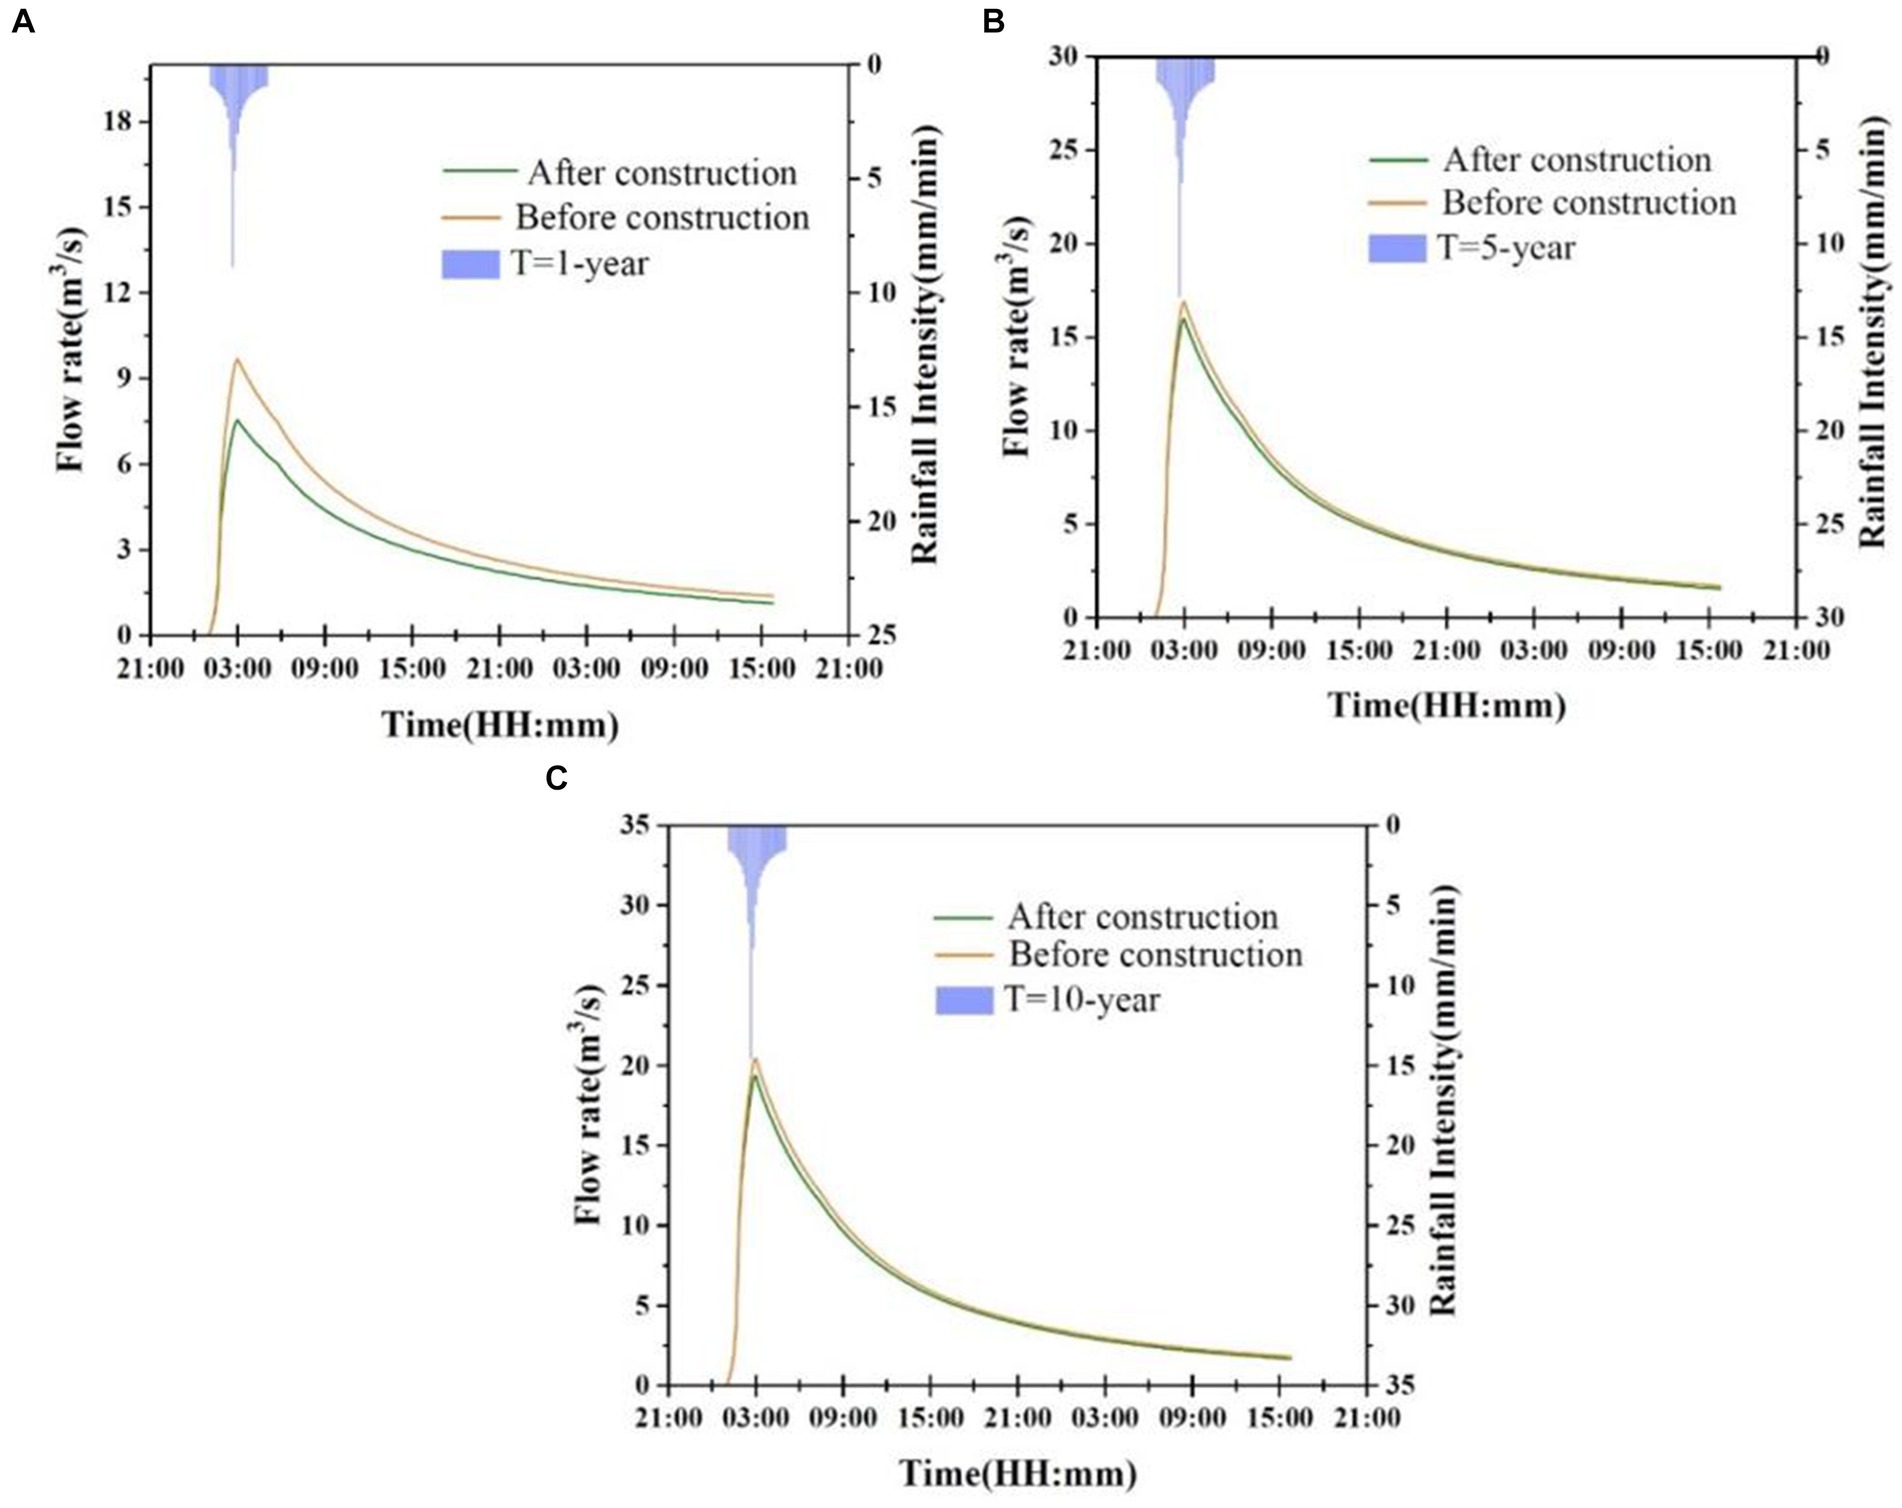
Figure 9. Comparison of runoff processes with different return periods before and after building the sponge city: (A) T = 1 year, (B) T = 5 years, (C) T = 10 years.

Table 6. Comparison of runoff characteristics with different return periods before and after building the sponge city.
3.2.2 Drainage capacity of pipe networks
The number of locations with overflows and the occurrence of pipe overloading after building the sponge city are presented for the different return periods in Tables 7, 8.

Table 7. Comparison of overflow statistics for different return periods before and after building the sponge city.
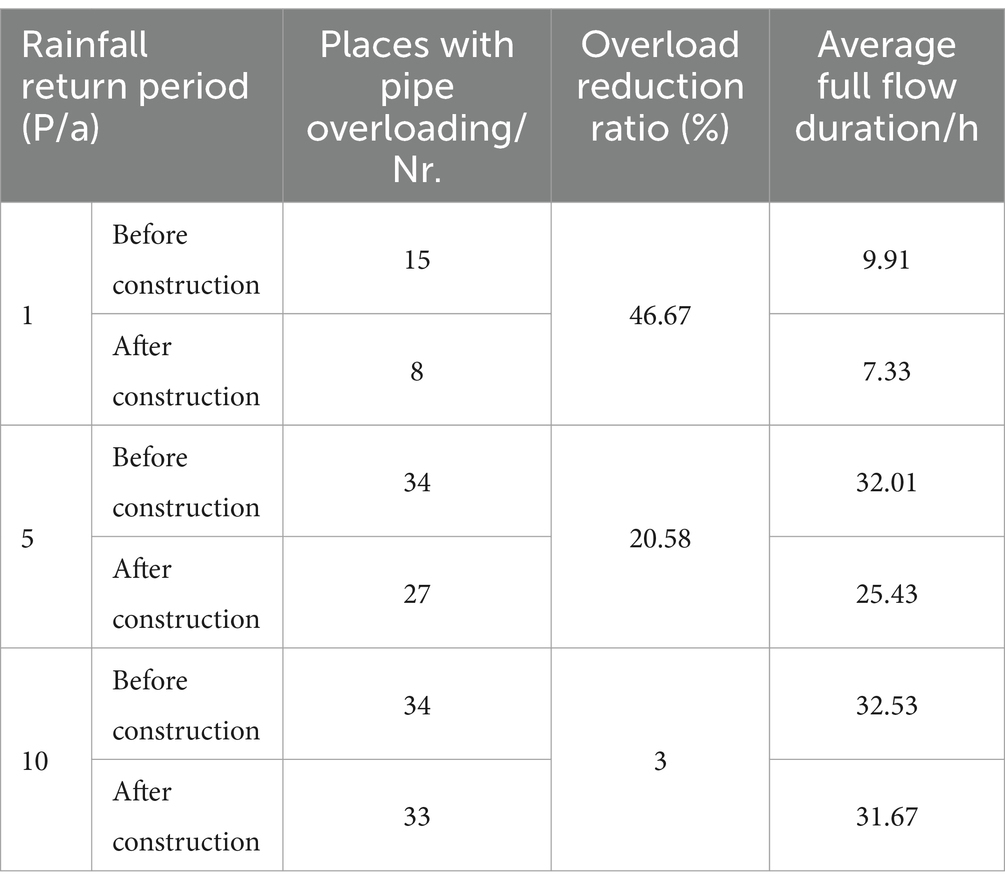
Table 8. Comparison of pipe overload statistics for different return periods before and after building the sponge city.
With the 1-year return period, the number of overflows and the degree of pipe overloading have been reduced by building the sponge city facilities. The number of locations with overflows decreases from 13 to 6, an overflow reduction ratio of 53.85%, while the average overflow time has been reduced from 11.45 h to 8.96 h and the total overflow volume has decreased from 396.91 × 10³ m3 to 286.57 × 10³ m3, a reduction ratio of 27.8%. The number of pipe overloading incidences has been reduced from 15 to 8, a reduction ratio of 46.76%, and the average full flow duration has decreased from 9.94 h to 7.33 h. For the 5-year return period, the number of locations with overflows has been reduced from 33 to 27, an overflow reduction ratio of 18.18%. The average overflow time has increased from 23.01 h to 25.21 h, although the total overflow has been reduced from 3804.16 × 103 m3 to 3657.26 × 103 m3, a reduction ratio of 3.86%. The number of locations at which pipe overloading occurs has been reduced from 34 to 27, a reduction ratio of 20.58%, and the average full flow duration has decreased from 32.01 h to 25.43 h. With the 10-year return period, the number of locations at which overflows occur has been reduced from 34 to 33, an overflow reduction ratio of 3.03%, although the average overflow time has increased from 32.53 h to 33.641 h. The total overflow decreases from 4509.7 × 103 m3 to 4459.63 × 103 m3, a reduction ratio of 1.11%. The number of incidences of pipe overloading has been reduced from 34 to 33, a reduction ratio of 3%, and the average full flow time has been shortened from 32.53 h to 31.67 h. In summary, the construction of a sponge city has a beneficial impact on reducing runoff and alleviating pipe overloading during a 1-year return period. However, for the 5-and 10-year return periods, the effect is not statistically significant. This may be because of the subtropical monsoon climate and abundant rainfall in the study area. For the 5-and 10-year return periods, the short-duration rainfall is very intense, so the roles of the various sponge city facilities are not fully realized.
4 Discussion
4.1 Advantages and disadvantages of sponge city construction
We have conducted a comparative analysis of the runoff processes and drainage capacities of pipe networks for typical target years and different return periods before and after the building of the sponge city. It can be concluded that the sponge city effectively reduces the flow and runoff volume of the typical target years in the study area, and plays a significant role in runoff reduction, with reduction ratios of around 40% in high, medium, and low flow years. Additionally, after building the sponge city, the numbers of locations suffering overflows and pipe overloading in the typical target years have been significantly reduced, with reduction ratios of 38.46% (low flow year), 73.08% (medium flow year), and 50% (high flow year). Therefore, for a typical level year rainfall, the construction of the sponge city effectively mitigates the flooding problem due to heavy rainfall below the 5-year return period, and even has a moderating effect on rainfall with a return period of 10 years. However, the performance of the sponge city was less satisfactory when dealing with short-duration rainfall. Although the sponge city has effectively improved the drainage capacity of the study area for 1-year return period rainstorms, both 5-and 10-year return periods produce similar numbers of overflows and pipe overloading as before the sponge city was built, indicating that the sponge city facilities play a lesser role in the regulation of runoff in the case of 5-and 10-year return periods. Therefore, the construction of sponge cities may play less of a role in mitigating the effects of rain and flooding when faced with short duration rainfall that is highly concentrated.
4.2 Urban planning strategies based on disaster resilience enhancement
A single regional sponge transformation is not sufficient to fully cope with the current climate environment of heavy rainfall caused by urban storm disasters, especially in low-lying flood-prone areas. This suggests that sponge city design should be improved by taking into account the local topography (Lancia et al., 2020). In the event of heavy rainfall, there will still be a significant risk of waterlogging. Thus, the sponge city facilities should be combined with other transformation programs to achieve a better management effect. One simple and effective strategy is to set up channels in low-lying areas and install pumping stations. According to our simulation results, in the event of heavy rainfall, the pipeline drainage capacity is overloaded in a few specific low-lying areas. Pumping stations and channels could quickly discharge flooded water from such regions. This would be an excellent enhancement to the existing sponge city facilities, and would achieve a better construction effect (Ye et al., 2023).
The simulation results indicate that the LID and green roof retrofit is less effective than the artificial lake retrofit in regulating water runoff. This suggests that when implementing the sponge city retrofit, it is crucial to connect low-lying flood-prone areas with the neighboring water system to form an area with a stronger storage capacity. This will help to compensate for the limitations of current sponge cities. Furthermore, although the test area has a subtropical monsoon climate and is in the Yangtze River Basin, it is still at risk of experiencing drought disasters under the influence of climate warming (Sharma et al., 2023). In 2022, for example, the region suffered a long period of high temperature and drought (Xu and Yuan, 2023). Therefore, flooding should not be treated solely as a disaster. The optimal strategy should be to utilize intense rainfall as an available water resource (Sharma et al., 2023). To address these issues, National Water Network Project has been proposed, which suggest renovation planning should not only solve the problem of flood. Instead, on the basis of the original sponge city renovations, low-lying flood-prone areas and the surrounding water systems should be connected to form an area with greater storage capacity. Its functionality should extend beyond flood control to encompass the potential for dealing with a variety of conditions.
To be noticed, the study only investigates the role of water systems in regulating runoff at small scales. Taking into account the application and implementation of water system connectivity at larger scales is thus urgently required in future studies of sponge city and National Water Network Project constructions. Furthermore, systematic evaluation systems for regional water storage and replenishment capacity as well as the ability to cope with disaster risks should be established, thus providing support for more effective construction of sponge cities.
Data availability statement
The original contributions presented in the study are included in the article/supplementary material, further inquiries can be directed to the corresponding author.
Author contributions
YLi: Conceptualization, Data curation, Formal analysis, Funding acquisition, Methodology, Project administration, Resources, Software, Supervision, Validation, Visualization, Writing – review & editing. XL: Conceptualization, Methodology, Software, Visualization, Writing – original draft, Writing – review & editing. JX: Data curation, Funding acquisition, Project administration, Resources, Supervision, Validation, Writing – review & editing. ZS: Data curation, Investigation. YLo: Funding acquisition, Investigation, Writing – review & editing. YY: Data curation, Software, Visualization, Writing – review & editing.
Funding
The author(s) declare that financial support was received for the research, authorship, and/or publication of this article. This research was supported by National Key Research and Development Program of China (Nos. 2024YFE0100100 and 2023YFC3209002-05), the Fundamental Research Funds for Central Public Welfare Research Institutes (Nos. CKSF2023398/SZ and CKSF2023298/SZ), and the National Natural Science Foundation of China (Grant no. 52309002).
Conflict of interest
The authors declare that the research was conducted in the absence of any commercial or financial relationships that could be construed as a potential conflict of interest.
Publisher’s note
All claims expressed in this article are solely those of the authors and do not necessarily represent those of their affiliated organizations, or those of the publisher, the editors and the reviewers. Any product that may be evaluated in this article, or claim that may be made by its manufacturer, is not guaranteed or endorsed by the publisher.
References
Chan Shun, F. K., Griffiths James, A., David, H., and Tang, S. F. (2018). Sponge City" in China-a breakthrough of planning and flood risk management in the urban context. Land Use Policy 76, 772–778. doi: 10.1016/j.landusepol.2018.03.005
Guan, X., Wang, J., and Xiao, F. (2021). Sponge City strategy and application of pavement materials in Sponge City. J. Clean. Prod. 303:127022. doi: 10.1016/j.jclepro.2021.127022
Jia, H., Chen, F., Pan, D., Du, E., and Yang, A. (2021). Flood risk management in the Yangtze River basin —comparison of 1998 and 2020 events. Int. J. Disaster Risk Reduc. 11:102724. doi: 10.1016/j.ijdrr.2021.102724
Lancia, M., Zheng, C., He, X., Lerner, D. N., and Tian, Y. (2020). Hydrogeological constraints and opportunities for "Sponge City" development: Shenzhen, southern China. J. Hydrol. Reg. Stu. 28:100679. doi: 10.1016/j.ejrh.2020.100679
Mitchell, G. (2005). Mapping hazard from urban non-point pollution: a screening model to support sustainable urban drainage planning. J. Environ. Manag. 74, 1–9. doi: 10.1016/j.jenvman.2004.08.002
Morison, P. J., and Brown, R. R. (2011). Understanding the nature of public and local policy commitment to water sensitive Urban Design. Landsc. Urban Plan. 99, 83–92. doi: 10.1016/j.landurbplan.2010.08.019
Pyke, C., Warren, M. P., Johnson, T., Lagro, J., Scharfenberg, J., Groth, P., et al. (2011). Assessment of low impact development for managing storm water with changing precipitation due to climate change. Landscape Urban Planning 103, 166–173. doi: 10.1016/j.landurbplan.2011.07.006
Sharma, A. K., Sanciolo, P., Behroozi, A., Navaratna, D., and Muthukumaran, S. (2023). Stormwater harvesting potential for local reuse in an urban growth area: a case study of Melton growth area in the west of Melbourne. Water 15:2093. doi: 10.3390/w15112093
Wang, J., Liu, J., Wang, H., Shao, W., Mei, C., and Ding, X. (2020). Matching analysis of investment structure and urban inundation control function of sponge cities in China. J. Clean. Prod. 266:121850. doi: 10.1016/j.jclepro.2020.121850
Wang, Y., Sun, M., and Song, B. (2017). Public perceptions of and willingness to pay for sponge city initiatives in China. Resour. Conserv. Recycl. 122, 11–20. doi: 10.1016/j.resconrec.2017.02.002
Xu, J., and Yuan, Z. (2023). Analysis of the characteristics of the drought analysis of the Yangtze River basin in 2022 and exploration of drought mitigation and response mode in the new period. J Yangtze River Sci Res Inst 40, 1–8. doi: 10.11988/ckyyb.20221419
Yang, Y., Zhang, W., Liu, Z., Liu, D., Huang, Q., and Xia, J. (2023). Coupling a distributed time variant gain model into a storm water management model to simulate runoffs in a Sponge City. Sustain. For. 15:3804. doi: 10.3390/su15043804
Ye, C., Zongxue, X., Xiaohui, L., Weihong, L., Rui, Z., and Qi, C. (2023). Influences of sponge reconstruction of Jin'an river drainage district in Fuzhou City on urban flooding/waterlogging. Water Res. Prot. 39, 83–92. doi: 10.3880/j.issn.1004-6933.2023.01.012
Keywords: sponge city, SWMM, runoff reduction, drainage capacity, water network
Citation: Lin Y, Liang X, Xu J, Song Z, Lou Y and Yu Y (2024) Evaluation of the urban sponge stormwater regulation effectiveness based on SWMM: a case study of Wuhan, China. Front. Water. 6:1406520. doi: 10.3389/frwa.2024.1406520
Edited by:
Abbas Roozbahani, Norwegian University of Life Sciences, NorwayReviewed by:
Sangamreddi Chandramouli, MVGR College of Engineering, IndiaZuzana Vranayová, Technical University of Košice, Slovakia
Copyright © 2024 Lin, Liang, Xu, Song, Lou and Yu. This is an open-access article distributed under the terms of the Creative Commons Attribution License (CC BY). The use, distribution or reproduction in other forums is permitted, provided the original author(s) and the copyright owner(s) are credited and that the original publication in this journal is cited, in accordance with accepted academic practice. No use, distribution or reproduction is permitted which does not comply with these terms.
*Correspondence: Yuru Lin, bGluX3l1cnVAMTI2LmNvbQ==
 Yuru Lin1*
 Xiayuan Liang

