 Michael Lewis
 Hamed Moftakhari
 Paola Passalacqua
94% of researchers rate our articles as excellent or good
Learn more about the work of our research integrity team to safeguard the quality of each article we publish.
Find out more
ORIGINAL RESEARCH article
Front. Water, 23 May 2024
Sec. Water and Climate
Volume 6 - 2024 | https://doi.org/10.3389/frwa.2024.1405603
This article is part of the Research TopicSpatiotemporal Modelling and Assessment of Water-related Multi-hazardsView all 8 articles
Compound flooding (CF) events, driven by coincident/concurrent and mutually reinforcing factors such as heavy rainfall, storm surges, and river discharge, pose severe threats to coastal communities around the Globe. Moreover, the exacerbating influence of climate change and sea-level rise further amplifies these risks. This study delves into the complex and multifaceted issue of compound coastal flooding in two freshwater-influenced systems on the Gulf Coast of the United States – Southeast Texas and South Alabama. We first conduct a robust statistical analysis to evaluate the significance of non-stationarity, multi-dimensionality, and non-linearity of interactions among various drivers of CF. Second, to assess the extent to which current flood resilience policies and guidelines account for these characteristics of CF events, we perform a critical review of existing policy documents. The results of the statistical analysis reveal significant compounding and shifts in the statistics of flood drivers that emphasize the pressing need for a multi-mechanism, non-stationary approach to flood hazard assessment. We also found an evident lack of appropriate language/recommendation in policy documents of solid tools that systematically take non-stationarity, multi-dimensionality, and non-linearity of CF into account. By identifying the gaps between current policy measures and the detected complexities of CF, we seek to provide insights that can inform more effective flood resilience policies and design guidelines. Through this robust analysis, we aspire to bridge the divide between research and policy.
In recent years, the Gulf Coast of the United States has experienced significant damage due to an increase in the number and intensity of hurricanes. Major hurricanes Harvey and Irma hit this region in 2017, followed by hurricanes Ida (2021) and Ian (2022), resulting in vast damage, significant loss of life, and the occurrence of compound flooding (CF) (Dilling et al., 2017; Sebastian et al., 2017; Valle-Levinson et al., 2020). Hurricanes often cause CF events which are characterized by the simultaneous/concurrent occurrence of two or more physical processes like storm surge, heavy rainfall, or extreme high tides, leading to intensified fluvial, pluvial, or coastal flooding; the level of impact from these CF events would not be expected from each process in isolation (Bilskie and Hagen, 2018; Moftakhari et al., 2019; Sebastian et al., 2019; Dykstra and Dzwonkowski, 2021; Huang et al., 2021; Gori et al., 2022). In a warming climate, such CF events are projected to increase in both frequency and severity (Naseri and Hummel, 2022). However, the current state of preparedness and resilience to such events varies widely and is typically not comprehensive (Zscheischler et al., 2020). The individual or combined impact of storm tide and rainfall, for example, is typically not well communicated by current approaches for estimating flood risk and mapping floodplains (Wahl et al., 2015; Moftakhari et al., 2017; Shen et al., 2019). Most mitigation plans concentrate on individual mechanisms either coastal, pluvial, or fluvial flooding, not the compounding effects between them and their drivers (Shen et al., 2019).
Accurate estimation of flood risk in coastal areas is of paramount importance, particularly in the face of increasing frequency and severity of extreme weather events catalyzed by climate change and sea-level rise (IPCC, 2022). While flood hazard assessment has evolved from simple empirical methods to more complex probabilistic methods, the challenges of data quality and model complexity remain (Teng et al., 2017; Moftakhari et al., 2019; Santos et al., 2021; Abbaszadeh et al., 2022; Jafarzadegan et al., 2023). The need for high-quality data of adequate record length and the intricacy of integrating all relevant factors into the models are ever-present challenges (Teng et al., 2017; Moftakhari et al., 2019; Bensi et al., 2020; Santos et al., 2021; Abbaszadeh et al., 2022; Jafarzadegan et al., 2023).
Our study focuses on two specific areas along the Gulf Coast: the Galveston Bay area of Southeast Texas (SETx) and the Weeks Bay area of South Alabama (SAl). Both regions have experienced major flood events in recent years and provide an important context for studying CF risk. Our first objective is to perform a statistical analysis of CF drivers in these areas, taking into account the key factors contributing to flood variability, including non-stationarity, non-linearity, and multi-dimensionality (Zheng et al., 2014; Jane et al., 2022; Kim et al., 2023). Non-stationarity, or the concept that statistical properties of a process can change over time, is particularly relevant in the context of climate change where variables such as precipitation and sea level are changing over time (Slater et al., 2021; Boumis et al., 2023). Non-linearity refers to the complex interactions among different flood drivers, which can lead to impacts that are not simply the sum of their individual effects (Arns et al., 2020; Muñoz et al., 2020, 2022). Multi-dimensionality recognizes that flood risk is influenced by a multitude of factors, including not only meteorological and hydrological variables but also the built environment and human behavior (Jongman et al., 2012; Alipour et al., 2022; Sohrabi et al., 2023).
The complexity of flood risk systems in low lying coastal areas subject to compound flooding is characterized by non-linearities and non-stationarities, which contribute to challenges in flood risk assessment and management (Merz et al., 2015). Previous studies emphasize the importance of the availability of more accurate CF forecast tools that can significantly enhance coastal resiliency measures, and potentially reduce human and property losses (Bilskie and Hagen, 2018; Santiago-Collazo et al., 2019). Studies by Bilskie and Hagen (2018) highlight the non-linear interaction of rainfall excess with coastal surge in low-gradient coastal regions like SETx and SAl, necessitating the delineation of flood transition zones (areas prone to both hydrologic and coastal flooding including their interactions) for accurate flood risk assessments (Bilskie and Hagen, 2018). Moreover, Huang et al. (2021) demonstrated the compound nature of flooding around Galveston Bay during Hurricane Harvey, indicating the critical importance of considering compound inundation models in these low-gradient coastal watersheds (Huang et al., 2021). Additionally, Muñoz et al. (2020) advocate for a thorough CF assessment that leverages statistical analysis, hydrodynamic modeling of extremes, and corrections of coastal digital elevation models to capture the complex, multidimensional nature of flood risks in these regions (Muñoz et al., 2020).
This study implements a multi-variate approach to flood hazard assessment, offering a more comprehensive and accurate understanding of flood risk. We analyze historic and current data on precipitation, river discharge, and coastal still water level [SWL, encompasses astronomical tides and non-tidal residuals observed at tide gauges (Serafin et al., 2017)]. We further shed light on the non-stationarity, non-linearity, and multi-dimensionality of CF in the case study areas by utilizing trend analysis and joint probability functions. We further incorporate sea-level rise projections into our analysis to explore their potential implications for resilience assessment against CF.
In addition to our comprehensive data analysis, our study incorporates a crucial policy review component to evaluate the extent to which existing policies and guidelines address the complex aspects of CF, non-stationarity, non-linearity, and multidimensionality. We systematically review relevant policy documents to ascertain their coverage of these critical factors. Our approach aims to highlight the gap between scientific findings and practical policy implementation. By integrating our scientific findings with a rigorous policy review, our study seeks to enhance our understanding of CF risk in the Gulf Coast Region and provide policymakers with the necessary insights to develop more effective flood resilience policies and design guidelines.
This study utilizes a range of data sources to assess CF in the coastal regions of SETx and SAl. The key data utilized in this research include precipitation from NOAA (NOAA NCEI, 2023a,b,c,d), river discharge from USGS (USGS, 2023a,b,c,d), coastal SWL data from NOAA with a NAVD88 datum (NOAA Tides and Currents, 2023a,b), and local sea-level rise projections from NOAA (NOAA Office for Coastal Management, 2023). The precipitation data, river discharge data, and SWL data location and availability are shown in Figure 1 with Table 1 providing further details.
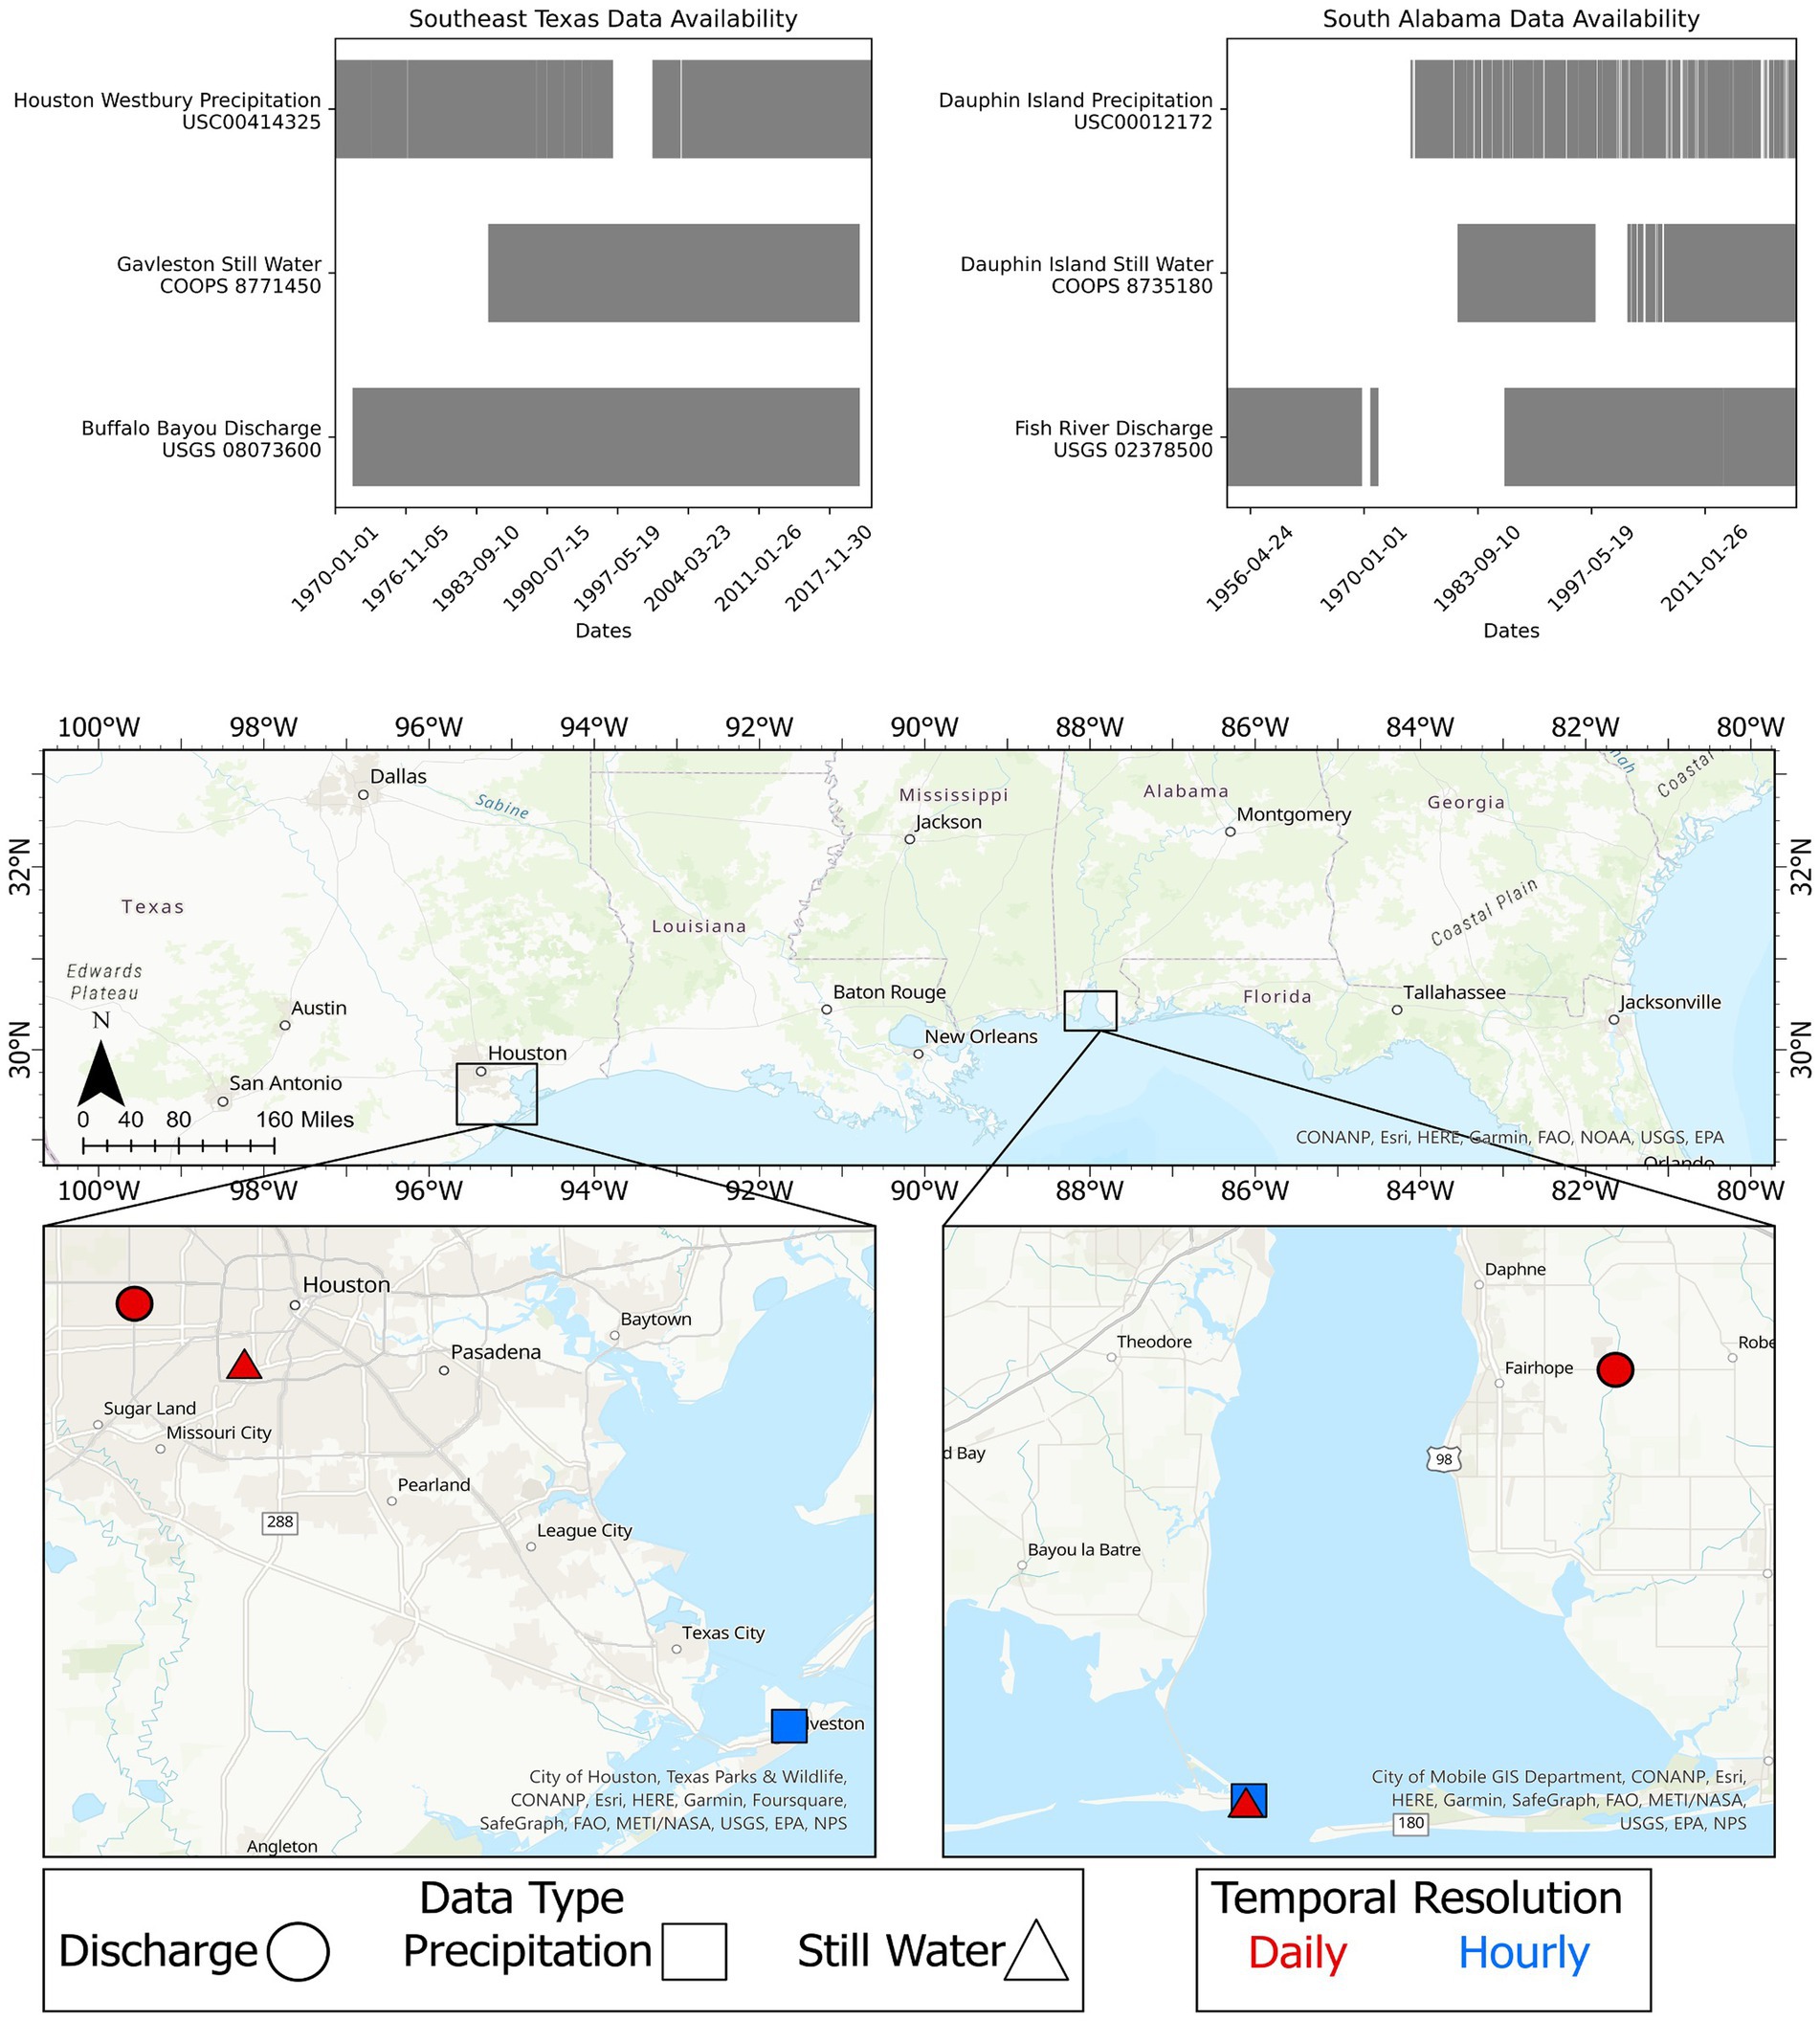
Figure 1. Data availability timelines and gauge maps for data used in statistical analysis categorized by type and temporal resolution.

Table 1. Compound flood data availability summary.
The intermediate low, intermediate, and intermediate high sea level rise (SLR) outlook values for 2060 were used in this study. These values are calculated at each location based on global mean sea-level rise predictions set in Sweet et al. of 0.5 m for intermediate low, 1.0 m for intermediate, and 1.5 m for intermediate high for 2,100 that is then scaled for 2060 and localized (Sweet et al., 2022; NOAA Office for Coastal Management, 2023). For SA, the values were 0.41 m, 0.48 m, and 0.61 m; for SET, the values were 0.61 m, 0.68 m, and 0.81 m.
We conducted the data analysis in several stages as outlined in Figure 2. Initially, we performed exploratory data analysis to understand the distribution and characteristics of each data set. We calculated the annual maximum values using block maxima sampling which does not involve any subjectivity like with other sampling methods such as peaks-over-threshold (Smith, 1987, 1994; Coles, 2001; Scarrott and MacDonald, 2012; Ferreira and De Haan, 2015). The selection of data was based on the length and continuity of the record, considering multiple sources where available. For SA, the precipitation record at Dauphin Island was used over the record available at Mobile, AL due to continuity. For river discharge, the Fish River record is the longest and best representative of fluvial fluxes into Weeks Bay. For SETx, Houston Westbury precipitation was chosen due to record length. For river discharge, Buffalo Bayou has the best length and continuity. For each data set, we evenly split the data into two periods, ensuring each period had at least 25 years of continuous records. Because the length of record and number of gaps differs among the six datasets, the date ranges also differ for the two periods. We generated two cumulative distribution functions (CDFs), one for each subset, as well as Quantile–Quantile (QQ) plots for both historic and current data and selected among other options Kolmogorov–Smirnov test (KS test) to validate each fit (National Institute of Standards and Technology, 2012; Sadeqi et al., 2022). We have decided to waive the pre-defined distribution families commonly recommended for specific variables, such as Log-Pearson III for river discharge from USGS guidelines and GEV for still water levels from FEMA (England et al., 2019; FEMA, 2023). Our analysis found that Log-Pearson III did not adequately capture the behavior of river discharge in our study areas, prompting the need for an alternative fitting process. Similarly, while GEV was not a poor fit for SWL, our analysis indicated that other distributions could potentially provide a better fit. Therefore, employed a fitter tool to identify the best distributions, acknowledging that the conventional univariate approaches may not suffice for the complex, multi-hazard scenarios we are investigating (Cokelaer, 2022). Based on best fit across the datasets, precipitation was fitted with a Pearson Type-III distribution, river discharge with a Log-Laplace distribution, and SWL with an Asymmetric Laplace distribution (Uppuluri, 1981; Singh, 1998; Kotz et al., 2001). We then created six datasets using two-sided sampling, pairing the annual maxima of each variable with the corresponding data by date from the other two variables, using a +/− 3-day lag window to ensure that the highest value corresponding to each annual maximum was selected. We utilized Kendall’s τ to assess the rank correlation between variables, and used Mann–Whitney U test to identify any significant differences in the distributions between the historic and current data sets (Kendall, 1938; McClenaghan, 2022). The Mann–Whitney U test is a non-parametric statistical test used to determine whether there is a significant difference (α = 0.05) between two independent groups (Mann and Whitney, 1947). If the p-value is less than 0.05, we can reject the null hypothesis that the distributions of the two groups are identical (Mann and Whitney, 1947). This test was crucial in our analysis to assess the non-stationarity of the variables. Specifically, we computed the Kendall’s τ coefficient on the historic and current data sets, bootstrapped the results by randomly sampling 15 datapoints 1,000 times, and visualized them with box plots. The τ ranges from −1 to 1 with −1 indicating a perfect negative relationship, 0 indicating no relationship, and 1 indicating a perfect positive relationship (Kendall, 1938). We then use the Mann–Whitney U tests to confirm whether there are statistically significant differences between the historic and current bootstrapped Kendall’s τ coefficients.
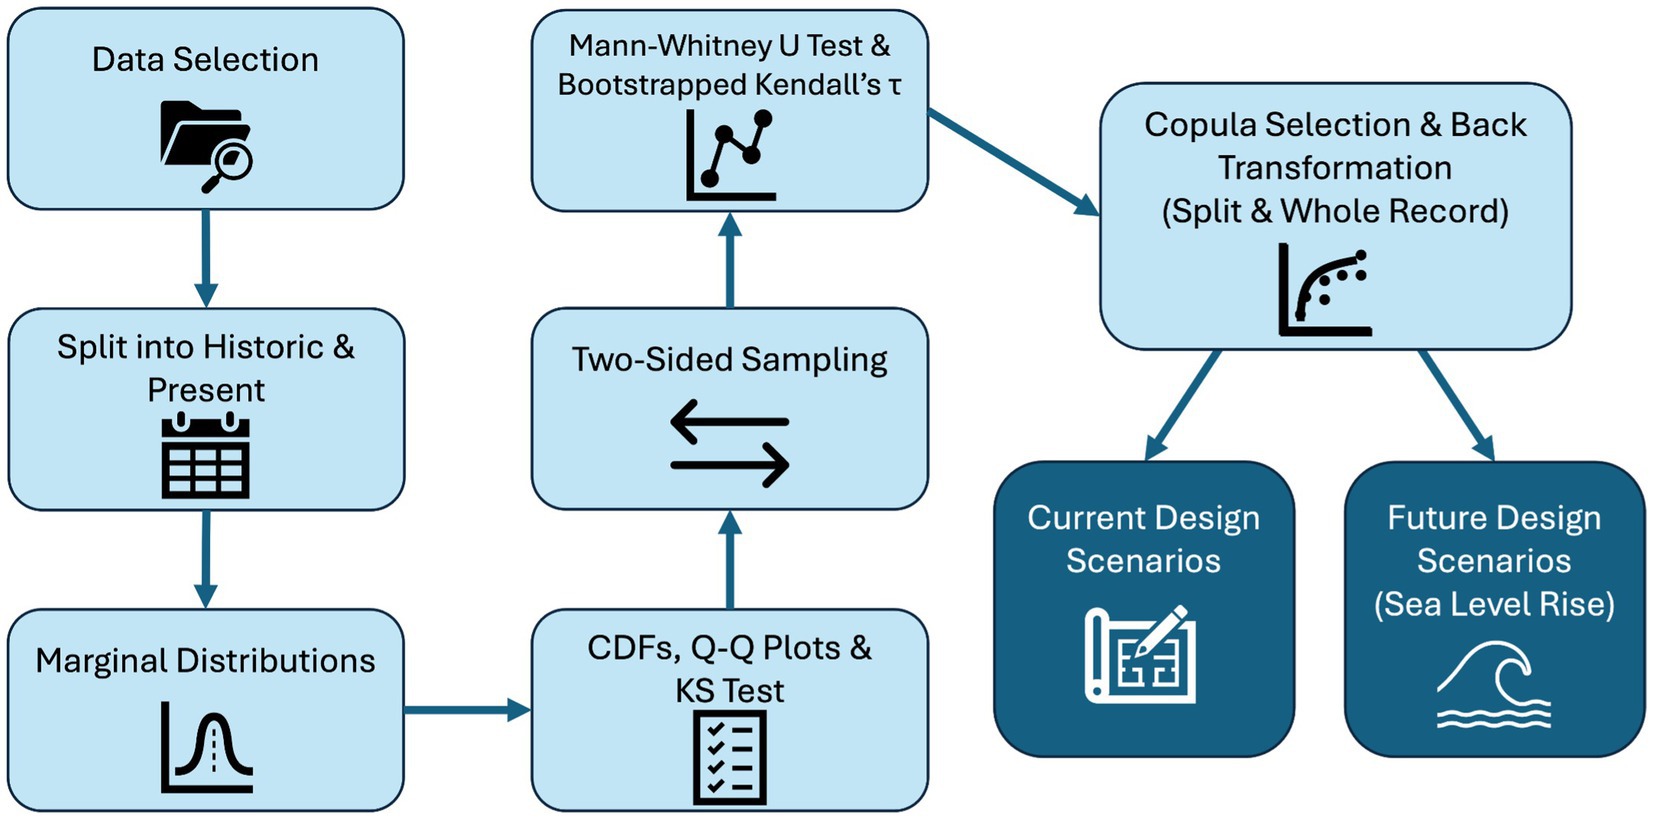
Figure 2. Flowchart for proposed methodology.
We then used copulas to examine the dependence structure between the different data sets, i.e., precipitation, discharge, and SWLs. Copula analysis can capture the dependence structure between multivariate data sets, including non-linear relationships (Hao and Singh, 2016; Tootoonchi et al., 2022). We computed the Kendall’s τ coefficient for the whole record length of each of the six pairings (Kendall, 1938). For cases where the p-value is greater than 0.05, i.e., the correlation coefficient is statistically insignificant, we used an independence copula. We fitted different types of copulas, including Gumbel, Frank, and Clayton Fit and Gaussian copulas to the data with statistically significant correlations, and we selected the best-fitting copula based on the max log-likelihood (Joe, 1997). We graphed the theoretical and empirical copulas after back transforming them to their original domain (Yan, 2023).
Finally, the implications of SLR for CF were assessed by adding SLR estimates to the SWLs and re-running the copula analysis. This step aimed to understand how SLR might influence the severity and frequency of CF in the future.
To assess the significance of change in marginal probability of individual drivers of CF in SETx and SAl, we compare the cumulative distribution functions for the historic and current periods of each data set in Figures 3, 4 with red representing the historic period and blue representing the current period. Following this, we constructed comparison Quantile-Quantile plots for each dataset’s historic and current subsets, and we performed KS tests to validate the chosen fits for each (Figures 3, 4).
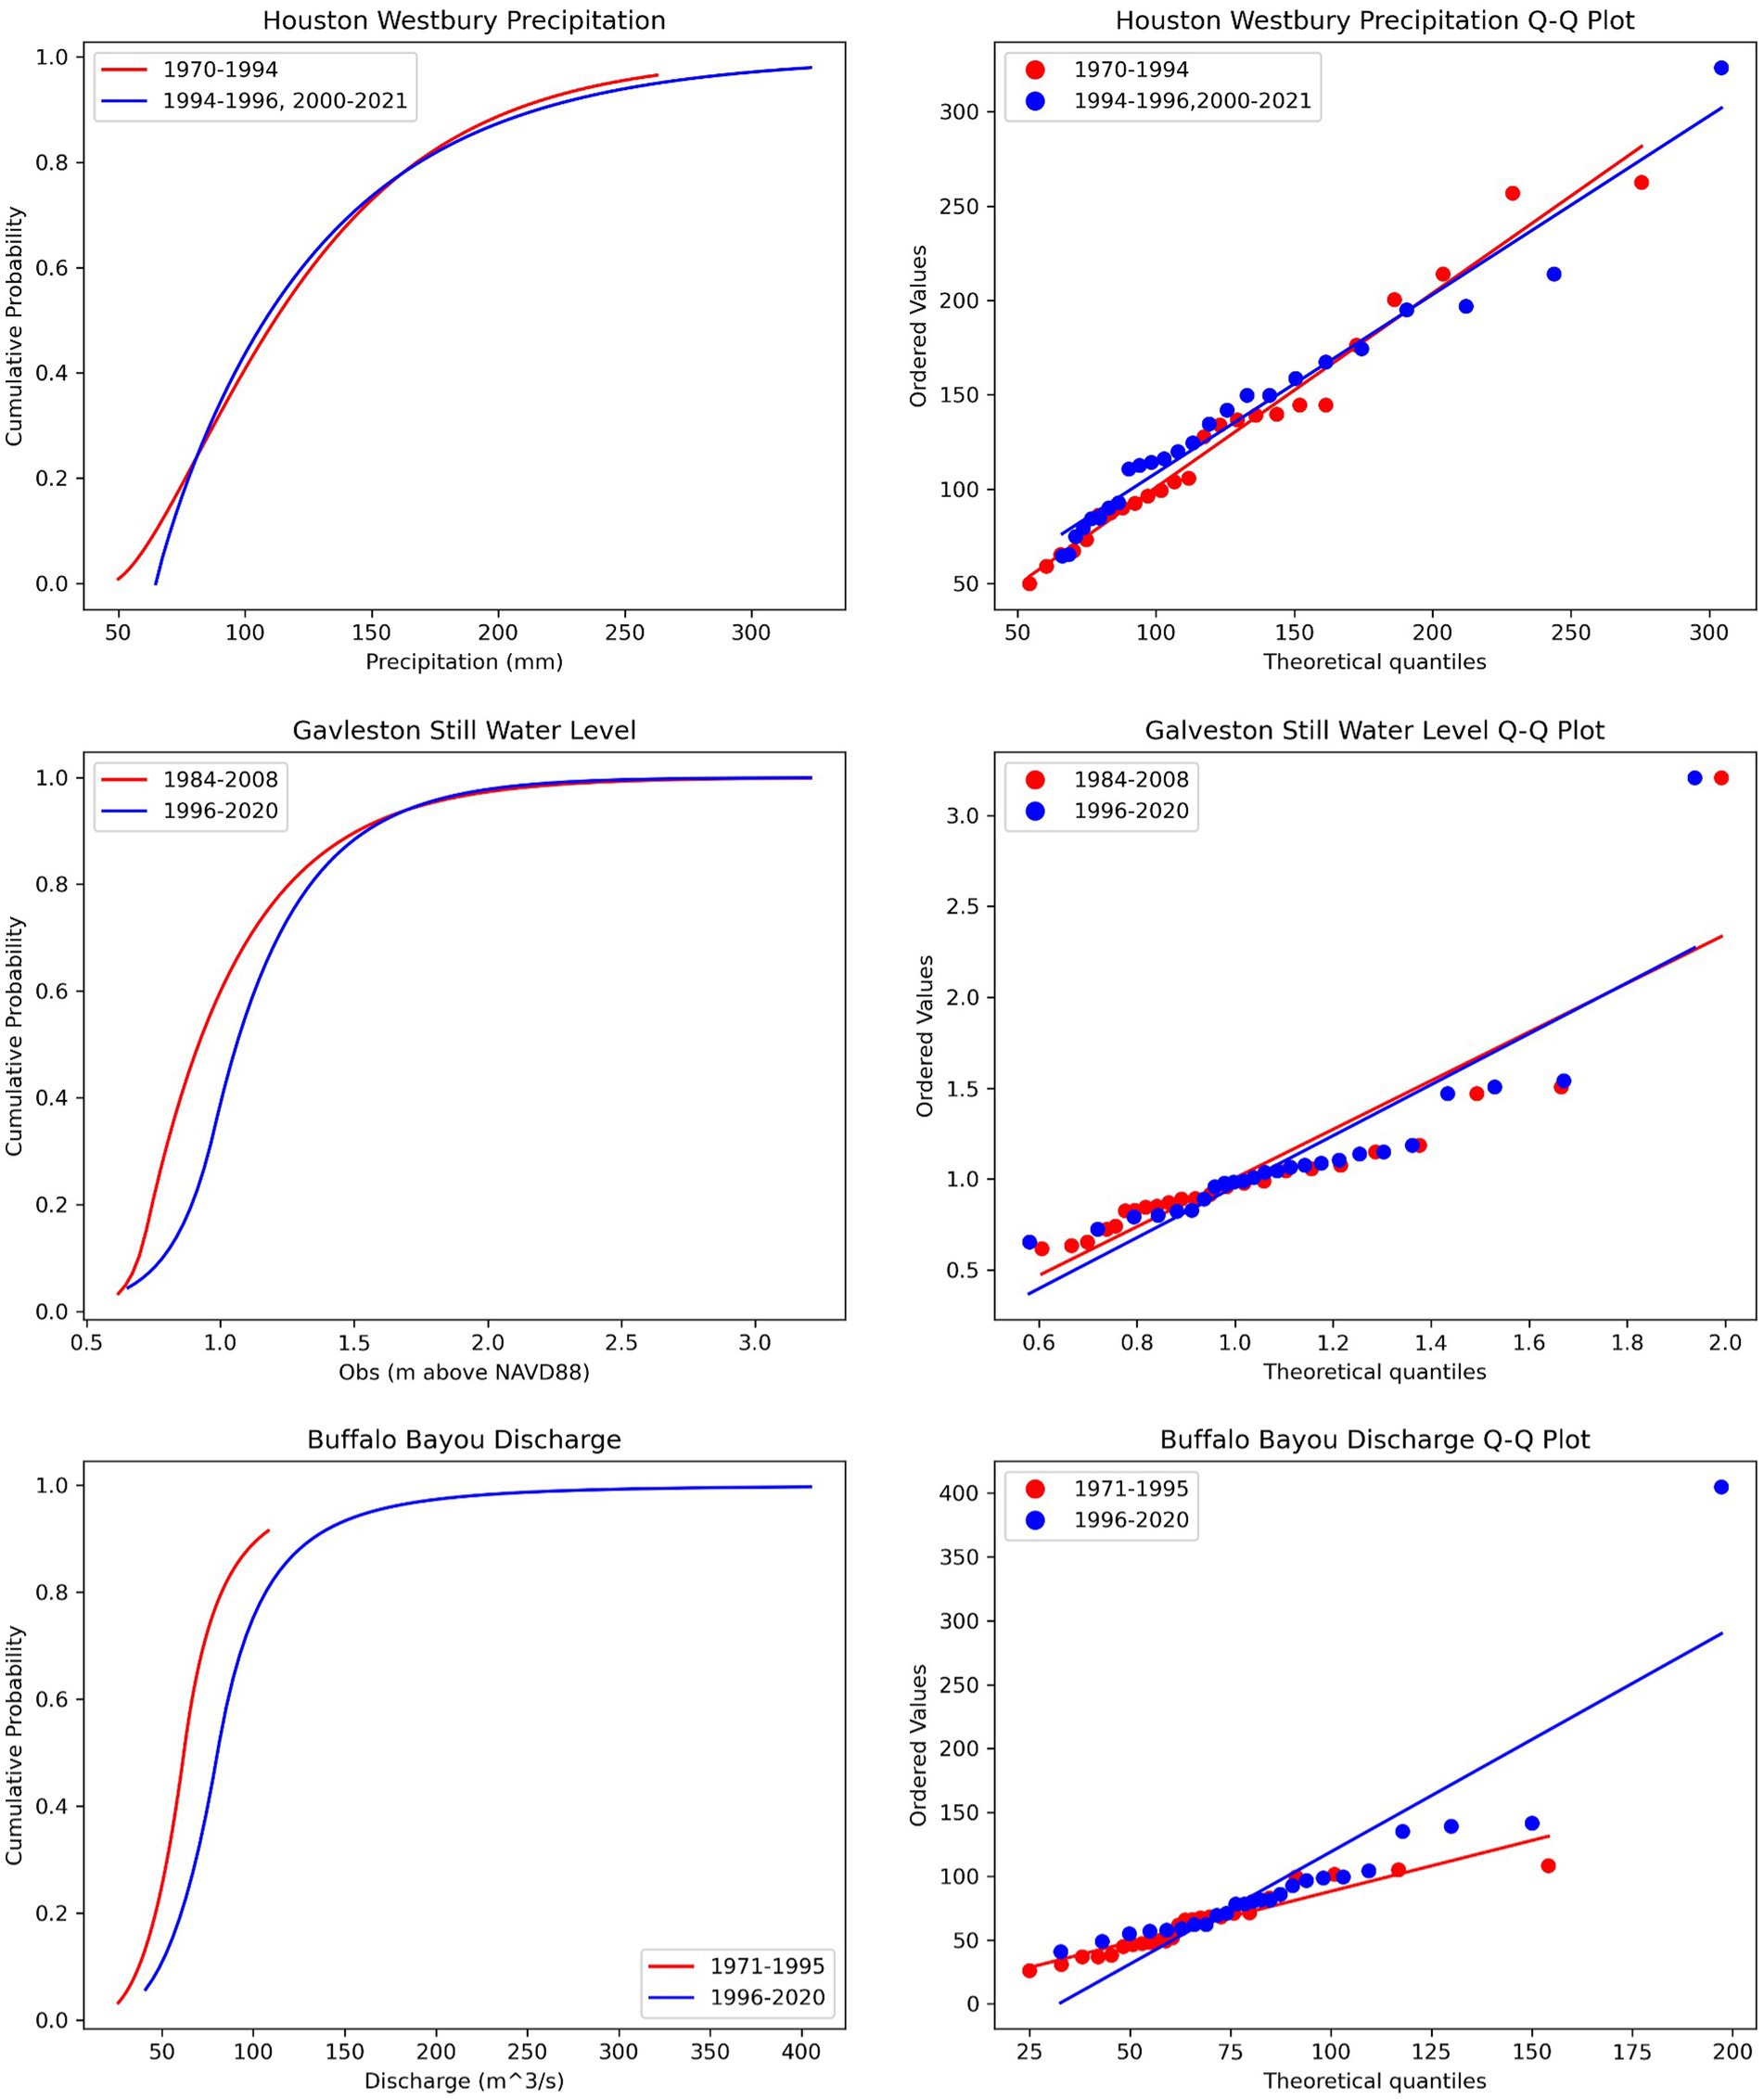
Figure 3. Southeast Texas univariate CDFs with corresponding QQ plots with historic (red) and current (blue) data.
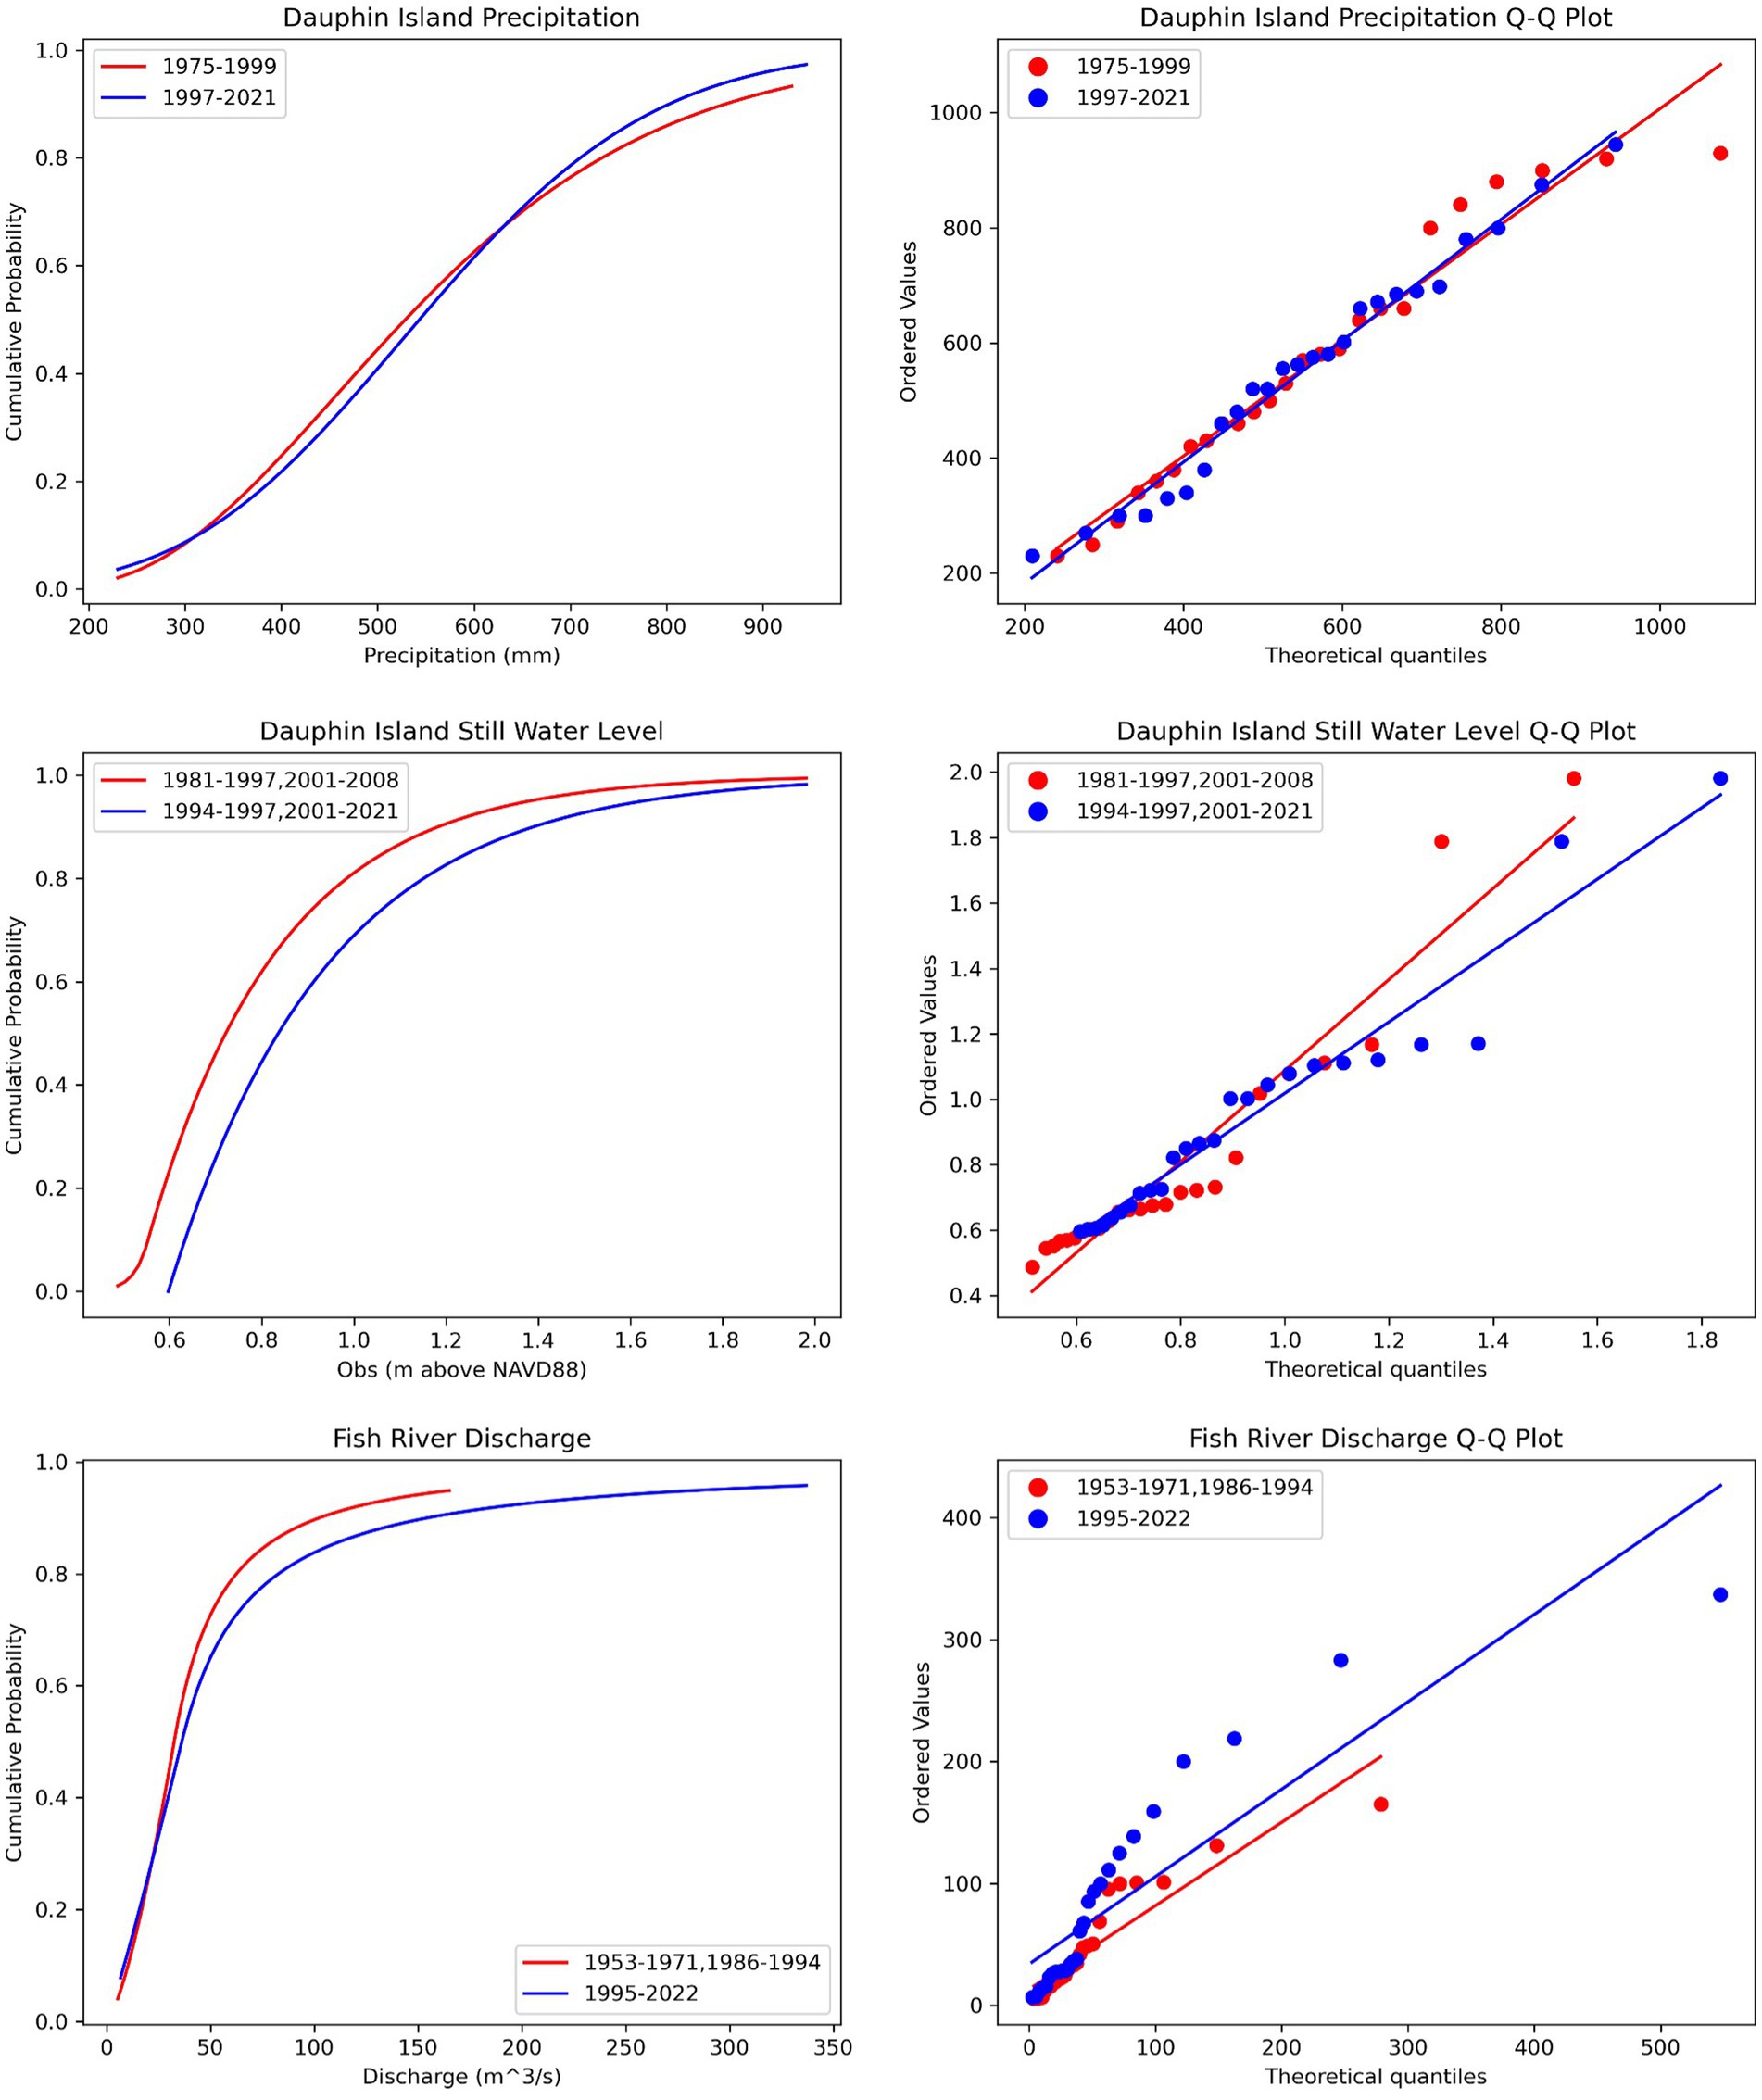
Figure 4. South Alabama univariate CDFs with corresponding QQ plots with historic (red) and current (blue) Data.
In SAl (Supplementary Figures S1–S5) and SETx (Supplementary Figures S6–S11), the Mann–Whitney U tests comparing the Kendall’s τ bootstrapped values between historic and current dependencies resulted in statistically significant U statistics, providing evidence of significant differences between the distributions (Table 2).
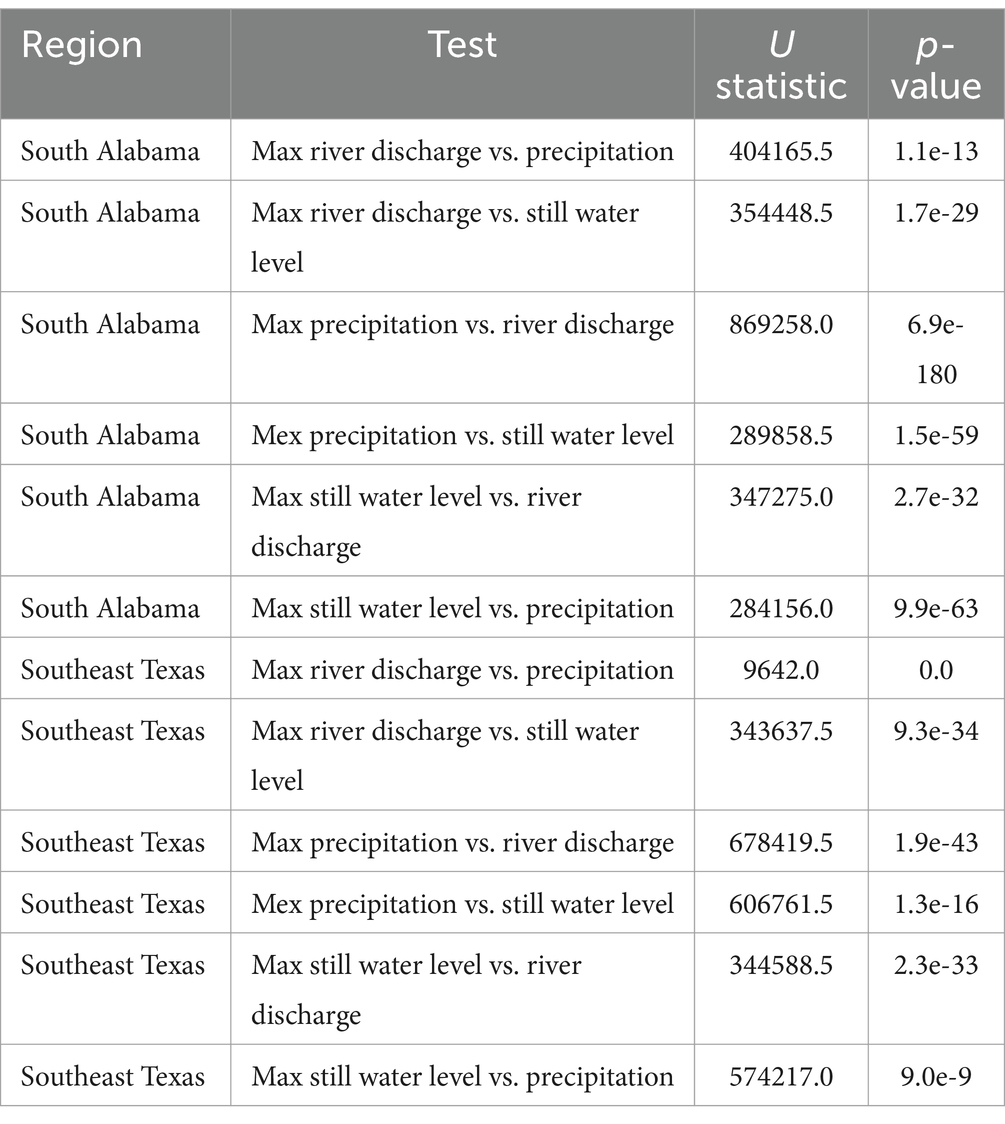
Table 2. Mann–Whitney U test results for Southeast Texas and South Alabama.
These results underscore the non-stationarity of CF drivers in SETx and SAl, with shifts in the statistical dependencies between the variables over time. This non-stationarity poses challenges for flood management, as it means traditional methods based on time-invariant characterization of compound risk, i.e., stationary correlation structure, may not be sufficiently representative in such systems. It underscores the need for dynamic, adaptive approaches to flood risk management that consider these changes. To further show non-stationarity within the systems, we analyzed a set of copula-based joint CDFs for SETx’s Max Discharge vs. Precipitation between the historic and current data with two non-exceedance probability levels (Figure 5). Here, the shift in the copula curves associated with the altered correlation structure, as reflected in the different Kendall τ between two periods of analysis, provides a great example of how non-stationarity is affecting CF in these systems. The Historic (1971–1995) vs. Current (1993–2020) Bootstrap Kendall’s τ Boxplot shows how the correlation between precipitation and discharge has enhanced over the past few decades. The fitted Archimedean Copulas for Max Discharge vs. Precipitation, Gumbel for historical and Frank for current, shows how the joint probability and correlation structure have shifted with more intense events occurring at a higher frequency in the current period. This result underscores the need for inclusion of non-stationarity of CF in risk management policy and design guidelines to ensure infrastructure is resilient as CF dependencies are expected to continue to change due to anthropogenic effects (IPCC, 2022).
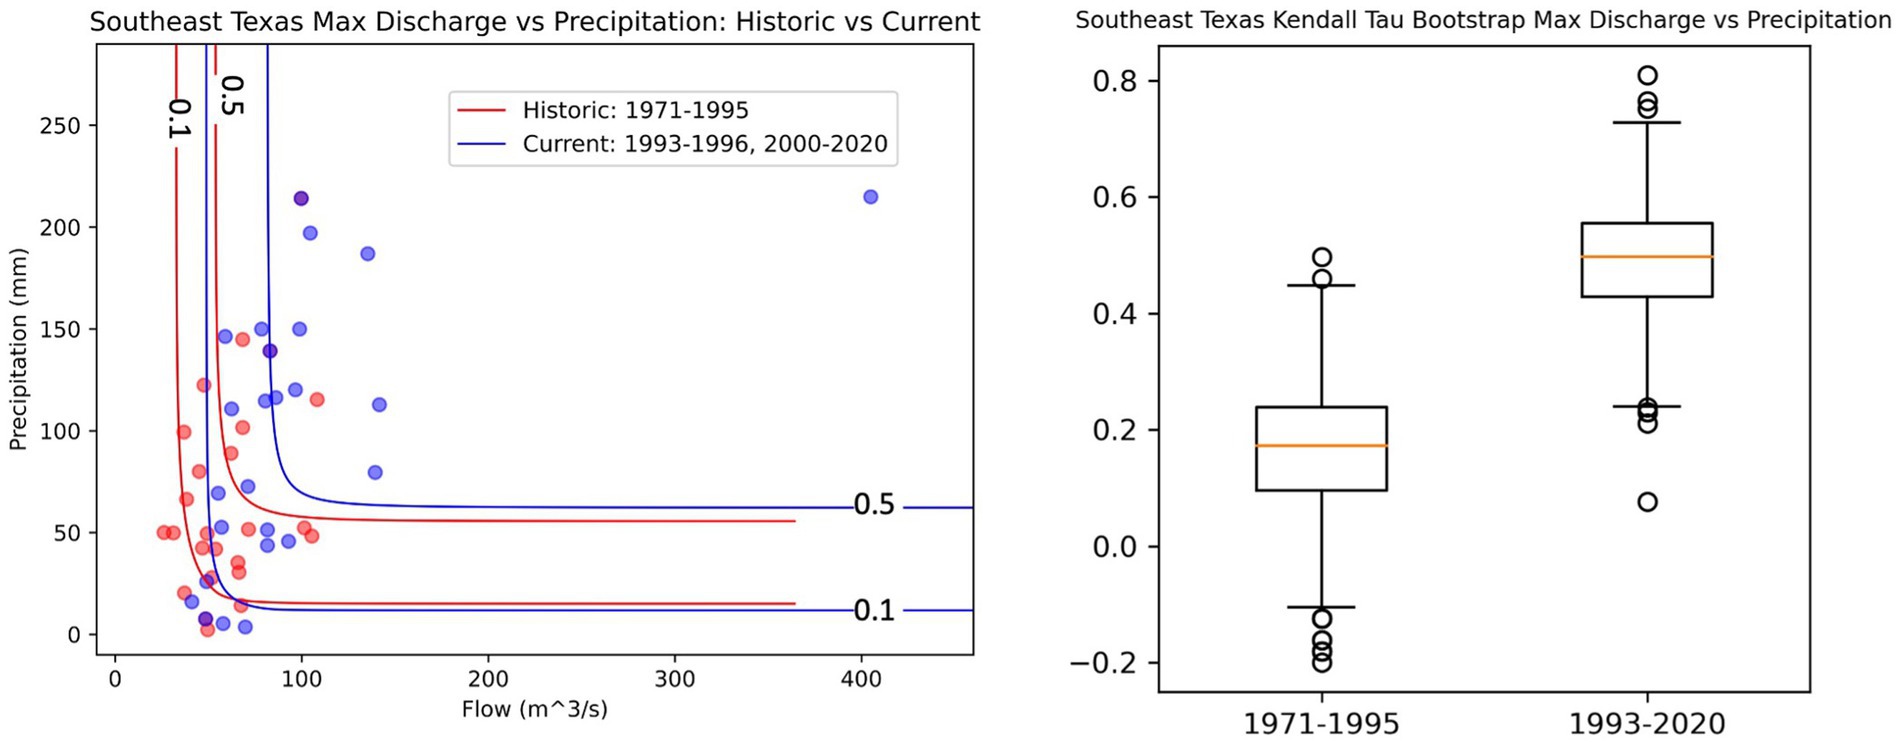
Figure 5. Southeast Texas max discharge vs. precipitation: historic vs. current non-exceedance probability contours and bootstrapped Kendall’s τ correlation coefficient box.
In our analysis of CF in SAl and SETx, we have employed copulas as a powerful tool to characterize the (non-linear) correlation structure among key variables when multiple hazard drivers are involved. These copulas allow us to capture the complex correlation structure between variables and provide valuable insights that can be used to inform policy and design. In SAl, we detected a statistically significant correlation among various variables that necessitates the use of copulas to characterize the correlation between them. Frank Copulas (most suitable for symmetric correlation structure) best fit three of our four data pairings with Gumbel (most suitable for upper tail dependence) being best for max river discharge to precipitation. The coastal SWL and discharge pairings were found to be statistically insignificant. In SETx, we found Frank Copulas to be the best fit for three of the five data pairings. Gumbel was again best for max river discharge to precipitation, and Clayton (most suitable for lower tail dependence) was best for max river discharge to SWL. In this region, we found the correlation between annual max coastal SWL and precipitation to be statistically insignificant. Four of the joint cumulative probability curves at four non-exceedance probabilities based on the fitted Copulas are visualized in Figure 6; the remainder are in Supplementary Figure S11. These curves provide tangible information that can help enhance flood resilience policies and design strategies (i.e., under specific return periods). Additionally, we used Independent Copulas for the statistically insignificant relationships, presented in Supplementary Figure S12.
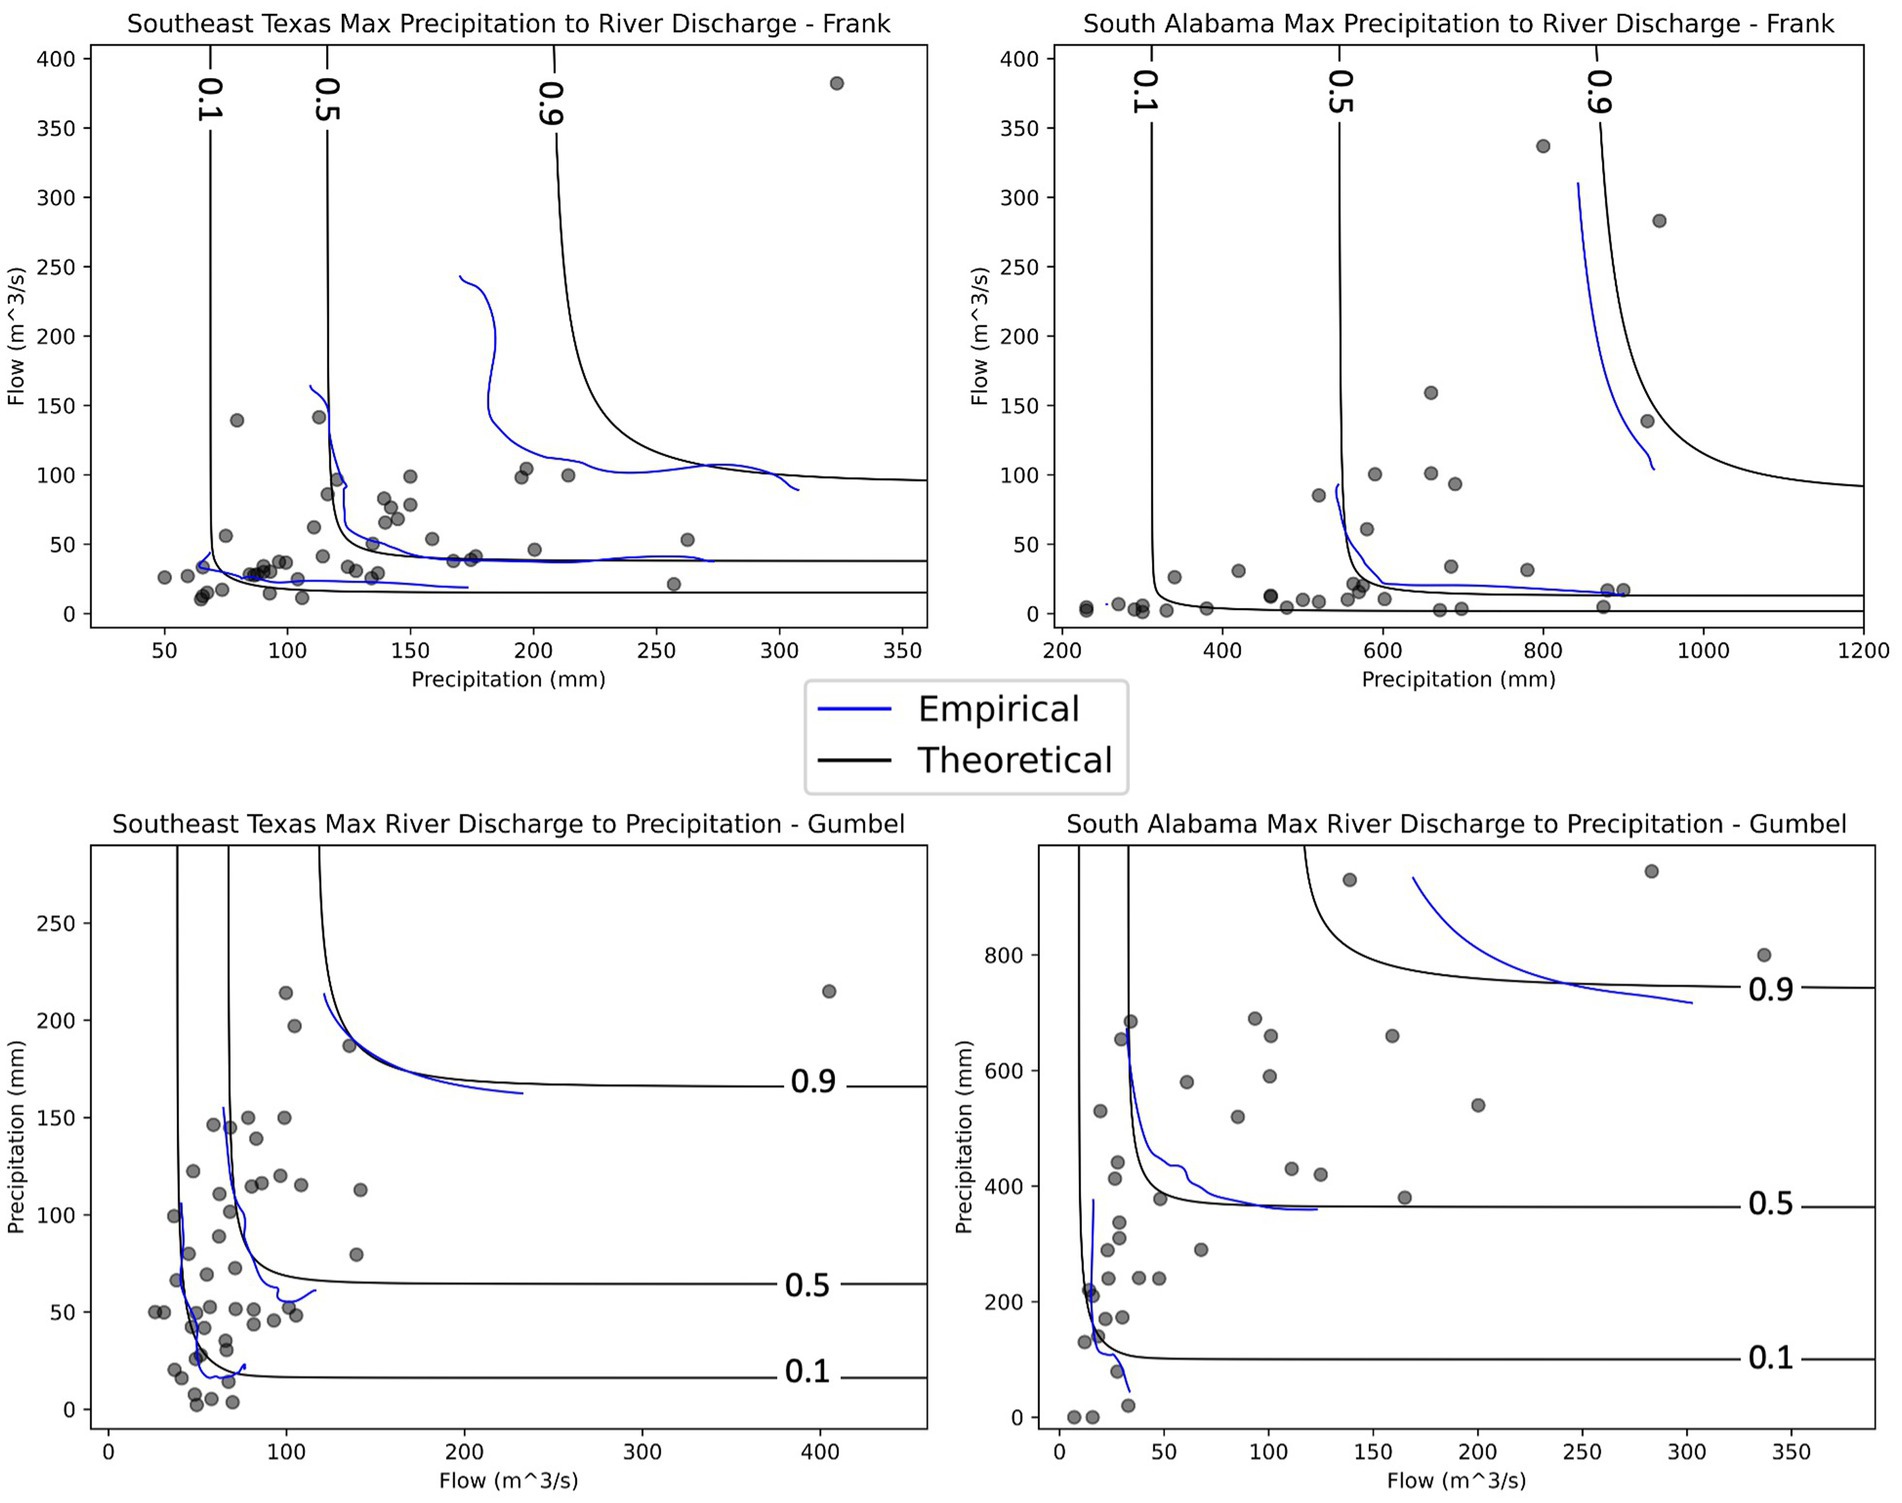
Figure 6. Non-exceedance probability contours for empirical (blue) and theoretical (black) copulas for discharge and precipitation in Southeast Texas and South Alabama.
The influences of SLR on CF were explored by incorporating local SLR scenarios for 2060 from the NOAA SLR Viewer into the SWL margin for both SETx and SAl. This step allowed for an analysis of the potential shifts in CF due to future SLR, based on the assumption that the parametrization of copulas used to describe the correlation between SWL and other hazard drivers remain unchanged under SLR. We added these estimates to the SWLs and analyzed them in combination with precipitation and river discharge data. We then performed the joint probability analysis again with the modified SWLs (Figure 7).
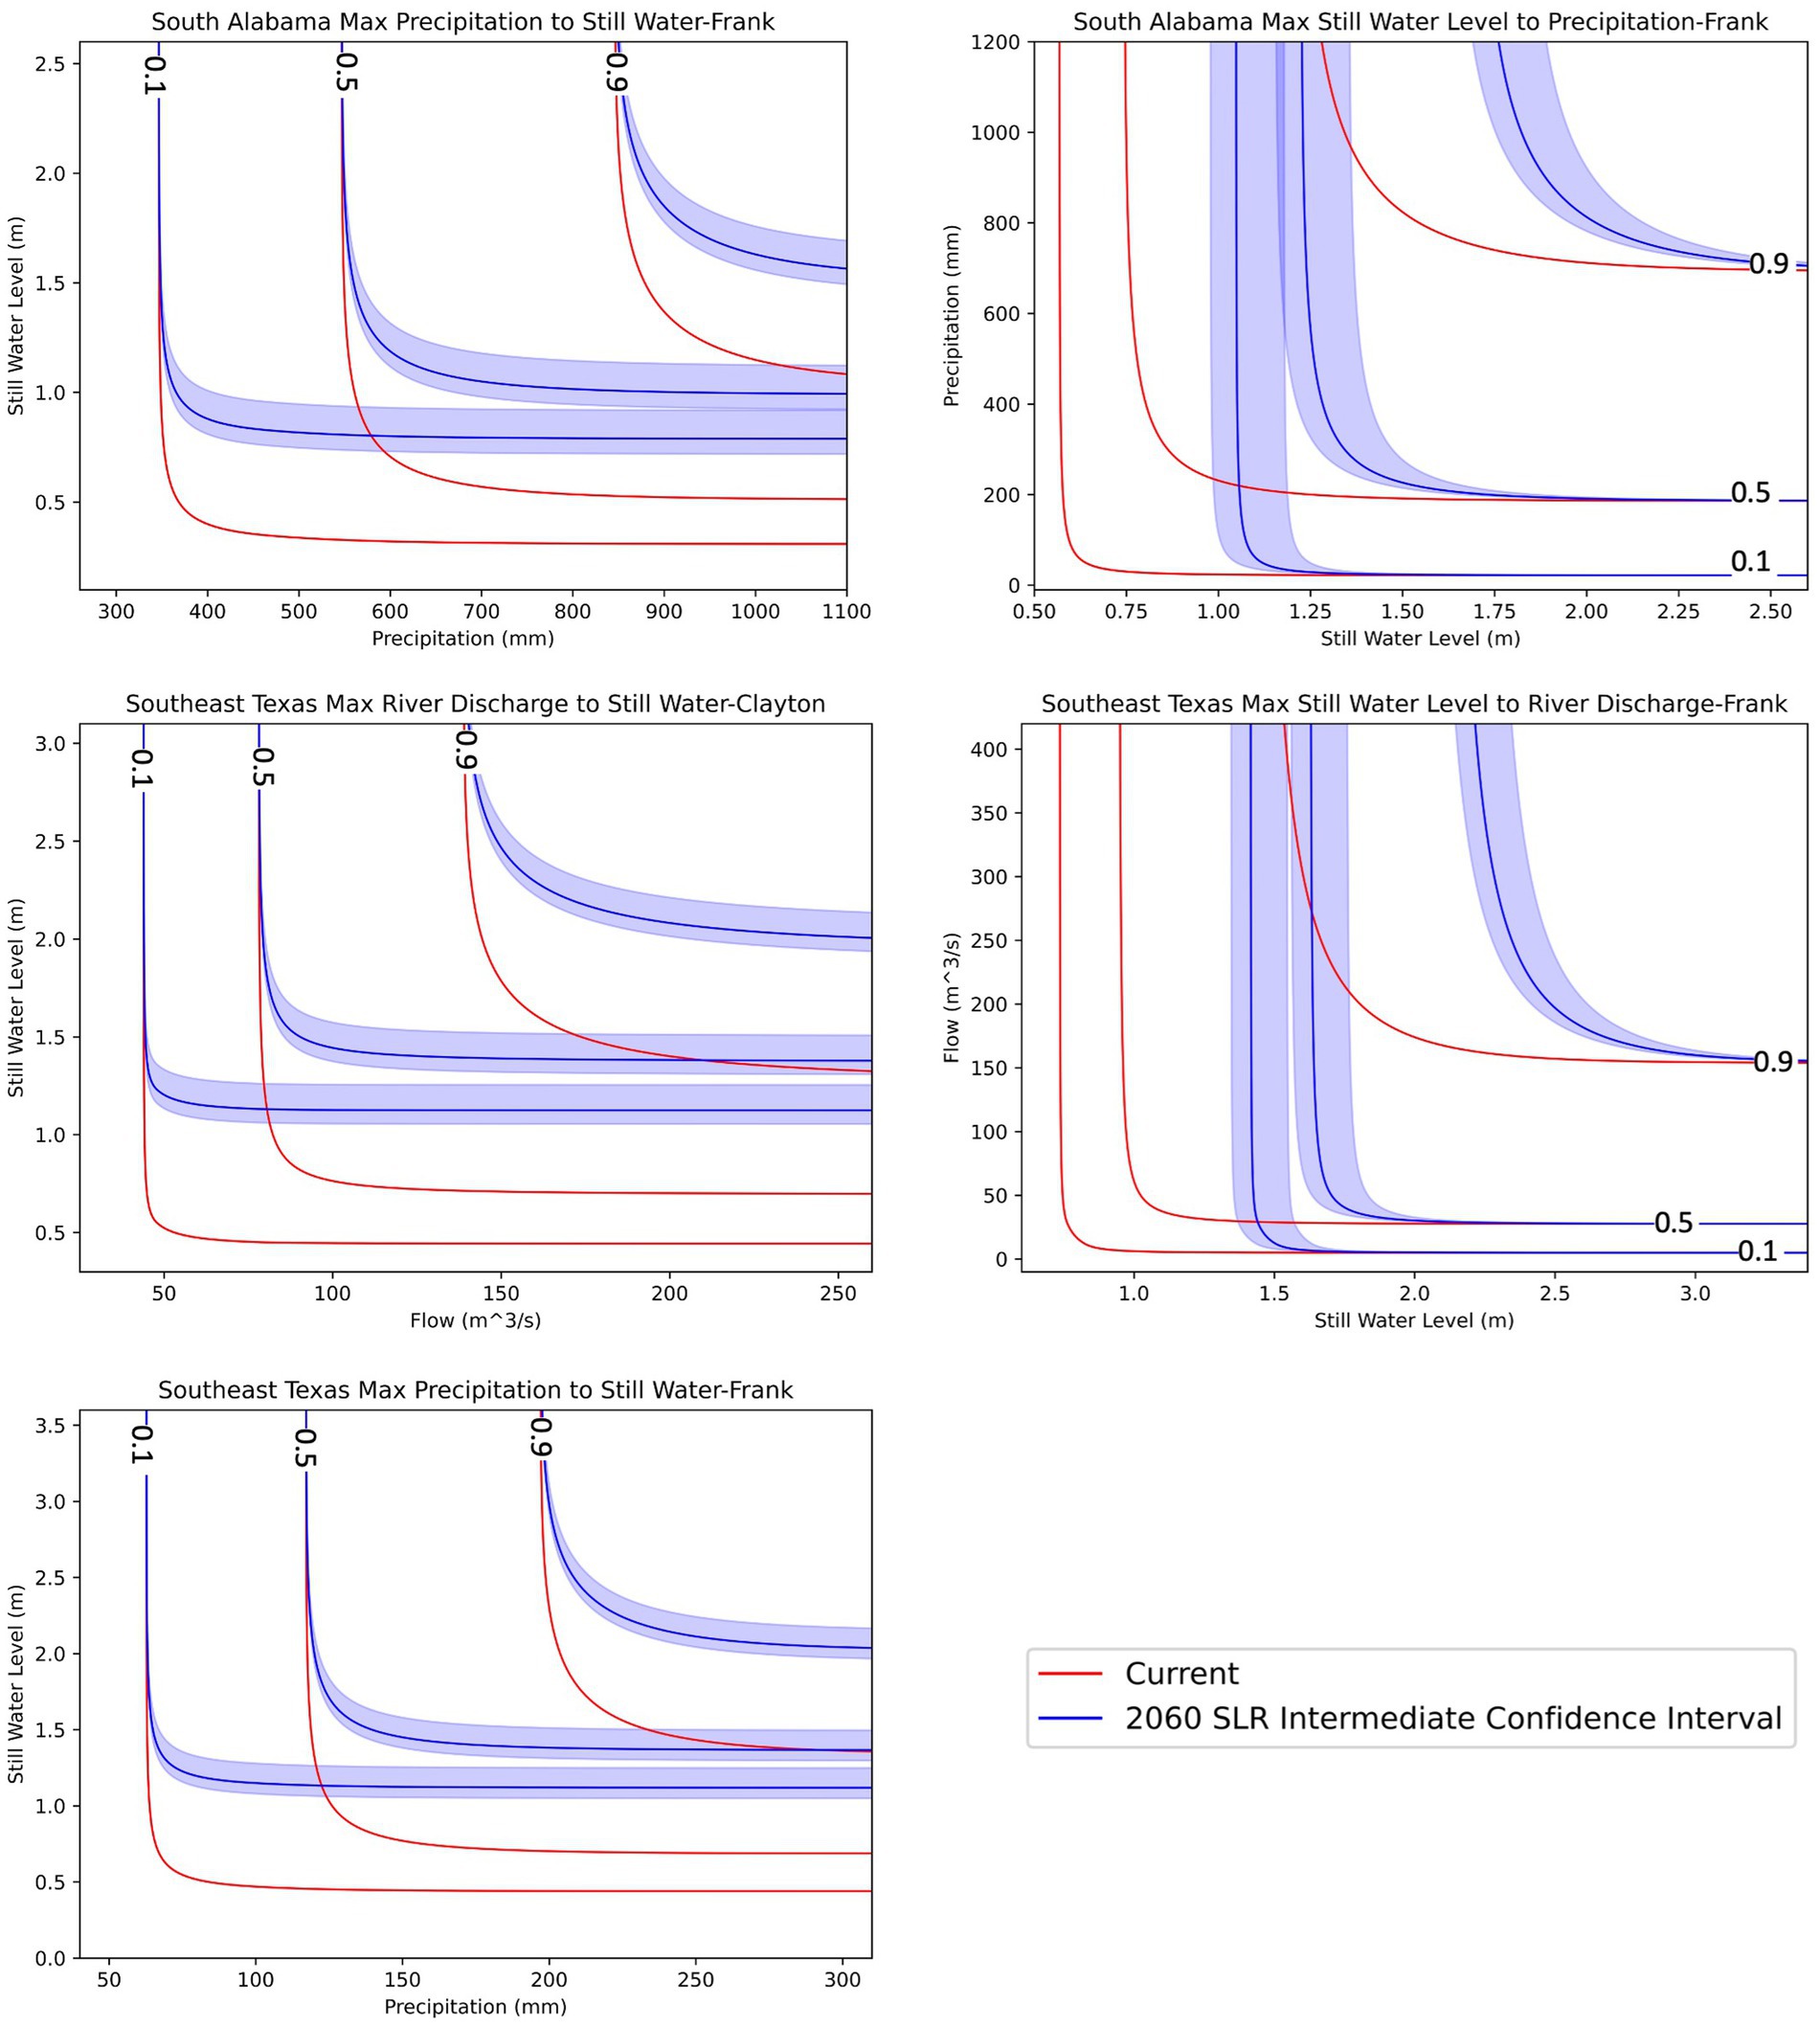
Figure 7. Annual non-exceedance probabilities for theoretical copulas for current still water level (red) and 2060 still water level with sea level rise (blue with confidence).
A significant shift in the joint behavior of the flood sources is evident in all the statistically significant scenarios, demonstrating the potential exacerbation of CF due to SLR. This result indicates that SLR will alter the frequency of compound coastal floods in the future. For example, CF with the combination of 210 CMS of max river discharge and 1.3 m of SWL in SETx currently has an exceedance probability of 0.1 (non-exceedance probability of 0.9), while Intermediate SLR in 2060s will be 5 times more probable to be exceeded (exceedance probability =0.5). This finding underscores the need for adaptation strategies that consider the exacerbating effects of SLR on CF.
In our examination of current policy documents pertaining to flood management in SETx and SAl, we aimed to gauge the extent to which various characteristics of CF are acknowledged and addressed. These documents encompassed a spectrum of state and local plans, policies, and regulations from both governmental and private entities. Notably, Table 3 presents a summary of these documents, including their jurisdictional scope (state, county, and locality), selected based on regional relevance, coverage of flooding issues, and the current status and relevance of the document.
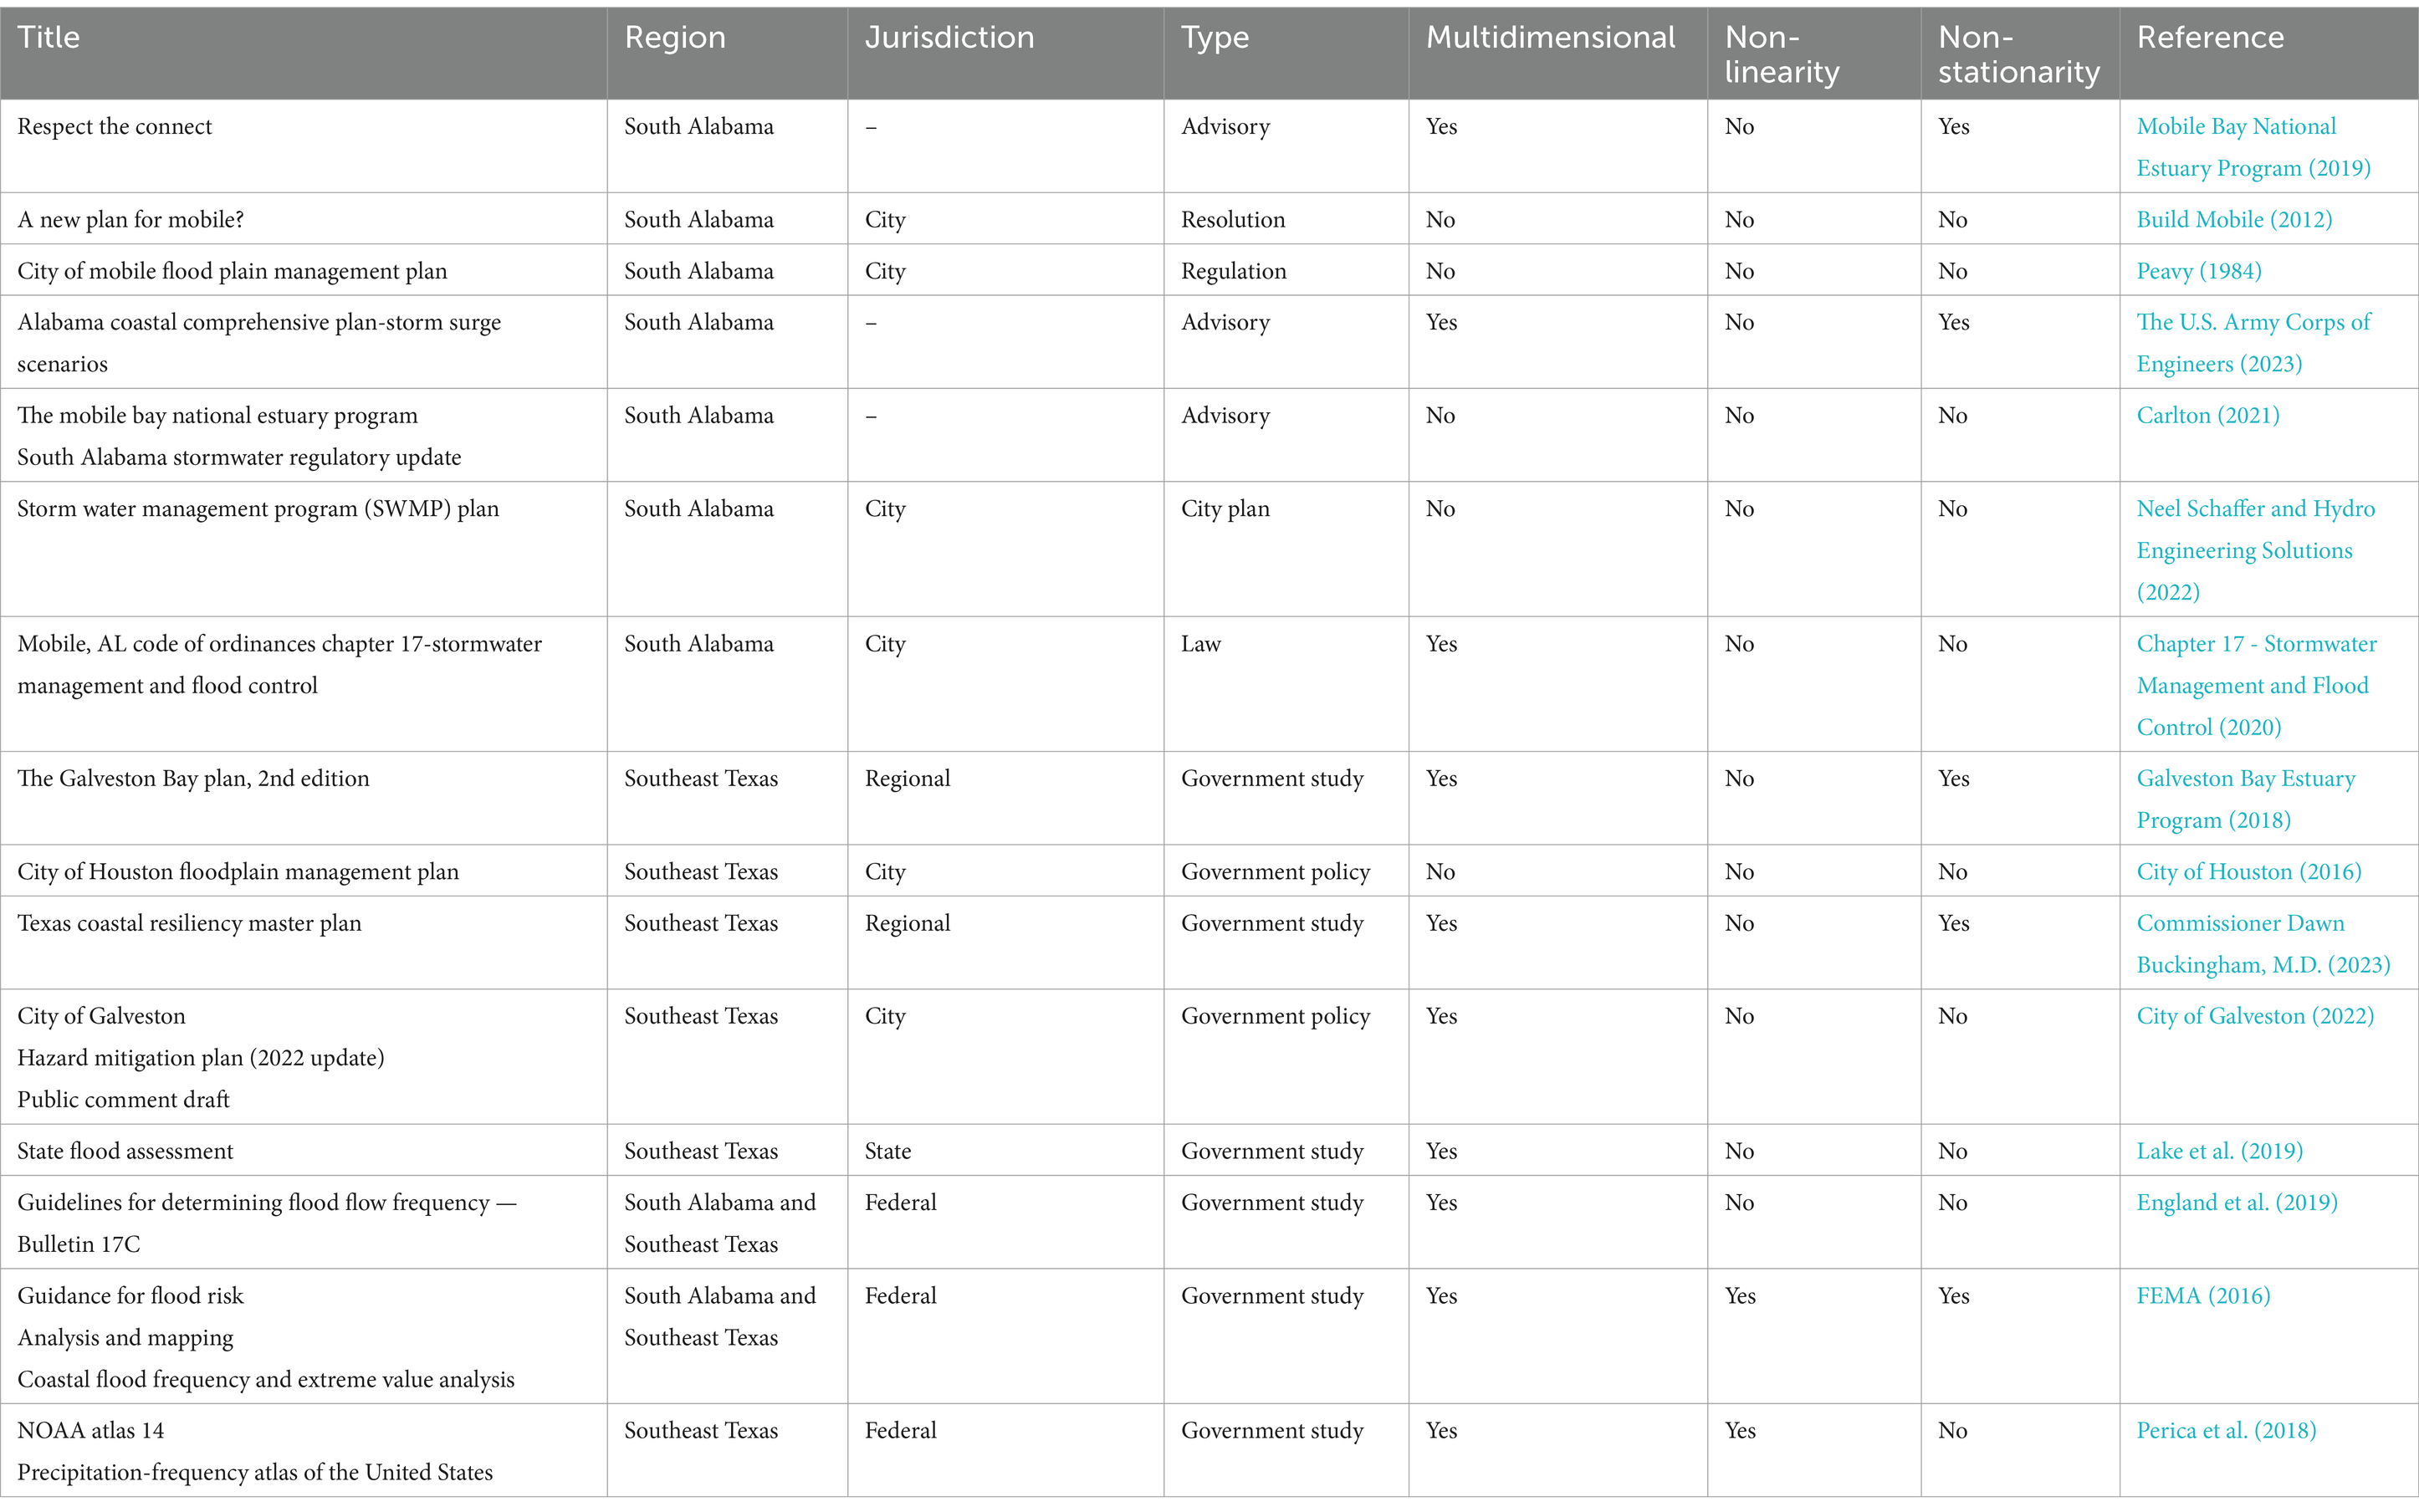
Table 3. Policy review document Classification for Southeast Texas and South Alabama.
Our review yielded a prevailing finding - that the majority of current policy documents largely fall short in their comprehensive treatment of the intricate phenomenon of CF. While several documents do acknowledge the existence of multiple flood sources, they often neglect the simultaneous/concurrent occurrence of these sources and their compounding effects. This finding carries significant weight, especially in light of the evidence we have presented in earlier sections regarding evidence for the existence of non-stationarity, non-linearity, and multidimensionality of CF in SETx and SAl.
A closer examination of select policy documents, accompanied by relevant citations, reveals key insights. For instance, “Respect the Connect” recognizes the multidimensional aspect of flood risk by considering SLR, precipitation, and temperature in tandem (Mobile Bay National Estuary Program, 2019). Similarly, the “Alabama Coastal Comprehensive Plan-Storm Surge Scenarios” considers multidimensionality and non-stationarity by addressing SLR and storm surge, although it operates under the assumption of linearity (The U.S. Army Corps of Engineers, 2023). However, “The Galveston Bay Plan, 2nd Edition” takes note of both multidimensionality and non-stationarity, considering rainfall accumulation and storm surge while acknowledging the changing hydrology due to climate variability (Galveston Bay Estuary Program, 2018). Similarly, the “Texas Coastal Resiliency Master Plan” acknowledges both multidimensionality and non-stationarity through numerous examples, including the interactions between different flood drivers and changing flood risks, but it is unclear if non-linearity was taken into account (Commissioner Dawn Buckingham, M.D., 2023). Finally, the Texas State Flood Assessment indirectly recognizes multidimensionality by noting interactions between river and stream flow, surface runoff, and elevated ocean and bay water surface levels but does not go beyond this. The reviewed federal documents all considered multidimensionality by considering various drivers and complexities that impact the accuracy and precision of the statistical analysis. “NOAA Atlas 14 Precipitation-Frequency Atlas of the United States” also considered non-linearity, however, only “Guidance for Flood Risk Analysis and Mapping Coastal Flood Frequency and Extreme Value Analysis” considered all three factors (FEMA, 2016; Perica et al., 2018). FEMA’s Flood Risk Guidance provides a specific example of when tide and surge interactions should be classified as non-linear and require complex methods of analysis (FEMA, 2016). NOAA’s Atlas 14 utilizes a spatial interpolation technique which is based on linear relationships that were found between precipitation frequency estimates for consecutive frequencies, mean annual maxima and 2-year precipitation frequency estimates (Perica et al., 2018). While non-linear relationships were not used, establishing that linear relationships exist intrinsically requires the consideration of non-linear relationships (Perica et al., 2018). Non-stationarity was acknowledged but will not be considered until Atlas 15 (Perica et al., 2018; OWP, 2022).
The findings of the policy document review underscore the need for a more comprehensive and integrated approach to CF risk management that considers the complex and changing nature of this phenomenon, including updating current policies and regulations to directly consider and address CF.
Despite the significant strides made in this study to characterize CF in SETx and SAl, it has become clear that there are still several challenges to be addressed. This section discusses these challenges and the potential opportunities they present for future work.
Addressing non-stationarity and non-linearity, which both present a challenge for traditional flood risk assessment methods, requires methodologies that do not ignore these key characteristics of CF. Future research could further seek to develop new methods of CF risk assessment that explicitly account for these key characteristics that are especially important due to the changing climate and SLR.
Data availability will continue to be a hindrance and one of the primary limitations of statistical analysis. Without data sources that are reliable and span a long period of time, non-stationary statistical analysis such as the one we performed can be limited in scope and accuracy. This limitation is especially present in coastal areas where tropical systems can cause long disruptions to data collection by damaging gauges. Such limitation is even more important in CF, compared with regular floods with single drivers, as an accurate characterization of correlation structure between flood drivers and the associated joint probability functions requires an extended overlapping continuous record of all variables involved.
Addressing CF requires cooperation from a range of stakeholders. The review of policy documents demonstrated that current strategies are often not adequately addressing the complexities of CF. There is an opportunity for greater engagement with stakeholders to update these documents and create more comprehensive flood management strategies.
The inconsistency across various policy and planning documents, where some are based on stationary methods while others incorporate non-stationary analysis, presents significant challenges in flood risk assessment and management. This disparity can lead to conflicting approaches in flood mitigation strategies, complicating the decision-making process for policymakers and engineers. For instance, reliance on stationary methods in some documents may overlook the evolving nature of flood risks due to climate change and urban development, potentially underestimating future flood hazards. In contrast, documents that require non-stationary analysis, incorporating factors such as climate variability and land-use changes, provide a more dynamic and realistic assessment of flood risks. However, the documents may not be universally adopted due to their complexity and the need for specialized knowledge.
Another challenge to be highlighted here is the fact that the current curriculum in schools of engineering and sustainability primarily focuses on univariate stationary methods for risk assessment and management. This educational approach may not adequately prepare the future workforce to utilize advanced analytical tools like copulas, which are essential for understanding the multidimensional nature of flood risks. The gap between the traditional stationary methods taught in academic institutions and the emerging non-stationary approaches needed in practice could lead to a workforce that is ill-equipped to handle the complexities of modern flood risk management. This observation highlights the need for a paradigm shift in educational curricula, emphasizing the importance of non-stationary and multivariate methods, to ensure that future engineers and risk managers are proficient in the latest tools and concepts required for effective flood risk management in an era of changing climate and land use patterns.
The study of CF is still a relatively new field with much to be explored. By addressing these challenges, we can develop more effective strategies to manage flood risk and build more resilient communities. The advancements in CF research provide ample opportunities for engagement and the integration of these findings into public policy and management strategies.
This study aimed to characterize CF in SETx and SAl by examining the non-stationarity, non-linearity, and multidimensionality in CF. We conducted the analysis using gauge data on precipitation, river discharge, and SWL, supplemented by SLR projections.
The results underscore the complexity of CF and its significant implications for flood management. This study accounts for the presence of non-stationarity, non-linearity, and multidimensionality in CF, challenging traditional flood risk assessment methods which often are based on assumptions that ignore these key characteristics of CF. Moreover, the policy document review highlighted that current flood management strategies do not adequately address these complexities. The quantification of non-linear relationships through copulas and the exploration of multidimensionality in our CF data using these methods are essential steps in providing policymakers and designers with probabilistic insights. These findings bridge the gap between research and practical applications, highlighting the fact that complex, non-linear, and multidimensional relationships are not adequately considered in the development of flood resilience strategies.
The projected SLR will likely exacerbate CF in coastal areas and increase the severity and/or frequency of these events, posing additional challenges for flood management. However, the advancements in CF research and the increasing awareness of its impacts provide a solid foundation for future work.
Addressing these challenges will require a multifaceted approach, including the development of flood risk assessment methods that account for the aforementioned complexities, greater cooperation among stakeholders, and the integration of scientific research into public policy. Collaboration and communication between researchers, practitioners, and policymakers are vital to ensuring that our research findings lead to proactive and informed policy decisions, ultimately safeguarding communities against the growing threat of CF events. By embracing these challenges, we can strive toward more effective flood management strategies and more resilient communities.
This study contributes to the growing body of research on CF and highlights the urgent need for more comprehensive strategies to manage this complex and increasing risk. It underscores the need for a paradigm shift in how we understand and manage flooding, stressing the importance of considering CF in flood risk assessment and management.
Information for existing publicly accessible datasets is contained within the article: The datasets presented in this study can be found in online repositories. The names of the repository/repositories and accession number(s) can be found in the article/Supplementary material. The code created to produce the non-exceedance probability contours can be found at https://github.com/CHL-UA/CF-Contours.
ML: Conceptualization, Data curation, Formal analysis, Investigation, Methodology, Visualization, Writing – original draft, Writing – review & editing. HM: Conceptualization, Data curation, Funding acquisition, Resources, Supervision, Writing – original draft, Writing – review & editing. PP: Funding acquisition, Writing – original draft, Writing – review & editing.
The author(s) declare that financial support was received for the research, authorship, and/or publication of this article. This study was funded by the National Oceanic and Atmospheric Administration (NOAA) – AdSci program (Award # NA21OAR4310285). Partial funding for this project was also provided by the NOAA award to the CIROH through the NOAA Cooperative Agreement with The University of Alabama, NA22NWS4320003.
The authors declare that the research was conducted in the absence of any commercial or financial relationships that could be construed as a potential conflict of interest.
All claims expressed in this article are solely those of the authors and do not necessarily represent those of their affiliated organizations, or those of the publisher, the editors and the reviewers. Any product that may be evaluated in this article, or claim that may be made by its manufacturer, is not guaranteed or endorsed by the publisher.
The Supplementary material for this article can be found online at: https://www.frontiersin.org/articles/10.3389/frwa.2024.1405603/full#supplementary-material
Abbaszadeh, P., Muñoz, D. F., Moftakhari, H., Jafarzadegan, K., and Moradkhani, H. (2022). Perspective on uncertainty quantification and reduction in compound flood modeling and forecasting. iScience 25:105201. doi: 10.1016/j.isci.2022.105201
Alipour, A., Yarveysi, F., Moftakhari, H., Song, J. Y., and Moradkhani, H. (2022). A multivariate scaling system is essential to characterize the tropical cyclones’ risk. Earth’s Future 10:e2021EF002635. doi: 10.1029/2021EF002635
Arns, A., Wahl, T., Wolff, C., Vafeidis, A. T., Haigh, I. D., Woodworth, P., et al. (2020). Non-linear interaction modulates global extreme sea levels, coastal flood exposure, and impacts. Nat. Commun. 11:1918. doi: 10.1038/s41467-020-15752-5
Bensi, M., Mohammadi, S., Kao, S.-C., and DeNeale, S. T. (2020). Multi-mechanism flood Hazard assessment: critical review of current practice and approaches (ORNL/TM-2020/1447). Oak Ridge, TN (United States): Oak Ridge National Lab. (ORNL).
Bilskie, M. V., and Hagen, S. C. (2018). Defining flood zone transitions in low-gradient coastal regions. Geophys. Res. Lett. 45, 2761–2770. doi: 10.1002/2018GL077524
Boumis, G., Moftakhari, H. R., and Moradkhani, H. (2023). Coevolution of Extreme Sea levels and sea-level rise under global warming. Earth’s Future 11:e2023EF003649. doi: 10.1029/2023EF003649
Build Mobile . (2012). A New Plan for Mobile. The City of Mobile. Available at: https://www.buildmobile.org/uploads/01newplanplansummaryfrommainreport.pdf
Carlton, J. (2021). The Mobile Bay National Estuary Program South Alabama Stormwater Regulatory Update. Available at: https://www.mobilebaynep.com/assets/pdf/Final-South-AL-Stormwater-Regulatory-Review-Update_w-appendicies.pdf.
Chapter 17 - stormwater management and flood control . (2020). Pub. L. No. Code of Ordinances. Available at: https://library.municode.com/al/mobile/codes/code_of_ordinances?nodeId=CICO_CH17STMAFLCO.
City of Galveston . (2022). Hazard Mitigation Plan Public Comment Draft. Available at: https://galvestontx.gov/DocumentCenter/View/16073/COG-HMP---Public-Comment-Draft---April-2022.
City of Houston . (2016). Floodplain Management Plan. Available at: https://www.houstonpermittingcenter.org/media/5751/download?inline.
Cokelaer, T. (2022). Fitter module reference (1.7.0) [Python]. Available at: https://fitter.readthedocs.io/en/latest/references.html.
Commissioner Dawn Buckingham, M.D. (2023). Texas coastal resiliency Master Plan. Texas general land Office. Available at: https://www.glo.texas.gov/coast/coastal-management/coastal-resiliency/resources/files/2023-tcrmp-book.pdf.
Dilling, L., Morss, R., and Wilhelmi, O. (2017). Learning to expect surprise: hurricanes Harvey, Irma, Maria, and beyond. J. Extr. Even. 4:1771001. doi: 10.1142/S2345737617710014
Dykstra, S. L., and Dzwonkowski, B. (2021). The role of intensifying precipitation on Coastal River flooding and compound river-storm surge events, Northeast Gulf of Mexico. Water Resour. Res. 57:e2020WR029363. doi: 10.1029/2020WR029363
England, J. F., Cohn, T. A., Faber, B. A., Stedinger, J. R., Thomas, W. O. Jr., Veilleux, A. G., et al. (2019). “Guidelines for determining flood flow frequency—bulletin 17C” in Techniques and methods (4-B5). (Reston, Virginia: U.S. Geological Survey).
FEMA . (2016). Guidance for flood risk analysis and mapping: coastal flood frequency and extreme value analysis. Available at: https://www.fema.gov/sites/default/files/2020-02/Coastal_Flood_Frequency_and_Extreme_Value_Analysis_Guidance_Nov_2016.pdf.
FEMA . (2023). Guidance for flood risk analysis and mapping, coastal flood frequency and extreme value analysis. Available at: https://www.fema.gov/sites/default/files/documents/Coastal_Flood_Frequency_and_Extreme_Value_Analysis_Guidance_Nov_2023.pdf.
Ferreira, A., and De Haan, L. (2015). On the block maxima method in extreme value theory: PWM estimators. Ann. Stat. 43, 276–298. doi: 10.1214/14-AOS1280
Galveston Bay Estuary Program . (2018). The Galveston Bay plan, 2nd edition: comprehensive conservation and management plan for the Galveston Bay estuary. Available at: https://wayback.archive-it.org/414/20220305034426/https:/gbep.texas.gov/wp-content/uploads/2021/10/CCMP_2ndEdition_FINAL-DRAFT_Lead-Implementers.pdf.
Gori, A., Lin, N., Xi, D., and Emanuel, K. (2022). Tropical cyclone climatology change greatly exacerbates US extreme rainfall–surge hazard. Nat. Clim. Chang. 12, 171–178. doi: 10.1038/s41558-021-01272-7
Hao, Z., and Singh, V. P. (2016). Review of dependence modeling in hydrology and water resources. Prog. Phys. Geogr. Earth Environ. 40, 549–578. doi: 10.1177/0309133316632460
Huang, W., Ye, F., Zhang, Y. J., Park, K., du, J., Moghimi, S., et al. (2021). Compounding factors for extreme flooding around Galveston Bay during hurricane Harvey. Ocean Model. 158:101735. doi: 10.1016/j.ocemod.2020.101735
IPCC (2022). The ocean and cryosphere in a changing climate: special report of the intergovernmental panel on climate change. 1st Edn. Cambridge, UK and New York, NY, USA: Cambridge University Press.
Jafarzadegan, K., Moradkhani, H., Pappenberger, F., Moftakhari, H., Bates, P., Abbaszadeh, P., et al. (2023). Recent advances and new Frontiers in riverine and coastal flood modeling. Rev. Geophys. 61:e2022RG000788. doi: 10.1029/2022RG000788
Jane, R., Wahl, T., Santos, V. M., Misra, S. K., and White, K. D. (2022). Assessing the potential for compound storm surge and Extreme River discharge events at the catchment scale with statistical models: sensitivity analysis and recommendations for best practice. J. Hydrol. Eng. 27:04022001. doi: 10.1061/(ASCE)HE.1943-5584.0002154
Joe, H. (1997). Multivariate models and multivariate dependence concepts. Chapman and Hall. Available at: https://www.routledge.com/Multivariate-Models-and-Multivariate-Dependence-Concepts/Joe/p/book/9780412073311.
Jongman, B., Ward, P. J., and Aerts, J. C. J. H. (2012). Global exposure to river and coastal flooding: long term trends and changes. Glob. Environ. Chang. 22, 823–835. doi: 10.1016/j.gloenvcha.2012.07.004
Kendall, M. G. (1938). A new measure of rank correlation. Biometrika 30, 81–93. doi: 10.2307/2332226
Kim, H., Villarini, G., Jane, R., Wahl, T., Misra, S., and Michalek, A. (2023). On the generation of high-resolution probabilistic design events capturing the joint occurrence of rainfall and storm surge in coastal basins. Int. J. Climatol. 43, 761–771. doi: 10.1002/joc.7825
Kotz, S., Kozubowski, T. J., and Podgórski, K. (2001). “Asymmetric Laplace distributions” in The Laplace distribution and generalizations: a revisit with applications to communications, economics, engineering, and finance. eds. S. Kotz, T. J. Kozubowski, and K. Podgórski (Boston, MA: Birkhäuser), 133–178.
Lake, P. M., Jackson, K., Paup, B. T., and Walker, J. (2019). State Flood Assessment. Texas Water Development Board. Available at: https://texasfloodassessment.org/doc/State-Flood-Assessment-report-86th-Legislation.pdf.
Mann, H. B., and Whitney, D. R. (1947). On a test of whether one of two random variables is stochastically larger than the other. Ann. Math. Stat. 18, 50–60. doi: 10.1214/aoms/1177730491
McClenaghan, E. (2022). Mann-Whitney U Test: Assumptions and Example. Informatics from Technology Networks. Available at: http://www.technologynetworks.com/informatics/articles/mann-whitney-u-test-assumptions-and-example-363425.
Merz, B., Vorogushyn, S., Lall, U., Viglione, A., and Blöschl, G. (2015). Charting unknown waters—on the role of surprise in flood risk assessment and management. Water Resour. Res. 51, 6399–6416. doi: 10.1002/2015WR017464
Mobile Bay National Estuary Program . (2019). Comprehensive Conservation & Management Plan for Alabama’s Estuaries & Coast 2019-2023. Dauphin Island Sea Lab. Available at: https://www.mobilebaynep.com/assets/pdf/FINAL-CCMP-11.25.2019.pdf.
Moftakhari, H., Salvadori, G., AghaKouchak, A., Sanders, B. F., and Matthew, R. A. (2017). Compounding effects of sea level rise and fluvial flooding. Proc. Natl. Acad. Sci. 114, 9785–9790. doi: 10.1073/pnas.1620325114
Moftakhari, H., Schubert, J. E., AghaKouchak, A., Matthew, R. A., and Sanders, B. F. (2019). Linking statistical and hydrodynamic modeling for compound flood hazard assessment in tidal channels and estuaries. Adv. Water Resour. 128, 28–38. doi: 10.1016/j.advwatres.2019.04.009
Muñoz, D. F., Moftakhari, H., and Moradkhani, H. (2020). Compound effects of flood drivers and wetland elevation correction on coastal flood Hazard assessment. Water Resour. Res. 56:e2020WR027544. doi: 10.1029/2020WR027544
Muñoz, D. F., Yin, D., Bakhtyar, R., Moftakhari, H., Xue, Z., Mandli, K., et al. (2022). Inter-model comparison of Delft3D-FM and 2D HEC-RAS for Total water level prediction in coastal to inland transition zones. J. Am. Water Resour. Assoc. 58, 34–49. doi: 10.1111/1752-1688.12952
Naseri, K., and Hummel, M. A. (2022). A Bayesian copula-based non-stationary framework for compound flood risk assessment along US coastlines. J. Hydrol. 610:128005. doi: 10.1016/j.jhydrol.2022.128005
National Institute of Standards and Technology . (2012). 1.3.5.16. Kolmogorov-Smirnov Goodness-of-Fit Test. Available at: https://www.itl.nist.gov/div898/handbook/eda/section3/eda35g.htm.
Neel Schaffer and Hydro Engineering Solutions . (2022). Storm Water Management Program (SWMP) Plan. Available at: https://www.stormwatermobile.org/uploads/images/FINAL%20Mobile%202022%20SWMP%20Plan.pdf.
NOAA NCEI . (2023a). Dauphin Island Number 2, AL US (USC00012172) [dataset]. Available at: https://www.ncei.noaa.gov/access/past-weather/dauphin%20island,%20AL.
NOAA NCEI . (2023b). Houston Alief, TX US (USC00414311 [dataset]. Available at: https://www.ncei.noaa.gov/access/past-weather/Houston%20Alief.
NOAA NCEI . (2023c). Houston Westbury, TX US (USC00414325) [dataset]. Available at: https://www.ncei.noaa.gov/access/past-weather/Houston%2C%20Texas.
NOAA NCEI . (2023d). Mobile regional airport, AL US [dataset]. Available at: https://www.ncei.noaa.gov/access/past-weather/Mobile%20Regional.
NOAA Office for Coastal Management . (2023). Sea level rise viewer. Available at: https://coast.noaa.gov/digitalcoast/tools/slr.html
NOAA Tides and Currents . (2023a). 8735180 Dauphin Island, AL [dataset]. Available at: https://tidesandcurrents.noaa.gov/noaatidepredictions.html?id=8735180&legacy=1.
NOAA Tides and Currents . (2023b). 8771450 Galveston Pier 21, TX [dataset]. Available at: https://tidesandcurrents.noaa.gov/noaatidepredictions.html?id=8771450.
OWP . (2022). NOAA atlas 15 flyer. NOAA. Available at: https://www.weather.gov/media/owp/hdsc_documents/NOAA_Atlas_15_Flyer.pdf.
Peavy, T. K. (1984). City of Mobile, Alabama Flood Plain Management Plan. Available at: https://www.cityofmobile.org/uploads/EngineeringFloodPlainPlan.pdf.
Perica, S., Pavlovic, S., Laurent, M. S., Trypaluk, C., Unruh, D., and Wilhite, O. (2018). Precipitation-frequency atlas of the United States. NOAA, 11(2). Available at: https://www.weather.gov/media/owp/oh/hdsc/docs/Atlas14_Volume11.pdf.
Sadeqi, A., Tabari, H., and Dinpashoh, Y. (2022). Spatio-temporal analysis of heating and cooling degree-days over Iran. Stoch. Env. Res. Risk A. 36, 869–891. doi: 10.1007/s00477-021-02064-3
Santiago-Collazo, F. L., Bilskie, M. V., and Hagen, S. C. (2019). A comprehensive review of compound inundation models in low-gradient coastal watersheds. Environ. Model Softw. 119, 166–181. doi: 10.1016/j.envsoft.2019.06.002
Santos, V. M., Wahl, T., Jane, R., Misra, S. K., and White, K. D. (2021). Assessing compound flooding potential with multivariate statistical models in a complex estuarine system under data constraints. J. Flood Risk Manag. 14:e12749. doi: 10.1111/jfr3.12749
Scarrott, C., and MacDonald, A. (2012). A review of extreme value threshold estimation and uncertainty quantification. REVSTAT Statist. J. 10, 33–60. doi: 10.57805/revstat.v10i1.110
Sebastian, A., Gori, A., Blessing, R. B., Wiel, K.Van Der, and Bass, B. (2019). Disentangling the impacts of human and environmental change on catchment response during hurricane Harvey. Environ. Res. Lett., 14,:124023. doi: 10.1088/1748-9326/ab5234
Sebastian, T., Lendering, K., Kothuis, B., Brand, N., Jonkman, B., van Gelder, P., et al. (2017). Hurricane Harvey report: a fact-finding effort in the direct aftermath of hurricane Harvey in the greater Houston region. Delft, NL: Delft University Publishers.
Serafin, K. A., Ruggiero, P., and Stockdon, H. F. (2017). The relative contribution of waves, tides, and non-tidal residuals to extreme total water levels on U.S. west coast sandy beaches. Geophys. Res. Lett. 44, 1839–1847. doi: 10.1002/2016GL071020
Shen, Y., Morsy, M. M., Huxley, C., Tahvildari, N., and Goodall, J. L. (2019). Flood risk assessment and increased resilience for coastal urban watersheds under the combined impact of storm tide and heavy rainfall. J. Hydrol. 579:124159. doi: 10.1016/j.jhydrol.2019.124159
Singh, V. P. (1998). “Pearson type III distribution” in Entropy-based parameter estimation in hydrology. ed. V. P. Singh (Netherlands: Springer), 231–251.
Slater, L. J., Anderson, B., Buechel, M., Dadson, S., Han, S., Harrigan, S., et al. (2021). Non-stationary weather and water extremes: a review of methods for their detection, attribution, and management. Hydrol. Earth Syst. Sci. 25, 3897–3935. doi: 10.5194/hess-25-3897-2021
Smith, R. L. (1987). Estimating tails of probability distributions. Ann. Stat. 15, 1174–1207. doi: 10.1214/aos/1176350499
Smith, R. L. (1994). “Multivariate threshold methods” in Extreme value theory and applications. eds. J. Galambos, J. Lechner, and E. Simiu (Boston, MA: Springer US), 225–248.
Sohrabi, M., Moftakhari, H., and Moradkhani, H. (2023). Efficient tropical cyclone scenario selection based on cumulative likelihood of potential impacts. Earth’s Future 11:e2023EF003731. doi: 10.1029/2023EF003731
Sweet, W. V., Hamlington, B. D., Kopp, R. E., Weaver, C. P., Barnard, P. L., Bekaert, D., et al. (2022). Global and regional sea level rise scenarios for the United States. Spring, MD: NOAA, 111.
Teng, J., Jakeman, A. J., Vaze, J., Croke, B. F. W., Dutta, D., and Kim, S. (2017). Flood inundation modelling: a review of methods, recent advances and uncertainty analysis. Environ. Model Softw. 90, 201–216. doi: 10.1016/j.envsoft.2017.01.006
The U.S. Army Corps of Engineers . (2023). ACCP: Alabama coastal comprehensive plan storyboard [Map]. Available at: https://www.arcgis.com/apps/MapSeries/index.html?appid=470487519df24b9ebb08f89084d6cead#.
Tootoonchi, F., Sadegh, M., Haerter, J. O., Räty, O., Grabs, T., and Teutschbein, C. (2022). Copulas for hydroclimatic analysis: a practice-oriented overview. WIREs Water 9:e1579. doi: 10.1002/wat2.1579
Uppuluri, V. R. R. (1981). “Some properties of the log-Laplace distribution” in Statistical distributions in scientific work. eds. C. Taillie, G. P. Patil, and B. A. Baldessari (Netherlands: Springer), 105–110.
USGS . (2023a). Buffalo bayou at W Belt Dr, Houston, TX [dataset]. Available at: https://waterdata.usgs.gov/monitoring-location/08073600/.
USGS . (2023b). Fish river near silver hill AL [dataset]. Available at: https://waterdata.usgs.gov/monitoring-location/02378500/
USGS . (2023c). Magnolia river at US 98 near Foley, Alabama [dataset]. Available at: https://waterdata.usgs.gov/monitoring-location/02378300/.
USGS . (2023d). W Fk San Jacinto Rv Abv Lk Houston nr Porter, TX [dataset]. Available at: https://waterdata.usgs.gov/monitoring-location/08068090/.
Valle-Levinson, A., Olabarrieta, M., and Heilman, L. (2020). Compound flooding in Houston-Galveston Bay during hurricane Harvey. Sci. Total Environ. 747:141272. doi: 10.1016/j.scitotenv.2020.141272
Wahl, T., Jain, S., Bender, J., Meyers, S. D., and Luther, M. E. (2015). Increasing risk of compound flooding from storm surge and rainfall for major US cities. Nat. Clim. Chang. 5, 1093–1097. doi: 10.1038/nclimate2736
Yan, J. (2023). “Multivariate modeling with copulas and engineering applications” in Springer handbook of engineering statistics. ed. H. Pham (London, UK: Springer), 931–945.
Zheng, F., Westra, S., Leonard, M., and Sisson, S. A. (2014). Modeling dependence between extreme rainfall and storm surge to estimate coastal flooding risk. Water Resour. Res. 50, 2050–2071. doi: 10.1002/2013WR014616
Keywords: compound flooding, multi-hazard, Unites States’ Gulf Coast, resiliency planning, public policy, sea level rise
Citation: Lewis M, Moftakhari H and Passalacqua P (2024) Challenges for compound coastal flood risk management in a warming climate: a case study of the Gulf Coast of the United States. Front. Water. 6:1405603. doi: 10.3389/frwa.2024.1405603
Edited by:
Shasha Han, University of Birmingham, United KingdomReviewed by:
Amin Sadeqi, University of Turku, FinlandCopyright © 2024 Lewis, Moftakhari and Passalacqua. This is an open-access article distributed under the terms of the Creative Commons Attribution License (CC BY). The use, distribution or reproduction in other forums is permitted, provided the original author(s) and the copyright owner(s) are credited and that the original publication in this journal is cited, in accordance with accepted academic practice. No use, distribution or reproduction is permitted which does not comply with these terms.
*Correspondence: Hamed Moftakhari, aG1vZnRha2hhcmlAZW5nLnVhLmVkdQ==
Disclaimer: All claims expressed in this article are solely those of the authors and do not necessarily represent those of their affiliated organizations, or those of the publisher, the editors and the reviewers. Any product that may be evaluated in this article or claim that may be made by its manufacturer is not guaranteed or endorsed by the publisher.
Research integrity at Frontiers
Learn more about the work of our research integrity team to safeguard the quality of each article we publish.