 Kazuki Haruyama1
 Masaya Toyoda
 Nobuhito Mori
 Sooyoul Kim
- 1Nippon Koei Co., Ltd, Tokyo, Japan
- 2Department of Architecture and Civil Engineering, Toyohashi University of Technology, Aichi, Japan
- 3Disaster Prevention Research Institute, Kyoto University, Kyoto, Japan
- 4Center for Water Cycle, Marine Environment and Disaster Management, Kumamoto University, Kumamoto, Japan
- 5Department of Civil Engineering, Faculty of Engineering, Gifu University, Gifu, Japan
The risk of high river flow and peak storm surge superimposing in the estuary of small-and medium-sized rivers can be more severe during typhoon landfalls than at other times. In this study, 30 cases of typhoon track ensemble experiments for five rivers in Mikawa Bay, Japan, were evaluated using an atmospheric-river-ocean model. The results showed that storm surges coincided with high river flows when typhoons crossed the western side of Mikawa Bay, with the highest potential observed when typhoons passed northwest of the Bay. The average time discrepancy for the five rivers between the storm surge occurrence and increased river flow in the minimum time difference case was 48 min at the river mouth. Distinct trends in the time difference between a storm surge and river flow were observed for each river mouth. The order of time differences corresponded to the drainage area scale: Toyo (188 min), Umeda (112 min), Otowa (114 min), Sana (96 min), and Yagyu (88 min). Time difference trends also varied based on the distance between the typhoon center and each river mouth. For Toyo River, storm surges and high river flows did not substantially overlap, regardless of distance. However, for medium-and small-sized rivers, the time difference increased proportionally with the distance from the typhoon. The Yagyu River showed the highest potential for compound occurrence of a storm surge and river flood because of the synchronization of storm surge peaks and high river flow peaks, with a time difference of 1–2 h for small-and medium-sized rivers within 100 km2 of the basin.
1 Introduction
Typhoons cause direct effects, such as heavy rainfall and windstorms, and indirect hazards, such as floods, landslides, tidal waves, and storm surges. These natural phenomena have wide-ranging impacts extending from equatorial regions to mid-latitudes that are contingent upon their scale, intensity, and trajectory. Thus, large efforts have been dedicated to the development and enhancement of observation techniques, medium-to long-term forecasting techniques, and field surveys for tropical cyclones (Brackwell et al., 2018; Gomez-Fragoso et al., 2022; Switanek et al., 2023). In Japan, where typhoons are prone to occur, the Japan Meteorological Agency (JMA) and Japan Aerospace Exploration Agency are conducting a series of observations and managing a database.1,2 According to statistics compiled by the JMA, the North Atlantic Ocean region, where Japan is located, experiences an average of 25 typhoons annually, with approximately 12 approaching Japan; approximately three make landfall along the Japanese coast (Japan Meteorological Agency, 2023).
A prominent characteristic of typhoons is the occurrence of widespread, intermittent rainfall over a short-to-medium period, typically spanning several days to a week. An illustrative example is Typhoon Morakot (2009), which inflicted extensive damage on Taiwan, with heavy rainfall that resulted in cumulative precipitation of 2,583 mm at Yuyushan (Shieh et al., 2009). This substantial rainfall contributes to elevations in water surface levels in rivers, consequently augmenting the discharge of rivers into coastal regions. For instance, in the USA, Hurricane Ida (2021) generated large and sustained heavy rainfall from parts of the northern Gulf Coast states to the Tennessee Valley. This hurricane triggered the inundation of numerous rivers, including the Tangipahoa and Tchefuncte Rivers in southeastern Louisiana and the Wolf and Jourdan Rivers in southeastern Mississippi (Knabb et al., 2023). Thus, the threat of severe flooding stemming from heavy typhoon-induced rainfall is an important concern. Another distinctive trait of typhoons is the occurrence of potent windstorms, as these weather systems approach and traverse bays. Windstorms cause the formation of high waves and storm surges, particularly in the bays along their tracks. For instance, Hurricane Katrina (2005) delivered a 4.7 m storm surge to the Mississippi River Gulf, causing flooding in approximately 80% of New Orleans (Knabb et al., 2023). Similarly, the Typhoon Haiyan (2013) storm surge severely impacted Tacloban City, the Philippines, which was the area of greatest devastation; the storm surge exceeded 4.5 m, leading to 2,678 casualties (Lagmay et al., 2015). In recent years, Hurricane Ian (2022) caused severe damage to the USA (Bucci et al., 2023). Ian’s winds reached a maximum sustained speed of 155 mph (69.3 m/s), just below a Category 5 storm, with a storm surge of 12–18 ft. (3.66–5.49 m)—the highest recorded in Southwest Florida in the past 150 years. These factors led to an estimated tens of billions of dollars in damage.3
Coastal areas and their surrounding estuaries are susceptible to storm surges and high river flows triggered by typhoons. In these regions, the potential for multiple hazards superimposing engenders more severe risks than those of single hazards. In this discussion, “multiple hazards” refer to the simultaneous occurrence of various threats, such as the confluence of storm surges and high river flows (Leonard et al., 2013). The resulting inundation is commonly referred to as “compound flooding.” Notably, the 2020 Intergovernmental Panel on Climate Change AR6 report highlighted the importance of considering compound flooding in conjunction with addressing the future impacts of climate change (IPCC, 2021).
In conventional numerical studies, processes have been separately treated utilizing different models: ocean circulation models for analyzing storm surges and hydrological/river flow models for understanding inundations. However, hydrological/river flow models often ignore estuarine or oceanic processes, such as storm surge run-up and interactions between surges and river flow. Additionally, few coastal models have incorporated the effect of high river flows or assessed the consequences of upstream flow interactions. Using bivariate analysis, Zheng et al. (2013) detected a significant correlation between rainfall and storm surges in coastal areas. To address modeling of compound hazards, Kumbier et al. (2018) investigated the simultaneous occurrence of storm surges and high river flows during an East Coast Low event in Australia’s Shoalhaven River. Their findings indicated that the average inundation depth in the estuary was 0.34 m greater when considering river discharge, supporting the need for a comprehensive analysis that accounts for both factors of storm surge and high river flow. Liang and Zhou (2022) employed a numerical river model to simulate water level fluctuations in the coastal estuary of Zhejiang province during Typhoon Lekima (2019). Their study revealed that the water level rose by 1–2 m because of oceanic influences in the Qiantang Estuary, demonstrating the substantial impact of storm surges on estuaries. Estuary cities contend with substantial challenges in managing compound flooding. Li et al. (2023) assessed the relationship between the joint probability of compound flooding, including storm surges, rainfall, and the potential loss of life on the Macao Peninsula in China. In areas most severely affected by flooding, the maximum mortality rate exceeded 0.008. The study reported that that the western coastal area of Macao Peninsula is the most vulnerable area to compound flooding and higher mortality. Therefore, although most of Macao Peninsula has low mortality, a serious loss of life still occurs during extreme floods (e.g., compound flooding) because of the high population density. Furthermore, the river flood model was updated to represent inundation and the physics of river channels caused by extreme flooding events (Sarker, 2023). A method for simulating bankfull discharge and floodplain flow from observed discharge was developed using the MIKE 21C model. The authors reported that this method can be applied to characterize inundation in riparian areas.
In Japanese coastal lowlands, where the population, assets, and various societal functions are concentrated, consideration of compound flooding is critical. This necessity arises from predominantly mountainous terrain, steep slopes of rivers, and limited inhabitable land area, which constitutes only 27% of the total landmass according to the Ministry of Land, Infrastructure, and Transport, Japan.4 Japanese rivers have steep bed slopes, which can rapidly amplify river flows during heavy rainfall. Moreover, many bays exhibit narrow entrances and shallow depths, making them particularly susceptible to storm surges. Thus, coastal regions are at significant risk of compound occurrence of storm surges and high river flow, and many studies have been conducted to assess financial losses attributed to typhoons. Jiang et al. (2019) estimated financial losses in Nagoya City, on the Ise Bay coast in Japan, during typhoon occurrences under climate change. This estimation was based on inundation simulations and loss rates for inundation depths. Their analysis projected a five-to seven-fold increase in property damage due to climate change. To assess the compound occurrence of storm surges and high river flow risk, Hara et al. (2009) developed a coupled numerical model that integrates storm surge and river dynamics to determine risks at the mouth of the Edo River during typhoon events. The findings indicated that high river flow at the estuary can raise water levels by 0.1 m. The authors also described the potential for inaccurate predictions of the water level and velocity when water level control measures are implemented in coastal areas.
Recently, Toyoda et al. (2022) developed a coupled surge, wave, and tide model incorporating river channels to account for rainfall runoff. They applied the model to evaluate the compound occurrence of storm surge and high river flow risk associated with the Toyo, Yagyu, and Umeda Rivers in the eastern Mikawa region of Aichi Prefecture. The results revealed a critical relationship between the stream length and compound occurrence of a storm surge and high river flow, indicating that shorter streams carry a greater risk of compound occurrence of storm surge and high river flow. Although the combined inundation risk was quantified for small-and medium-sized rivers, further research is needed to explore the effect of typhoon tracks on combined inundation because the distributions of precipitation resulting in different river flows vary with a typhoon track.
Because of the potentially devastating effect of the typhoon track on combined inundation, previous studies focused on the compound flooding risk linked to historical tropical cyclones. However, the critical track and distance relationships between typhoons and estuaries have not been extensively evaluated, mainly because of the limited number of typhoon events. For example, Typhoon Jebi in Japan (2018), which involved heavy precipitation and triggered a 1.8 m storm surge in Aichi Prefecture, resulted in property damage, human casualties, disruptions in transportation, and infrastructure failures (Nagoya Local Meteorological Observatory, Japan Meteorological Agency, 2018). Hence, to comprehensively determine the risks associated with the compound occurrence of storm surges and high river flow and identify the most severe potential tracks, it is crucial to investigate a wide array of typhoon trajectories, including those involving direct landfall along coastal regions. Furthermore, employing a mesoscale numerical weather prediction model that considers several atmospheric physical processes, rather than relying on an empirical model such as the Holland model (Holland, 1980), is essential to account for rainfall runoff and river flow.
In this study, we extend previous research (Toyoda et al., 2022) using a surge-river coupling model. We assessed the impact of typhoon tracks on the interaction of storm surges and high river flows in coastal areas by conducting a series of track ensemble experiments using a coupled atmosphere–ocean-river model. Track ensemble experiments were performed using the high-resolution typhoon model while longitudinally displacing the initial and boundary conditions of Typhoon Hagibis (2019), which brought heavy rainfall to the Kanto region in Japan (Yoshino et al., 2021). Typhoon Hagibis is among the most recent and powerful typhoons to affect Japan. River flow was modeled using the Rainfall-Runoff-Inundation (RRI) model. Compound occurrence was assessed based on the coupled surge-wave-tide model integrating river inflow (SuWAT).
This paper is organized as follows. Section 2 provides an overview of the study area and a detailed configuration of the models employed in this research. Section 3 presents and discusses the findings from the analysis of the impact of each typhoon track on Mikawa Bay. This analysis mainly focuses on the typhoon’s proximity, storm surge’s occurrence, and overlap with high river flows. Finally, the paper shows conclusions of key findings and prospects.
2 Study region and computational settings
2.1 Study area
The study area encompasses Mikawa Bay and the basins of five rivers that flow into it. These rivers are along the coastal regions of their basins within the inner part of the Bay, where cities have been established. As shown in Figure 1, Mikawa Bay is enclosed by two peninsulas within Aichi Prefecture. This long bay extends from east to west, and the mouth of the Bay on the west side borders Ise Bay, one of Japan’s three major bays. The average depth of the Bay is approximately 9 m, and its coastal regions rest at a low-lying elevation of 0 m below sea level. The five rivers targeted in this study are the Toyo, Umeda, Otowa, Sana, and Yagyu Rivers, shown in Figure 1. These five rivers flow toward Mikawa Bay through the southern part of Aichi Prefecture. Rivers with drainage areas larger than 100 km2 were categorized as “large area,” whereas those with drainage areas smaller than 100 km2 were classified as “small-and medium-sized rivers.” The Toyo River falls into the large river category, whereas the remaining rivers are small-and medium-sized. Toyo River, which has the largest basin area, is a large river with an area difference of more than 10-fold from that of the second largest river, the Ume River. Detailed information on these rivers is summarized in Table 1. For consistency, the rivers are presented in order of size across the figures, tables, and textual descriptions.
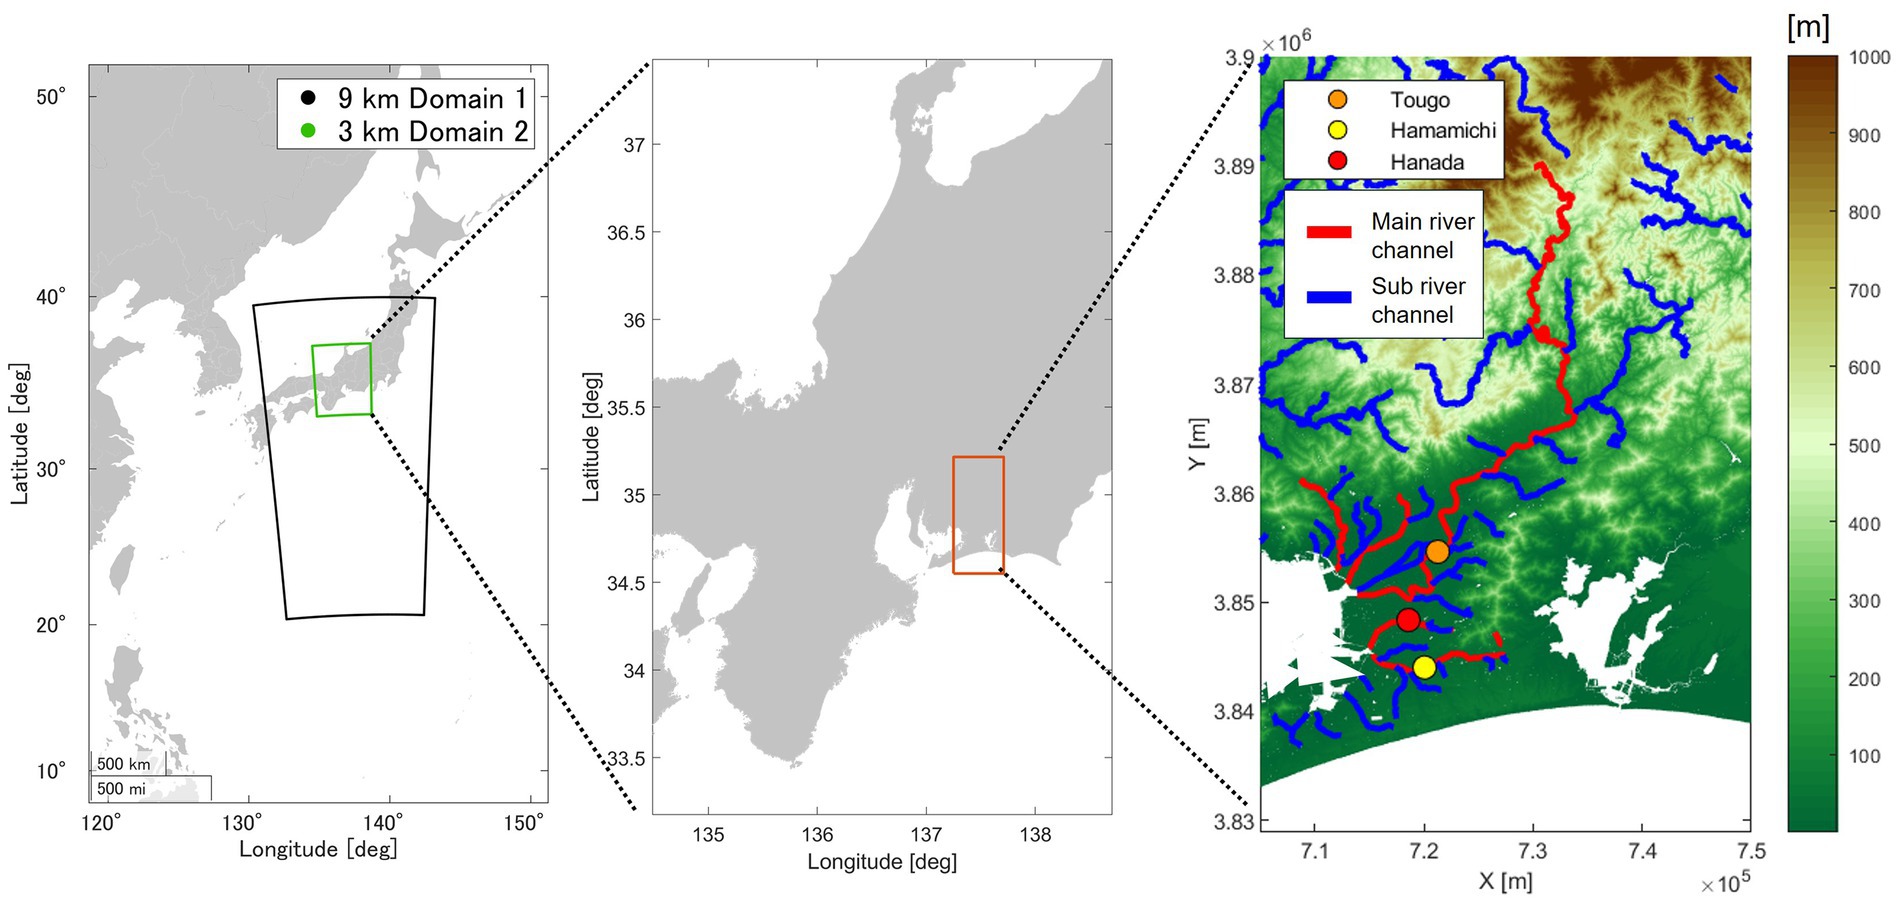
Figure 1. Location of Mikawa Bay and river channel. The black and green squares in the left-side figure indicate the range of the input meteorological field. The red box in the middle marks the range encompassed by the right-side figure. Red and blue lines in the right-side figure denote the main river channels and branches. Gray lines show the catchment basin of each river.
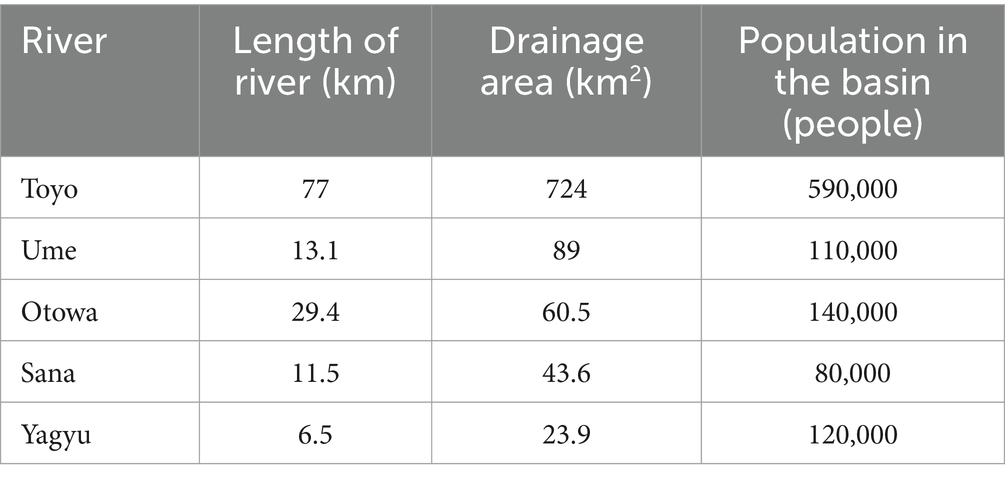
Table 1. Details of each of the rivers considered.
2.2 Meteorological model
The High-resolution Typhoon Model (HTM) (Yoshino et al., 2012; Toyoda et al., 2022) is based on a mesoscale meteorological model known as PSU/NCAR MM5 (Dudhia, 1993). It incorporates sea surface physics processes that are pivotal in determining typhoon intensity, including factors such as ocean mixed layers, sea spray evaporation, and viscous dissipative heating. Yoshino et al. (2021) applied this model to perform climate projection experiments on the present and future climate of Typhoon Hagibis (2019) as a case study. The results demonstrated the high accuracy of the HTM. The HTM comprises a 9 km domain covering the entire typhoon track and a 3 km domain encompassing the entirety of Aichi Prefecture within the first domain (see Figure 1 for details). The analysis period was from 0:00 UTC October 10 to 0:00 UTC October 13, 2019, for 3 days in total. The simultaneous occurrence of storm surges and river flooding was assessed based on the results derived from climate experiments conducted by Yoshino et al. (2021), in which the original track of Typhoon Hagibis (2019) was used as the reference case. To explore various scenarios without altering the speed and direction of typhoon movement, the authors systematically shifted the entire meteorological field westward in 0.05° increments (3° at the westernmost point), resulting in 61 virtual typhoons. We selected 30 typhoons that caused rainfall or storm surges in the Mikawa region, as shown in Figure 2, from the 61 typhoon tracks created by Yoshino et al. (2021) to analyze typhoon impacts over a wide area. These results were recorded at 15-min intervals. The westernmost typhoon track is Typhoon track 1 (TT-1), that over Mikawa Bay is TT-22, and the easternmost typhoon track is TT-30. Key parameters, including rainfall, wind direction and speed, and atmospheric pressure, were utilized as input data for the RRI and SuWAT models for rainfall, wind, and pressure, respectively.
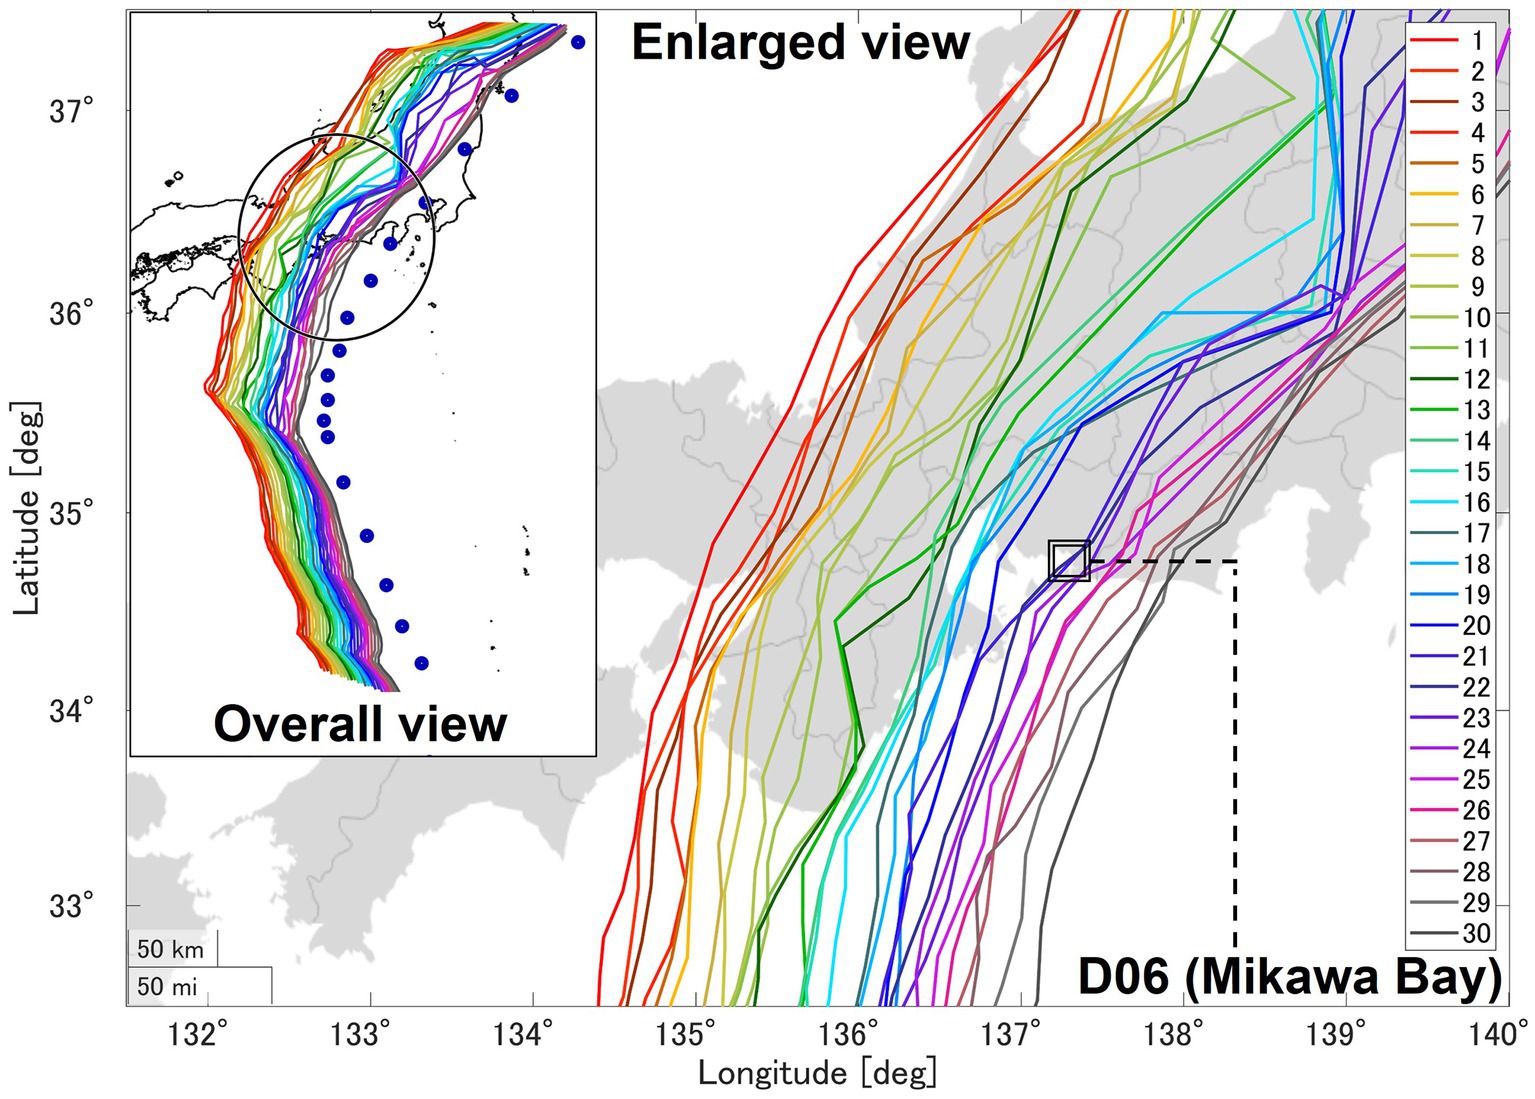
Figure 2. Tracks of all 30 typhoons considered in this study. The enlarged view shows the area enclosed by the square in the overall view. The blue dots in the overall view are the actual typhoon track of Hagibis by Japan Meteorological Agency’s (JMA)’s best tack. The circle drawn with black lines shows a radius of 200 km from Mikawa Bay.
2.3 Rainfall-runoff-inundation model
Rainfall data generated using the HTM were utilized as input for the RRI model to simulate river discharges and determine the arrival times of high river flows within each river basin. The RRI is a comprehensive hydrological and hydraulic model developed by Sayama et al. (2012). This two-dimensional model can simultaneously simulate various hydrologic processes, including rainfall runoff and streamflow propagation. Specifically, the model employs a kinematic wave model approach to analyze rainwater accumulation, infiltration, and retention based on the following mass balance (Equation 1) and momentum (Equations 2 and 3) equations:
where is the water height from the local surface, and are the unit width discharges in the and directions, and are the flow velocities in the and directions, is the rainfall intensity, is the infiltration rate, is the water height from the datum, is the density of water, g is gravitational acceleration, and and are shear stresses in the and directions. The second terms on the right side of Equations (4) and (5) are calculated using Manning’s equation.
where n is Manning’s roughness parameter. Under the diffusion wave approximation, inertia terms [left side terms of Equations (2) and (3)] are neglected. Moreover, by separating the x and y directions [i.e., ignoring the v and u terms in Equations (6) and (7), respectively], the following equations are derived:
where sgn is the signum function (for other detailed equation systems and settings, see Sayama et al., 2012 and the RRI manual).5
The RRI model is divided into river channel flow and slope grid cells. Water exchange between these river and slope grid cells is computed at each time step based on river water levels and bank top heights. River channel flows are calculated using a one-dimensional diffusive wave model. The following Equations (8) and (9) characterize the cross-section of the river:
where is the river width; is the river depth; is the upstream contributing area; and , , , and are geometric parameters. The simulation results of the RRI were sensitive to the cross-sectional parameters of the river. The river width parameters at each estuary site were obtained from Google Earth, and the administrations (MLIT and Aichi Prefecture) provided the depth and catchment area. These geometric parameters were determined by comparing calculated and observed river discharges (Table 2). Numerous other parameters can be set in RRI, such as subsurface and surface model parameters and soil depth. We used the runoff parameters automatically proposed by the RRI (see text footnote 5) based on land use data according to previous studies (Toyoda et al., 2022, 2024). Among the cases considered in this study, flow meters were installed only in the Toyo River, whereas observed river discharge data were unavailable for small-and medium-sized rivers. The parameters established for the Toyo River were also applied to the other rivers.
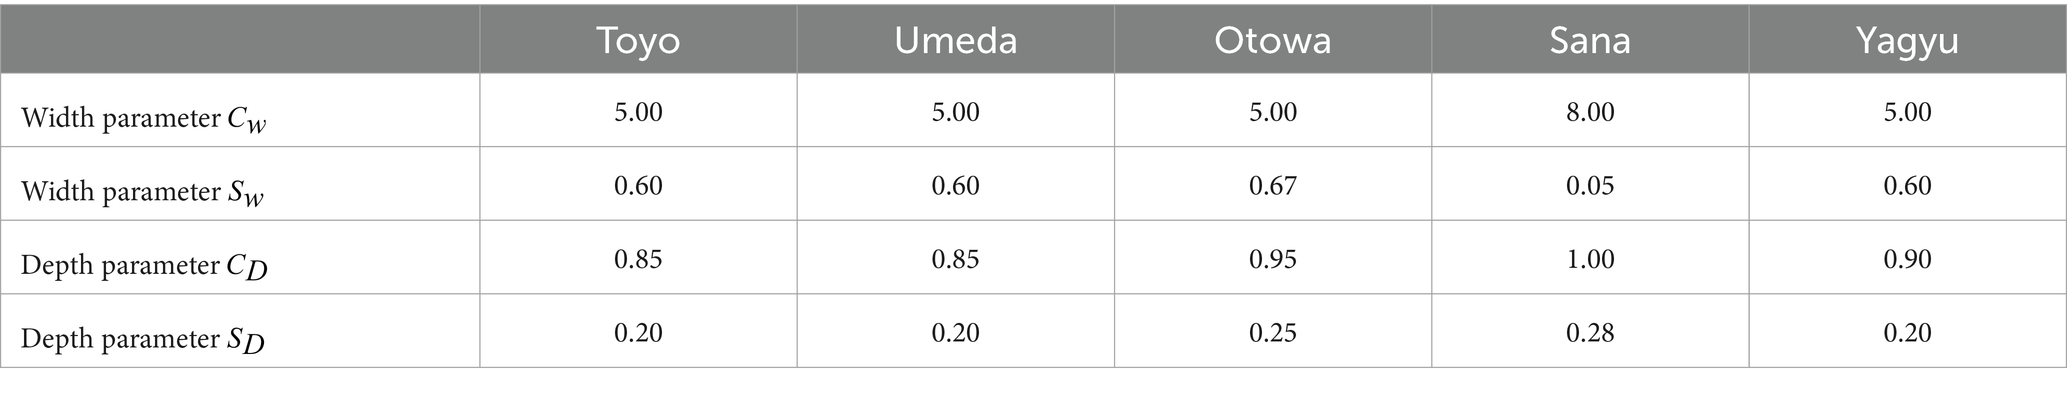
Table 2. River geometry parameters.
The topographical data utilized for RRI simulation were sourced from the J-Flw Dir dataset developed by Yamazki et al. (2018). Specifically, arc-1 s (30 m) topographic data were employed for the Umeda, Otowa, Sana, and Yagyu Rivers, whereas arc-3 s (90 m) topographic data were chosen for the Toyo River given its larger drainage area and increased computational complexity. Additionally, data related to the land use distribution, with a 100 m grid resolution, were obtained from the Ministry of Land, Infrastructure, Transport, and Tourism; these data are publicly available at https://nlftp.mlit.go.jp/ksj/index.html. The default land use was classified into 12 types. However, to facilitate calibration of the parameters, we consolidated them into five types during the calculation as follows: rice paddy, farmland, mountain, urban, and water area (Konja et al., 2019). The computational period was 4 days, with 3 days allocated for HTM analysis and an additional day for spin-up computation to establish the initial presence of water within the river channel. During the spin-up simulation, the precipitation recorded on the first day (October 10) was duplicated and assigned as the precipitation for October 9. A consistent 15-min time step in RRI was maintained throughout, as in HTM.
2.4 SuWAT
The SuWAT model employed in Toyoda et al. (2022) extends the two-way coupled SuWAT model (Kim et al., 2008), incorporating a river channel by considering the interactions between surges, waves, and tides. SuWAT combines two numerical models: a tide-surge model and nearshore wave model (Simulating WAves Nearshore). The tide-surge model is based on the tsunami numerical simulation system developed by Goto and Shibaki (1993). This model includes variations in water depth, utilizing both linear and nonlinear long-wave equations. Kim et al. (2008) further refined the nonlinear long-wave equation to incorporate tidal and radiation stress in the coastal region.
Given the hypothetical typhoon conditions assumed in the current study, our primary focus was the storm surge, and high tides were disregarded. The computational domain was structured with six nested subregions, featuring grid intervals ranging from 7,290 m (D01) to 30 m (D06: Mikawa Bay, Figure 3), with a downscaled resolution factor of 1/3. Bathymetry data were derived from terrain information provided by the Disaster Management Cabinet Office. D06 was explicitly configured to include a river channel, designating an upstream hydrograph that results from RRI as a boundary condition. The input river discharge was numerically converted to water levels based on the river’s cross-sectional profile in D06. This dynamic conversion accounted for the constantly variable river discharge. We integrated the hydrographs generated by the RRI model for each river into the SuWAT model. Specifically, the Toyo River has two upstream boundaries: the flood discharge channel and the main river channel. However, we assumed that the discharge channel was closed, and only the hydrograph generated by the RRI served as input for the main river channel. The wind and pressure fields were obtained from the HTM typhoon simulation results. As with the RRI model, the computational period extended from 0:00 UTC October 10 to 0:00 UTC October 13, 2019, with a one-day spin-up computation conducted before the main computation using input data from October 10.
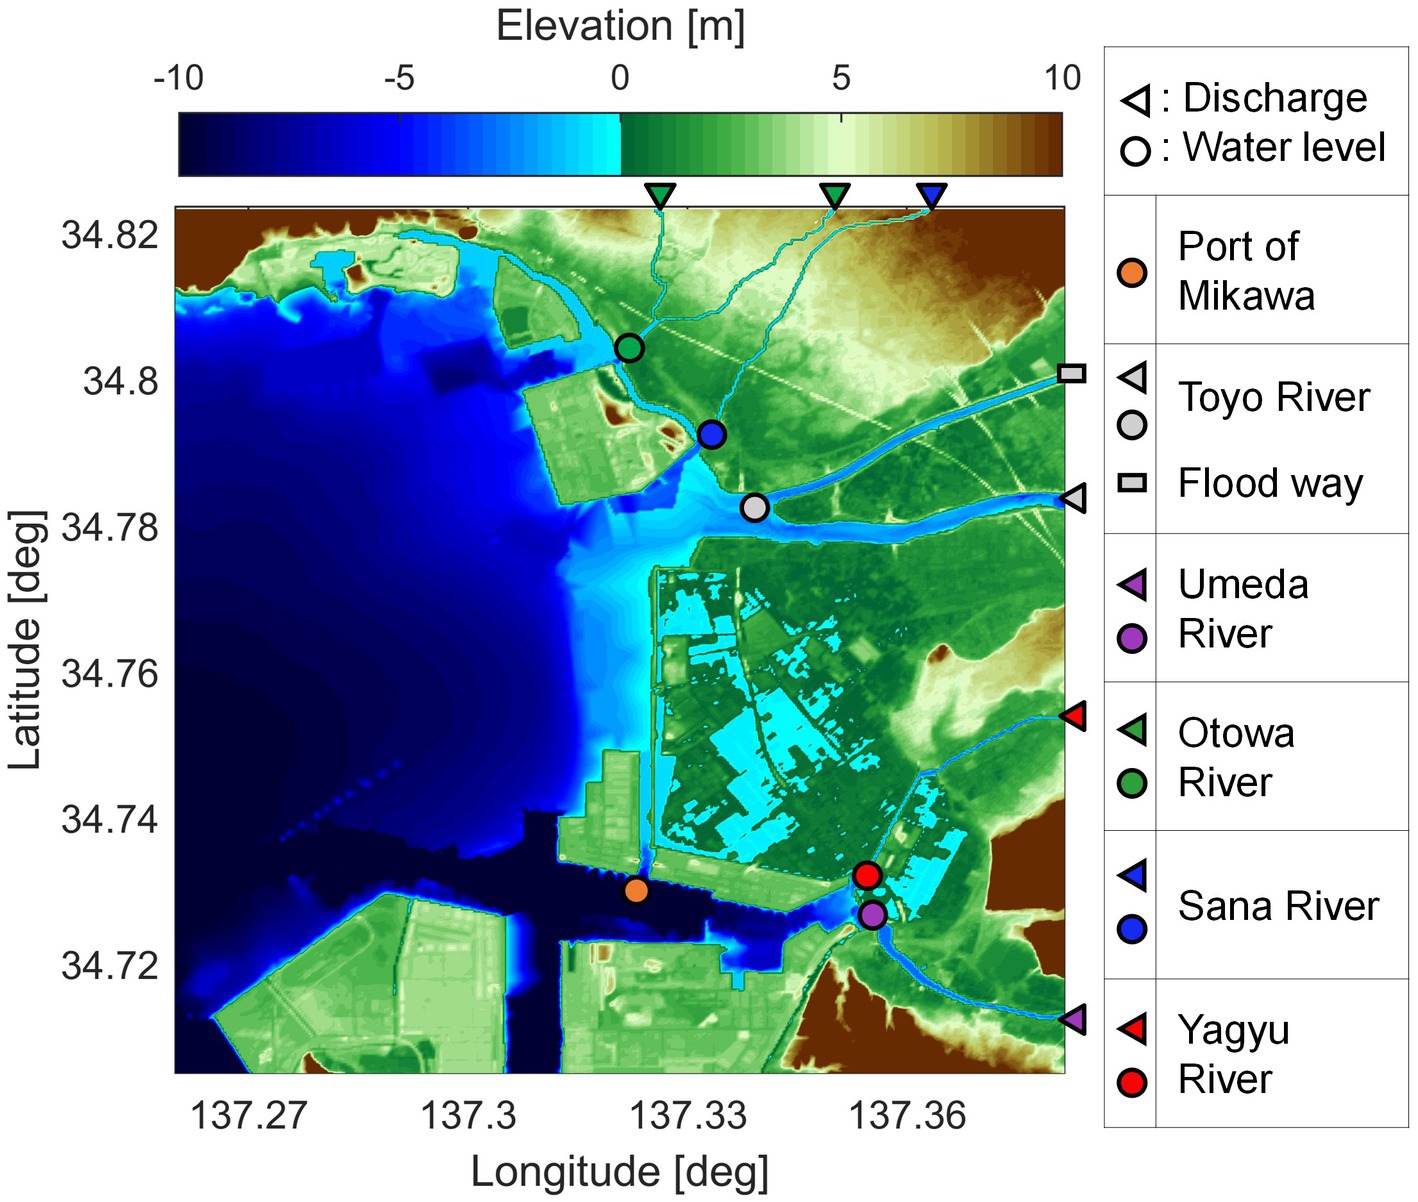
Figure 3. Computational domain of D6 in surge-wave-tide model integrating river inflow (SuWAT). The triangles show the boundary points for river discharge input, whereas the circles show the location of the river mouths, as well as the Port of Mikawa. Each color in the plot corresponds to a different river: gray, Toyo River; purple, Umeda River; green, Otowa River; blue, Sana River; and red, Yagyu River.
A schematic overview of the simulation is presented in Figure 4. The HTM gives rainfall distributions to RRI and wind and pressure fields to SuWAT, respectively. The RRI discharges water to five rivers in D06 of SuWAT. There is no feedback to RRI from SuWAT. The interaction interval steps among all models were 15 min. Based on this framework, the simultaneous occurrence of storm surges and flooding was assessed, relying on the water level changes at each designated location.
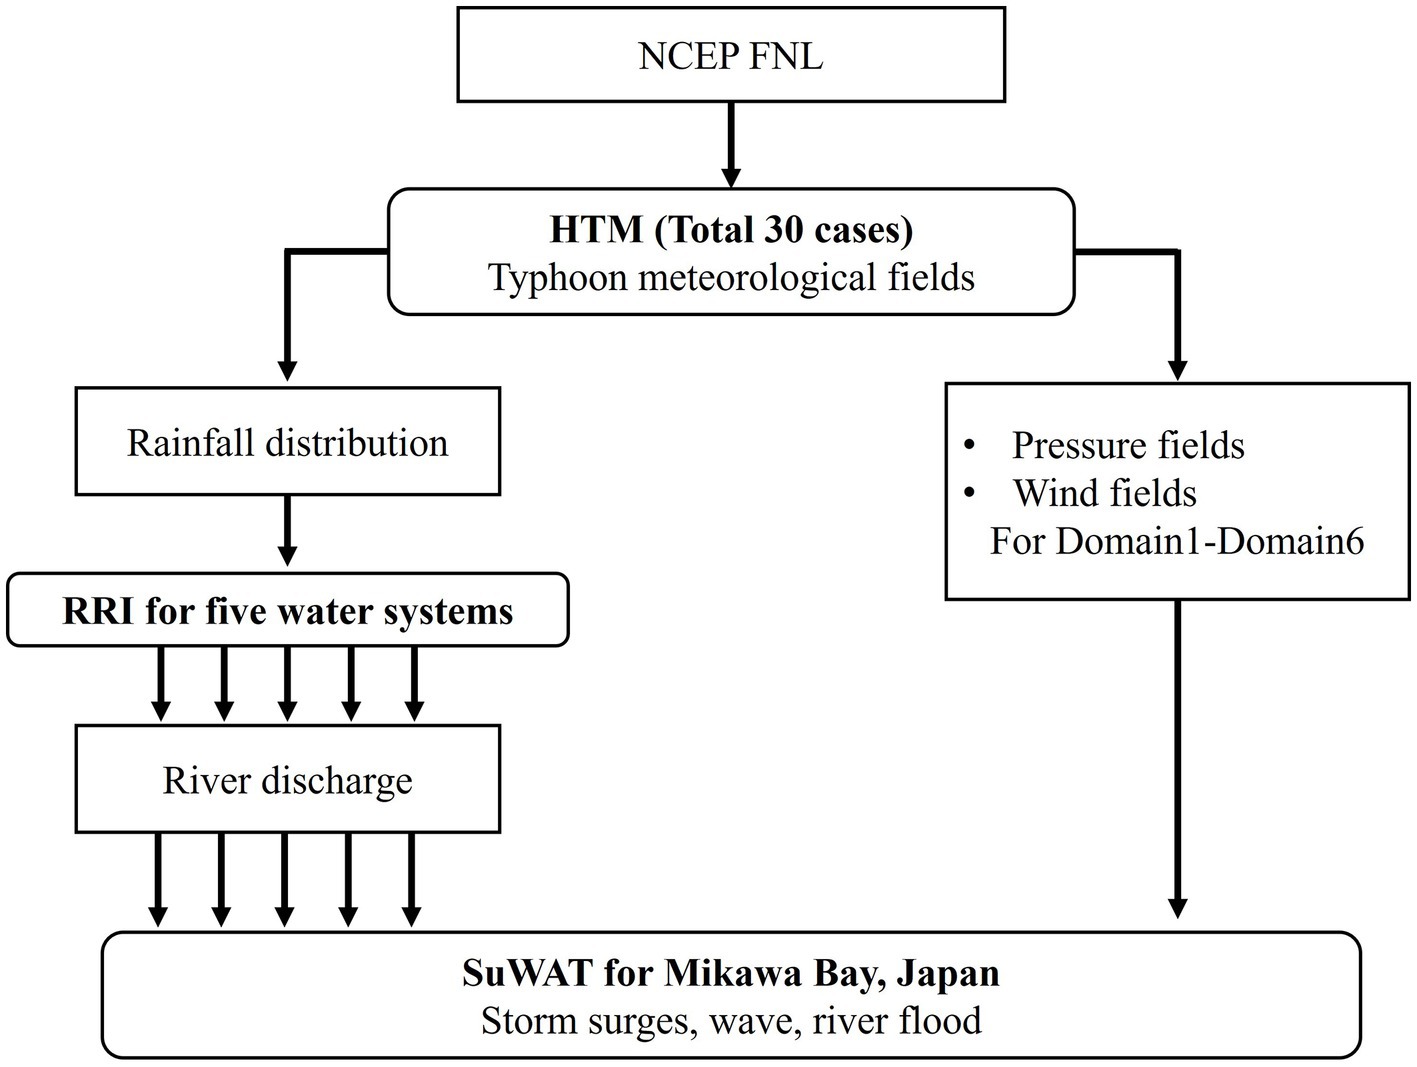
Figure 4. Analysis flowchart.
3 Results
3.1 Model reproducibility
We first considered the reproducibility of the HTM. Yoshino et al. (2021) validated the HTM model compared to the JMA best track. They reported the high accuracy of the HTM, with the typhoon track closely matching observed data from onset to extinction. The central pressure by the JMA best track peaked at 915 hPa and declined to 950 hPa immediately before landfall. The HTM can reproduce the weakening intensity as the typhoon moves northward. Supplementary Figure S1 presents a comparison between the 72-h total rainfall derived from radar-rain gauge analyzed precipitation by JMA (Supplementary Figure S1A) and those by the HTM (Supplementary Figure S1B); the results indicate that the HTM closely mirrored observed patterns. The HTM can replicate precipitation in the Kanto Plain, plus more than 500 mm in the Izu Peninsula, Kanto Mountains, and Ashio Mountains surrounding the Kanto Plain. The average error in total rainfall during the typhoon was 100 mm in coastal areas. Thus, the reproduction experiment demonstrated realistic typhoon movements, intensity variations, and rainfall amounts.
We next assessed the reliability of the numerical model. The track ensemble experiment, simulating a virtual typhoon, requires accuracy validation through comparison with real-world data, specifically past occurrences of actual typhoons. Previous investigations, such as that conducted by Haruyama et al. (2022) for Typhoon Trami (2018) in the Toyo, Umeda, and Yagyu Rivers, established the accuracy of the RRI model. For validation, specific points at Tougo on the Toyo River, Hamamichi on the Umeda River, and Hanada on the Yagyu River were considered (Figure 1). The RRI model projected a river flow peak of 2695.1 m3/s for the Toyo River, whereas the observed peak discharge reached 2969.9 m3/s (Supplementary Figure S2). The Nash-Sutcliffe model efficiency coefficient for the simulation period was 0.87, confirming the high accuracy of the model. For the Umeda and Yagyu Rivers, H-Q formulas were employed to convert discharges to water levels to estimate river flows based on observed water levels. These estimates were compared to the RRI model’s calculations. Specifically, the H-Q formula indicated river flow peaks of 102.6 m3/s for the Yagyu River and 231.4 m3/s for the Umeda River. In contrast, the RRI model produced values of 107.9 m3/s for the Yagyu River and 258.2 m3/s for the Umeda River, which closely matched the observed data. Furthermore, the time discrepancy between the observed peak and that estimated using the RRI model was within 15 min. Based on these findings, the RRI calculations were highly accurate and thus suitable for use in the present study.
Toyoda et al. (2022) assessed the SuWAT’s reproducibility, focusing on Typhoon Trami (2018). Supplementary Figure S3 shows a scatterplot comparing the observed and calculated water levels at the Port of Mikawa. The maximum storm surge calculated was 2.11 m, whereas the observed surge reached 1.97 m. Notably, the data points in the scatterplot align closely with a 1:1 ratio, effectively capturing the actual water level fluctuations. The water level simulated by SuWAT was validated with high accuracy, with a bias error of 0.07 m, root mean square error of 0.21 m, and correlation coefficient of 0.93. These findings demonstrate the model’s capability to simulate the progression of high river flow peaks. Based on these results, the SuWAT effectively represents water level variations in Mikawa Bay and its estuary during typhoon events.
3.2 River flood and storm surge risks
Figure 5 presents data on the maximum storm surge at the Port of Mikawa from SuWAT and river flow peaks for each river derived from the RRI model across all typhoon cases. The Toyo River exhibited the highest peak discharge, reaching 2.37 m (1,556 m3/s) in the worst-case scenario (TT-22). The high river flow peaked at 3.12 m (460 m3/s) in TT-26 for the Umeda River and 1.74 m (264 m3/s) in TT-24 for the Otowa River. Similarly, the Sana River experienced a peak of 3.11 m (308 m3/s) in TT-22, whereas the Yagyu River recorded 2.50 m (142 m3/s) in TT-26. Notably, these rivers’ high flows are strongly influenced by typhoon-induced rainfall, leading to considerable variability in high river flow peaks because of differences in the size of their representative river basins. Specifically, the difference in high river flow peaks between the Toyo and Yagyu Rivers was substantial, with the Toyo River experiencing an approximately 11-fold higher peak. Within the Toyo River, where the average high river flow was 1.42 m (937 m3/s), the high river flow peaks were more pronounced in TT-22 and TT-23, corresponding to scenarios during the typhoon approach Mikawa Bay. However, interestingly, some cases exhibited elevated high river flow peaks even when the typhoon followed a more distant trajectory, such as 2.19 m (1,439 m3/s) in TT-1 and 1.88 m (1,230 m3/s) in TT-14. This result suggests that high river flow incidents can transpire in the Toyo River even when typhoons do not hit Mikawa Bay, primarily because of the Toyo River’s wide drainage area, making it susceptible to rainfall over a broad area. In contrast, small-and medium-sized rivers exhibited a distinct pattern where the proximity of the typhoon to Mikawa Bay correlated with higher high river flow peaks. Thus, the lowest high river flow peak was observed in TT-1 in which the typhoon passed the furthest away from these rivers. Furthermore, there was a substantial discrepancy between the highest and lowest values, with an eight-fold variation in the Otowa River and a 23-fold difference in the Yagyu River. These findings demonstrate that small-and medium-sized rivers possess lower base runoff. In some instances, the high river flow was accelerated by early typhoon rainfall, causing it to reach the estuary before the typhoon’s closest approach.
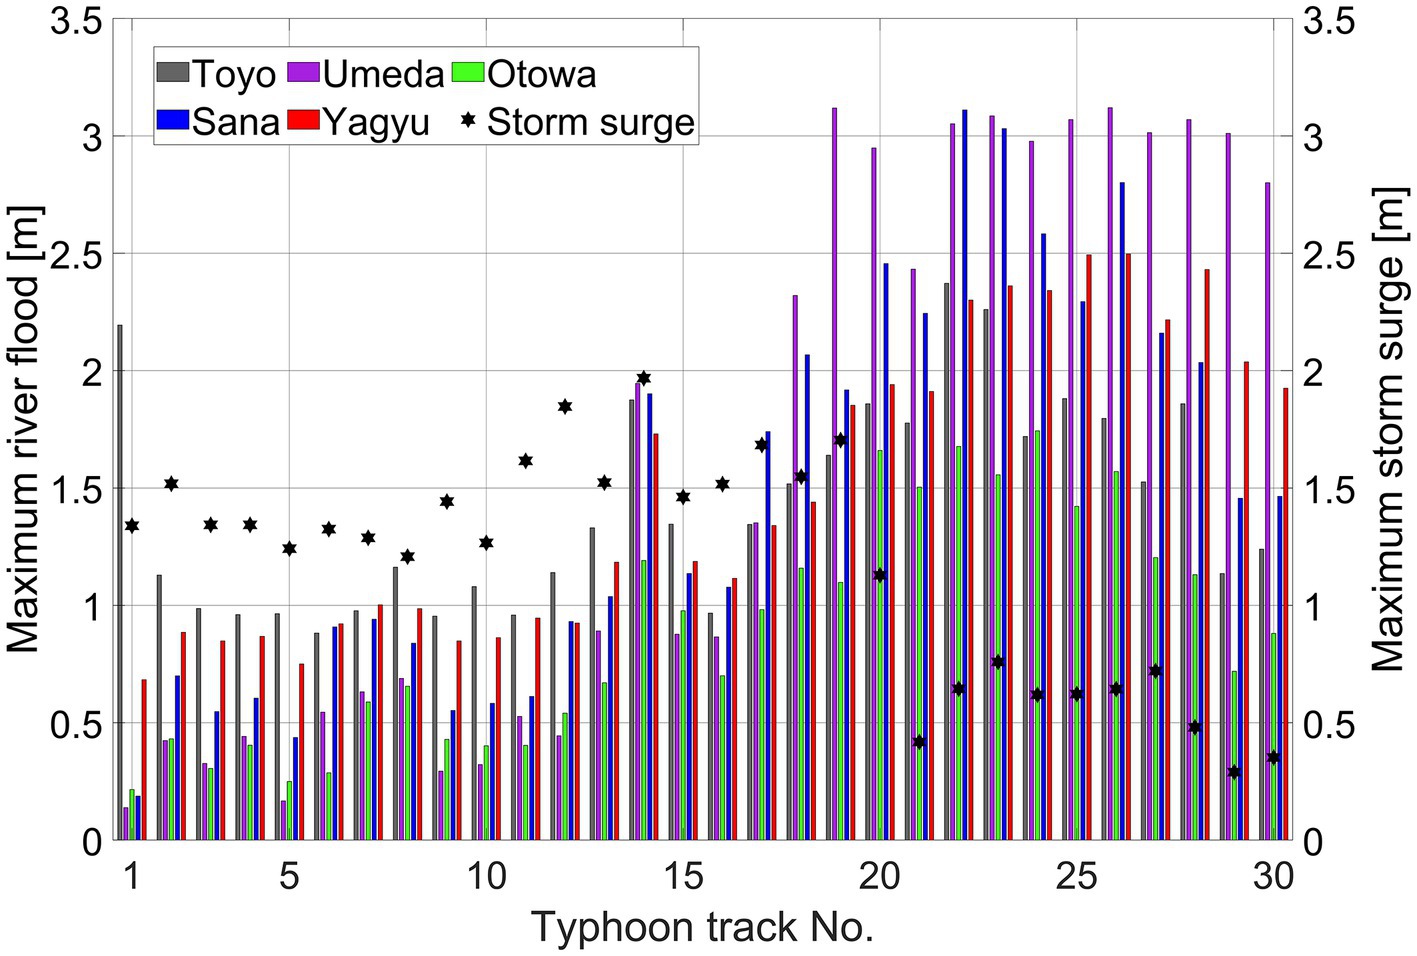
Figure 5. Maximum discharge of each river calculated by Rainfall-Runoff-Inundation (RRI) and maximum water level rise at the Port of Mikawa due to storm surge calculated using surge-wave-tide model integrating river inflow (SuWAT). The left axis shows the river discharge and corresponds to the bar graph. Gray, Toyo River; purple, Umeda River; green, Otowa River; blue, Sana River; and red, Yagyu River. The right axis corresponds to the water level rise; starred dots show the maximum value in each case.
Figure 5 depicts the maximum storm surges for each case under examination. Notably, previous studies showed that water levels at the Port of Mikawa are typically unaffected by runoff from specific rivers. This phenomenon can be attributed to the substantial distance between the Umeda and Yagyu Rivers river mouths and the Port of Mikawa. In this study, storm surges were assessed based on the water level data recorded at the Port of Mikawa. Among the scenarios evaluated, TT-14 showed the most severe storm surge at a level of 1.96 m. A distinctive feature of TT-14, and all cases analyzed, was the simultaneous occurrence of storm surges across all estuaries, coinciding precisely with the storm surge observed at the Port of Mikawa in TT-14. In this case, no localized variation in the storm surge was observed between the port and river mouth. Consequently, it can be inferred that storm surges propagated uniformly throughout the coastal area. The typhoon’s track in TT-14 took a northwesterly trajectory relative to Ise Bay (Figure 6A). Preceding the typhoon’s arrival, southerly winds shifted seawater from the Pacific Ocean toward Ise Bay, primarily due to the wind setup phenomenon. As the typhoon advanced and wind direction changed west, the water level correspondingly increased, facilitating the inflow of seawater into Mikawa Bay, as shown in Figure 6B. Note that TT-14 exhibited a mechanism similar to that reported in a previous study of Mikawa Bay (Aoki and Kato, 2010). Conversely, TT-21 did not experience storm surges. The typhoon’s track, in this instance, indicated that its center traversed Mikawa Bay, as depicted in Figure 6C. In TT-21, winds blowing into Mikawa Bay were relatively weak because of the direct hit of the typhoon center, which may prevent the development of a storm surge, as illustrated in Figure 6D. Across all cases, the maximum storm surge consistently diminished following TT-21. This trend can be attributed to the typhoon’s trajectory shifting from the western side of Mikawa Bay, observed in TT-1 to TT-20, to the eastern side after TT-21. When the typhoon’s track traverses west of Mikawa Bay, it is predicted that storm surges exceeding 1.0 m will occur because of the high winds experienced in Mikawa Bay.
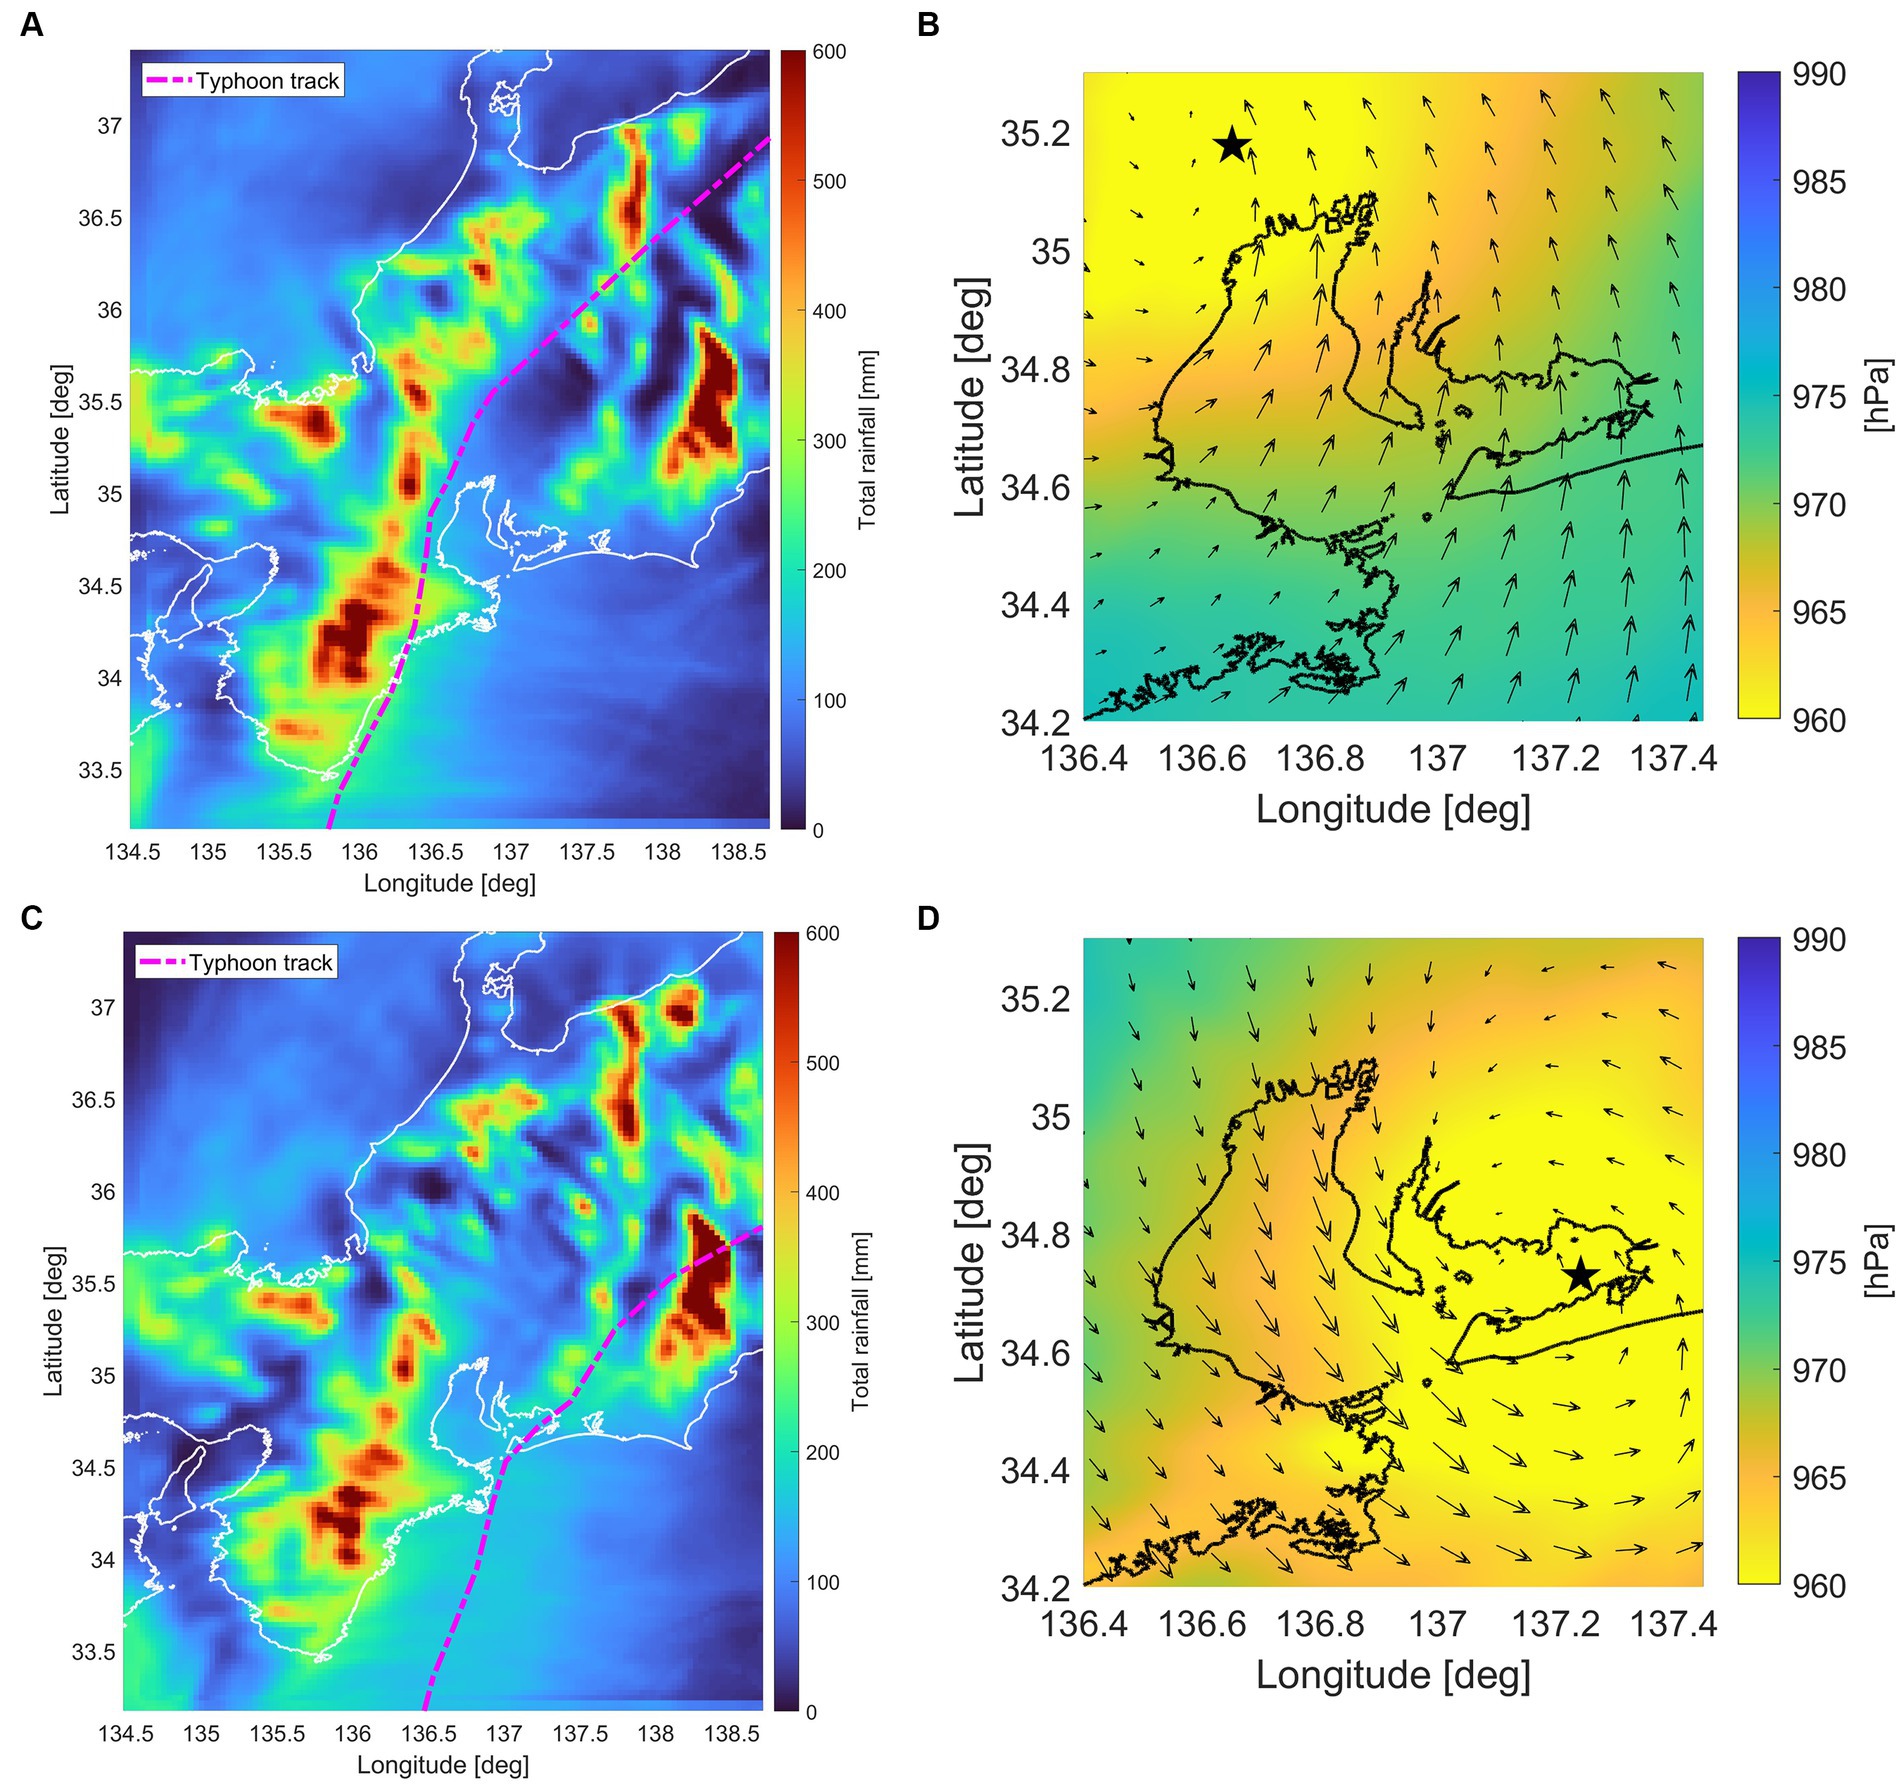
Figure 6. Typhoon tracks and 72-h total rainfall in cases (A) 14 and (C) 21 from the High-resolution Typhoon Model (HTM). Wind and pressure fields in Mikawa Bay at peak storm surge in cases (B) 14 and (D) 21 from HTM. The direction and size of the arrows indicate the wind and intensity, respectively. The pressure field is denoted by the color distribution, as per the color bar on the right, with the black star corresponding to the typhoon center.
3.3 Simultaneous occurrence assessment
We next analyzed cases in which storm surges and high river flow occurred concurrently. The time difference between the peak storm surge and peak high river flow reaching each river mouth was determined across all cases. The arrival time at the estuary was established by tracking the progression of high river flow peaks through observations of water level changes at various points spanning from the upstream boundary to the river mouth. The specific time corresponding to the peak storm surge at each river mouth was defined as the moment at which the maximum water level was observed at the river mouth within the timeframe encompassing the peak storm surge at the Port of Mikawa. Figure 3 shows the designated points at each river mouth. In subsequent sections, we discuss the time difference, ΔT, between the storm surge and high river flow peaks at each river mouth, focusing on the average time difference ( ) across the five rivers for each case. ΔT is assigned an absolute value to avoid negative values, as it represents the time difference between peak storm surge and peak high river flow. This approach ensures focus on the simultaneous occurrence of both events, regardless of whether ΔT is positive or negative, which depends on whether the peak high river flow precedes or follows the peak storm surge. Figure 7 shows the ΔT in each river, with pentagram plots indicating . Among the examined cases, TT-14 exhibited the shortest at 48 min. Among the 30 cases, this case featured the most significant storm surge and ranked among the top five in terms of high river flows in the Toyo, Umeda, Otowa, Sana, and Yagyu Rivers. These findings highlight the heightened risk of each peak occurring simultaneously in Mikawa Bay associated with TT-14. For the overall trend, remained within a 3-h window from TT-1 to TT-22. However, a large shift occurred in cases following TT-23, with abruptly exceeding 4 h between TT-23 and TT-28. This shift was more pronounced in the context of small-and medium-sized rivers. The arrival time of high river flow was somewhat contingent on rainfall; nevertheless, for small-and medium-sized rivers, high river flow typically materialized within 2–3 h following the commencement of rains in the Mikawa region. This trend is consistent with the observed data. In contrast, in the Toyo River, a high river flow of over 4 h was required to reach the estuary from the onset of rainfall. Consequently, when ΔT exceeds 3 h in small-and medium-sized rivers, the likelihood of simultaneous occurrence between storm surges and high river flow diminishes significantly. The typhoons featured in TT-23 and subsequent cases exhibited characteristics similar to those typically associated with small-and medium-sized rivers. However, no discernible correlation was established between ΔT, high river flow, and the typhoon track in the Toyo River.
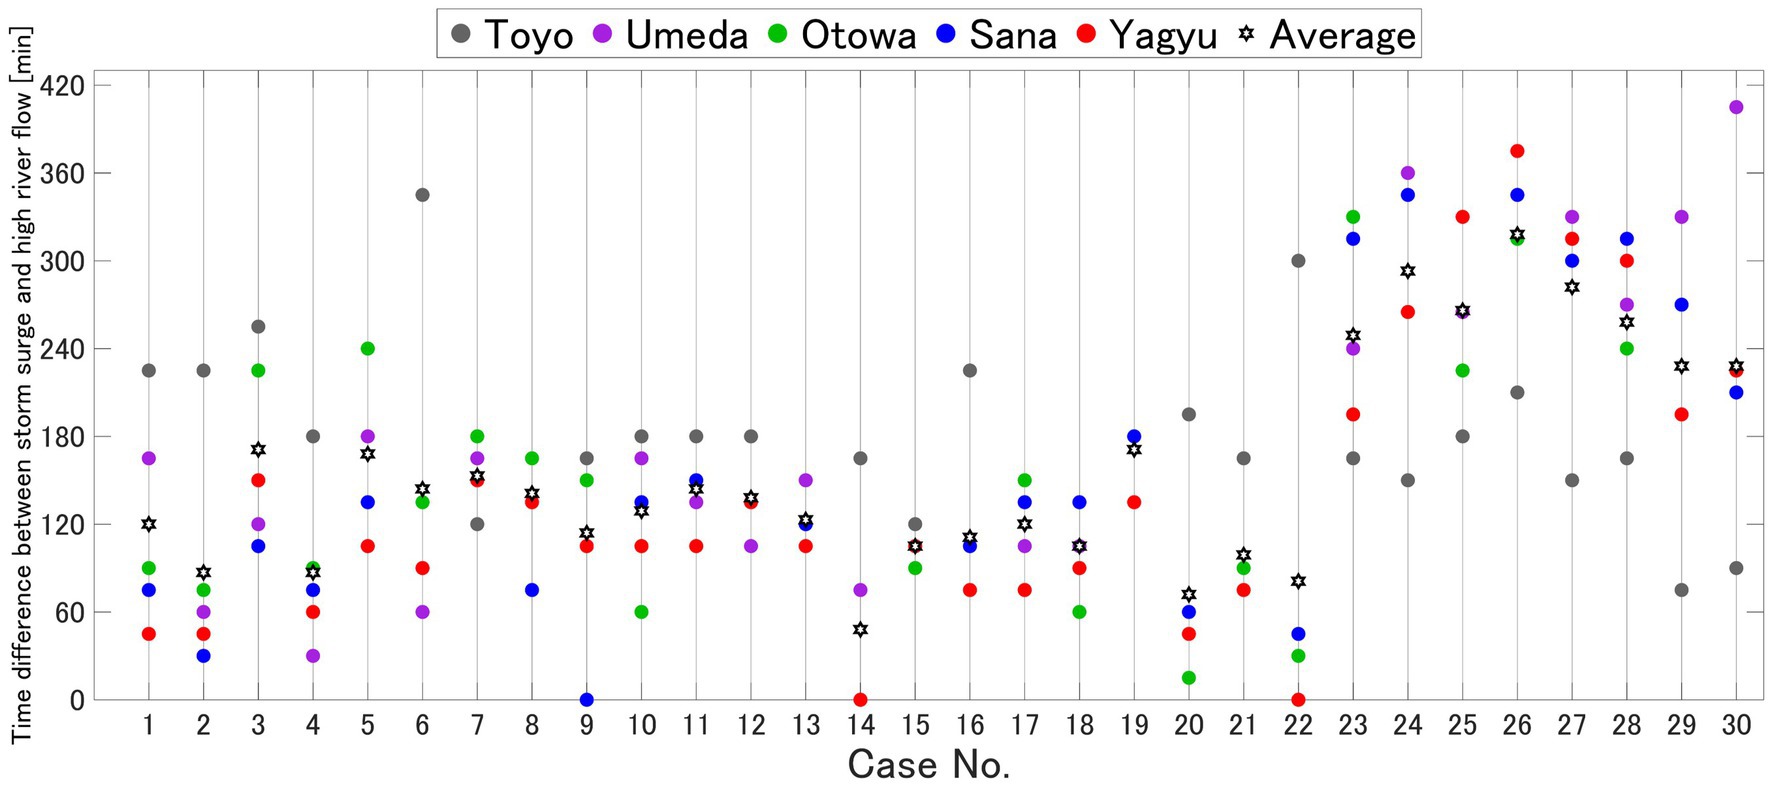
Figure 7. Time difference of each river. The plot colors indicate the respective rivers. In each case, (∆T) ̅ is shown by a pentagram in the plot.
Figure 8 shows the location of the typhoon when the maximum storm surge occurred. In TT-1 to 22, the storm surge reached its zenith when the typhoon traversed the northwestern expanse of Mikawa Bay. The radial direction of the first graph in Figure 9 represents the maximum storm surge in each typhoon track (1 in the case of maximum surge). At the same time, the direction in the second graph indicates the normalized total maximum river discharge of the five target rivers (5 for the maximum total). The last graph shows the radial direction and signifies ΔT. The color of the plot indicates the typhoon track number. The first graph indicates the azimuth angle of the Bay with the typhoon at the time of the maximum storm surge. When the typhoon’s track passed 300° of Mikawa Bay, the results indicated a distinct pattern with a more significant storm surge than other cases. In contrast, at 30–60°, the maximum storm surge consistently diminished. The second graph shows the total river discharge for five rivers. Here, the values indicate the total discharge ratio for each case to the maximum discharge for each river. The values of peak river flow are not related to the azimuth angle. The 225° case is TT-21, where the typhoon’s center passes through Mikawa Bay. The ΔT is short when the storm surge occurs at approximately 300°, and the likelihood of it occurring concurrently as the high river flow is significant, as shown in the third graph. Considering the typhoon’s location and associated wind patterns, the storm surge was primarily induced by northeasterly winds, similar to the scenario described for TT-14 in the previous section.
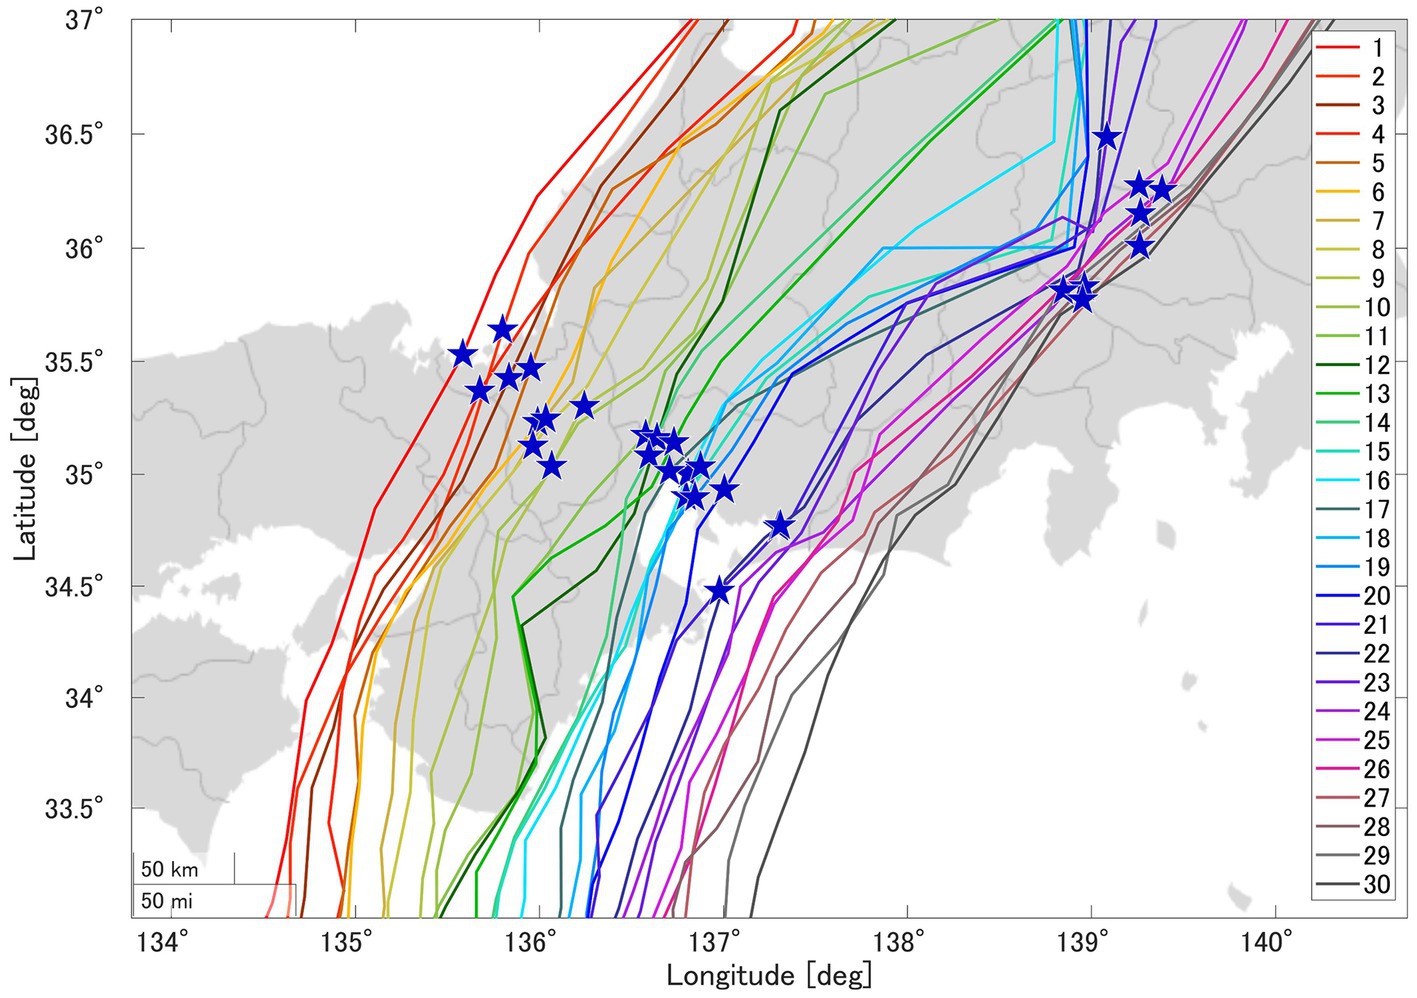
Figure 8. Location of each typhoon at largest storm surge. The typhoon positions are indicated by pentagrams.
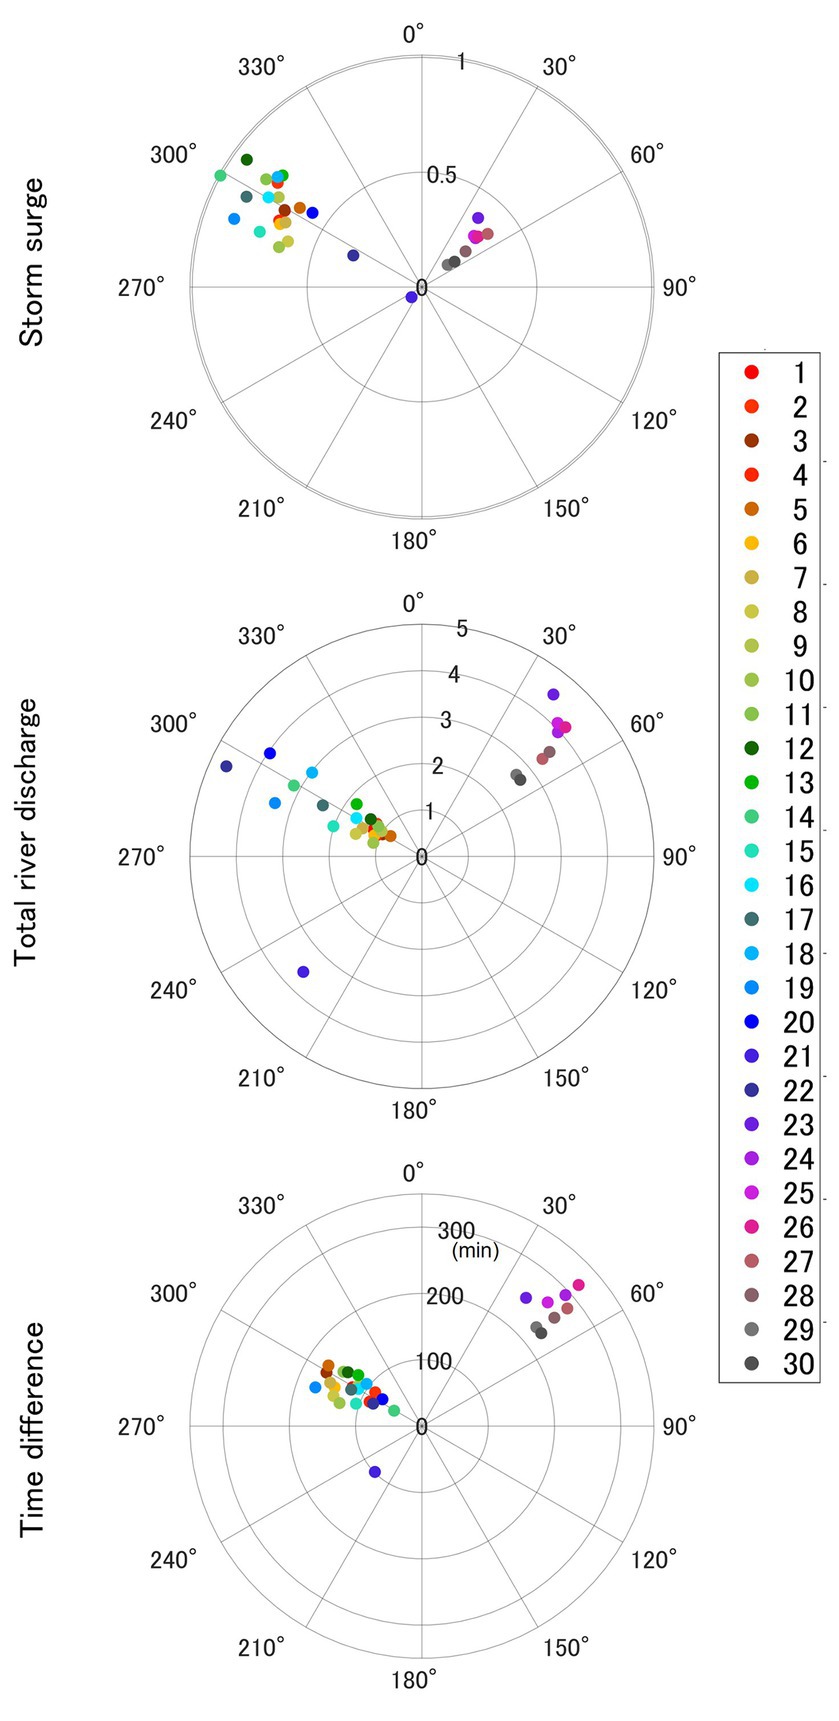
Figure 9. Azimuth angle with typhoons from Mikawa bay at the maximum storm surge. The length of the plots in the first graph denotes the storm surge according to surge-wave-tide model integrating river inflow (SuWAT), expressed as a ratio to the all-case maximum storm surge. The length of plots in the second graph indicates the total river discharge for five rivers calculated according to Rainfall-Runoff-Inundation (RRI). Here, the values indicate the total ratio of discharge in each case to the maximum discharge for each river. The length of the plots in the last graph represents the time difference between storm surge and high river flow. The plot color corresponds to the case number.
Mikawa Bay, because of its extensive southwesterly wind fetch, is inherently susceptible to storm surges. Our findings underscore that the storm surge, which tends to coincide with high river flow, materializes most significantly when the typhoon positions itself northwest of Mikawa Bay. Conversely, in the cases following TT-23, the storm surge peaked when the typhoon was approximately 200 km northeast of Mikawa Bay. During this phase, southeastern winds prevailed over Mikawa Bay, resulting in a minimal increase in water levels attributable to the wind setup effect, registering at only 0.1 m. Importantly, we exclusively focused on cases harboring the potential for situation compound occurrence of storm surge and high river flow, amounting to 22 cases.
3.4 Impact of the distance from the river to the typhoon on the simultaneous occurrence of storm surge and high river flow
Finally, we explored the relationship between cases characterized by concurrent storm surges and high river flows within a 3-h window, encompassing TT-1–22 and the respective ΔT values for each river. On average, ΔT values for the Toyo, Umeda, Otowa, Sana, and Yagyu Rivers were 188, 112, 114, 96, and 88 min, respectively. These results indicate that the Yagyu River tends to experience a more pronounced overlap of storm surge and high river flow than do the other rivers. In contrast, the Toyo River showed the longest average ΔT.
The relationship between the distance to the typhoon’s center and ΔT was analyzed for each river. Detailed typhoon information is presented in Table 3. The scatter plot in Figure 10 illustrates ΔT at the river mouth on the vertical axis and the distance to the typhoon center at the time of the closest approach on the horizontal axis. The size of each data point corresponds to the magnitude of the high river-flow peak in the estuary. The black line represents an approximate curve, with the area beyond the inflection point shown as a dotted line. Notably, ΔT exhibited considerable variability at the same distance, primarily attributable to variations in input meteorological fields and rainfall patterns among different cases. Figures 6A,C further illustrate the distinct rainfall distributions for each case. Precipitation increased in high-altitude mountainous areas, particularly in the Kii Mountain Range (see Figure 1 for location), for TT-14 and TT-21, with no significant difference based on the typhoon track. In contrast, the river discharge shown in Figure 5 was higher in TT-21 than that in TT-14 for small-and medium-sized rivers. RRI calculates river flow by using rainfall that has fallen in the entire basin as an input condition, with river flow reflecting the approximate amount of precipitation in that area. Therefore, although the precipitation distribution in the large area did not change, the precipitation situation changed depending on the scenario in the plains where the five target rivers exist. These differences in rainfall conditions strongly impact the temporal dynamics of high river flow at the river mouth, resulting in varying ΔT values.
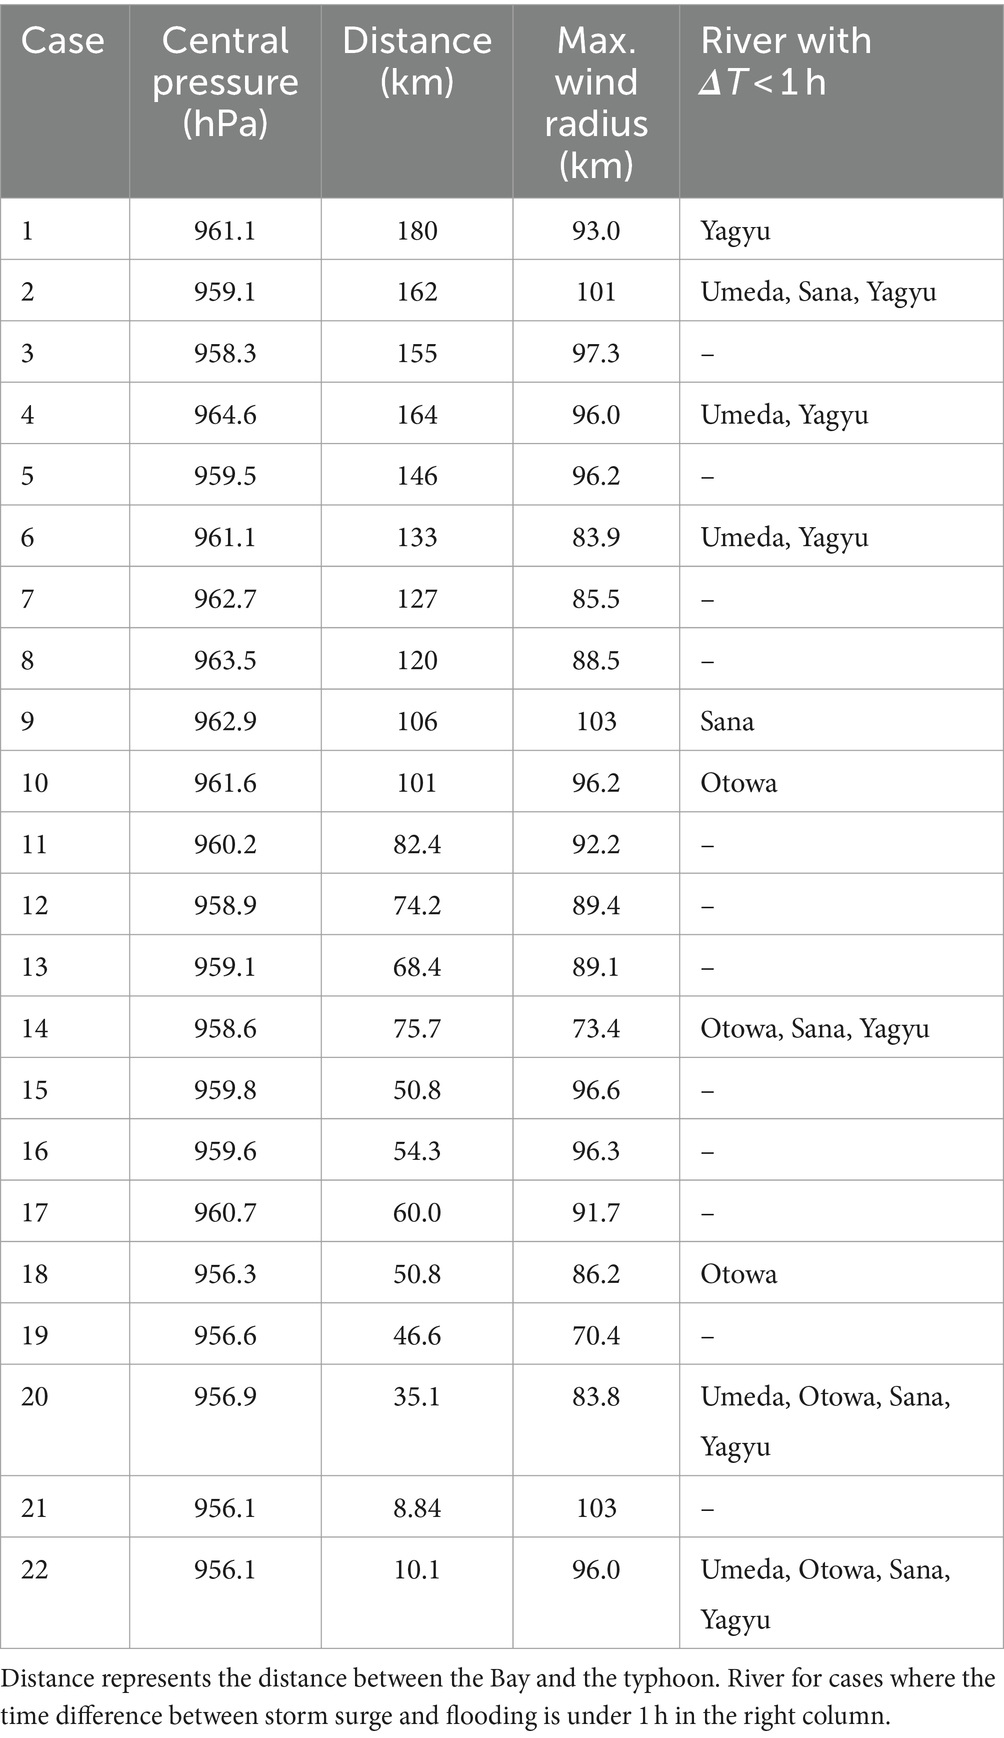
Table 3. Typhoons at the closest approach to Mikawa Bay in each case.
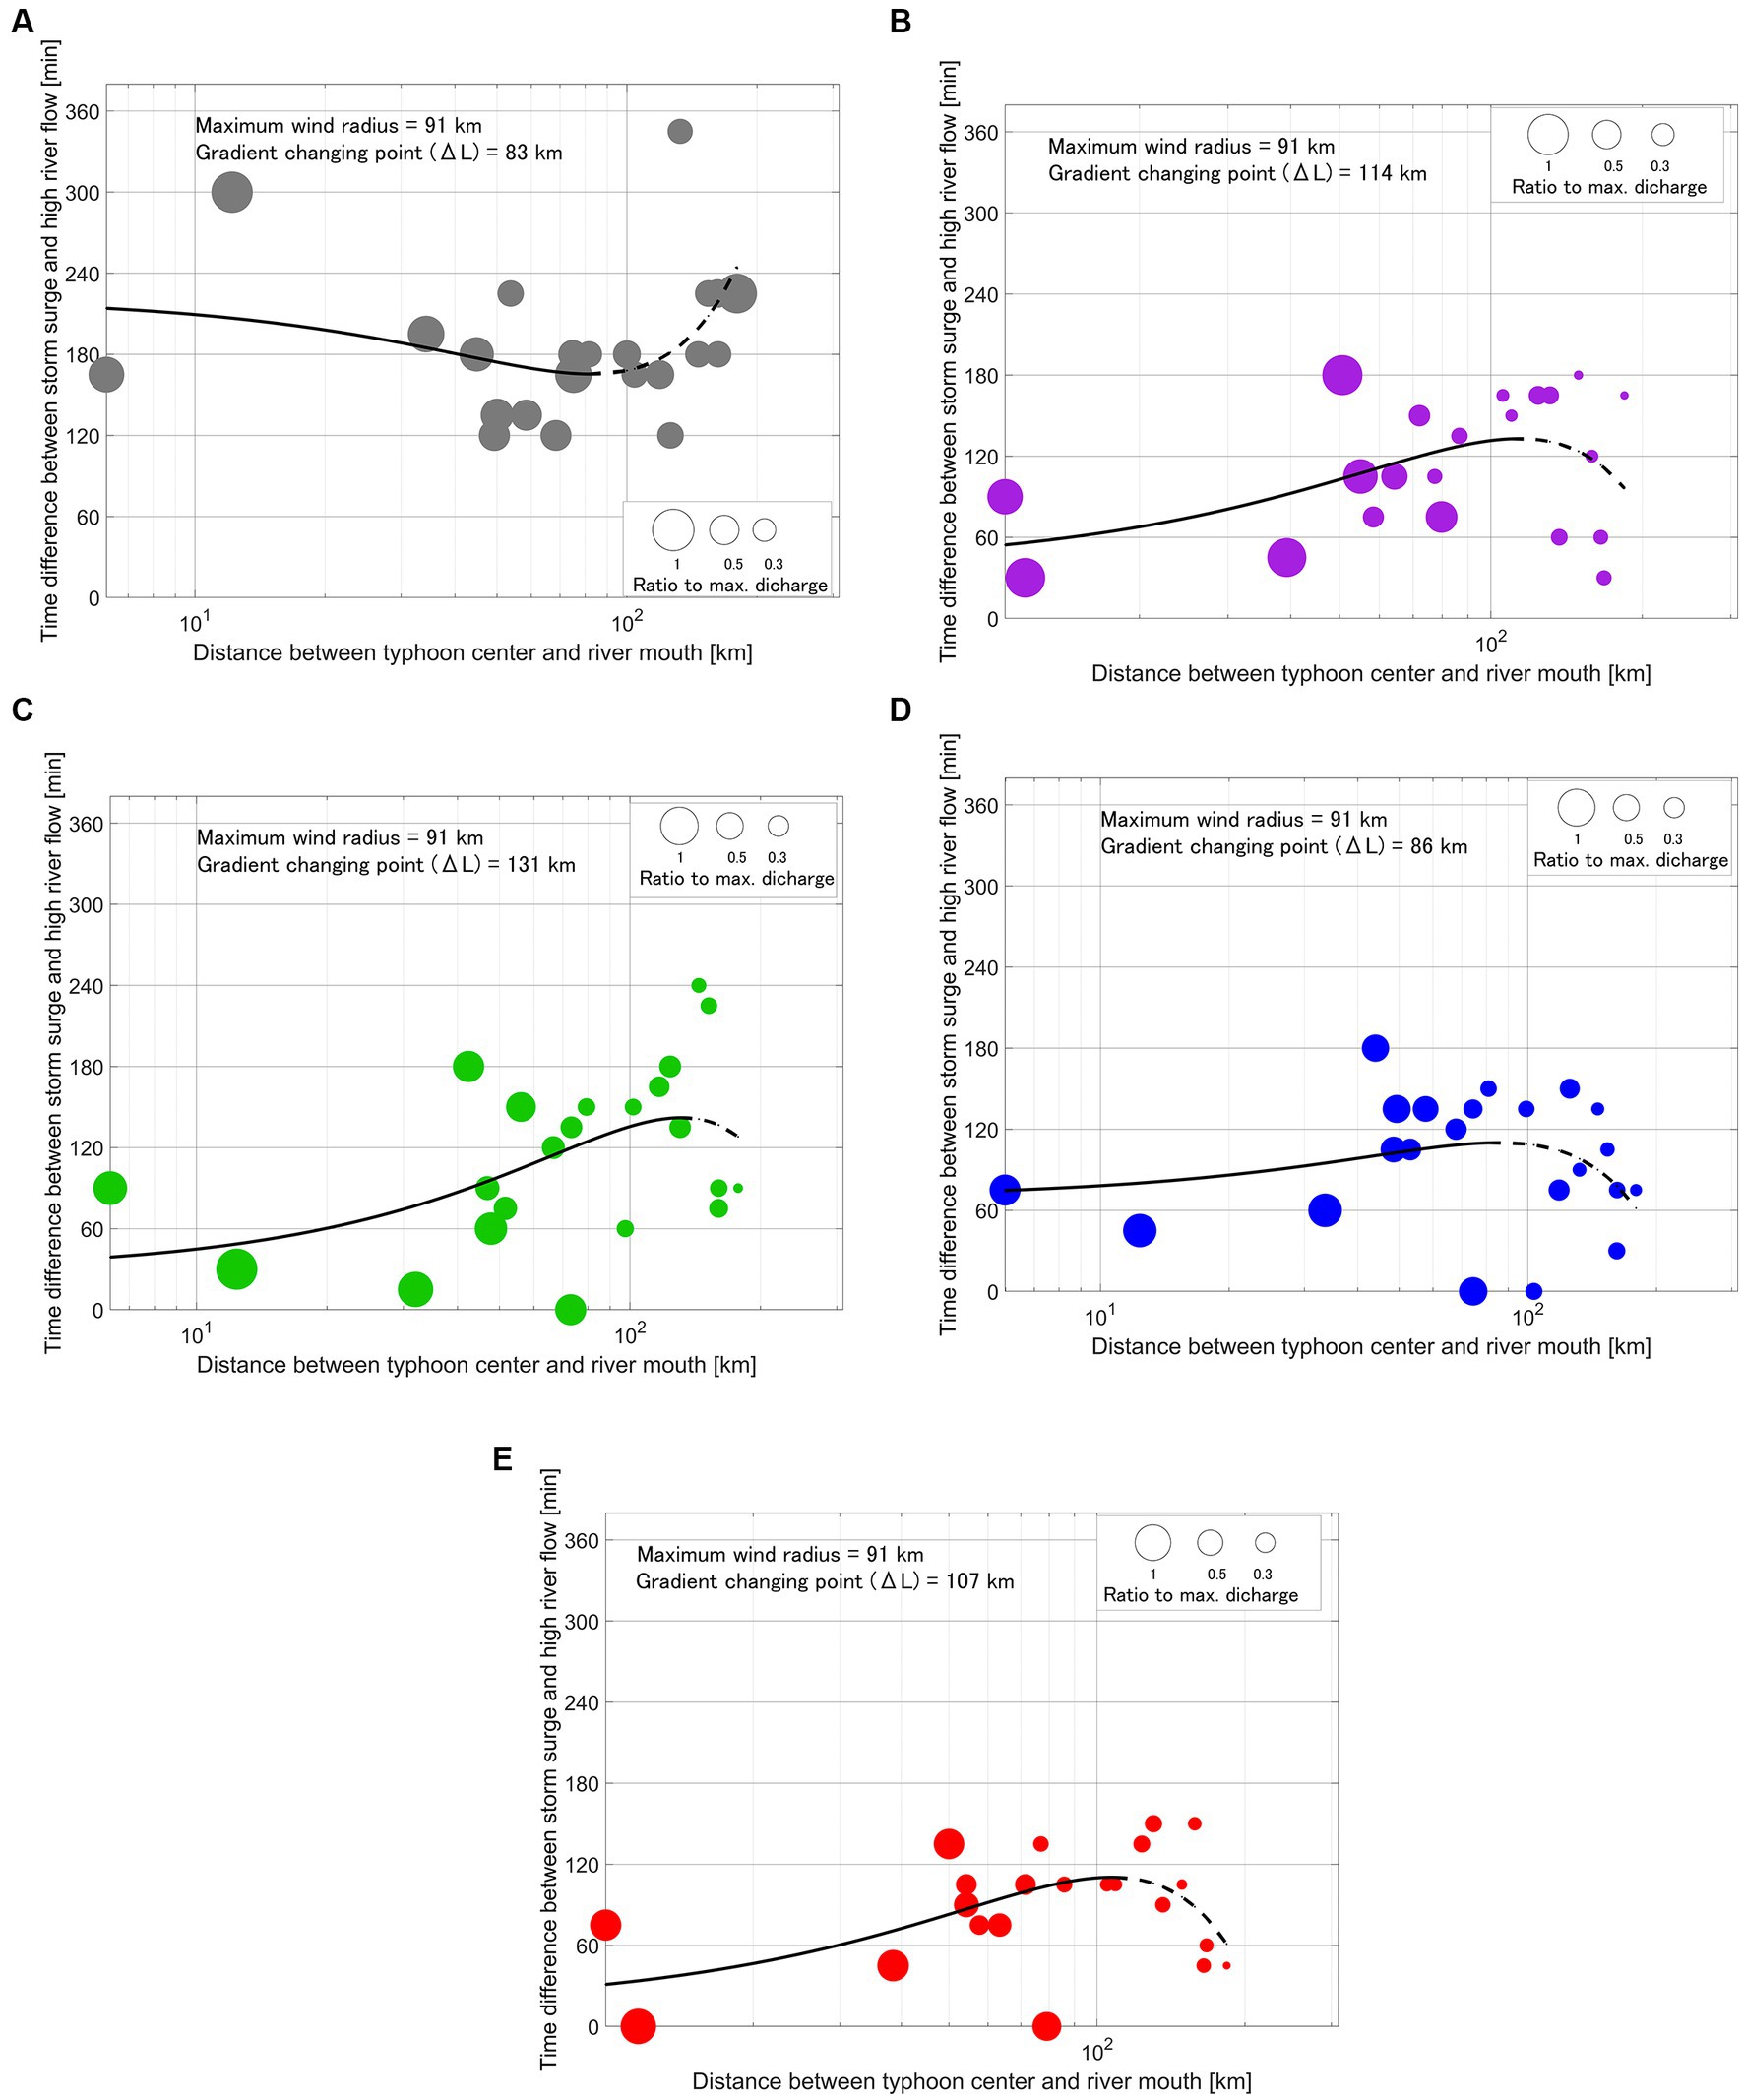
Figure 10. Scatter plots relating the time difference between storm surge and high river flow, with the distance to the typhoon center for the 22 cases passing the west side of the port: (A) Toyo River, (B) Umeda River, (C) Otowa River, (D) Sana River, and (E) Yagyu River. The size of the dots denotes the high river flow peak calculated using Rainfall-Runoff-Inundation (RRI), expressed as a ratio to the all-case maximum discharge. The black lines show the approximate curve, and the gradient changing point is the location at which the slope of the curve reverses (from positive to negative or vice versa).
For the Toyo River, the scatter plots did not reveal a discernible correlation between the distance from the river mouth to the typhoon and ΔT. Instead, the data points were dispersed within a band of 120–240 min, as depicted in Figure 10A. Furthermore, the magnitude of the high river flow peak exhibited minimal variation regardless of the typhoon’s proximity to the river. This observation suggests that geographical separation between the estuary and the typhoon center does not substantially influence the degree of overlap between storm surges and high river flow peaks in the Toyo River in the typhoon cases evaluated in this study. The simultaneous occurrence of each peak in the Toyo River may remain low, irrespective of the typhoon’s track or characteristics.
The Umeda, Otowa, Sana, and Yagyu Rivers showed a characteristic positive correlation between ΔT and the distance from the typhoon center to the river mouth, as shown in Figures 10B–E. When typhoons passed near Mikawa Bay, these small-and medium-sized rivers exhibited relatively short ΔT values along with high river flow peaks. In such scenarios, the concurrent manifestation of storm surges and substantial-high river flows becomes more probable, amplifying the associated hazards. In contrast, as the distance between the typhoon center and each river mouth point increased, the high river flow peak tended to decrease. ΔT exhibited a proportional increase with distances ranging from 0 to 120 km for the Umeda, Otowa, and Yagyu Rivers and from 0 to 80 km for the Sana River. Nonetheless, ΔT decreased or exhibited irregular distribution patterns at greater distances. Notably, across all small-and medium-sized rivers, the proximal line in the scatter plots showed a convex upward shape. This shape indicates that a discernible shift in the ΔT trend occurred as the distance to the typhoon center increased to a certain point. Specifically, the apex of this proximal line was at 114, 131, 86, and 107 km for the Umeda, Otowa, Sana, and Yagyu Rivers, respectively. These distances are expressed as ΔL in subsequent sections.
The approximate curves exhibited distinct characteristics between small-and medium-sized rivers and the Toyo River. The five target rivers, referring to the watercourse in Figure 1, are in the same area and flow from east to west. Particularly, the approximate curve tended to be convex upwards for rivers smaller than approximately 100 km2 from the perspective of the catchment area. Figure 11 shows the location of the typhoon at the maximum storm surge in Figure 8 compared to the 300° azimuth. The typhoon path followed an arc about Mikawa Bay. For typhoons that pass far from the Bay, differences in the typhoon position at the peak of the storm surge occur, even in cases where the typhoon tracks are adjacent. This is because of slight changes in the initial conditions, which alter the meteorological field, resulting in a shift in the peak times of storm surge and river discharge. The dispersion of typhoon positions at the peak of the storm surge increased with increasing distances from the Bay, contributing to the scatter plot’s increased dispersion. Furthermore, it is thought that ΔL at the inflection point depends on the maximum wind speed radius of the typhoon. The maximum wind speed radius (RMW) of Typhoon Hagibis (2019) was approximately 90 km (Table 3), and the distance to reach the inflection point was slightly larger than that of the RMW, as shown in Table 3. When the maximum wind speed radius and ΔL match, the wind speed increases in Mikawa Bay, and the development and peak of the storm surge will be noticeable. When ΔL is larger than RMW, the wind speed is weaker, the storm surge peak becomes blurred, and the timing of the storm surge peak varies widely around 300°, which is considered to cause variation in ΔT. Utilizing the proximal line allows for the estimation of ΔT from the distance to the typhoon’s center. The approximate line approaches zero ΔT past the peak; however, the river discharge at the same time is extremely low.
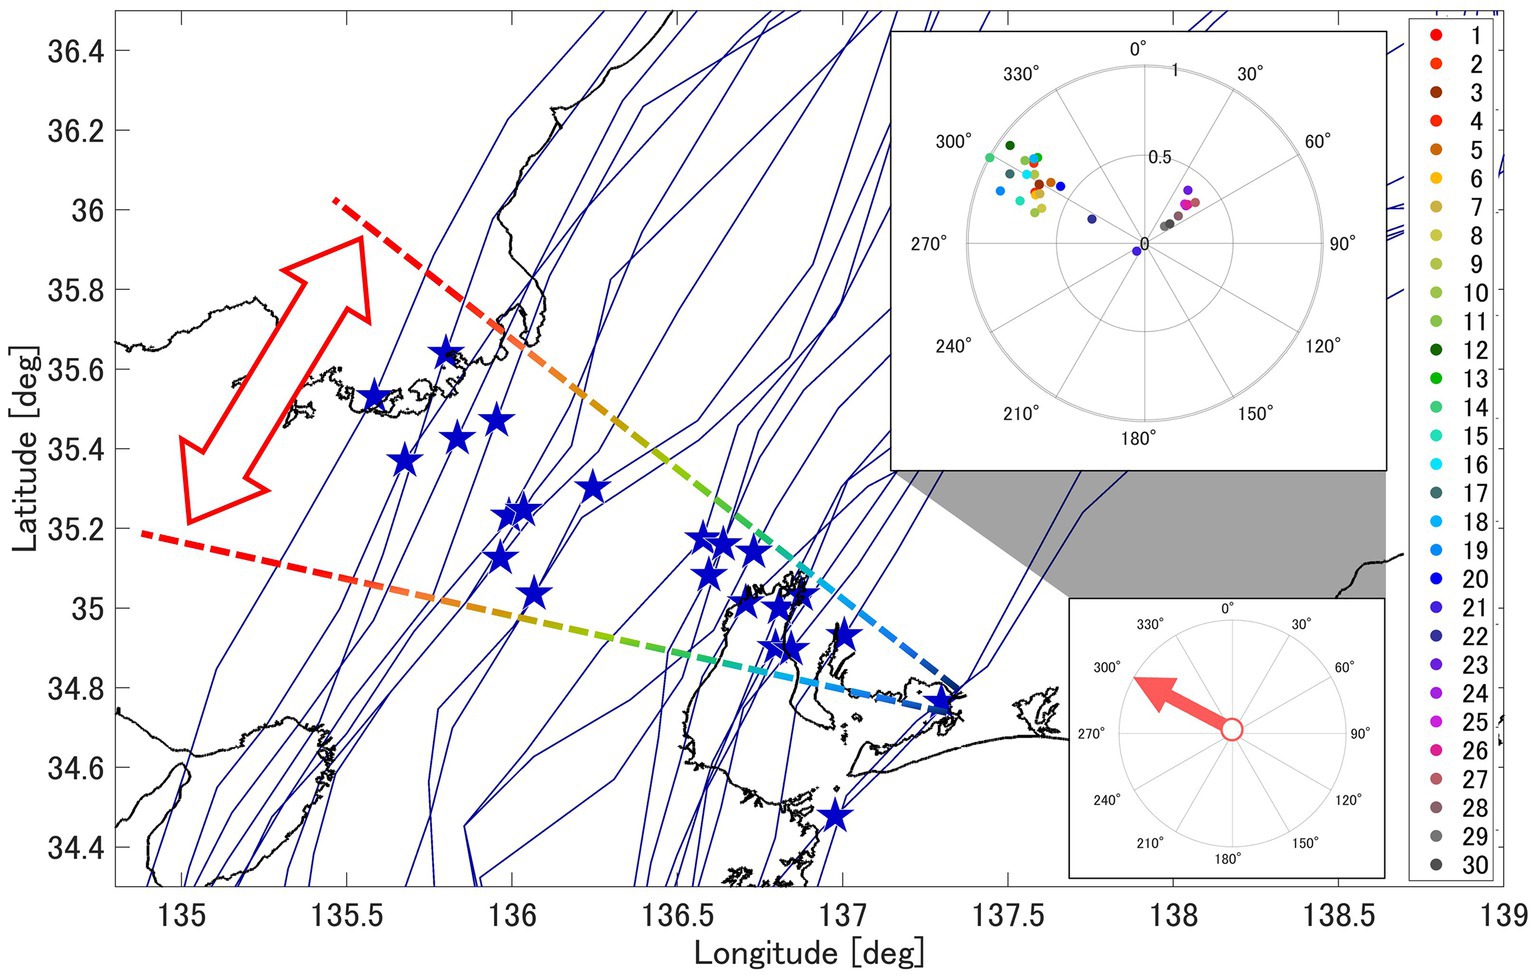
Figure 11. Location of each typhoon compared between case 1 to case 22 at the time of maximum storm surge in Figure 8 and 300° azimuth angle. The figure on the upper right is Figure 9 (top).
4 Discussion
Cases in which both storm surges and high river flow reached their peaks simultaneously in each river were systematically compiled to assess rivers showing simultaneous occurrence of a storm surge and high river flow. As shown in Table 3, storm surges and high river flow peaks in a river occurred within 1 h. Remarkably, the Yagyu River exhibited the highest count of such cases, followed by the Sana, Otowa, and Umeda Rivers. This order closely aligns with the average ΔT and with the scale of the drainage area. Thus, as the river’s scale diminishes, the associated risk of simultaneous storm surge and high river flow may increase. Therefore, the urban area in the estuary of the Yagyu River is expected to incur more severe damage in the event of a compound occurrence of storm surge and high river flow.
These results indicate that for small-and medium-sized rivers, typhoons passing near Mikawa Bay have a higher risk of concurrent manifestation of storm surges and substantially high river flows. For typhoons passing within an average of 110 km from Mikawa Bay, ΔT and the distance from the Bay to the typhoon have a proportional relationship. The storm surge reaches a maximum when the typhoon passes the area of azimuth 300° (northwest direction) from Mikawa Bay and river discharge is large. In these cases, each peak is likely to occur simultaneously because all conditions of a large storm surge, high river discharge, and small ΔT are satisfied. In contrast, for the Toyo River (large river), the high river flow peak and ΔT are not affected by the typhoon track.
The results of this study are summarized in Figure 12A. The shape of the plot indicates the river, and the color of the plot indicates the maximum water level at the mouth of each river. Notably, the plots of small-and medium-sized rivers are concentrated in a 50–60 km distance from typhoon to the estuary and ΔT of 1 to 2 h. The plot color indicates the maximum water level at the river mouth. As shown in Table 3 and Figure 12B, the maximum wind speed radius (6 h average) was 70–105 km when the distance from the typhoon was 50–60 km. Within this range, high winds developed, leading to the high storm surge because Mikawa Bay entered the inner radius of the strong wind area. In the range of 0–20 km, the maximum storm surge is small although the time difference of each peak was short. This characteristic is observed when typhoons pass near Mikawa Bay. Even if the distance to the typhoon is within the maximum wind speed radius, cases with a distance of 0–20 km have small storm surges because winds are weak near the typhoon’s center. Thus, the water level does not greatly increase. For a typhoon with characteristics such as those of Typhoon Hagibis traversing the western side of the estuary at a distance of 50–60 km, both storm surge and river discharge tend to be large, and water levels are high in east-to-west flowing rivers. ΔT of the storm surge and high river flow was 1–2 h for small-and medium-sized rivers within 100 km2 of the basin.
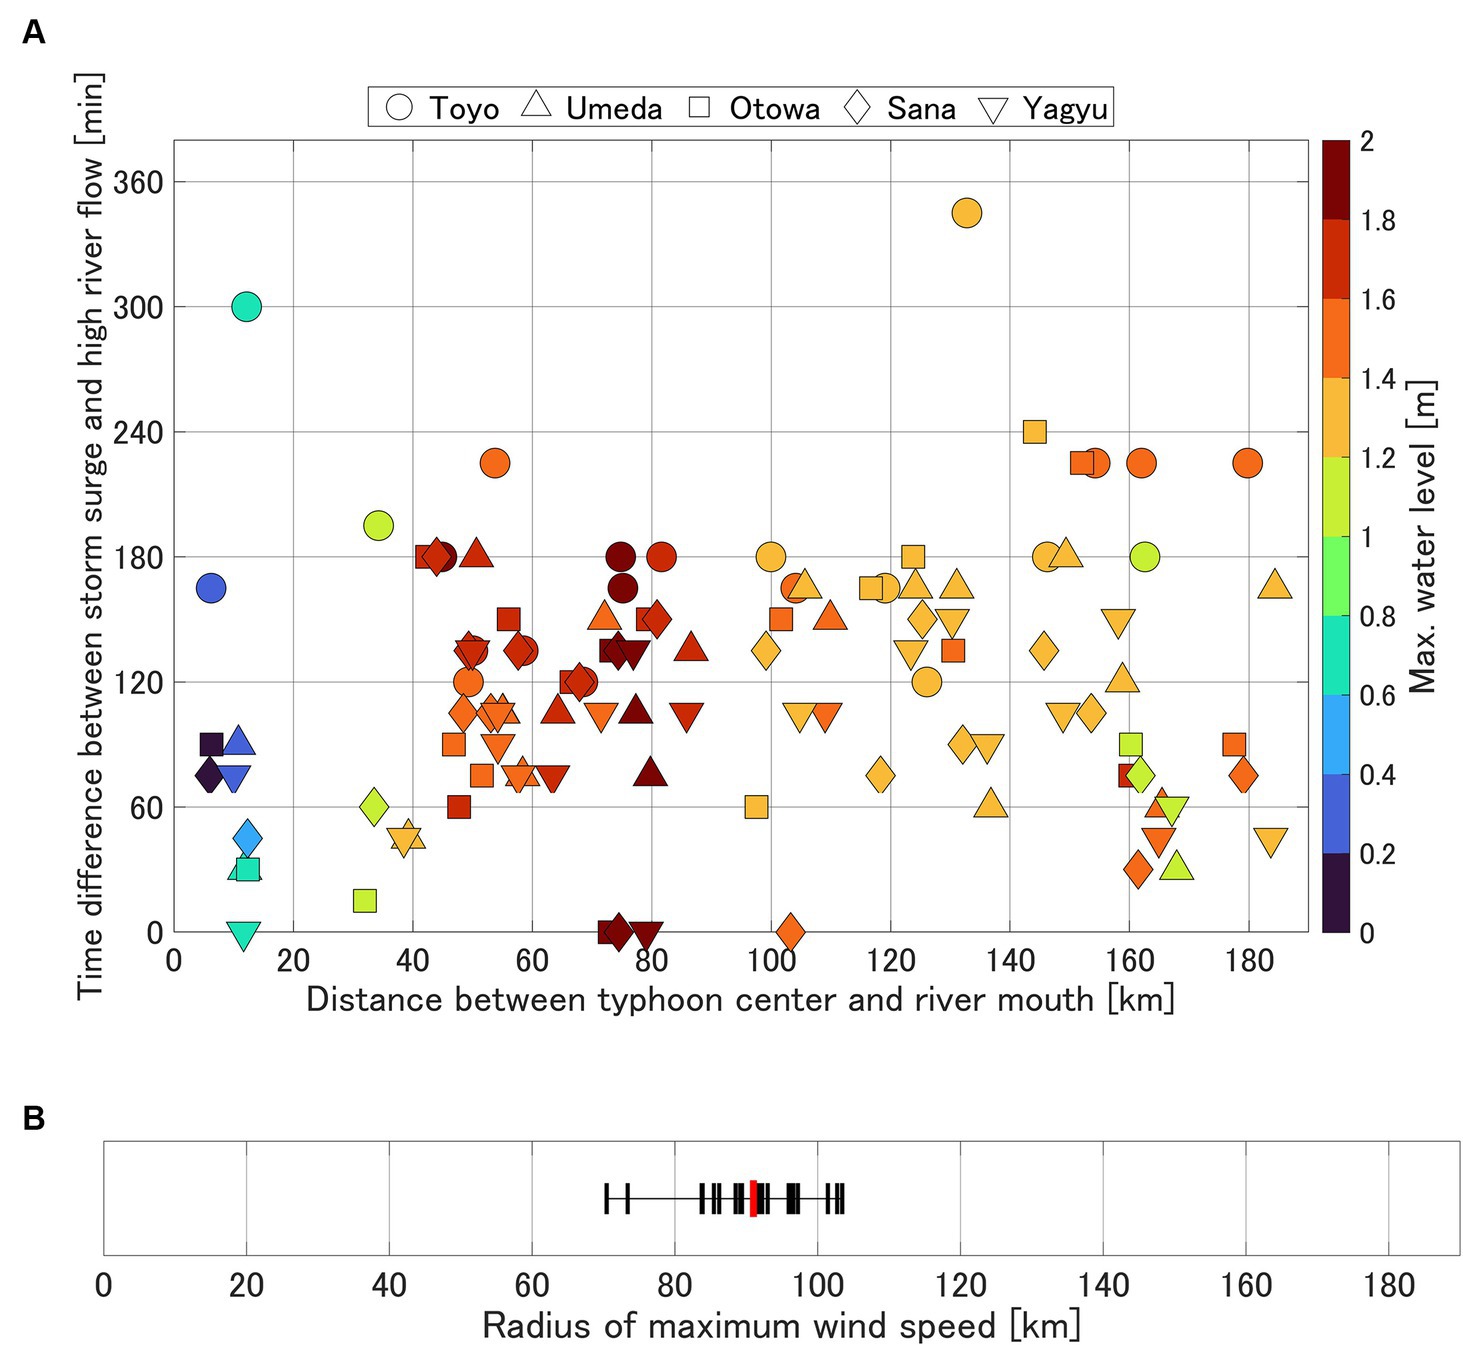
Figure 12. (A) Scatter plots relating the time difference between storm surge and high river flow, with the distance to the typhoon center. Circles, triangles, squares, diamonds, and inverted triangles are Toyo Umeda, Otowa, Sana, and Yagyu Rivers, respectively. The color of the dots denotes the maximum water level at the estuary according to SuWAT, as per the color bar on the right. (B) Distribution of the radius of maximum wind speed at the closest approach of typhoon from the High-resolution Typhoon Model (HTM). The red plot shows the average radius.
We focused on the simultaneous occurrence of storm surges and river floods during typhoon events. Compound hazards are expected to be exacerbated with the progression of global warming, necessitating countermeasures based on technologies from various fields such as meteorology, coastal engineering, hydrology, and river engineering (Sarker, 2022). The compound hazard posed by storm surges and river floods may greatly alter the environments of coastal and brackish water areas. Therefore, addressing these issues is crucial for disaster prevention as well as from an environmental protection perspective. We investigated the correlation between typhoon tracks and the concurrent incidence of storm surges and river floods using a dynamic model. Our findings provide insights for future coastal and river disaster prevention efforts as well as environmental conservation endeavors.
5 Conclusion
We performed a typhoon track ensemble experiment to assess the temporal risk of compound flooding arising from the interaction between storm surges and high river flow for five rivers that discharge into Mikawa Bay. Our results were as follows:
1. The storm surge induced by each typhoon and the extent of high river flow in each of the five rivers considered were evaluated. TT-14 exhibited the most substantial storm surge, measuring 1.96 m. In this instance, the typhoon followed a northward trajectory, passing over the western part of Ise Bay. It inclined toward more pronounced high river flows in small-and medium-sized rivers when the typhoon’s track brought it closer to Mikawa Bay.
2. Storm surges and high river flows tended to converge when typhoons traversed the western region of Mikawa Bay. Northeasterly winds predominantly induced this overlapping phenomenon. Typhoon carrying the shortest average time difference was 48 min in TT-14.
3. The relationship between the time difference (ΔT) observed in each river and concurrence of storm surges and high river flows (TT-1–22) was examined. Interestingly, in the Toyo River, peak overlap was not strongly influenced by typhoon tracks. Furthermore, ΔT increased with the distance from the typhoon for small-and medium-sized rivers.
Typhoon Hagibis (2019) served as the external factor for examining the interplay between storm surges, the timing of high river flow reaching the estuary, and the typhoon’s trajectory. However, further studies are needed to determine the influence of typhoon tracks on the risk of compound flooding, noting that rainfall and wind characteristics can vary widely among typhoons. These calculations should be extended to encompass different typhoon events to enhance the robustness of assessing compound flooding risk.
Data availability statement
The original contributions presented in the study are included in the article/Supplementary material, further inquiries can be directed to the corresponding author.
Author contributions
KH: Data curation, Investigation, Formal analysis, Writing – original draft, Writing – review & editing. MT: Data curation, Investigation, Methodology, Formal analysis, Writing – original draft, Writing – review & editing. SK: Resources, Supervision, Writing – original draft, Writing – review & editing. NM: Supervision, Writing – original draft, Writing – review & editing. SK: Methodology, Software, Writing – original draft, Writing – review & editing. JY: Methodology, Software, Writing – original draft, Writing – review & editing.
Funding
The author(s) declare that financial support was received for the research, authorship, and/or publication of this article. This research was supported by JSPS KAKENHI Grant (Nos. 23K13411, 23H00196, 24K00987). This work was conducted by Theme 4 of the Advanced Studies of Climate Change Projection (SENTAN Program) (Grant No. JPMXD0722678534). This work was supported by the Ministry of Education, Culture, Sports, Science and Technology (MEXT), Japan.
Conflict of interest
KH was employed by the Nippon Koei Co., Ltd.
The remaining authors declare that the research was conducted in the absence of any commercial or financial relationships that could be construed as a potential conflict of interest.
The author(s) declared that they were an editorial board member of Frontiers, at the time of submission. This had no impact on the peer review process and the final decision.
Publisher’s note
All claims expressed in this article are solely those of the authors and do not necessarily represent those of their affiliated organizations, or those of the publisher, the editors and the reviewers. Any product that may be evaluated in this article, or claim that may be made by its manufacturer, is not guaranteed or endorsed by the publisher.
Supplementary material
The Supplementary material for this article can be found online at: https://www.frontiersin.org/articles/10.3389/frwa.2024.1403286/full#supplementary-material
Footnotes
1. ^ https://www.data.jma.go.jp/yoho/typhoon/index.html
2. ^ https://sharaku.eorc.jaxa.jp/TYP_DB/index_j.html
3. ^ https://www.usgs.gov/programs/cmhrp/news/hurricane-ians-scientific-silver-lining
4. ^ https://www.mlit.go.jp/hakusyo/mlit/h25/hakusho/h26/html/n1124000.html
5. ^ https://www.pwri.go.jp/icharm/research/rri/index_j.html
References
Aoki, S. I., and Kato, S. (2010). Storm surge in Mikawa Bay caused by typhoon no. 0918. J. Jpn. Soc. Civil En. 66, 296–300. doi: 10.2208/kaigan.66.296
Brackwell, W. J., Braun, S., Bennartz, R., Velden, C., DeMaria, M., Atlas, R., et al. (2018). An overview of the TROPICSNASA earth venture Mission. QJR Meteorol. Soc. 144, 16–26. doi: 10.1002/qj.3290
Bucci, L., Alaka, L., Hagen, A., Delgado, S., and Beven, J. (2023). Hurricane IAN (AL092022) : National Hurricane Center Tropical Cyclone Report.
Dudhia, J. (1993). A nonhydrostatic version of the Penn StateNCAR mesoscale model: validation test and simulation of an Atlantic cyclone and cold front. Mon. Weather Rev. 121, 1493–1513. doi: 10.1175/1520-0493(1993)121<1493:ANVOTP>2.0.CO;2
Gomez-Fragoso, J., Smith, M., and Santiago, M. (2022). U.S. geological survey response to hurricane Maria flooding in Puerto Rico and characterization of peak streamflows observed September 20–22, 2017 (ver. 1.1, July 2022). U.S. Geol. Surv. Sci. Invest. Rep. :105. doi: 10.3133/sir20225040
Goto, C., and Shibaki, H. (1993). A hindcast of maritime surface wind including effects of land topography. National Institute of Maritime, Port and Aviation Technology Port and Airport Research Institute.
Hara, N., Yamada, T., and Shibaki, H. (2009). Numerical study of storm surge - flood coupling by using the general coordinate system. J. JSCE 65, 246–250. doi: 10.2208/kaigan.65.246
Haruyama, K., Toyoda, M., and Kato, S. (2022). Characteristic analysis for increasing in water level due to compound flooding in small and medium river basin. J. JSCE 78:I_403-I_408. doi: 10.2208/kaigan.78.2_I_403
Holland, G. J. (1980). An analytic model of the wind and pressure profiles in hurricanes. Mon. Weather Rev. 108, 1212–1218. doi: 10.1175/1520-0493(1980)108<1212:AAMOTW>2.0.CO;2
IPCC (2021) Summary for policymakers. In: Climate Change 2021: the physical science basis. contribution of working group I to the sixth assessment report of the Intergovernmental Panel on Climate Change. V. Masson-Delmotte, P. Zhai, A. Pirani, S. L. Connors, C. Péan, and S. Berger, et al. (eds.). In Press.
Jiang, X., Mori, N., Tatano, H., and Yang, L. (2019). Simulation-based exceedance probability curves to assess the economic impact of storm surge inundations due to climate change: a case study in Ise Bay, Japan. Sustainability 11:1090. doi: 10.3390/su11041090
Kim, S. Y., Yasuda, T., and Mase, H. (2008). Numerical analysis of effects of tidal variations on storm surges and waves. Appl. Ocean Res. 30, 311–322. doi: 10.1016/j.apor.2009.02.003
Knabb, R. D., Rhome, J. R., and Brown, D. P. (2023). Tropical Cyclone Report Hurricane Katrina 23-30 August 2005. National Hurricane Center, 43 pp.
Konja, A, Sekimoto, T, Abe, S, Iwasaki, T, Cui, G, Kojima, H, et al. (2019). Inundation forecasting on national scale of Japan using rainfall-runoff-inundation integral analysis. J Jpn Soc Civil Engineers Ser B2 (Hydraul Eng) 75, 1321–1326.
Kumbier, K., Carvalho, R. C., Vafeidis, A. T., and Woodroffe, C. D. (2018). Investigating compound flooding in an estuary using hydrodynamic modelling: a case study from the Shoalhaven River, Australia. Nat. Haz. Earth Syst. Sci. 18, 463–477. doi: 10.5194/nhess-18-463-2018
Lagmay, A. M. F., Agaton, R. P., Bahala, M. A. C., Briones, J. B. L. T., Cabacaba, K. M. C., Caro, C. V. C., et al. (2015). Devastating storm surges of typhoon Haiyan. J. Disast. Risk Reduct. 11, 1–12. doi: 10.1016/j.ijdrr.2014.10.006
Leonard, M., Westra, S., Phatak, A., Lambert, M., Hurk, B. V. D., Mclnnes, K., et al. (2013). A compound event framework for understanding extreme impacts. WIREs Clim. Change 5, 113–128. doi: 10.1002/wcc.252
Li, Y., Zhou, W. H., and Shen, P. (2023). Flood risk assessment of loss of life for a coastal city under the compound effect of storm surge and rainfall. Urban Clim. 47:101396. doi: 10.1016/j.uclim.2022.101396
Liang, H., and Zhou, X. (2022). Impact of tides and surges on fluvial floods in coastal regions. Remote Sens. 14:5779. doi: 10.3390/rs14225779
Ministry of Land, Infrastructure, Transport and Tourism (2014). White paper on land, infrastructure, transport, and tourism in Japan, 2013. Japan Meteorological Agency.
Ministry of Land, Infrastructure, Transport and Tourism. (2024) National land numerical information download site. Japan Meteorological Agency.
Nagoya Local Meteorological Observatory, Japan Meteorological Agency (2018). Typhoon no. 21 in 2008 Aichi prefectural meteorological bulletin.
Sarker, S. (2022). Fundamentals of climatology for engineers: lecture note. Eng 3, 573–595. doi: 10.3390/eng3040040
Sarker, S. (2023). Separation of floodplain flow and bankfull discharge: application of 1D momentum equation solver and MIKE 21C. Civil Eng 4, 933–948. doi: 10.3390/civileng4030050
Sayama, T., Ozawa, G., Kawakami, T., Nabesaka, S., and Fukami, K. (2012). Rainfall-runoff-inundation analysis of the 2010 Pakistan flood in the Kabul River basin. Hydrol. Sci. J. 57, 298–312. doi: 10.1080/02626667.2011.644245
Shieh, C. L., Wang, C. M., Lai, W. C., Tsang, Y. C., and Lee, S. P. (2009). The composite hazard resulted from typhoon Morakot in Taiwan. J. Jpn. Soc. Eros. Contr. Eng. 62, 61–65. doi: 10.11475/sabo.62.4_61
Switanek, M. B., Hamill, T. M., Long, L. N., and Scheuerer, M. (2023). Predicting subseasonal tropical cyclone activity using NOAA and ECMWF reforecast. Weather Forecast. 38, 357–370. doi: 10.1175/WAF-D-22-0124.1
Toyoda, M., Mori, N., Kim, S., and Shibutani, Y. (2022). Compound flood modeling for small and medium rivers using integrated atmospheric, ocean and river model. J. JSCE B2–78:I_193–I_198. doi: 10.2208/kaigan.78.2_I_193
Toyoda, M., Mori, N., Kim, S., and Shibutani, Y. (2024). Assessment of compound occurrence of storm surge and river flood in Ise and Mikawa Bays, Japan using a framework of atmosphere–ocean–river coupling. Nat Hazards 120, 3891–3917. doi: 10.1007/s11069-023-06362-7
Yamazki, D., Togashi, S., Takeshima, A., and Sayama, T. (2018). Japan flow direction map. J. JSCE 74:I_163-I_168. doi: 10.2208/jscejhe.74.5_I_163
Yoshino, J., Kurino, Y., Toyoda, M., and Kobayashi, T. (2021). Pseudo-global warming track ensemble experiments on heavy rainfall induced by typhoon Hagibis (2019). J. JSCE 77:I_1249-I_1254. doi: 10.2208/jscejhe.77.2_I_1249
Yoshino, J., Strachan, J., and Vidale, P. L. (2012). Numerical simulations of the life cycle of super typhoon with high-resolution and high-efficiency. J. JSCE 68:I_1211-I_1215. doi: 10.2208/kaigan.68.I_1211
Keywords: compound flooding, track ensemble experiment, storm surge, high river flow, Mikawa Bay
Citation: Haruyama K, Toyoda M, Kato S, Mori N, Kim S and Yoshino J (2024) Investigation of compound occurrence of storm surge and river flood in Mikawa Bay, Japan, using typhoon track ensemble experiments. Front. Water. 6:1403286. doi: 10.3389/frwa.2024.1403286
Edited by:
Rajesh Shrestha, Environment and Climate Change Canada (ECCC), CanadaReviewed by:
Shiblu Sarker, Virginia Department of Conservation and Recreation, United StatesWei Che Huang, National United University, Taiwan
Copyright © 2024 Haruyama, Toyoda, Kato, Mori, Kim and Yoshino. This is an open-access article distributed under the terms of the Creative Commons Attribution License (CC BY). The use, distribution or reproduction in other forums is permitted, provided the original author(s) and the copyright owner(s) are credited and that the original publication in this journal is cited, in accordance with accepted academic practice. No use, distribution or reproduction is permitted which does not comply with these terms.
*Correspondence: Masaya Toyoda, dG95b2RhQGFjZS50dXQuYWMuanA=