 Anamika Yadav
 Subha M. Roy
 Abhijit Biswas
 Bhagaban Swain3
94% of researchers rate our articles as excellent or good
Learn more about the work of our research integrity team to safeguard the quality of each article we publish.
Find out more
ORIGINAL RESEARCH article
Front. Water, 15 May 2024
Sec. Water Resource Management
Volume 6 - 2024 | https://doi.org/10.3389/frwa.2024.1401689
This article is part of the Research TopicAdvancement in Hydrological Modeling and Water Resources Management for achieving Sustainable Development Goals (SDGs)View all 16 articles
The significance of this study involves the optimisation of the aeration efficiency (AE) of the venturi aerator using an artificial neural network (ANN) technique integrated with an optimisation algorithm, i.e., particle swarm optimisation (PSO) and genetic algorithm (GA). To optimise the effects of operational factors on aeration efficiency by utilising a venturi aeration system, aeration experiments were conducted in an experimental tank with dimensions of
• Performance evaluation of artificial neural network–particle swarm optimisation (ANN-PSO) and artificial neural network–genetic algorithm (ANN-GA) techniques to optimise the operating variables of venturi.
• Soft computing methods are used for the estimation of aeration efficiency.
• A comparison of the ANN-PSO technique with the ANN-GA approach.
India is the third-largest fish producer worldwide, contributing 7.56% of the world’s food supply, and its production has increased consistently over the past 10 years on average. In 2019, the overall aquaculture production increased by 1.5% compared to the previous year, reaching 4,421.22 thousand metric tonnes (FAO, 2019). In semi-intensive and intensive aquaculture, applications of aeration practises are crucial to maintaining microclimate conditions that are compatible with the physiological needs of the cultivated species. Aerators mainly distribute gas bubbles that enable oxygen to move to the water. The economic viability and productivity of commercial aquaculture farming depend significantly on the condition of the water quality. Dissolved oxygen (DO) is the most crucial parameter of the water quality that might affect aquaculture production and the survival rate of all aquatic species. Temperature and DO are interrelated parameters, and temperature variations can result in a more significant difference in the amount of DO in ponds (Dayıoğlu, 2022). According to a thumb rule, the optimal values of DO for the majority of aquatic species at sea level are considered as 50% saturation concentration in freshwater bodies, or 5 mg/L and 4 mg/L at temperatures of 15°C and 26°C, respectively (Roy et al., 2022; Yadav and Roy, 2023). In particular, the cold water and warm water species require DO concentrations between 7 mg/L and 9 mg/L and between 4 mg/L and 7 mg/L for proper growth and reproduction (Roy et al., 2021b, 2022). The existence possibility of aquatic species can increase using artificial aeration techniques in pond culture (Pawar et al., 2009). Aquaculture ponds have always used artificial aeration, i.e., surface, diffused, and gravity aeration, but in recent years, attention to venturi aeration has greatly expanded to generate fine bubbles and microbubbles (Navisa et al., 2014; Cheng et al., 2019; Sangeeta and Tiwari, 2019; Roy et al., 2020, 2021a; Luxmi et al., 2022). One of the most cost-effective aerators for small-scale aqua farmers is the venturi aerator. The venturi aeration system is a widely used technique in water engineering including aquaculture, which works on Bernoulli’s principle (Baylar and Ozkan, 2006). The venturi aeration has a unique design to supply an abundant amount of air through entrainment at the narrower section of the venturi called the throat section. The venturi aeration is a highly efficient technique to increase the oxygen transfer ability through the production of many tiny bubbles. The aeration effectiveness is defined by the amount of gas and liquid interface area of contact that is primarily governed by the size of liquid film between gas molecules and liquid film (Yadav et al., 2020, 2021). Prior to inserting into the whole water volume, venturi aerators are primarily designed to mix air and water together at the throat of the venturi through inserted air holes (Baylar and Emiroglu, 2003; Gupta et al., 2016; Li et al., 2017; Sun et al., 2017; Sihag et al., 2021). The venturi aeration system can be utilised in various fields or industries such as water treatment plants, agriculture fields, fertiliser application, integrated irrigation systems, hatchery farms, and recirculating aquaculture systems (Omary et al., 2020; Wang et al., 2022). The venturi is highly efficient and provides significant benefits to the farmers as low power is needed to operate, is durable and compatibly cheaper, and requires less maintenance (Mahmud et al., 2020).
According to the results found from past studies, a venturi aerator performs best amongst all aeration systems with a standard aeration efficiency (SAE) value of . The optimum SAE was reported using venturi in a circular geometry tank as (Zhang et al., 2020). Both geometrical and dynamic characteristics may affect the aeration system’s performance. It was found that the rate of oxygen entrainment and its transmission efficiency increase with pipe diameter and water velocity for all ratios of venturi throat to inlet and outlet diameter (Yadav et al., 2019). Ghomi et al. (2009) investigated several varying geometrical limits of venturi to regulate the SAE value. The maximum SAE value for each depth ( ) and the angle ( ) of aeration was found to be at 14 mm diameter along with the coefficient value (R2) of 0.958. Sanghani et al. (2014) examined the impact of geometrical factors of venturi on the throat length, the inlet and outlet angles, and the diameter ratio of the inlet, throat section, and pressure gradient. Baylar and Ozkan (2006) observed that the pressure was reduced at the throat by increasing the inlet pressure. The increased inlet pressure and contraction ratio lead to frequent increases in mass flow rates, and the reverse flow occurs in the contracted segment of the venturi (Zhang, 2017).
Recently, according to the review of literature, several research studies have been conducted on soft computing techniques based on artificial neural network (ANN), particle swarm optimisation (PSO), and genetic algorithm (GA) modelling in a variety of applications of aeration system (Bagatur and Onen, 2014; Kumar et al., 2018; Garg and Jain, 2020; Roy et al., 2021b). The ANN is a useful tool for simulating complex processes with dynamic interaction between the components that affect outcomes (Omid et al., 2009; Pareek et al., 2021). The ANN techniques can be utilised to identify the most effective process variables for maximising output. Roy et al. (2022) worked on the hybrid ANN-PSO approach to improve the geometric and dynamic characteristics of the designed cascade aerator pooled circular type to increase the aeration efficiency. Dayev et al. (2022) worked on soft computing methods to evaluate the capability of advanced computing approaches to accurately find out the air flow rate in a wet gas mixture, mainly in circumstances when the monitoring of such quantities using conventional models is actually difficult to adopt practically. Furthermore, ANN models have been employed by Mjalli et al. (2007) to evaluate the efficacy of the aeration system adopted in wastewater treatment facilities. When it comes to application, developed ANN models are far superior to response surface methodology (RSM) (Roy et al., 2021a). Garg and Jain (2020) investigated that the ANN outperforms the RSM for evaluating performance and analysis of variables of extracting biofuel via seaweed. In comparison with regression analysis, artificial neural networks are more generalisable, less susceptible to variability and anomalies, and can manage flawed information or data (Luk et al., 2001; Haykin, 2009). The literature cited above demonstrates that the ANN modelling may be effectively applied to simulate the operational characteristics of the aquaculture aeration system (Pareek et al., 2023a,b). However, a number of statistical approaches were successfully used for the optimisation of the aeration system, whereas the PSO and other comparatively more sophisticated optimisation algorithms have not yet been the subject of research. This optimisation method has been successfully used to solve a variety of issues in the physical world (Roy et al., 2022). In addition, other soft computing methods such as genetic expression programming (GEP), multiple linear and non-linear regressions, neuro-fuzzy, neural network, artificial intelligence (AI) models, and Gaussian process regression (GPR) models have been utilised to assess the effectiveness of AE of weirs and water jet system (Onen, 2014; Pareek et al., 2023a,b).
According to the research study that is currently available, past research was primarily used to estimate oxygenating characteristics and capacity. In contrast, a recent study supports the development of ANN, based on soft computing models, which draws their power to increase the AE of venturi. Furthermore, to improve the AE, the venturi aerator’s operational variables were further combined with an ANN model using PSO and GA gradient techniques. The geometrical design and operating variables of the proposed venturi aerator might affect aeration performance. No analogous studies using soft computing techniques on venturi aeration for the primary aim of aquaculture have been found. In order to attain the greatest possible aeration efficiency, the present study aimed to identify the design parameters (throat length and extended outlet pipe length) and operative parameter (flow rate) of the venturi aeration system.
Furthermore, the present study assesses to optimise the aeration efficiency of the venturi aeration system in terms of aeration efficiency using the ANN model integrated with PSO and GA techniques. Furthermore, the effectiveness of the ANN-PSO and ANN-GA techniques has been examined and compared.
This article is organised as follows: Section 2 presents a theoretical analysis based on the two-film theory to determine the overall oxygen mass transfer rate, standard oxygen transfer rate, and standard aeration efficiency.
Section 3 encompasses materials and methods, including the experimental setup, experimental design, and procedure to evaluate the performance of venturi aeration. In addition, this section discusses the artificial neural network integrated with particle swarm optimisation and genetic algorithm technique and the performance analysis.
A detailed summary of the results and discussions is discussed in Section 4, which includes performance evaluation of the developed models, ANN modelling, PSO, a comparison between the integrated models, and the effects of operating parameters on aeration efficiency.
Section 5 discusses the conclusion of this article, including the authors’ perspectives on the subject of the study and potential directions for further research.
The two-film theory is the most frequently employed technique to determine the oxygen transfer rate, which is applicable in the two-phase system consisting of a gas phase and a liquid phase (Lewis and Whitman, 1924; Treybal, 1985). The variation in the oxygen concentration affects the transfer rate of oxygen mass from the atmosphere into the water interface with respect to time can be represented by Equation 1 (Metcalf et al., 1979).
where Cs = steady saturation concentration (mg/l) of DO in water bodies at standard temperature and pressure, C = oxygen content in water, and . Further integrating Equation 1 at C = C0 to C and t = 0 to t can be rewritten as Equations 2, 3:
The oxygen transfer coefficient at T°C, KLaT may be stated as follows using the two-film theory as Equation 4.
where ln = natural logarithm, Cs = saturation concentrations of dissolved oxygen (mg/l), C0 and Ct = oxygen concentration at initial time, t = 0 and t, respectively. The graph between and t represents a linear slope, which determines the KLaT value (ASCE, 2007), and can be represented by Equation 5.
where = coefficient of mass transfer at a standard temperature of 20°C (h−1), = coefficient of mass transfer at T °C (h−1), θ = constant for pure water as 1.024 (Boyd, 1998; ASCE, 2007), and T = temperature of water (°C). Efficiency and durability are the most important factors to take into account whilst selecting an aerator for daily use in aquaculture farms. The standard oxygen transfer rate (SOTR) and standard aeration efficiency (SAE) measurements can be used to evaluate the proposed aerator’s performance (Boyd and Ahmad, 1987). The SOTR is the amount of oxygenation capacity of an aeration system with respect to time at a standard pressure of 1.01325 bar and a standard temperature of 20°C, the primary DO concentration level of 0 mg/L, and clear tap water (APHA, 1985). The SAE is the ratio between SOTR and the required power (P, kW) to run the aerator (Lawson and Merry, 1993). Both the SOTR and SAE can be calculated by Equations 6, 7, respectively.
The following Equations 8, 9 may be used to derive the oxygen transfer rates (OTR) and aeration efficiency (AE) from SOTR and SAE, respectively (Boyd, 1998):
where and β are the correction factors.
A 220 L volume of an experimental tank with measurements of was operated with the venturi for oxygenating the full volume of water (Figure 1). The venturi circulates water with the help of pipe fittings in a closed-loop system with an associated pump, valves, water metre, and pressure gauge. The well-known sections of the venturi are divided into three distinct parts, namely, converging, throat, and diverging. The converging section is connected with the narrow section at the neck of the venture, and it terminates with the diverging section as an outlet of the venturi. Each of the sections of the venturi may be separated from one another. Another extended outlet pipe (EOP) is also connected with the diverging section to supply oxygenated water into the full volume of the water tank. Both converging and diverging sections were fabricated with the same length of 100 mm. The middle section of the venture, i.e., throat consists of five sets of different lengths, namely, . In total, four different extended outlet pipe lengths were designated in the current study to see the performance of aeration efficiency, i.e., .
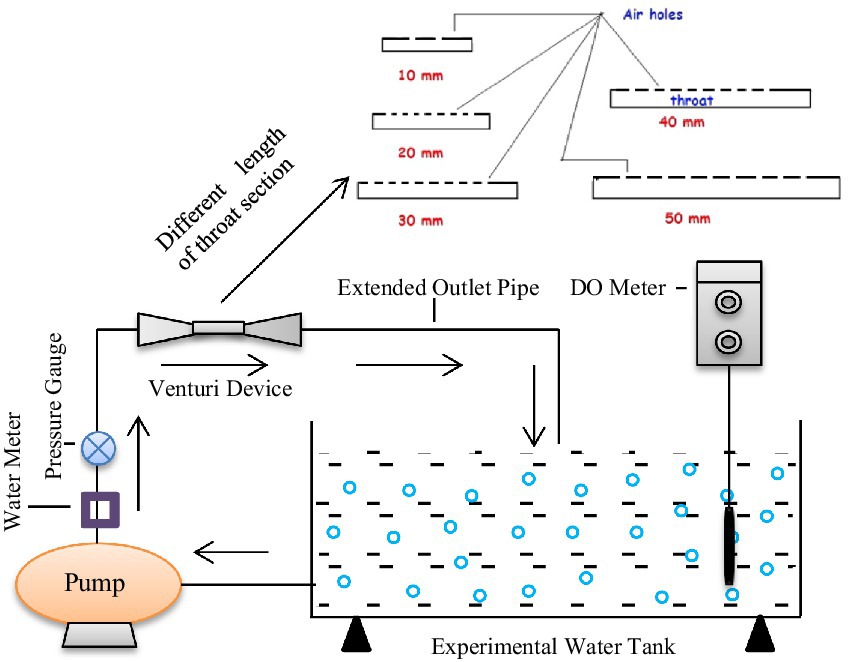
Figure 1. A schematic view of the experimental setup (Yadav and Roy, 2023).
All the experiments were conducted using a 1-HP centrifugal pump, which circulates water by venturi in a closed-loop manner with connecting extended outlet pipes of various lengths. The throat section produces a vacuum and makes it possible for air entry from air holes due to the pressure reduction. As a result, the air bubbles mix with water that flows via the venturi to the outlet pipe and continues to travel in the water tank. The experiments were conducted at three different flow rates (Q) of 0.30 L/s, 0.60 L/s, and 0.90 L/s for all sets of design parameters (throat length, TL; and extended outlet pipe, EOP). Table 1 presents the planned experiments to improve the venturi aeration system’s aeration efficiency. A total of 60 experiments were performed with three replicates to optimise the aeration efficiency of the venturi aerator. With a 5% threshold of significance, substantial model parameters were found using the analysis of variance (ANOVA). In the current study, the AE of the venturi aeration system was analysed and compared using integrated models, i.e., ANN-PSO and ANN-GA. The extended outlet pipe (EOP), throat length (TL), and flow rate (Q) are the independent variables, and the dependent variable is chosen as AE to determine the model response.
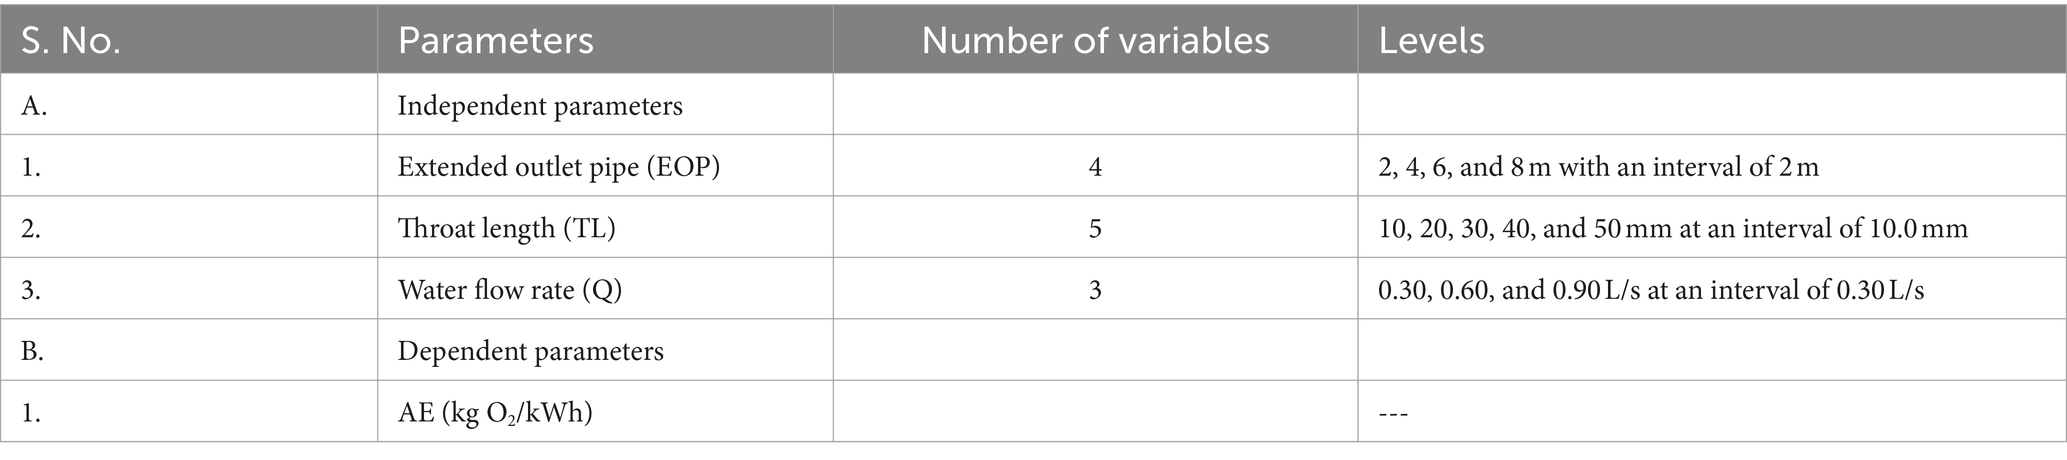
Table 1. Experimental schedule to determine the AE of the venturi aeration system.
In this analysis, pure tap water was initially deoxygenated using non-steady re-aeration experiments (ASCE, 2007). Each experiment utilised clean tap water that was deoxygenated to reduce the DO of each milligramme per litre employing 10 mg of sodium sulphite and 0.1 mg of cobalt chloride as a catalyst per litre volume of water (Boyd, 1998). The EXTECH DO metre 407,510 was used to measure the temperature, and DO level datasets for each set of operations were carried out at 1 min of an identical interval until 80% of DO saturation was attained. For each DO saturation measurement that was acquired, the measurements for the DO deficiencies were also produced. Furthermore, the graphical representation amongst natural log deficits (ordinate) and aeration time (abscissa) represents the best-fit gradient line to assess . The gradient line was additionally improved by a 20°C temperature correction factor. Moreover, the oxygen transfer ability of the venturi has been estimated by KLa20, OTR, and AE using Equations 5–7, respectively.
The artificial neural network (ANN) is a data processing system that distributes data uniformly and has certain traits and features that are comparable to the neural structure of the human brain (Haykin, 1999; Mohanty et al., 2010; Yadav and Roy, 2023). An ANN includes an input layer (independent variables), a hidden layer, and an output layer (dependent variables); each layer contains a variety of processing components. An increasingly popular solution to conventional modelling methodologies and a more accurate tool to utilise with complicated non-linear interactions is the ANN, which relies on the idea of real-world neurons as well. An average neural system is fully interconnected, meaning that every single neuron in a single layer has a link to all the other neurons in each layer above it (Kumar et al., 2002). The process of the data information modelling approach starts using basic analysing units before scaling up to more complicated ones, modifying balanced inputs to make neural networks more effective. The effectiveness of an ANN multilayer model relies on both the number of neurons and connections and is affected by how the information is received, processed, and subsequently processed in hidden layers (Karri and Sahu, 2018). The available research shows that most researchers utilise a gradient-based optimisation technique called feed-forward neural network development with a conventional back-propagation strategy (Rumelhart et al., 1986).
The AE of the venturi aerator was considered as a result of the model with its selected operational parameters, i.e., TL, EOP, and Q, which were used as model inputs. A total of of the 60 data points were applied for training, whilst the rest of the were employed for network setting. In the present study, the experimental dataset of a 70:30 splitting ratio was used (Roy et al., 2022; Yadav and Roy, 2023). The optimal network layout for the ANN model was discovered to be 3–6-1 as presented in Figure 2. In the current study, the overfitting issue was resolved by standardising the experimental findings using min–max normalisation before utilising them for ANN training.
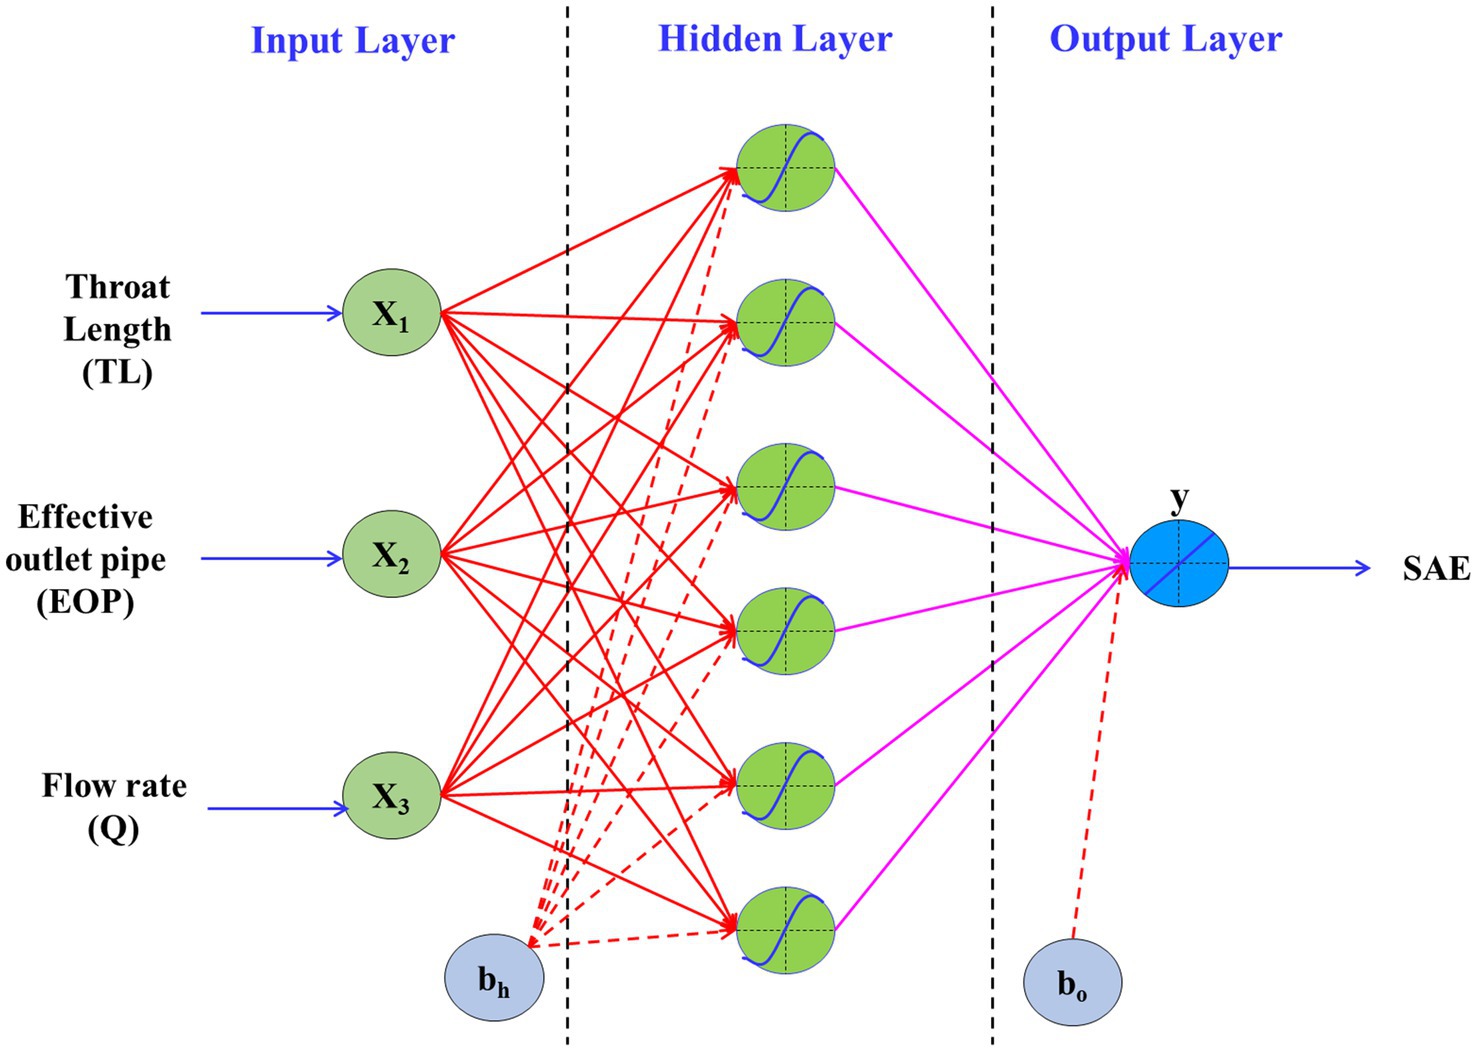
Figure 2. Topology of the 3-6-1 ANN model.
The particle swarm optimisation (PSO) modelling integrated with ANN is a cutting-edge, accurate, and experimental approach. A kind of meta-heuristic model called ANN-PSO can be utilised to build realistic models and deal with non-uniform multi-component interactions between dependent and independent variables (Yadav and Roy, 2023). The PSO requires fewer parameter adjustments than any other optimisation approach available and is simpler to implement (Eberhart and Shi, 2001). Furthermore, if the target function includes a single attribute and several local minima/maxima, the ideal value may be reached using the PSO method (Roy et al., 2021b). As PSO is a naturalistic exploration method as opposed to gradient-based optimisation, it has the drawback of being a sluggish procedure (Roy et al., 2021b). On the other hand, complicated non-linear optimisation issues are frequently solved using mathematical techniques such as genetic algorithm-based optimisation (ANN-GA) and ANN modelling. In the present study, ANN was integrated with PSO and GA algorithms separately to generate data of ANN using various amounts of neurons in the middle-hidden layer whilst taking into account the sample estimates for PSO and GA (Ghose et al., 2023). The movement of the points in space may be understood by their velocities, which also have the potential to hold their local and global best values (Jun et al., 2020). Each particle kept its location and modified velocity based on its own flight performance along with that of other elements in the search space to identify the most efficient result. The updated velocities and orientations of every single particle as it travels to the local optimal point (pbest) and global best point (gbest) are computed using the following Equations 10, 11.
where, ; N = population size, = flow rate of the element at iteration ; = element position at iteration ; = personal best of element ; = best point in the community; = weight of inertia; and = coefficients; and and = random numbers uniformly scattered in the range (0, 1) (Figure 3).
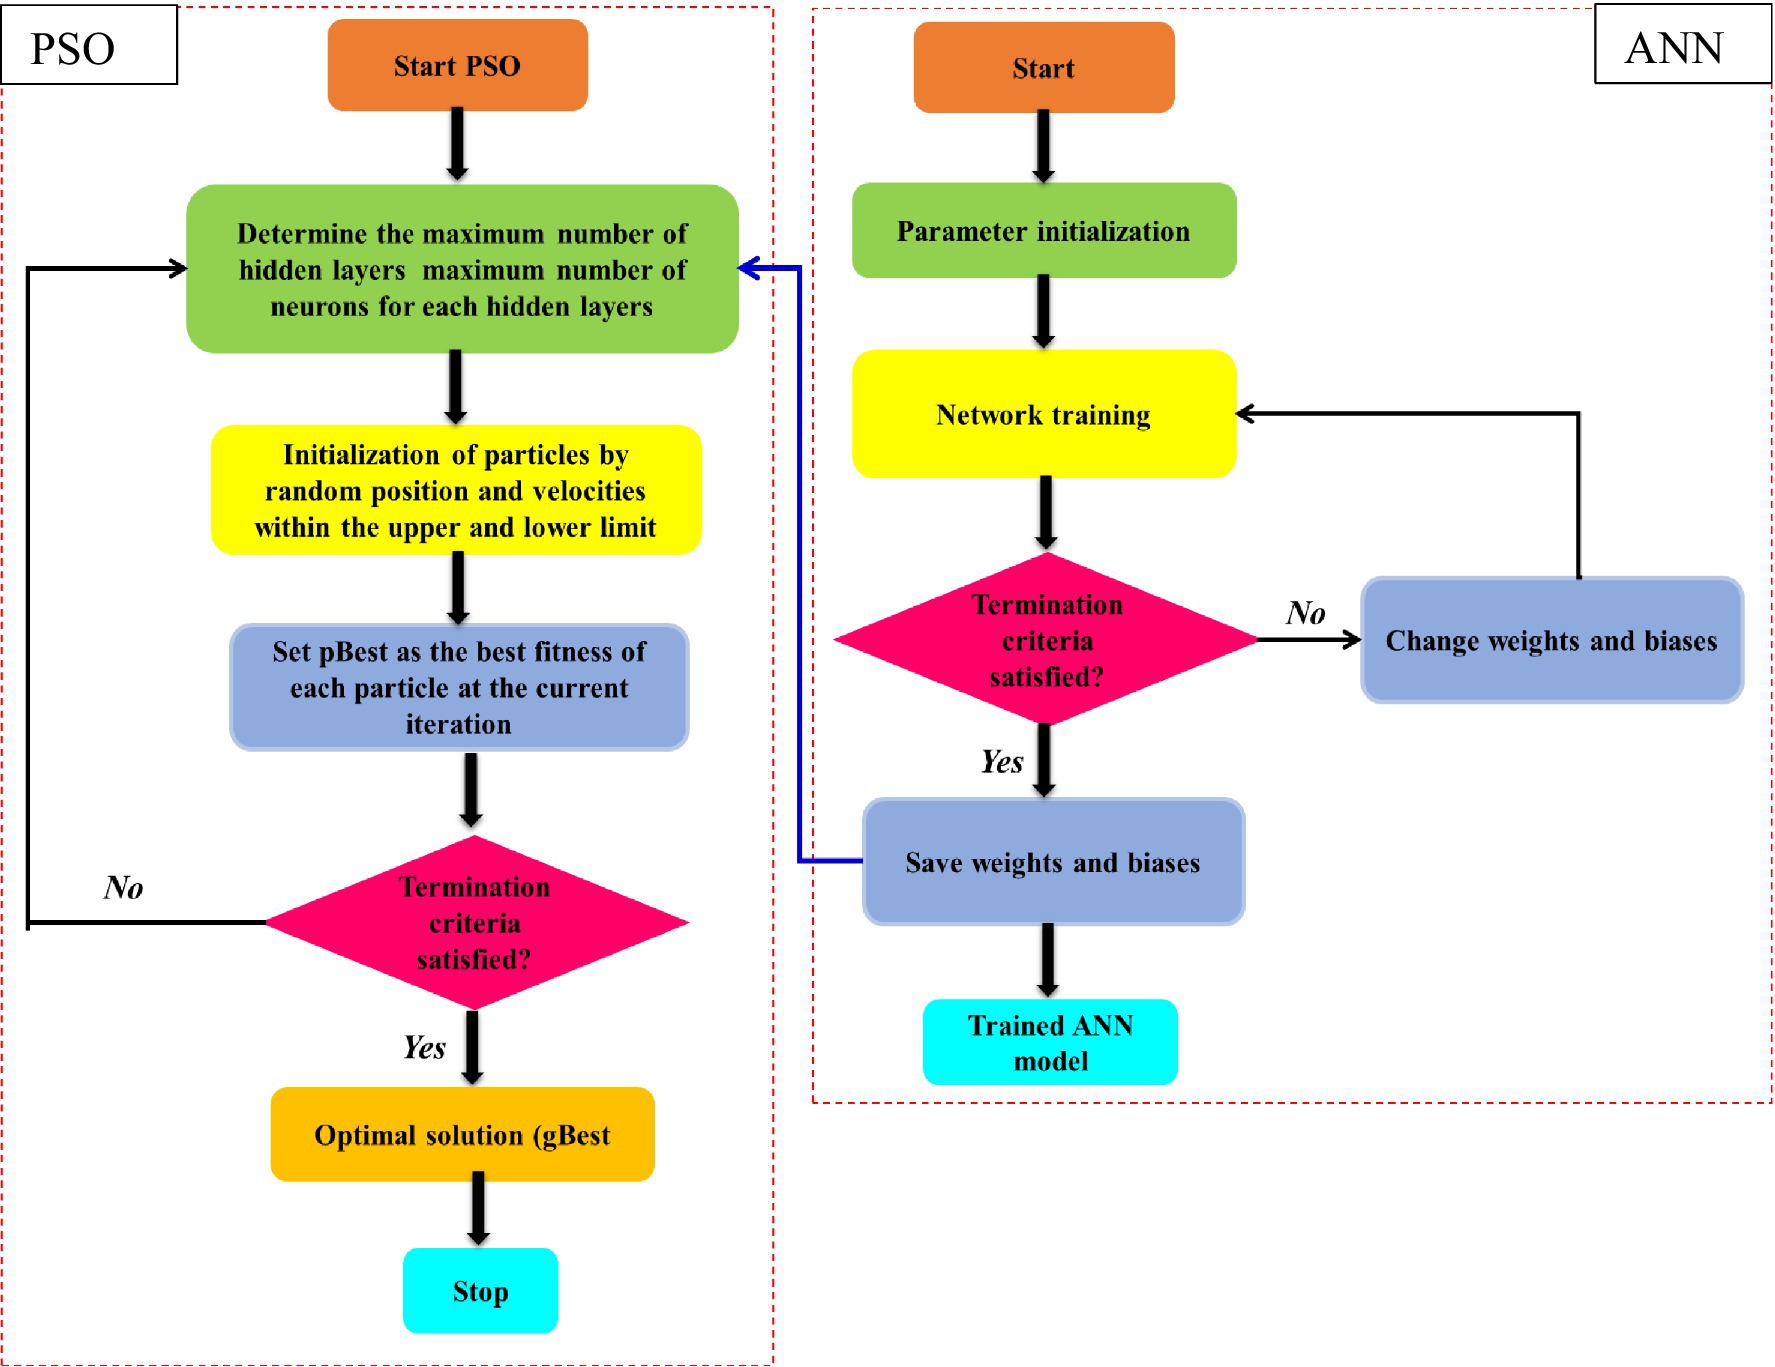
Figure 3. Flowchart of the ANN-PSO techniques.
Holland (1992) established the genetic algorithm (GA), a meta-heuristic optimisation method that utilises the ideas of the natural selection process and heredity. It is employed to resolve optimisation issues that are both confined and uncontrolled. Using statistical modifications, GA may continually adjust the number of distinctive approaches whilst searching over enormous solution spaces. The GA technique consists of three crucial processes, including the first group creation, genetic operator training (reproduction, crossover, and mutation), and evaluation according to a group’s fitness value (Yang et al., 2020). The genetic algorithm identifies people at random within the existing population at each stage, treating them as a pair of parents to create progeny for the generations to come. Over succeeding generations, the population progresses in the direction of the optimal solution. It is possible to choose an adequate goal function by using a mixed genetic algorithm. The ability of ANN models to estimate the future is improved by the multidirectional searching technique used in GA (Figure 4).
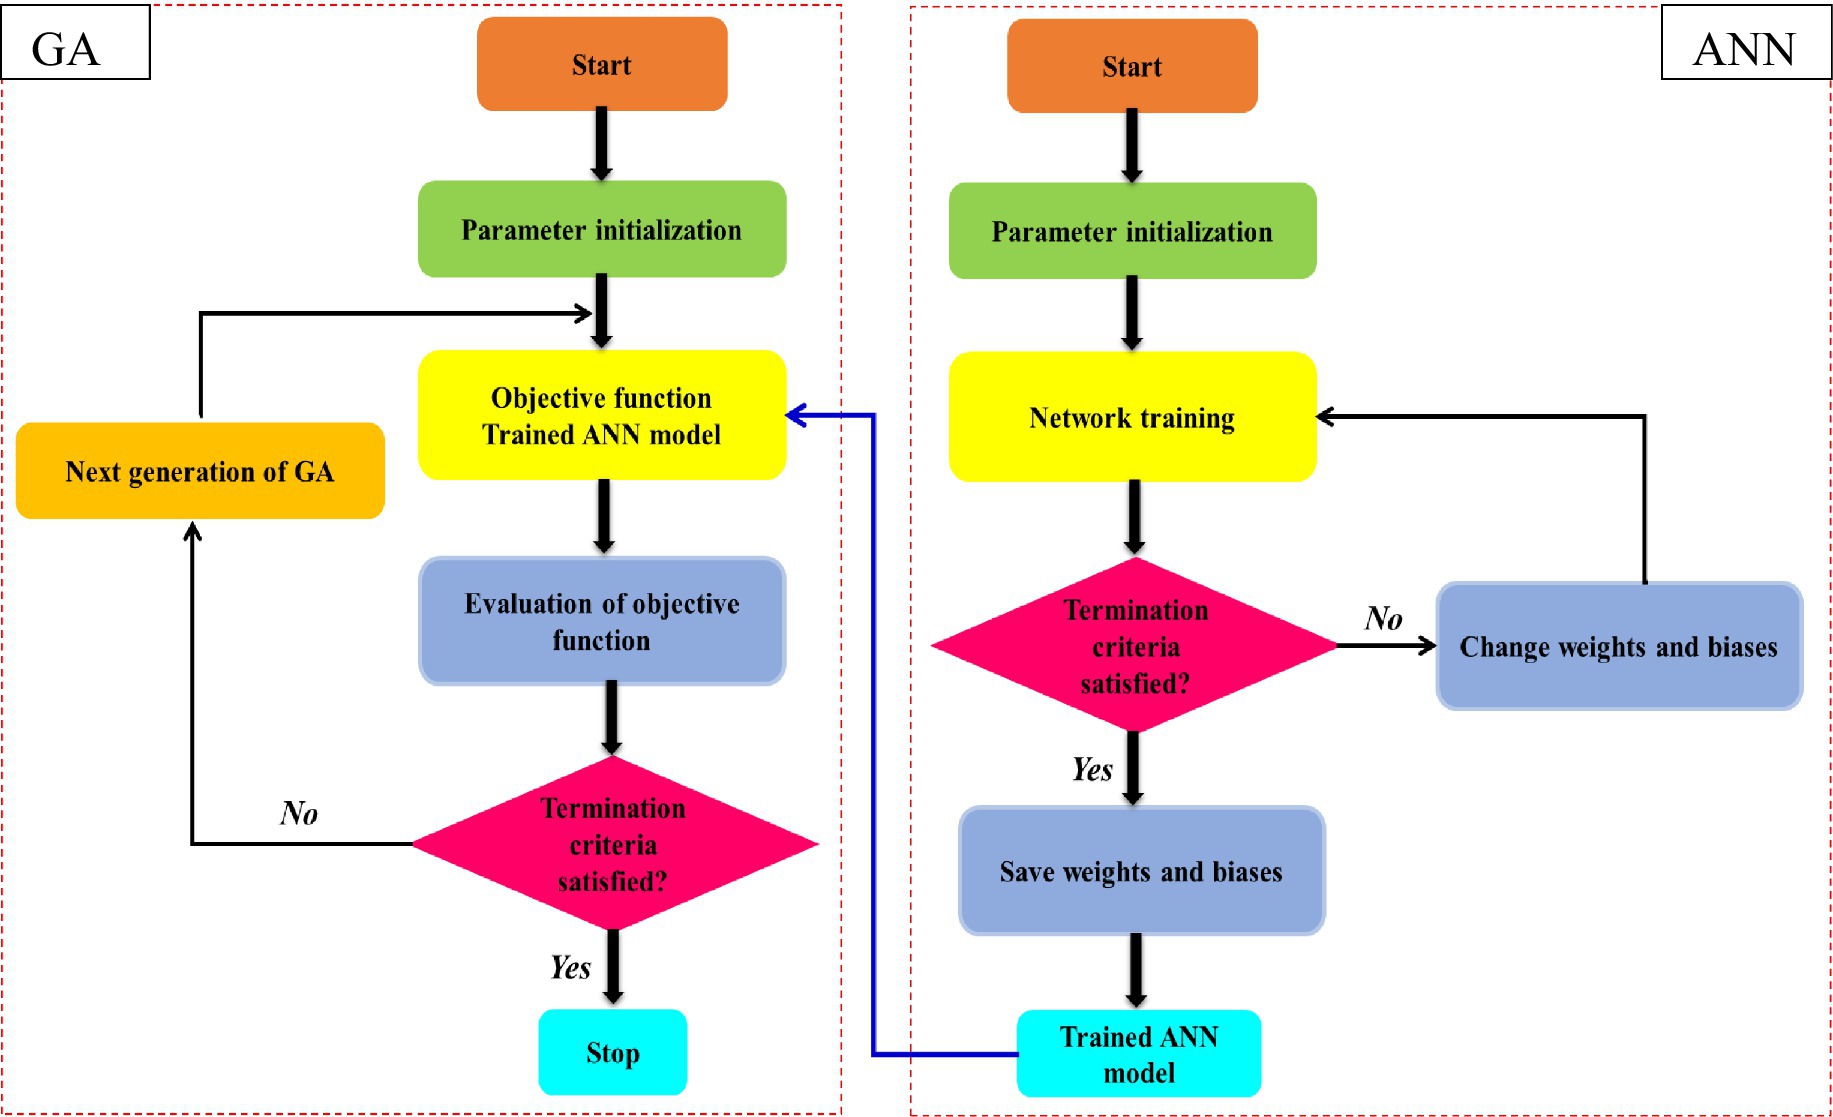
Figure 4. Flowchart of the ANN-GA techniques.
In this study, the highest possible swarm size was set at 10 random particles produced and 50 iterations. The values taken for , and are 0.8, 1.05, and 1.05, respectively. The programme was run by MATLAB-2013a to execute the ANN-PSO and ANN-GA techniques. Although the MATLAB PSO method employs an optimisation strategy, its goal is to maximise AE, which is expressed as a similar minimising problem, as follows:
where = selected resolution vector and = result of the ANN. The limits are specified as and .
To evaluate the efficacy of the developed ANN and linear regression (LR) models, the coefficient of determination (R2), root mean square error (RMSE), and mean absolute error (MAE) were used as indicators of effectiveness. The variables used in the produced models were compared, and the algorithm of high coefficients of R2 and fewer values of MAE and RMSE was determined as the best fit. The following Equations 13, 14, 15 were used to calculate R2, RMSE, and MAE, respectively:
where N is the total amount of observations, Oi and Pi are the observable and projected values, respectively, and the bar represents the variable’s mean.
The linear regression analysis utilises a total of 60 observed responses; the model was developed using the least square method. A linear regression model was developed for several responses of AE using the investigated dataset. The linear relationship between AE and independent operative variables, i.e., TL, EOP, and Q, is depicted in the regression Equation 16.
The linear regression Equation 16 specifies the hypothesis model that fits well in between the independent variables and AE. The linear regression equation is a second-order polynomial, which has a high coefficient of correlation (R2) value, demonstrating that a significant relationship is feasible. The p-value and the R2 value were estimated as 0.972 and 0.005, respectively. The above findings are supported by the value of the modified coefficient of correlation (R2 adj.), 0.976. The 97.25% probability from the analysis indicates that the independent variables (TL, EOP, and Q) of the LR model are highly significant.
According to the statistical results (Table 2), every component of the linear model (TL, EOP, and Q), as well as the quadratic model term (TL2, EOP2, and Q2), has statistical significance at the 97.25% level of confidence. There is no statistical significance (p > 0.05) for the interacting model variables (EOP Q), (EOP TL), and (Q TL).

Table 2. Estimated regression coefficients for AE (kg O2/kWh).
The results of the p values are an easy approach for evaluating the importance of various coefficients. The significance of the associated coefficient increases with decreasing P. The correlation between the variables is extremely significant (F = 196.60; p = 0.000), according to the ANOVA (Table 3) of the best-fitted estimated model. According to the results of the present study, the model term TL (p = 0.000) is significant (p < 0.05), whereas, the other model terms, EOP (p = 0.716) and Q (p = 0.040) are not significant (p > 0.005). The quadratic terms EOP × EOP (p = 0.000) are significant (p < 0.05), whilst the other quadratic terms Q × Q (p = 0.647) and TL × TL (p = 0.292) have a poor fit and are considered non-significant (p > 0.05). Additionally, the interaction between the independent variables (EOP × Q, EOP × TL, and Q × TL) has no apparent impact on the AE (p > 0.005). Consequently, it may be concluded that the proposed model satisfactorily matches the results of the experiments (Pareek et al., 2023a,b).
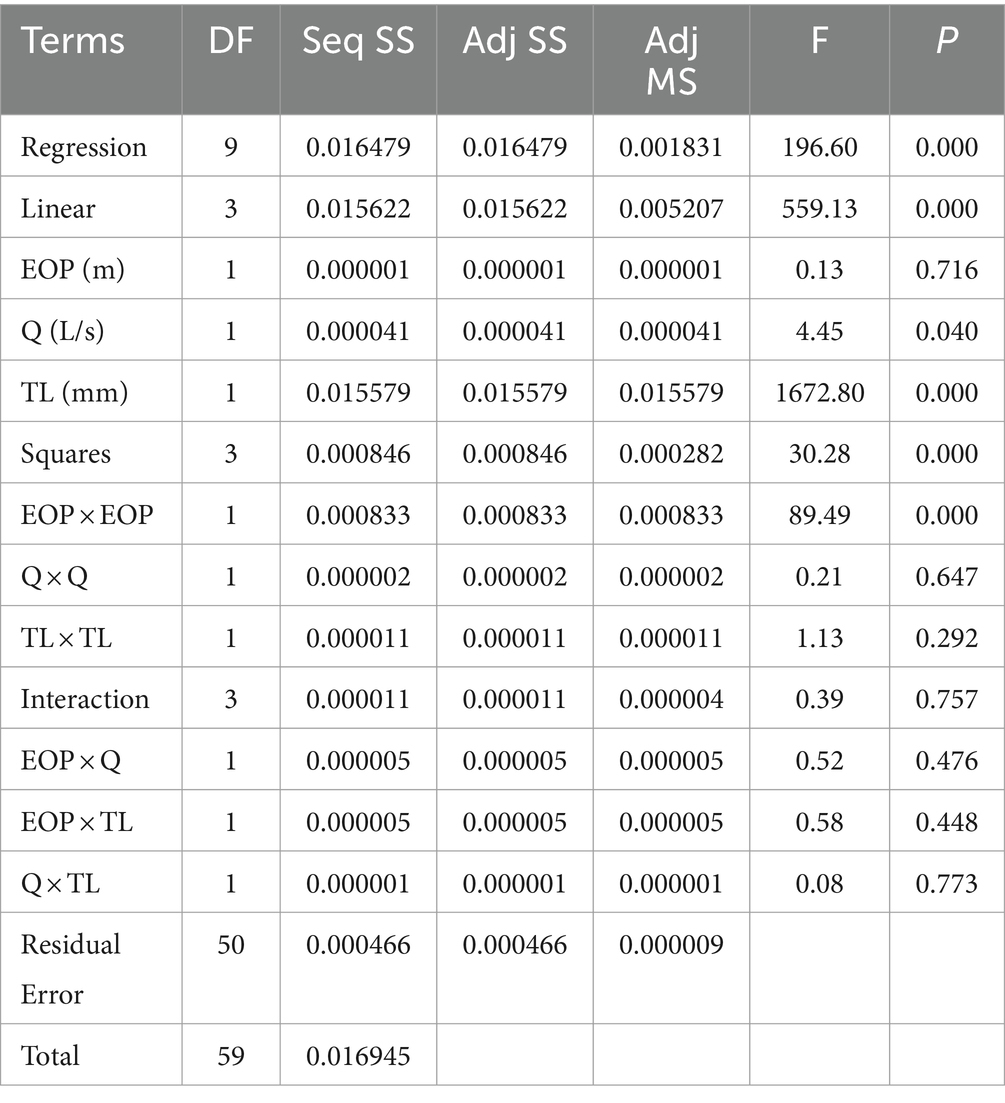
Table 3. ANOVA for AE (kgO2/kWh).
Artificial neural network (ANN), which gets their inspiration from the way the human brain functions, may be used to predict outcomes for a variety of activities, including analytical and numerical modelling involving a variety of data types. The ANN depends on an awareness of the statistical fundamentals of the events underlying the procedure, and it has significant benefits over traditional modelling approaches (Figure 5). The development of the best back-propagation training technique, the establishment of the appropriate number of neurons, and verifying and testing the model, all three processes were employed to develop the perfect ANN modelling structure (Kedia et al., 2022). The ANN aims to predict available capabilities using real data by replicating the organic nervous system, which replicates data on somebody’s cognitive processes. The ANN often results in an inundation of previous experience data. Once the model was successfully constructed using the trial and error method, the minimum MSE was found between the target value and the ANN model’s forecast value of AE (Yadav and Roy, 2023). The neural network correlation network indicates the projected and targeted datasets, i.e., the training dataset, the testing dataset, and the complete experimental dataset for the ANN model as shown in Figure 5. The ANN model’s coefficient value of R2 for the training dataset, the validation dataset, the testing dataset, and the overall prediction was observed to be 0.98855, 0.97891, 0.98320, and 0.98545, respectively (Figure 5). From Figure 5, the R2 value between the measured and anticipated responses for the data analysis phases (training, validation, and testing) is close to 1. Hence, the implementation of the ANN was deemed to be very satisfying and robust to estimate the AE values. The highest possible AE value of 0.1050 kg O2/kWh was found using the expected TL, EOP, and Q values of 50 mm, 6 m, and 0.6 L/s, respectively.
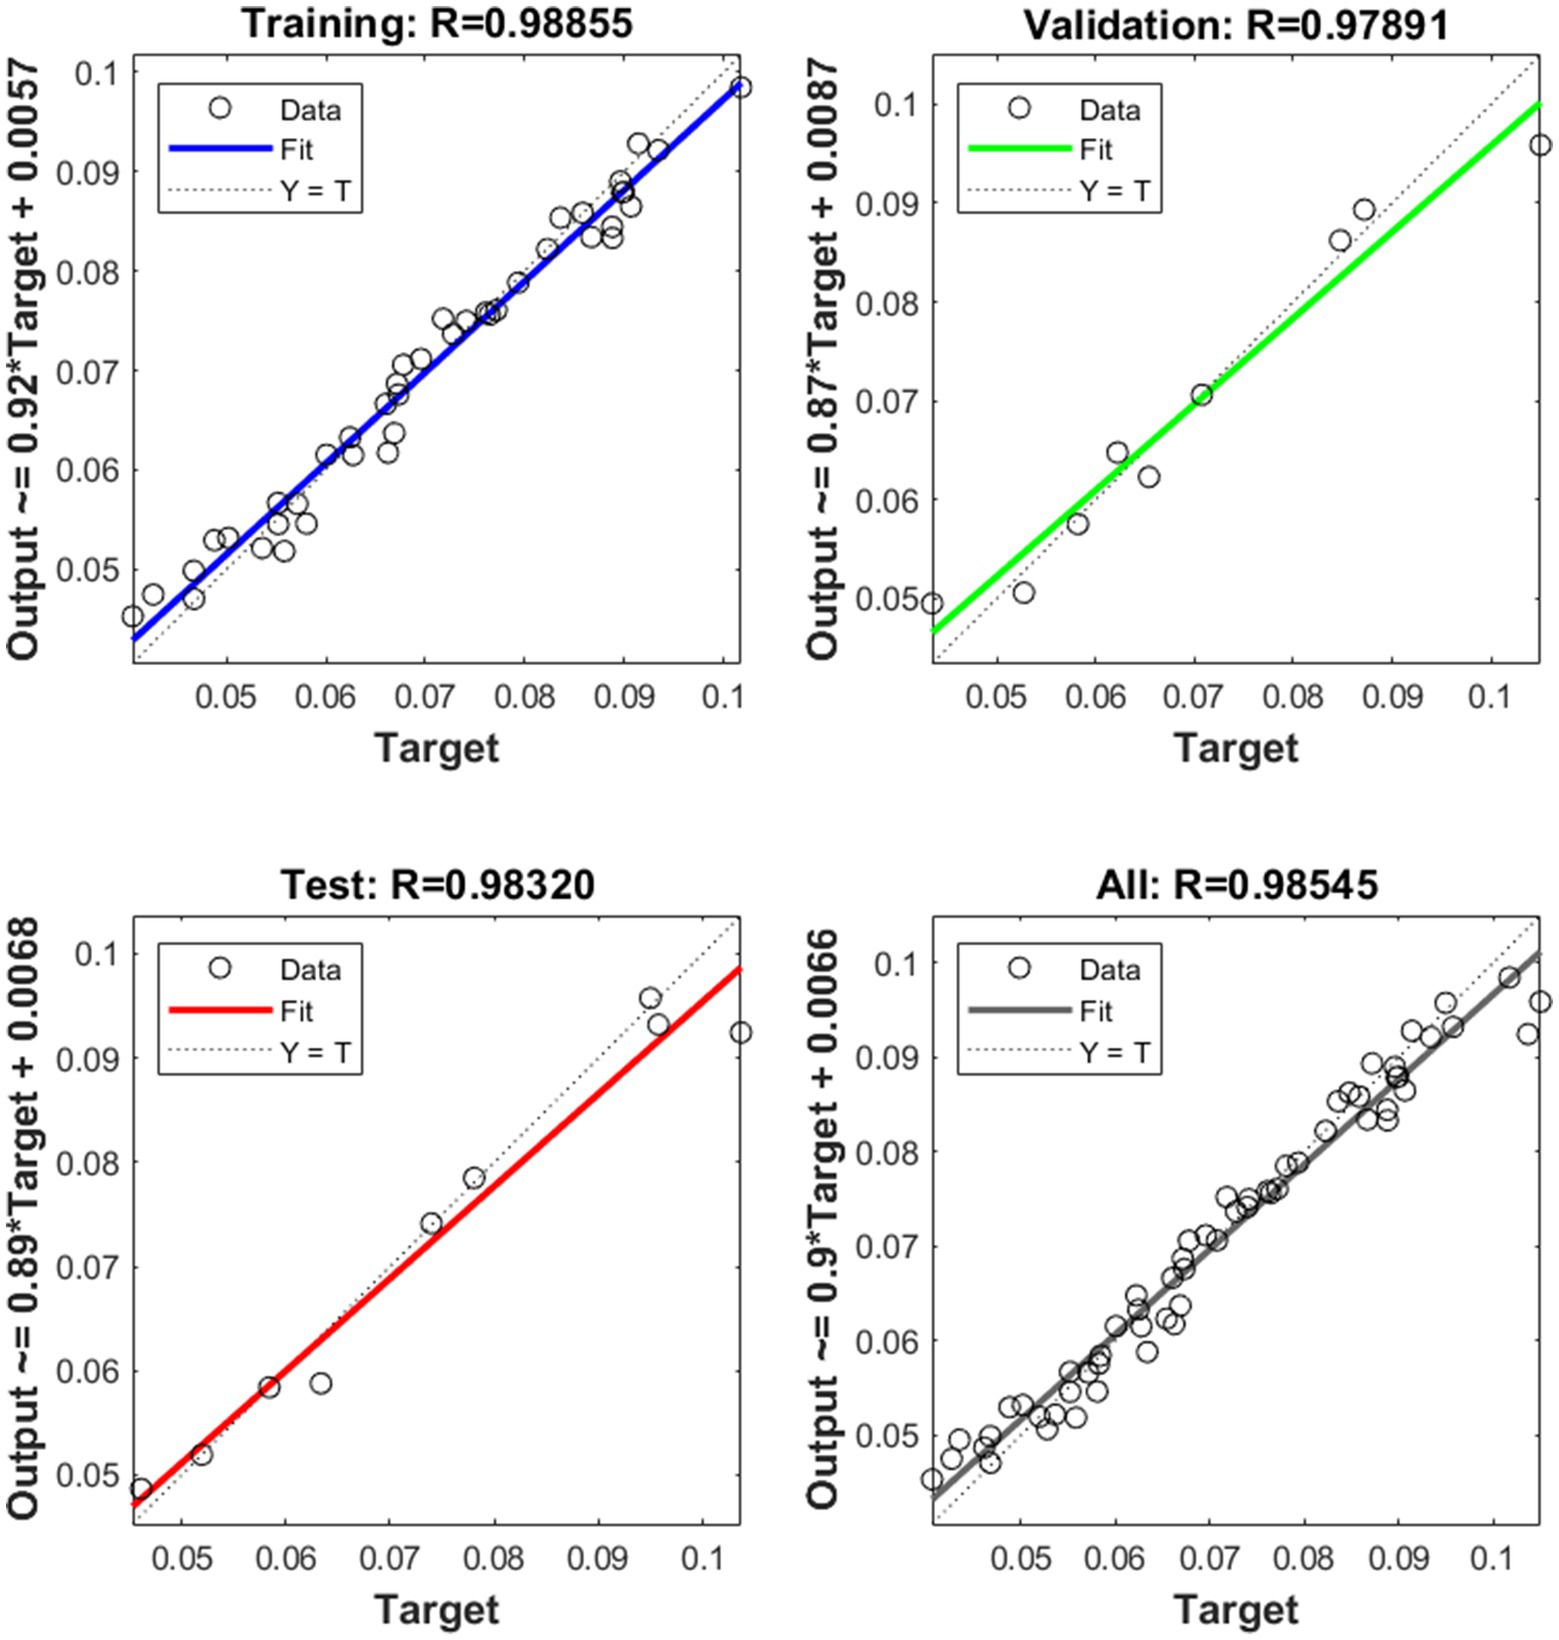
Figure 5. Training, validation, test, and overall scatter plots of ANN model for various stages.
The MSE versus the number of epochs is displayed and is presented in Figure 6. In epoch 8, the value 0.000016445 represents the prime substantial performance. During the training phase, the neural network divides the source and target dataset into three individual data, i.e., training, validation, and testing samples. Using training samples, the network is instructed, and variables are changed in response to errors. The network’s ability to make predictions is assessed using validation samples, and training ceases when it hits the point of saturation. Furthermore, network evaluation is performed before, during, and after training using testing data. Figure 6 shows a green, blue, and red line for validation, training, and testing, respectively. The green colour of the ring circle denotes the network’s peak validation effectiveness. On the other hand, the generalisation comes to an end and the training is ended after 19 epochs. It changes throughout retraining as a result of the network regularly splitting the source and target datasets.
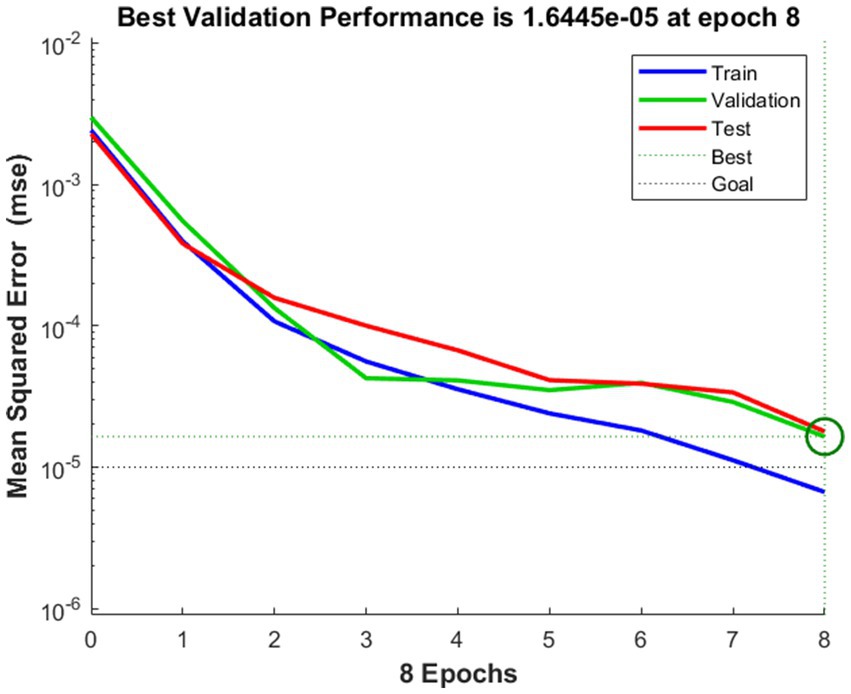
Figure 6. The best validation graph of the network.
Figure 7 displays training state plots for the gradient values, mutation (mu), and validation cheques for ANN. A gradient depicts the tangent’s slope on a function graph. It suggests that there is a rapid rate of increase in the direction that the parameter under consideration is moving. Error convergence is directly influenced by the back-propagation neural network that was constructed to use the controlling parameter called mutation (mu). A validation cheque halted the learning process of the neural network. A variety of validation tests will be carried out based on how frequently the neural network is iterated (Roy et al., 2023). The gradient’s magnitude and the number of validation cheques needed to end the training are displayed in Figure 7A. As training approaches the performance threshold, the gradient becomes very small. The training phase will end if the gradient’s magnitude is less than 0.00001, which can be modified by adjusting the parameter. The mutation is shown against the increasing number of iterations in Figure 7B. This graphic demonstrates how training improves and the network error decreases. Based on Figure 7C, the number of validation cheques indicates how many rounds the validation performance fails to decline in succession. The training will end once this number hits 8 in the current scenario.
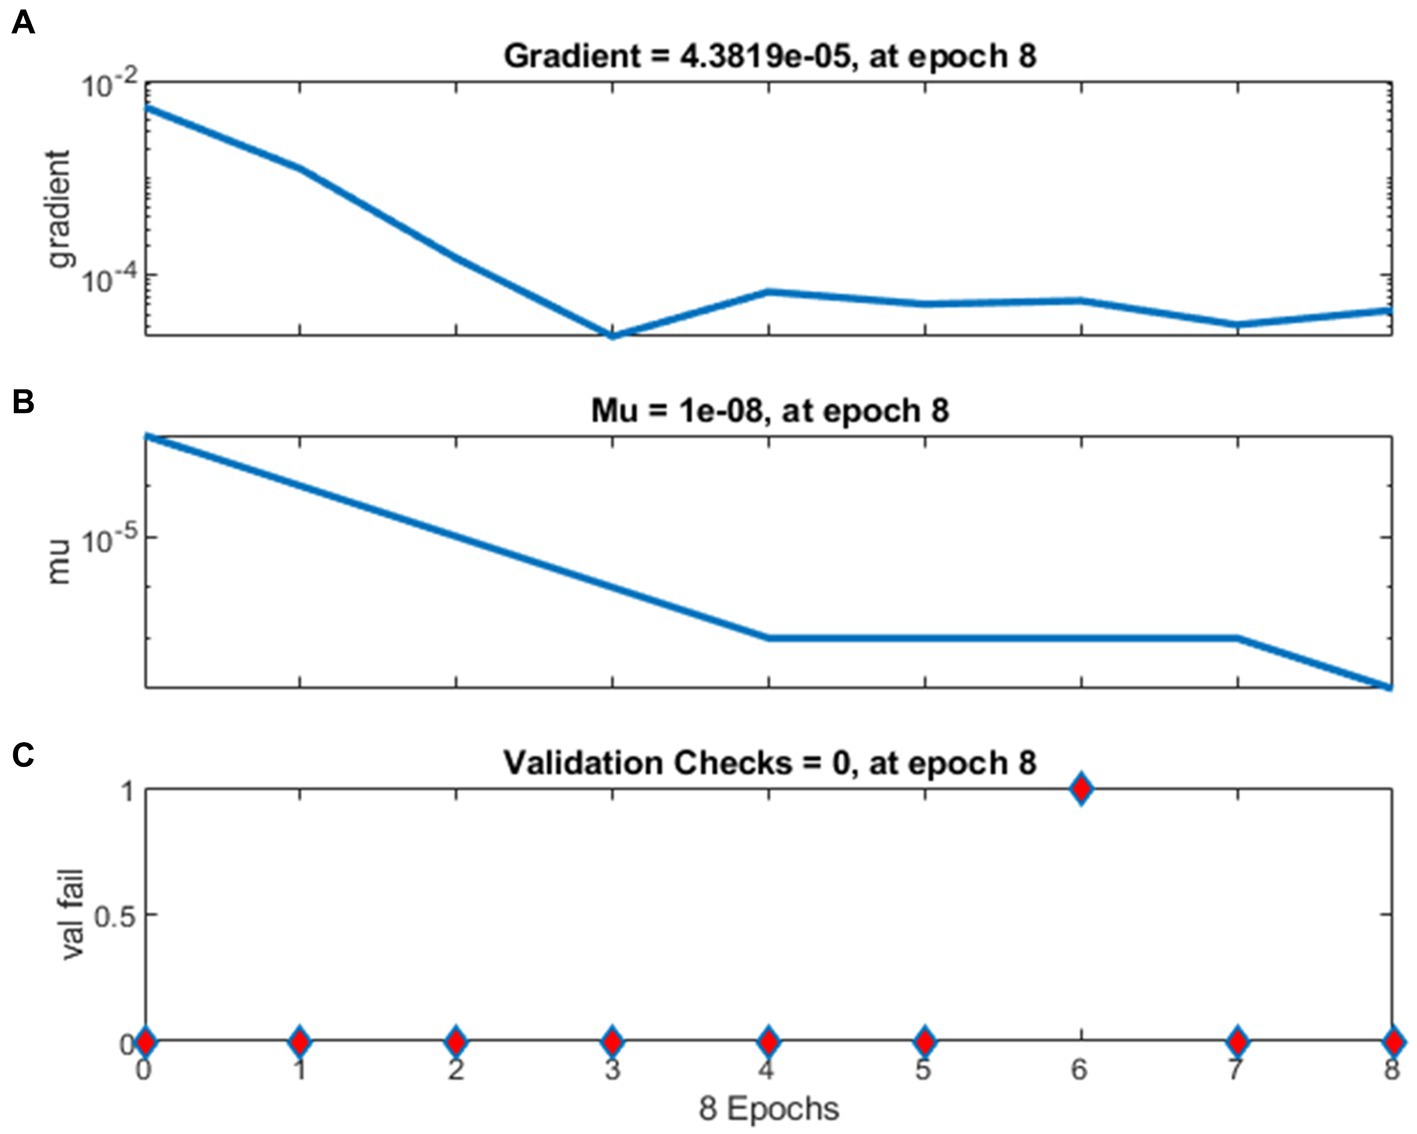
Figure 7. Training state plots for (A) gradient, (B) mutation, and (C) validation cheques.
The design parameters (TL and EOP) and operational parameters (Q) of the venturi aeration system were optimised using the most reliable prediction model and PSO in order to obtain the highest acceptable AE. The PSO algorithm scatters its elements all over a hyperdimensional search area. Every cluster member serves as an alternate solution to the optimisation problem by evaluating the desired function at that member’s present location. Engelbrecht (2007) defined that the positioning of elements within the search region is altered in accordance with people’s social-psychological propensity to imitate others’ accomplishments. Every single particle in a cluster is therefore driven for movement by fusing some aspect of its previous existence with the expertise of those around it.
The developed ANN-PSO and ANN-GA models were predicted and compared based on statistical characteristics datasets of training and testing by model parameters, i.e., R2, RMSE, and MAE. Table 4 displays these model evaluation indicators of created models. The high R2 value for training and testing and the low value of RMSE and MAE indicate the significant performance of two values between experimental AE values.
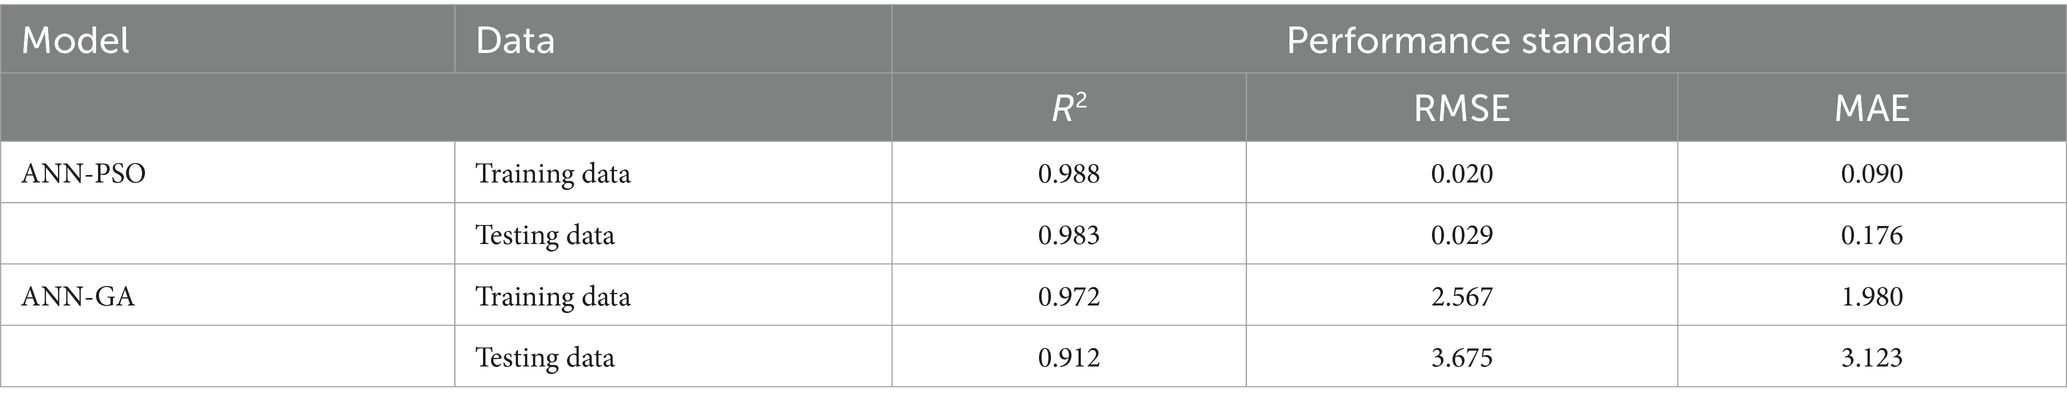
Table 4. Performance indicators of the ANN models in the prediction of aeration efficiency.
The ANN-PSO model has a high R2 value for training and testing and a low value of RMSE and MAE compared to the ANN-GA model indicating a better prediction of AE values. Therefore, it can be concluded that the performance of ANN-PSO is better than ANN-GA. Table 5 displays and compares the optimal parameters produced by the combined ANN-PSO and ANN-GA methods. The developed models ANN-PSO and ANN-GA are used to select the suitable operating conditions and aids to find out the AE of the venturi aerator. A maximum deviation of 5.714% of the anticipated and actual values of AE from ANN-PSO is presented in Table 5.
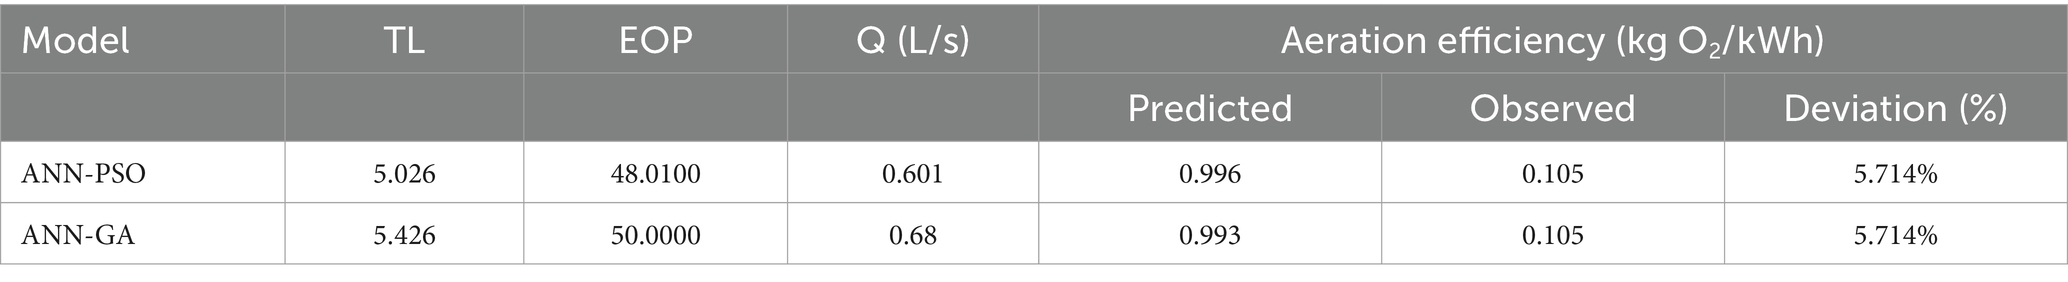
Table 5. Optimised limits by ANN-PSO and ANN-GA.
Table 6 displays the optimum parameters using the combined ANN-PSO method, which has been compared with the results of the earlier experimental research study (Yadav and Roy, 2023). The created ANN-PSO model may be used to estimate the accessible aeration effectiveness of the venturi aeration system and to determine the proper operating parameters.

Table 6. A comparison of the SAE values of the integrated ANN-PSO technique with the previous dataset.
The combined effect of operating parameters as EOP and TL on AE is shown in Figure 8, the combined effect of EOP and Q on AE is shown in Figure 9, and the combined effect of Q and TL on AE is shown in Figure 10. It can be clearly seen from Figure 8 that the AE steadily rises with the increase in the extended outlet pipe (EOP) from 2 m to 6 m and then drops again to 8 m of EOP. It can also be found that the AE rises rapidly with increasing throat length (TL) up to 50 mm. This is due to the fact that by increasing the throat length (TL = 10 mm to 50 mm), more vacuum is created that facilitates the maximum pressure reduction resulting in more oxygen transfer rate and aeration efficiency. When the effective outlet pipe increases, the air bubbles get dispersed resulting in the reduction of aeration efficiency. The maximum AE was found at 6 m EOP and 50 mm TL.
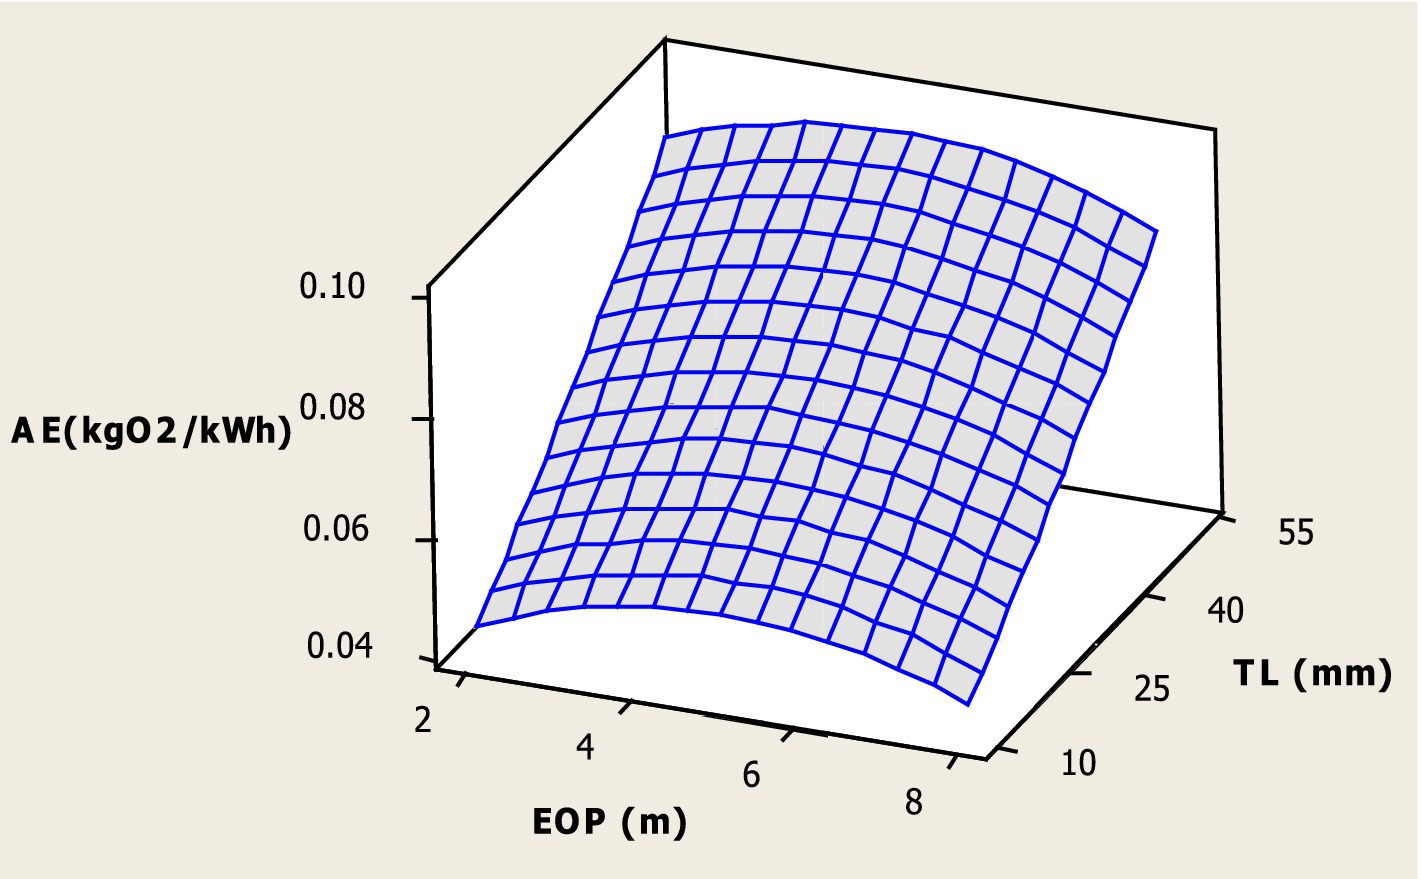
Figure 8. Interactive response surface plot of EOP and TL on SAE.
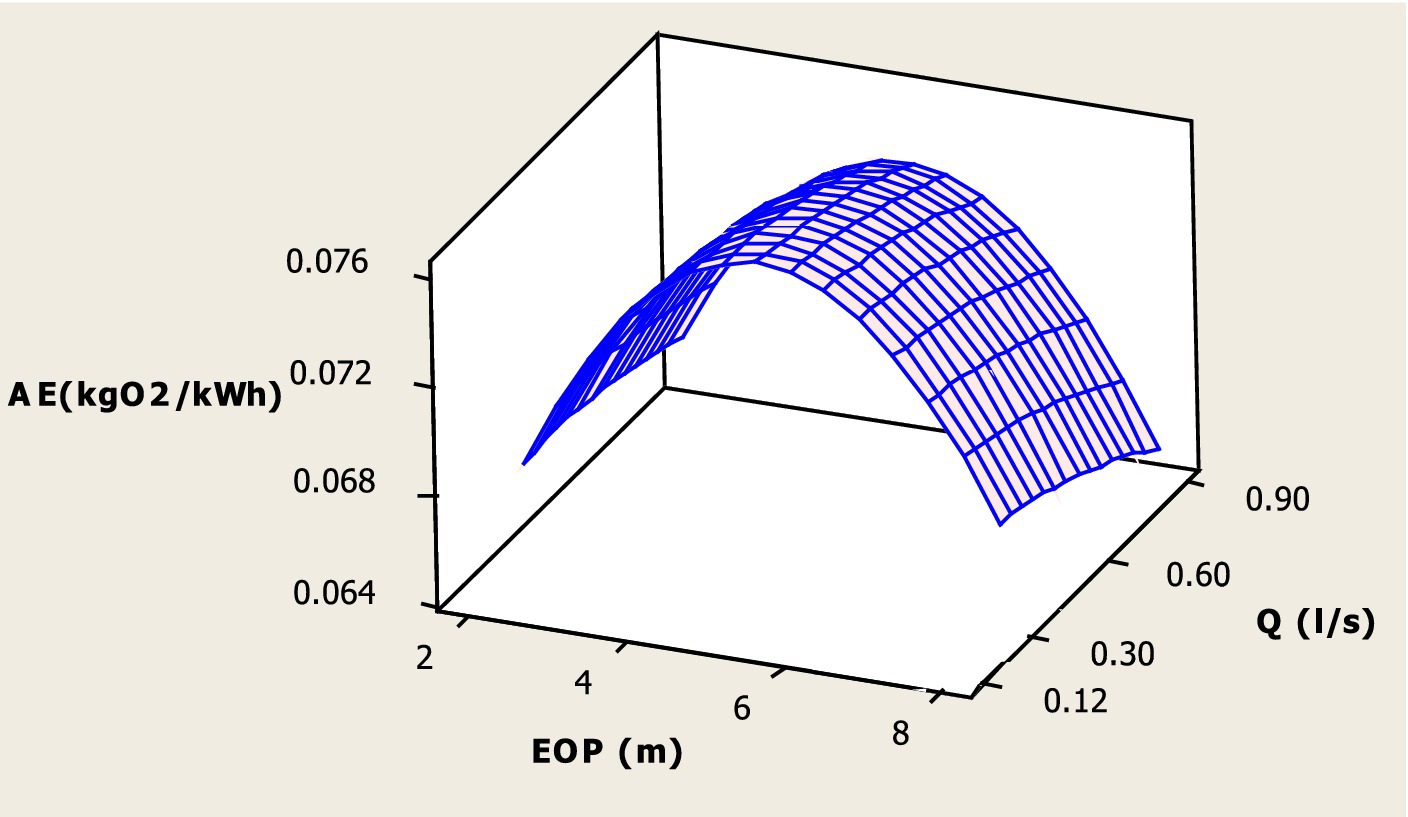
Figure 9. Interactive response surface plot of EOP and Q on SAE.
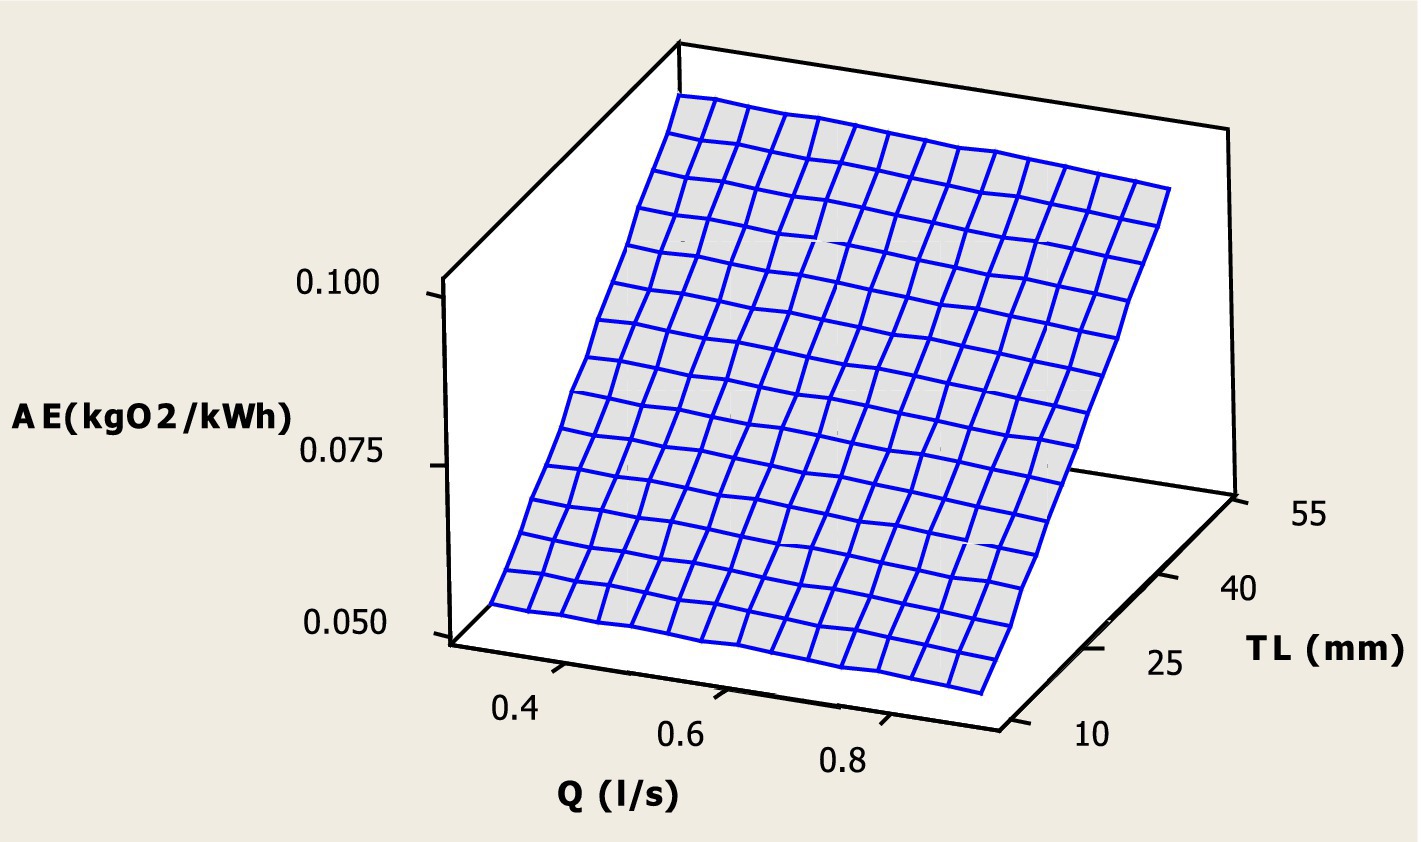
Figure 10. Interactive response surface plot of Q and TL on SAE.
Figure 9 shows a relation between EOP and Q on AE. It can be seen from Figure 9 that AE increases with the increasing EOP up to 6 m. However, after 6 m of EOP, the AE values decline when it reaches to the maximum EOP of 8 m. In addition, it was found the AE values are influenced by varying the flow rate (Q). The AE value increases with an increase in Q value up to 0.6 L/s. For further increase in the Q from 0.6 L/s to 0.9 L/s, the AE starts to decrease mainly at the EOP of 8 m. This is due to the fact that the increasing discharges create more turbulence and aid in enhancing the transfer rate of oxygen. Furthermore, at the maximum 8 m EOP, inserted air bubbles get dispersed without affecting the oxygen transfer, which reduces the AE of the venturi. Therefore, it can be concluded that the Q is primarily responsible for transferring air into the water (Yadav et al., 2021).
Furthermore, the effect of Q and TL on AE is presented in Figure 10. Figure 10 indicates very clearly that with an increase in the TL of the venturi, the AE increases at every increasing Q. The maximum AE value was found at 50 mm of TL for all increasing flow rates (Q = 0.3 L/s, 0.6 L/s, and 0.9 L/s). The reason behind that the increasing TL provides a high air entrainment rate, that obvious improves the oxygen transfer capability of the venturi with the increasing Q. The maximum SAE value was determined to be 0.105 kg O2/kWh, when operating at 0.6 L/s flow rate with a 6 m effective output pipe and a 50 mm throat length of the venturi.
The venturi aeration system and its applications have been constrained by several challenges related to air entrainment in water and wastewater treatment. The challenges associated with air bubble formation limit the ability to produce stable fine bubbles in large quantities as existing techniques sometimes require expensive specialist equipment (Yuan et al., 2024). Furthermore, this study may be expanded to highlight the restrictions on turbulence that occurs in the throat section of the venturi, by capturing the intricate cavitation phenomena. By clarifying the difficulties encountered in applying turbulence models to air entrainment via venturi systems, this study offers a foundation for further research endeavours focussed on optimising mathematical expressions (Devkota et al., 2024). This methodical technique can significantly increase numerical simulation accuracy and bring computational findings more closely aligned with empirical data. The results of this study will assist in simulating aeration efficiency through venturi aeration by helping to choose the most suitable venturi settings in the fields of aquaculture and wastewater treatment. This may help to enhance the functionality and design of the venturi. The results of this study might be helpful in the design and improvement of industrial systems that employ the aeration phenomena. Furthermore, this study might serve as a starting point for further investigations into the technical and industrial uses of venturi systems and their design and optimisation.
The effectiveness of the venturi aeration system has been introduced as an effective optimisation strategy for evaluating the aeration efficiency (AE) using hybrid prediction modelling techniques, i.e., artificial neural network–particle swarm optimisation (ANN-PSO) and artificial neural network–genetic algorithm (ANN-GA). From the developed ANN integrated with PSO and GA, the operating parameters, i.e., TL, EOP, and Q, were optimised at 50 mm, 6 m, and 0.6 L/s, respectively, in order to maximise the AE. The highest AE was found as 0.105 kgO2/kWh to exist under optimal operating circumstances. From the overall finding, it can be concluded that the performance of ANN-PSO is better than ANN-GA, due to the accuracy of ANN-PSO being more based on a 5.714% deviation. The suggested hybrid model is also easy to use and can take into consideration an inclusive range of factors affecting the efficacy of aerators. The developed ANN-PSO and ANN-GA models may be utilised to determine the optimal operating parameters for different aerators and anticipate the aeration efficiency of the venturi aerator. Notably, the integrated model’s primary constraint is its applicability to particular regions that are similar or that have only slight variations under any of the circumstances.
The raw data supporting the conclusions of this article will be made available by the authors, without undue reservation.
AY: Conceptualization, Data curation, Formal analysis, Investigation, Methodology, Project administration, Resources, Software, Supervision, Validation, Visualization, Writing – original draft, Writing – review & editing. SR: Conceptualization, Data curation, Formal analysis, Methodology, Validation, Visualization, Writing – review & editing. AB: Conceptualization, Data curation, Formal analysis, Methodology, Resources, Software, Supervision, Validation, Visualization, Writing – original draft, Writing – review & editing. BS: Investigation, Project administration, Software, Supervision, Validation, Visualization, Writing – review & editing. SM: Data curation, Formal analysis, Investigation, Resources, Software, Supervision, Validation, Visualization, Writing – review & editing.
The author(s) declare that no financial support was received for the research, authorship, and/or publication of this article.
The authors declare that the research was conducted in the absence of any commercial or financial relationships that could be construed as a potential conflict of interest.
All claims expressed in this article are solely those of the authors and do not necessarily represent those of their affiliated organizations, or those of the publisher, the editors and the reviewers. Any product that may be evaluated in this article, or claim that may be made by its manufacturer, is not guaranteed or endorsed by the publisher.
APHA . (1985). Standard methods for the examination of water and wastewater, 16th Edn. Washington, DC: APHA.
ASCE . (2007). Standard measurement of oxygen transfer in clean water. Virginia: American Society of Civil Engineers.
Bagatur, T., and Onen, F. (2014). A predictive model on air entrainment by plunging water jets using GEP and ANN. KSCE J. Civ. Eng. 18, 304–314. doi: 10.1007/s12205-013-0210-7
Baylar, A., and Emiroglu, M. (2003). Air entrainment and oxygen transfer in a venturi. Proc. ICE Water Marit. Eng. 156, 249–255. doi: 10.1680/wame.2003.156.3.249
Baylar, A., and Ozkan, F. (2006). Applications of venturi principle to water aeration systems. Environ. Fluid Mech. 6, 341–357. doi: 10.1007/s10652-005-5664-9
Boyd, C. E. (1998). Pond water aeration systems. Aquac. Eng. 18, 9–40. doi: 10.1016/S0144-8609(98)00019-3
Boyd, C. E., and Ahmad, T. (1987). Evaluation of aerators for channel catfish farming, bulletin 584. Alabama: Alabama Agricultural Experiment Station, Auburn University, p. 52.
Cheng, X., Xie, Y., Zhu, D., and Xie, J. (2019). Modeling re-oxygenation performance of fine-bubble–diffusing aeration system in aquaculture ponds. Aquac. Int. 27, 1353–1368. doi: 10.1007/s10499-019-00390-6
Dayev, Z., Shopanova, G., Toksanbaeva, B., Yetilmezsoy, K., Sultanov, N., Sihag, P., et al. (2022). Modeling the flow rate of dry part in the wet gas mixture using decision tree/kernel/non-parametric regression-based soft-computing techniques. Flow Meas. Instrum. 86:102195. doi: 10.1016/j.flowmeasinst.2022.102195
Dayıoğlu, M. A. (2022). Experimental study on design and operational performance of solar-powered venturi aeration system developed for aquaculture–a semi-floating prototype. Aquac. Eng. 98:102255. doi: 10.1016/j.aquaeng.2022.102255
Devkota, H. R., Jha, D. K., Joshi, T. P., and Shrestha, S. (2024). Applications of Nanobubble aeration Technology for Aquaculture Practices: a review. Nepal. J. Agric. Sci. :223.
Eberhart, E., and Shi, Y. (2001). Particle swarm optimization: Developments, applications and resources. Proceedings of the 2001 congress on evolutionary computation (IEEE cat. No.01TH8546), Seoul, Korea (south). 81–86.
Engelbrecht, A. P. (2007). Computational intelligence: An introduction. 2nd Edn. West Sussex: John Wiley and Sons Ltd.
FAO . (2019). The state of food and agriculture 2019. Moving forward on food loss and waste reduction. Rome: FAO, p. 182.
Garg, A., and Jain, S. (2020). Process parameter optimization of biodiesel production from algal oil by response surface methodology and artificial neural networks. Fuel 277:118254. doi: 10.1016/j.fuel.2020.118254
Ghomi, M. R., Sohrabnejad, M., and Ovissipour, M. R. (2009). An experimental study of nozzle diameters, aeration depths and angles on standard aeration efficiency (SAE) in a venturi aerator. Water Pract. Technol. 4, 1–8. doi: 10.2166/wpt.2009.043
Ghose, A., Gupta, D., Nuzelu, V., Rangan, L., and Mitra, S. (2023). Optimization of laccase enzyme extraction from spent mushroom waste of Pleurotus florida through ANN-PSO modeling: an ecofriendly and economical approach. Environ. Res. 222:115345. doi: 10.1016/j.envres.2023.115345
Gupta, B., Nayak, A. K., Kandar, T. K., and Nair, S. (2016). Investigation of air–water two phase flow through a venturi. Exp. Thermal Fluid Sci. 70, 148–154. doi: 10.1016/j.expthermflusci.2015.07.012
Haykin, S. (1999). Neural network: A comprehensive foundation. Englewood Cliffs, NJ: Prentice-Hall Inc..
Jun, L. Y., Karri, R. R., Yon, L. S., Mubarak, N. M., Bing, C. H., Mohammad, K., et al. (2020). Modeling and optimization by particle swarm embedded neural network for adsorption of methylene blue by jicama peroxidase immobilized on buckypaper/polyvinyl alcohol membrane. Environ. Res. 183:109158. doi: 10.1016/j.envres.2020.109158
Karri, R. R., and Sahu, J. N. (2018). Modeling and optimization by particle swarm embedded neural network for adsorption of zinc (II) by palm kernel shell based activated carbon from aqueous environment. J. Environ. Manag. 206, 178–191. doi: 10.1016/j.jenvman.2017.10.026
Kedia, N. K., Kumar, A., and Singh, Y. (2022). Prediction of underground metro train-induced ground vibration using hybrid PSO-ANN approach. Neural Comput. Applic. 35, 8171–8195. doi: 10.1007/s00521-022-08093-5
Kumar, M., Raghuwanshi, N. S., Singh, R., Wallender, W. W., and Pruitt, W. O. (2002). Estimating evapotranspiration using artificial neural network. J. Irrig. Drain. Eng. 128, 224–233. doi: 10.1061/(ASCE)0733-9437(2002)128:4(224)
Kumar, M., Ranjan, S., and Tiwari, N. K. (2018). Oxygen transfer study and modeling of plunging hollow jets. Appl Water Sci 8:740. doi: 10.1007/s13201-018-0740-8
Lawson, T. B., and Merry, G. E. (1993). Procedures for evaluating low-power surface aerators under field conditions, in: Techniques for modern aquaculture. Proceedings of an Aquacultural Engineering Conference, ASAE, Michigan, USA, p. 511.
Lewis, W. K., and Whitman, W. G. (1924). Principles of gas absorption. Ind. Eng. Chem. Res. 16, 1215–1220. doi: 10.1021/ie50180a002
Li, J. J., Song, Y. C., Yin, J. L., and Wang, D. Z. (2017). Investigation on the effect of geometrical parameters on the performance of a venturi type bubble generator. Nucl. Eng. Des. 325, 90–96. doi: 10.1016/j.nucengdes.2017.10.006
Luk, K. C., Ball, J. E., and Sharma, A. (2001). An application of artificial neural networks for rainfall forecasting. Math. Comput. Model. 33, 683–693. doi: 10.1016/S0895-7177(00)00272-7
Luxmi, K. M., Tiwari, N. K., and Ranjan, S. (2022). Application of soft computing approaches to predict gabion weir oxygen aeration efficiency. ISH J. Hydraul. Eng. 29, 244–258. doi: 10.1080/09715010.2022.2050311
Mahmud, R., Erguvan, M., and MacPhee, D. W. (2020). Performance of closed loop venturi aspirated aeration system: experimental study and numerical analysis with discrete bubble model. Water 12, 16–37. doi: 10.3390/w12061637
Metcalf, L., Eddy, H. P., and Tchobanoglous, G. (1979). Wastewater engineering: Treatment, disposal, and reuse, New York: McGraw-Hill.
Mjalli, F. S., Al-Asheh, S., and Alfadala, H. E. (2007). Use of artificial neural whites network black-box modeling for the prediction of wastewater treatment plants performance. J. Environ. Manag. 83, 329–338. doi: 10.1016/j.jenvman.2006.03.004
Mohanty, S., Jha, M. K., Kumar, A., and Sudheer, K. P. (2010). Artificial neural network modeling for groundwater level forecasting in a river island of eastern India. Water Resour. Manag. 24, 1845–1865. doi: 10.1007/s11269-009-9527-x
Navisa, J., Sravya, T., Swetha, M., and Venkatesan, M. (2014). Effect of bubble size on aeration process. Asian J. Sci. Res. 7, 482–487. doi: 10.3923/ajsr.2014.482.487
Omary, R., Li, H., Tang, P., Issaka, Z., and Chao, C. (2020). Review of venturi injector application technology for efficient fertigation in irrigation system. Int. J. Curr. Microbiol. App. Sci. 9, 46–61. doi: 10.20546/ijcmas.2020.901.006
Omid, M., Asghar, M., and Omid, M. H. (2009). An intelligent system for sorting pistachio nut varieties. Expert Syst. Appl. 36, 11528–11535. doi: 10.1016/j.eswa.2009.03.040
Onen, F. (2014). Prediction of penetration depth in a plunging water jet using soft computing approaches. Neural Comput. & Applic. 25, 217–227. doi: 10.1007/s00521-013-1475-y
Pareek, C. M., Singh, N., Tewari, V. K., Dhruw, L. K., and Singh, H. D. (2023a). Classification of broken maize kernels using artificial neural network-assisted image-processing approach. J. Biosyst. Eng. 48, 55–68. doi: 10.1007/s42853-022-00173-7
Pareek, C. M., Tewari, V. K., and Machavaram, R. (2023b). Multi-objective optimization of seeding performance of a pneumatic precision seed metering device using integrated ANN-MOPSO approach. Eng. Appl. Artif. Intell. 117:105559. doi: 10.1016/j.engappai.2022.105559
Pareek, C. M., Tewari, V. K., Machavaram, R., and Nare, B. (2021). Optimizing the seed-cell filling performance of an inclined plate seed metering device using integrated ANN-PSO approach. Artif. Intell. Agric. 5, 1–12. doi: 10.1016/j.aiia.2020.11.002
Pawar, N. A., Jena, J. K., Das, P. C., and Bhatnagar, D. D. (2009). Influence of duration of aeration on growth and survival of carp fingerlings during high density seed rearing. Aquaculture 290, 263–268. doi: 10.1016/j.aquaculture.2009.02.030
Roy, S. M., Jayraj, P., Machavaram, R., and Mal, B. C. (2021a). Diversified aeration facilities for effective aquaculture systems–a comprehensive review. Aquac. Int. 29, 1181–1217. doi: 10.1007/s10499-021-00685-7
Roy, S. M., Pareek, C. M., Kim, T., and Mal, B. C. (2023). Artificial intelligence-based approach for improving the aeration efficiency of a perforated plate aeration system. Multiscale Multidiscip. Model. Exp. Des. 1, 1–14. doi: 10.1007/s41939-023-00250-0
Roy, S. M., Pareek, C. M., Machavaram, R., and Mukherjee, C. K. (2022). Optimizing the aeration performance of a perforated pooled circular stepped cascade aerator using hybrid ANN-PSO technique. Inf. Proc. Agric. 9, 533–546. doi: 10.1016/j.inpa.2021.09.002
Roy, S. M., Tanveer, M., Gupta, D., Pareek, C. M., and Mal, B. C. (2021b). Prediction of standard aeration efficiency of a propeller diffused aeration system using response surface methodology and an artificial neural network. Water Supply 21, 4534–4547. doi: 10.2166/ws.2021.199
Roy, S. M., Tanveer, M., Mukherjee, C. K., and Mal, B. C. (2020). Design characteristics of perforated tray aerator. Water Supply 20, 1643–1652. doi: 10.2166/ws.2020.069
Rumelhart, D. E., Hinton, G. E., and Williams, R. J. (1986). Learning representations by back propagating errors. Nature 323:533. doi: 10.1038/323533a0
Sangeeta, S. R., and Tiwari, N. K. (2019). Aeration efficiency evaluation of modified small Parshall flume using M5P and adaptive neuro-fuzzy. Sustain. Eng. Proc. EGRWSE 30, 243–252. doi: 10.1007/978-981-13-6717-5_24
Sanghani, C. R., Jayani, D. C., Jadvani, N. R., Dobariya, H. N., and Jasoliya, K. R. (2014). Effect of geometrical parameters of venturimeter on pressure drop. Int J. Sci. Res. Sci. Eng. Technol. 2, 865–868.
Sihag, P., Dursun, O. F., Sammen, S. S., Malik, A., and Chauhan, A. (2021). Prediction of aeration efficiency of Parshall and modified venturi flumes: application of soft computing versus regression models. Water Supply 21, 4068–4085. doi: 10.2166/ws.2021.161
Sun, L. C., Mo, Z. Y., Zhao, L., Liu, H. T., Guo, X., Ju, X. F., et al. (2017). Characteristics and mechanism of bubble breakup in a bubble generator developed for a small TMSR. Ann. Nucl. Energy 109, 69–81. doi: 10.1016/j.anucene.2017.05.015
Wang, H., Wang, J., Li, G., Mo, Y., and Zhang, Y. (2022). Performance test of Venturi aerators for subsurface drip irrigation. J. Irrig. Drain. Eng. 148:06022001. doi: 10.1061/(ASCE)IR.1943-4774.0001660
Yadav, A., Kumar, A., and Sarkar, S. (2019). Design characteristics of venturi aeration system. Int. J. Innov. Technol. Explor. Eng. 8, 63–70. doi: 10.35940/ijitee.J9929.0981119
Yadav, A., Kumar, A., and Sarkar, S. (2020). An experimental study to evaluate the efficacy of air entrainment holes on the throat of a venturi aeration system. Aquac. Int. 28, 1057–1068. doi: 10.1007/s10499-020-00511-6
Yadav, A., Kumar, A., and Sarkar, S. (2021). Performance evaluation of venturi aeration system. Aquac. Eng. 93:102156. doi: 10.1016/j.aquaeng.2021.102156
Yadav, A., and Roy, S. M. (2023). An artificial neural network-particle swarm optimization (ANN-PSO) approach to predict the aeration efficiency of venturi aeration system. Smart Agric. Technol. 4:100230. doi: 10.1016/j.atech.2023.100230
Yang, H., Hasanipanah, M., Tahir, M. M., and Bui, D. T. (2020). Intelligentprediction of blasting-induced ground vibration using ANFIS optimized by GA and PSO. Nat. Resour. Res. 29, 739–750. doi: 10.1007/s11053-019-09515-3
Yuan, J., Zeng, T., Liu, Z., and Li, W. (2024). Experimental research on a gas liquid mixing oxygen increasing device based on microbubbles. Int. J. Mech. Elect. Eng. 2, 7–12. doi: 10.62051/ijmee.v2n1.02
Zhang, J. X. (2017). Analysis on the effect of venturi tube structural parameters on fluid flow. AIP Adv. 7:065315. doi: 10.1063/1.4991441
Keywords: venturi aeration, ANN-PSO, genetic algorithm, soft computing, optimisation
Citation: Yadav A, Roy SM, Biswas A, Swain B and Majumder S (2024) Modelling and prediction of aeration efficiency of the venturi aeration system using ANN-PSO and ANN-GA. Front. Water. 6:1401689. doi: 10.3389/frwa.2024.1401689
Edited by:
Rajneesh Singh, University of Minnesota Twin Cities, United StatesReviewed by:
Rohitash Yadav, Birsa Agricultural University, IndiaCopyright © 2024 Yadav, Roy, Biswas, Swain and Majumder. This is an open-access article distributed under the terms of the Creative Commons Attribution License (CC BY). The use, distribution or reproduction in other forums is permitted, provided the original author(s) and the copyright owner(s) are credited and that the original publication in this journal is cited, in accordance with accepted academic practice. No use, distribution or reproduction is permitted which does not comply with these terms.
*Correspondence: Abhijit Biswas, YWJoaS4wMjE5ODNAZ21haWwuY29t
†ORCID: Abhijit Biswas, https://orcid.org/0000-0002-4762-2101
Disclaimer: All claims expressed in this article are solely those of the authors and do not necessarily represent those of their affiliated organizations, or those of the publisher, the editors and the reviewers. Any product that may be evaluated in this article or claim that may be made by its manufacturer is not guaranteed or endorsed by the publisher.
Research integrity at Frontiers
Learn more about the work of our research integrity team to safeguard the quality of each article we publish.