 Michael Schramm
 Duncan Kikoyo
 Janelle Wright
 Shubham Jain
- Texas Water Resources Institute, Texas A&M AgriLife Research, College Station, TX, United States
Introduction: Best management practices (BMPs) are important tools for mitigating the impact of non-point source pollutants on water quality. Drivers of the high variance observed in BMP performance field tests are not well documented and present challenges for planning BMP construction and forecasting water quality improvements.
Methods: We conducted a systematic review of published nonpoint source water quality BMP studies conducted in the United States and used a meta-analysis approach to describe variance in pollutant removal performance. We used meta-regression to explore how much BMP pollutant removal process, influent pollutant concentration, and aridity effected BMP performance.
Results: Despite high variance, we found the BMPs on average were effective at reducing fecal indicator bacteria (FIB), total nitrogen (TN), total phosphorus (TP), and total suspended sediment (TSS) concentrations. We found that influent concentration and interaction effect between the BMP pollutant removal process and aridity explained a substantial amount of variance in BMP performance in FIB removal. Influent concentration explained a small amount of variability in BMP removal of TP and orthophosphate (PO4). We did not find evidence that any of our chosen variables moderated BMP performance in nitrogen or TSS removal. Through our systematic review, we found inadequate spatial representation of BMP studies to capture the underlying variability in climate, soil, and other conditions that could impact BMP performance.
1 Introduction
In the United States (U.S.), major improvements in water quality have been achieved under the Clean Water Act of 1972. This progress has been largely attributed to investments and reductions in point source discharges while reduction in nonpoint source pollutants remains a substantial challenge (National Research Council, 2001; Benham et al., 2008; Schramm et al., 2022). Increased pollutant loads and concentrations in runoff resulting from land use changes are a particular challenge. The impacts of land use change on hydrology and water quality are well established (Carpenter et al., 1998; Allan, 2004; Bernhardt et al., 2008; Carey et al., 2013; Freeman et al., 2019). Nonpoint source driven fecal indicator bacteria (FIB), nitrogen, phosphorus, and suspended sediment remain major causes of water quality impairments in U.S. rivers and streams despite decades of work. In 2017, the Environmental Protection Agency (EPA) estimated 41% or more of the nation's rivers and streams rated poorly for biological condition due to excess nitrogen or phosphorus (EPA, 2017). FIB remains the leading cause of water body impairment on the Clean Water Act 303 (d) list in the United States (EPA, 2017). Approximately 15% of river and streams have excessive sedimentation, which leads to twice the likelihood of a stream to have poor biological condition (EPA, 2017).
Best management practices (BMPs) have been the primary suite of tools for addressing nonpoint source pollution. BMPs are structural or non-structural controls used to mitigate the effects of increased runoff volume, pollutant loads, or pollutant concentrations emanating from diffuse nonpoint sources. BMPs control the delivery of pollutants through a few possible mechanisms. Structural BMPs (detention pond or vegetated filter strips as examples) reduce and retard total volume of runoff, thus reducing both the volume of water and pollutant load. Structural BMPs may also provide a mechanism for physical, chemical, or biological removal of pollutant constituents suspended or dissolved in runoff. Non-structural BMPs (such as nutrient management or livestock management) are utilized to reduce the generation of pollutant runoff by avoiding pollutant generation during critical periods.
Practitioners rely extensively on mechanistic models to plan and evaluate BMP scenarios and resulting water quality. Lintern et al. (2020) found 43% of reviewed BMP effectiveness studies relied completely on modeled outputs, with modeled outputs almost always predicting water quality improvements following BMP implementation. However, field studies are much more likely to demonstrate mixed results including net releases (leaching) of pollutants under certain conditions (Liu et al., 2017; Lintern et al., 2020). The disconnect between modeled outcomes and field studies might be attributed to (1) overly simplified or incorrect estimates of model parameters that represent management practices (Ullrich and Volk, 2009; Fu et al., 2019; Lintern et al., 2020), (2) the failure to incorporate the appropriate types of uncertainty into estimates (Tasdighi et al., 2018; Fu et al., 2019; Lintern et al., 2020), and (3) the assumption of static performance over time (Meals et al., 2010; Liu et al., 2017; Fu et al., 2019).
An underlying source of uncertainty comes from the substantial variability of performance metrics reported in empirical BMP studies (Lintern et al., 2020). There have been varied attempts at synthesizing estimates of BMP efficiency to provide resource managers with knowledge for improved decision-making (Agouridis et al., 2005; Barrett, 2008; Simpson and Weammert, 2009; Clary et al., 2011; Kroger et al., 2012; Koch et al., 2014; Liu et al., 2017; Grudzinski et al., 2020; Horvath et al., 2023). These reviews generally describe high variability and uncertainty in nitrogen and phosphorus removal and consistent reduction in total suspended sediment concentrations across BMP types (Barrett, 2008; Clary et al., 2011; Koch et al., 2014; Liu et al., 2017; Grudzinski et al., 2020; Lintern et al., 2020). The review literature on the effects of BMPs on FIBs are sparse but generally find extremely high variance in performance across BMPs (Clary et al., 2011; Grudzinski et al., 2020).
While it is assumed that site specific conditions are responsible for some of the heterogeneity in observed BMP performance, it is not clear how much of that variance is due to any one specific factor. Influent concentration is likely to have some effect on certain types of structural BMPs. Barrett (2005) demonstrated that percent pollutant reduction is often a function of influent quality. Specifically, for certain types of BMPs percent removal is low at low influent concentrations, and increases with increasing influent concentrations. Horvath et al. (2023) found that influent phosphorus concentrations had some explanatory ability for BMP performance among grass strips, bioretnetion, and grass swale BMPs. However, for some types of BMPs, such as media filters and permanently pooled retention basins (Barrett, 2005), effluent concentration is unrelated to influent concentration. Second, local climatic conditions can be expected to influence BMP performance. BMPs in dry climates have been shown to be more likely to leach phosphorus than those in wetter climates (Horvath et al., 2023). However, elucidating possible confounders such as climate and soil condition has been constrained by the lack of reported local condition data included in most BMP studies (Koch et al., 2014; Eagle et al., 2017; Horvath et al., 2023). The age and upkeep of BMPs is a third factor in BMP performance. On one hand, the observed effects from BMPs are a function of various physical and biological processes that vary in the time required to produce desired reductions, especially as the spatial scale of the deployed project increases (Meals et al., 2010). These “lag times” between implementation and effect, which can be multiple years, have been shown to vary between parameter and BMP type (Meals et al., 2010). On the other hand the ability of BMPs to function effectively may also change over time. There has not been overwhelming published evidence to demonstrate the change or lack of change in BMP performance over time (Liu et al., 2017). Many of the papers and data available for assessing BMP performance are short term monitoring project, typically around 1 year or less in length (Koch et al., 2014; Liu et al., 2017), suggesting our ability to assess the long-term performance of BMPs is limited.
Results from BMP studies are often reported as BMP efficiency (or percent reduction):
where xcontrol is the pre-treatment or control pollutant concentration and xexperiment is the pollutant concentration measured after the BMP intervention. Several BMP data synthesis efforts have applied statistical summaries or regressions using BMP efficiency as the response variable of interest (Agouridis et al., 2005; Simpson and Weammert, 2009; Clary et al., 2011; Kroger et al., 2012; Koch et al., 2014; Liu et al., 2017). There are several statistical shortcomings (distributional asymmetry, skewness, and non-additive properties) when using efficiency to estimate overall effect sizes across multiple studies that are cause for concern for metrics estimated using this approach (Cole and Altman, 2017; Nuzzo, 2018). Barrett (2005) demonstrated the use of effluent concentration directly as a response variable improved the ability to describe BMP performance. More recently, researchers have applied effect size calculations more commonly used in ecological meta-analysis. Horvath et al. (2023) used the standardized mean difference between influent and effluent, calculated as the difference in the means divided by the pooled standard deviation of the two groups (Hedges and Olkin, 1985). Grudzinski et al. (2020) applied the log ratio of means (ROM) to summarize performance of livestock BMPs. ROM quantifies the difference in means between the control and experimental group (Hedges et al., 1999):
where xi, control and xi, experiment are the mean pollutant concentrations for experiment i. The statistical properties of ROM (normal distribution around zero and additive properties) are preferable to using BMP efficiency (Osenberg et al., 1997; Hedges et al., 1999). ROM >0 indicates higher percent reductions and ROM <0 indicates pollutant leaching. One advantage of ROM is that the statistical results calculated using ROM are easily transformed to BMP efficiency for interpretation:
Building on previous work, the objectives of this paper are to (1) assess the general performance of BMPs in the published literature, and (2) identify relationships between BMP performance and potential effect size moderators. To accomplish this, we conducted a systematic review of relevant published literature and applied a meta-analytic approaches to develop weighted results across studies and identify variables that explain heterogeneity in BMP performance. Based on the existing literature we hypothesized that influent pollutant concentration, BMP type, and climate condition are influential in BMP performance and could be used to predict effluent concentration or percent reductions.
2 Methods
We conducted a systematic review of recent (2000-2022) literature to compile U.S. field studies documenting the effectiveness of best management practices on fecal indicator bacteria, nutrient, and TSS concentrations. Prior meta-analysis have utilized data reported in the International Stormwater BMP Database (https://bmpdatabase.org/), which consists of self-reported and quality checked BMP data (Clary et al., 2011; Koch et al., 2014; Horvath et al., 2023). The International Stormwater BMP Database only recently added agricultural BMPs and has relatively sparse FIB data (Clary et al., 2011; Koch et al., 2014). Since we had interest in both FIB performance and agricultural BMPs we chose to utilize a systematic review.
The systematic review followed guidance provided in the Collaboration for Environmental Evidence systematic review guidelines (Collaboration for Environmental Evidence, 2018). In order to maximize the number of studies included in the review, we included both peer-reviewed studies and unpublished white papers to reduce potential bias against negative results. The inclusion criteria filtered out (1) non-field studies, (2) modeling results, (3) studies that did not evaluate specific BMPs, (4) studies conducted outside of the U.S. or published in a language other than English. We ran search queries in Texas A&M Library Catalog, Web of Science, and Google Scholar. Although results from Google Scholar are not always replicable, we utilized the service to maximize search results for studies not published in academic journals and presumably increase the chance of identifying studies with negative effects. Fecal indicator bacteria study searches included the following query: “fecal indicator bacteria” OR “E. coli” OR “Escherichia coli” OR “enterococci” OR “enterococcus” AND “best management practices” OR “BMPs” AND “effectiveness” OR “performance”. Nutrient BMP studies utilized a similar query: “nutrient” OR “nitrogen” OR “phosphorus” OR “sediment” OR “TSS” AND “best management practices” OR “BMPs” AND “effectiveness” OR “performance”.
Results from each database were first filtered to remove duplicates. After removal of duplicates, each member of the research team (n = 4) was assigned a subset of studies to evaluate if they should be included (Table 1). Each study was reviewed by two team members and differences in opinion were collectively discussed and agreed upon before progressing. The remaining studies were split among team members for data extraction (Table 2), again with at least two team members reviewing each study. Study locations were recorded as latitude and longitude coordinates as described in studies. If coordinates were not provided, the study team used Google Maps to locate approximate study location using site descriptions (county, city, municipal buildings, etc.) from the study and recorded the coordinates. If data was provided in figures, the data was extracted with the WebPlotDigitizer tool (Rohatgi, 2022). Searches, review, and data extractions were conducted separately for FIB and nutrient related parameters. See Supplementary Figures S1, S2 for RepOrting standards for Systematic Evidence Syntheses (ROSES) diagram. BMP data from the systematic review is available in Kikoyo et al. (2024).
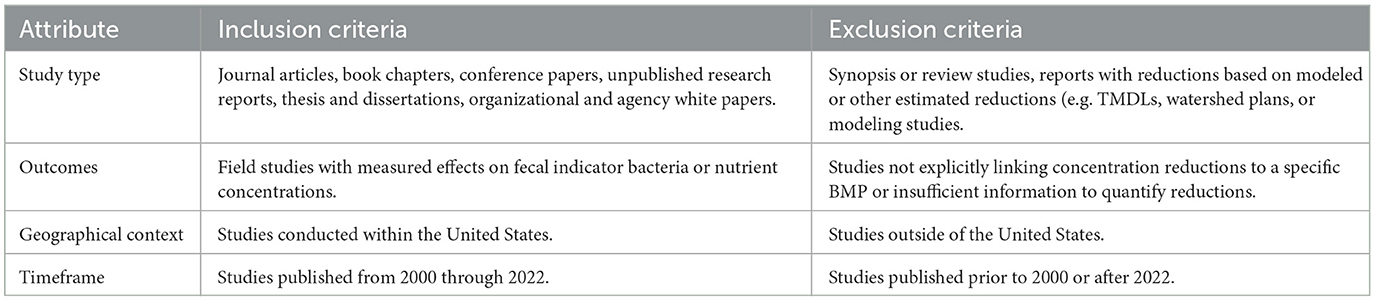
Table 1. Criteria applied for including or excluding studies within the review database.
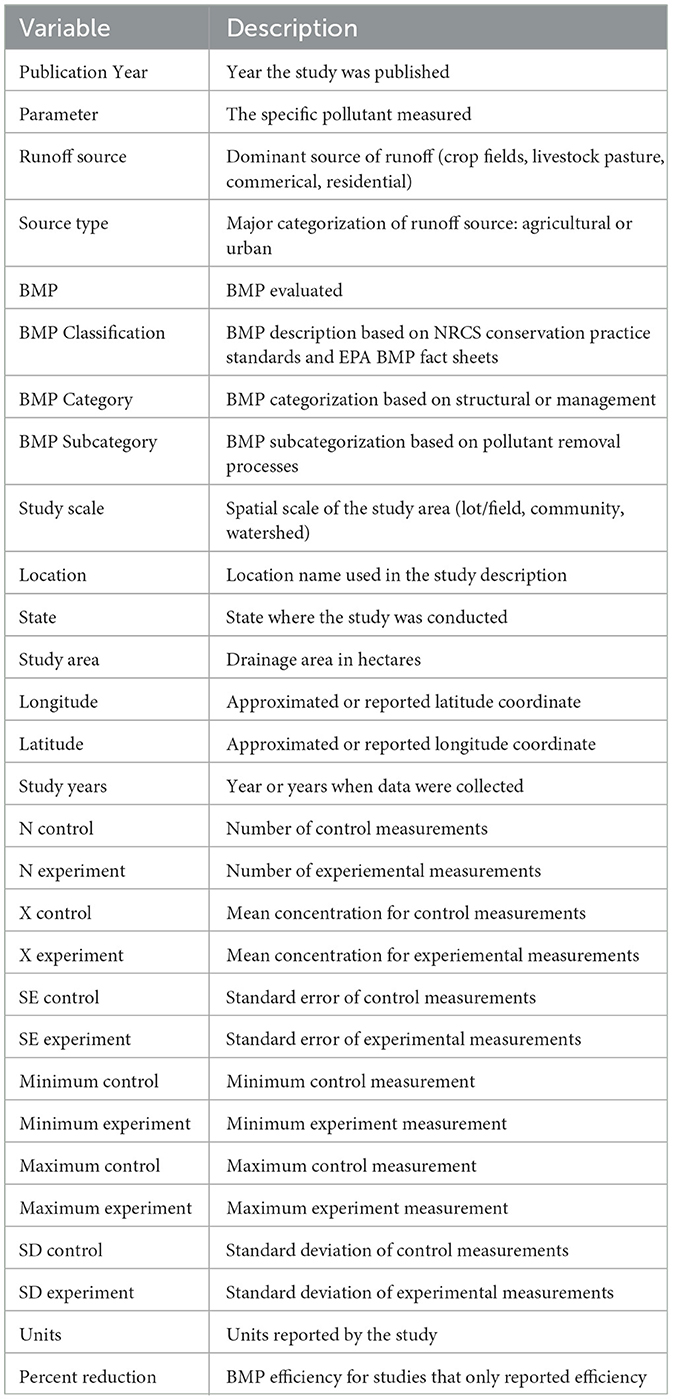
Table 2. Study and effect variables extracted for review.
2.1 Statistical models
We used the “rma.mv” function in the metafor R package (R version 4.3.1) to fit multilevel random effects regression models with ROM as the effect variable (Viechtbauer, 2010; R Core Team, 2023). We fit separate models for FIB, total nitrogen (TN), dissolved inorganic nitrogen (DIN), total phosphorus (TP), orthophosphate (PO4), and total suspended sediment (TSS). Our models specified a nested random effects term accounting for heterogeneity between effect sizes from the same study and for heterogeneity between studies. ROM was used as the effect size which required the exclusion of studies that only provided measures of BMP efficiency and not the underlying data used to derive the metric. A key feature of meta-analysis is the weighting of effects using sampling variance of individual effect sizes. Fifty-nine percent of 222 effect sizes were missing standard deviations required to estimate sampling variance. Removal of studies due to missing variance information can introduce substantial bias (Kambach et al., 2020). Missing standard deviations were imputed using the pooled ratio of the mean effect size to coefficient of variation (CV) (Bracken, 1992). Sampling variance was estimated utilizing the average squared CV across all studies divided by sample size for each effect (Doncaster and Spake, 2018; Nakagawa et al., 2023a):
where v represents the sampling variance, and are the squared coefficients of variation from the ith study for studies 1, 2, …, K. ncontrol and nexperiment are the number of samples in the control (pre-treatment) trial or experimental (post-treatment) trial respectively.
Our initial models included log transformed influent concentration, BMP subcategory (drainage modification, crop field management, livestock management, filtration, treatment, detention, or infiltration), aridity index (mean-centered), influent concentration × BMP subcategory interactions, and aridity index × BMP subcategory interactions were included as fixed effect terms. Aridity index was the only moderator not obtained directly in the systematic review (Table 2). We mapped study location coordinates to aridity index values published in the “Global Aridity Index and Potential Evapotranspiration Database - Version 3” (Global-AI_PET_v3) which provides gridded 30 arc-second annual average (annually averaged from 1970-2000) precipitation and potential evapotranspiration estimates (Zomer et al., 2022). The aridity index is calculated as the ratio of mean annual precipitation to mean annual potential (or reference) evapotranspiration with values between 0 and 0.5 considered hyper to semi-arid, and values above 0.65 as humid.
We used an information-theoretic approach to select the most parsimonious model from the subset of candidate models based on corrected Akaike information criterion (AICc) estimated with maximum likelihood (Cinar et al., 2021). Candidate models used for variable selection were fit with maximum likelihood (ML). The final model was selected from candidate models, which included all combination and subsets of the full model, by selecting the model with the lowest AICc score (Burnham et al., 2011; Cinar et al., 2021). Regression coefficients of the selected model were estimated using restricted maximum likelihood (REML). Relative heterogeneity between and within studies were calculated using the I2 metric described in Nakagawa and Santos (2012). Marginal R2 was used to describe the amount of variance explained by fixed effects (Nakagawa and Schielzeth, 2013).
We tested for evidence of publication bias, in the form of small study effect, by using the extension of Egger's regression applied to the multilevel model framework that included adjusted sampling error as a moderator (Nakagawa et al., 2023b). We did not identify evidence of publication bias in the surveyed studies (FIB: ROM = 1.19, 95% CI [-3.23, 5.61]; TN: ROM = 0.31, 95% CI [-1.15, 1.78]; DIN: ROM = -2.4, 95% CI [-6.14, 1.59]; TP: ROM = -1.97, 95% CI [-5.18, 1.23]; PO4: -0.05, 95% CI [-2.82, 2.72]; TSS: ROM: 0.31, 95% CI [-1.15, 1.78]; Supplementary Figures S3–S8); therefore, adjustments for publication bias were not included in the final models. We conducted a sensitivity analysis of the robustness of overall effect sizes to individual studies using leave-one-out analysis (Nakagawa et al., 2023b). This approach repeatedly fits the selected model leaving out an individual value each time. The overall effect and 95% CI from each refit model is compared to the overall effect and 95% CI of the model fit to the full dataset. We did not identify evidence of outliers or overly influential studies for any of our models (Supplementary Figures S9–S14). We also applied a sensitivity analysis to runoff source (agriculture and urban) and study catchment scale (community, lot, and watershed) and did not find evidence that these factors were especially influential to our results (Supplementary Figures S21–S32).
3 Results
3.1 Summary of BMP literature
Our systematic review identified a total of 33 studies and 125 effect sizes on FIB, 24 studies and 50 effect sizes on TN, 31 studies and 88 effect sizes for DIN, 31 studies and 61 effect sizes for TP, 17 studies and 36 effect sizes for PO4, and 33 studies with 125 effect sizes for TSS. The majority of studies were identified as smaller scaled lot or field studies (Figure 1A). FIB studies had a roughly equal proportion of large watershed/catchment studies and studies conducted at the community/farm scale or smaller. We also identified that the majority of studies (all parameters) were conducted on urban or non-agricultural runoff (Figure 1B). We did identify a wide variety of BMPs in the review, but it did not appear that any particular type of BMP was responsible for the majority of studies for any given parameter (Figure 2). Our review was restricted to studies published from 2000 through 2022. The number of studies published for each parameter were roughly uniformly distributed over time (Figure 3A) and are not indicative of increases or decreases in the number of published studies. Study length was strongly skewed for all parameters (Figure 3B). Median study lengths were 3 (DIN), 2 (FIB), 2.5 (PO4), 2.5 (TN), 2.5 (TP), and 2 (TSS) years. There appears to be a strong clustering of BMP studies in the mid-Atlantic region (North Carolina, Virginia, Maryland) with other states sparsely represented or completely absent from the review (Figure 4).
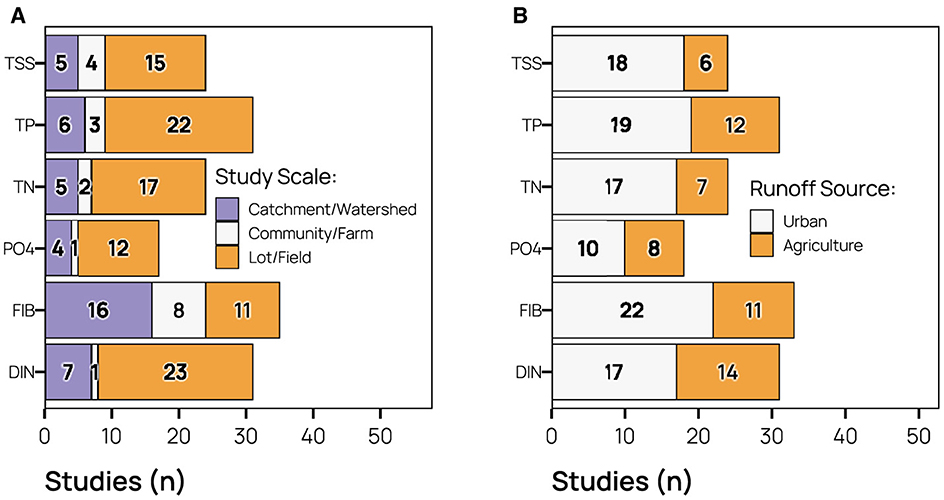
Figure 1. Summary of (A) study scale and (B) dominant runoff source. Water quality parameters include total suspended sediment (TSS), total phosphorus (TP), total nitrogen (TN), orthophosphate (PO4), fecal indicator bacteria (FIB), and dissolved inorganic nitrogen (DIN).
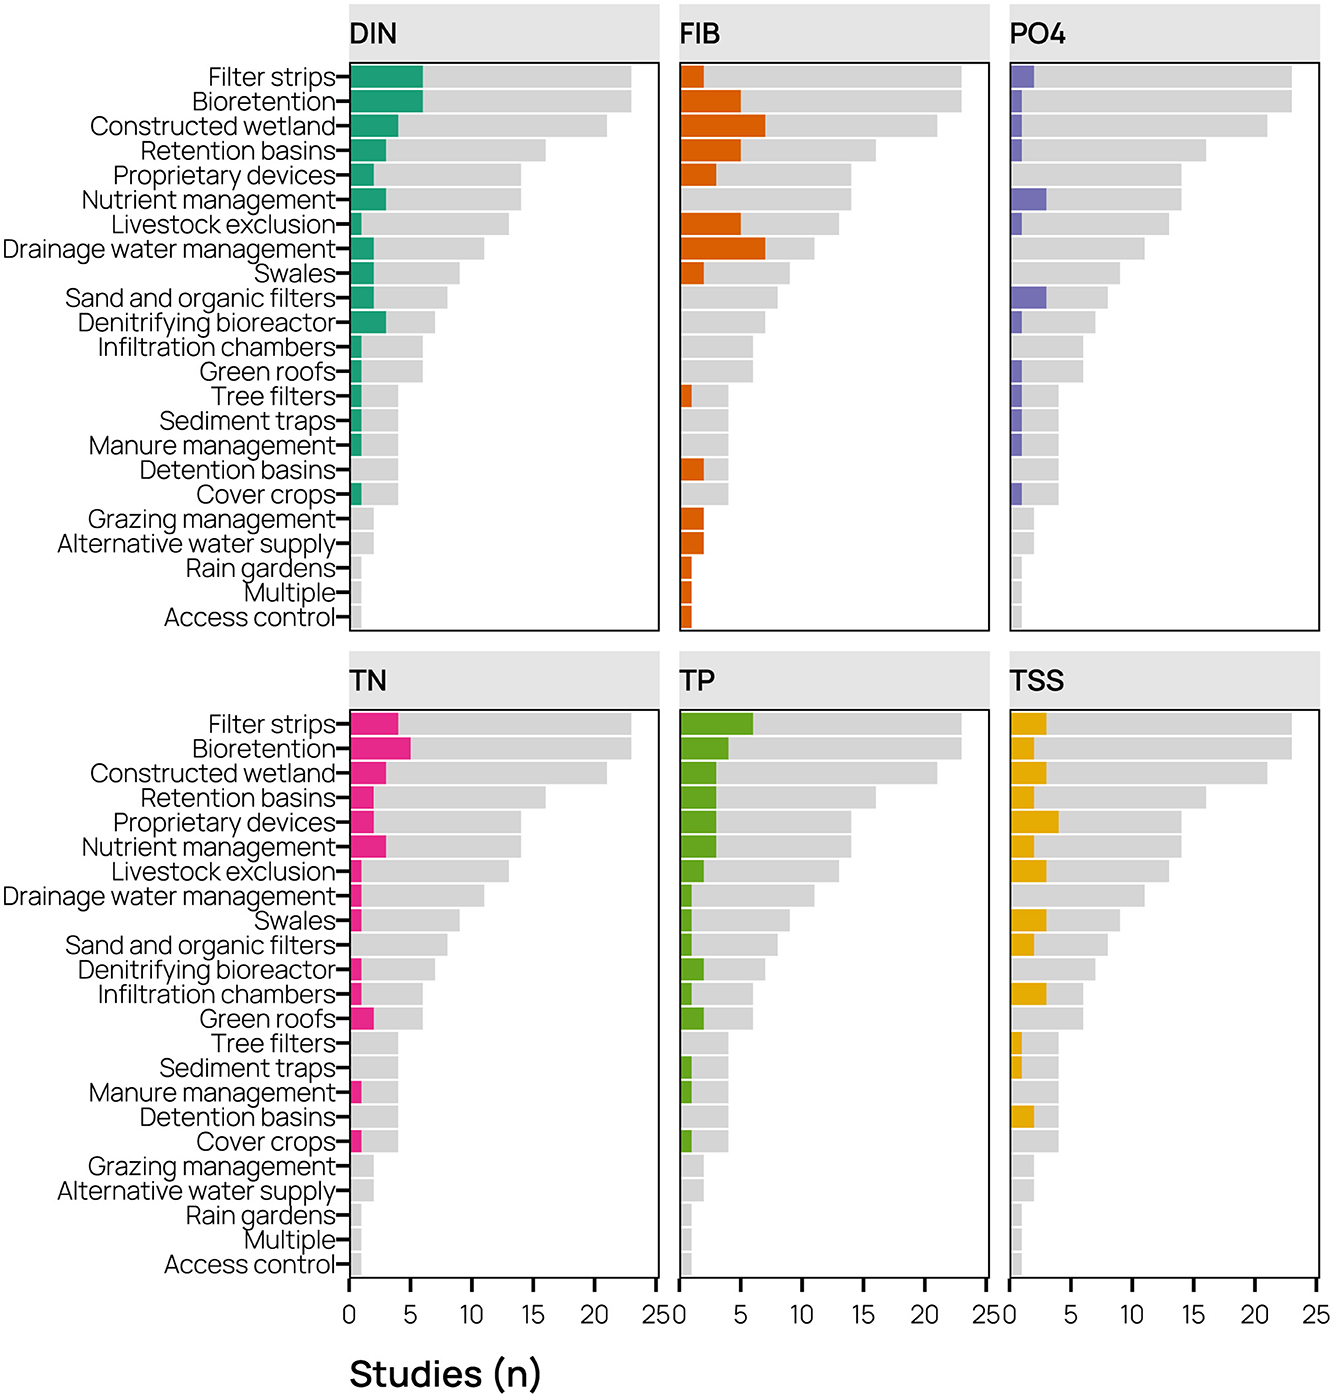
Figure 2. Summary of BMPs identified in the systematic review by tested parameter. Water quality parameters include total suspended sediment (TSS), total phosphorus (TP), total nitrogen (TN), orthophosphate (PO4), fecal indicator bacteria (FIB), and dissolved inorganic nitrogen (DIN).
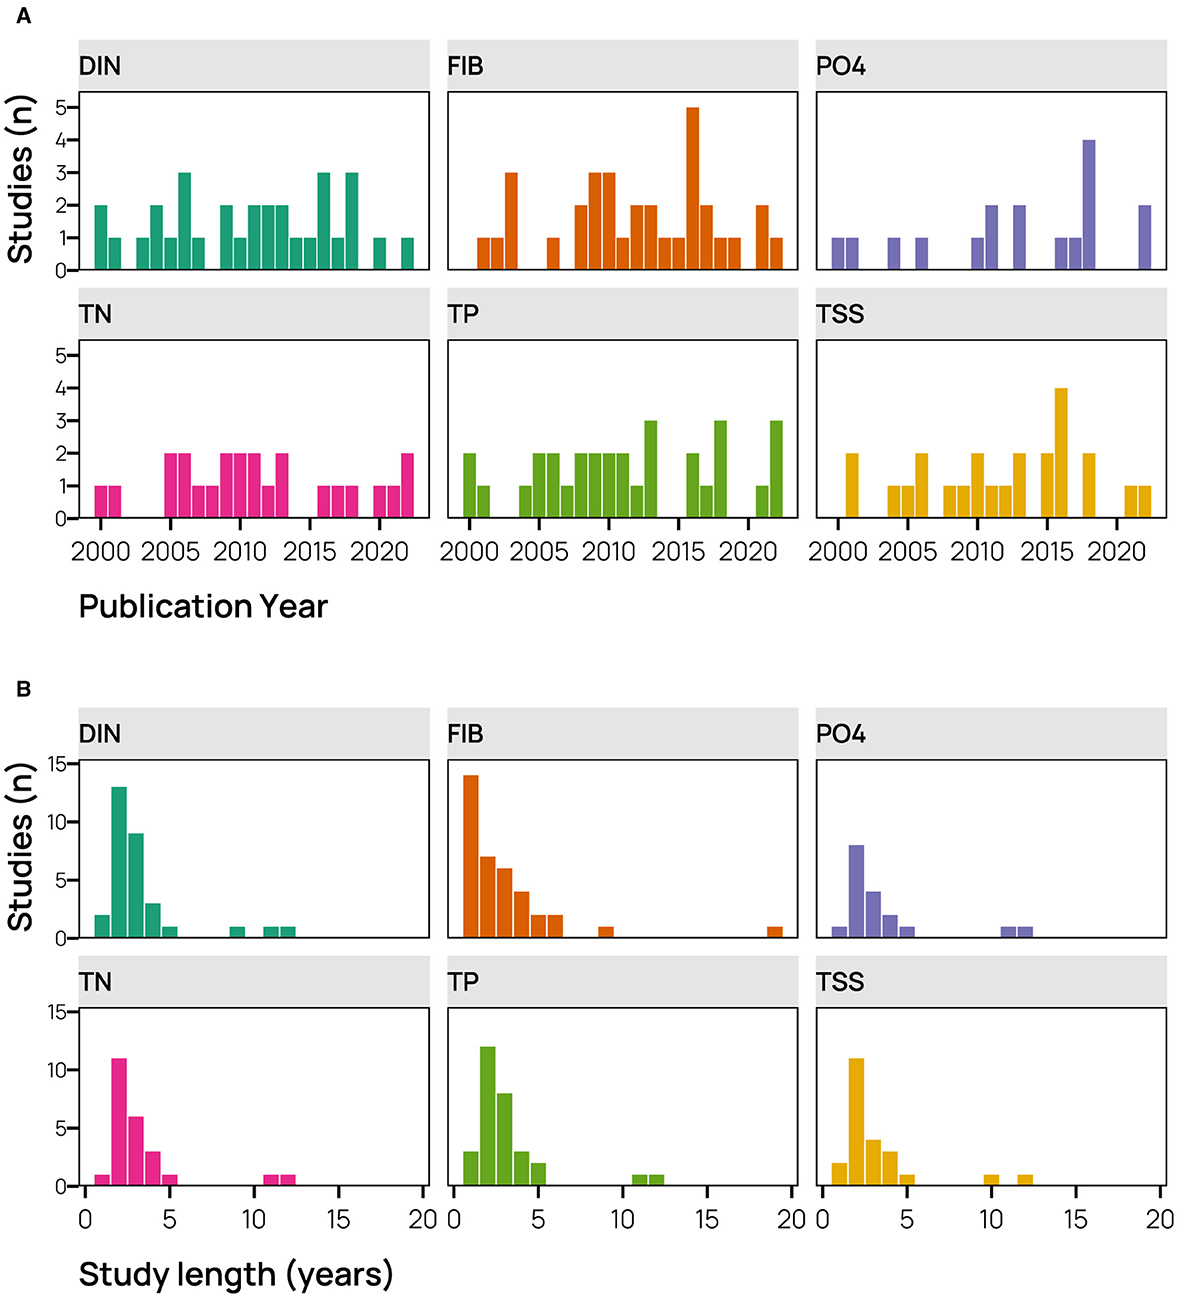
Figure 3. Number of studies identified in the systematic review summarized by (A) publication date and (B) study length. Water quality parameters include total suspended sediment (TSS), total phosphorus (TP), total nitrogen (TN), orthophosphate (PO4), fecal indicator bacteria (FIB), and dissolved inorganic nitrogen (DIN).
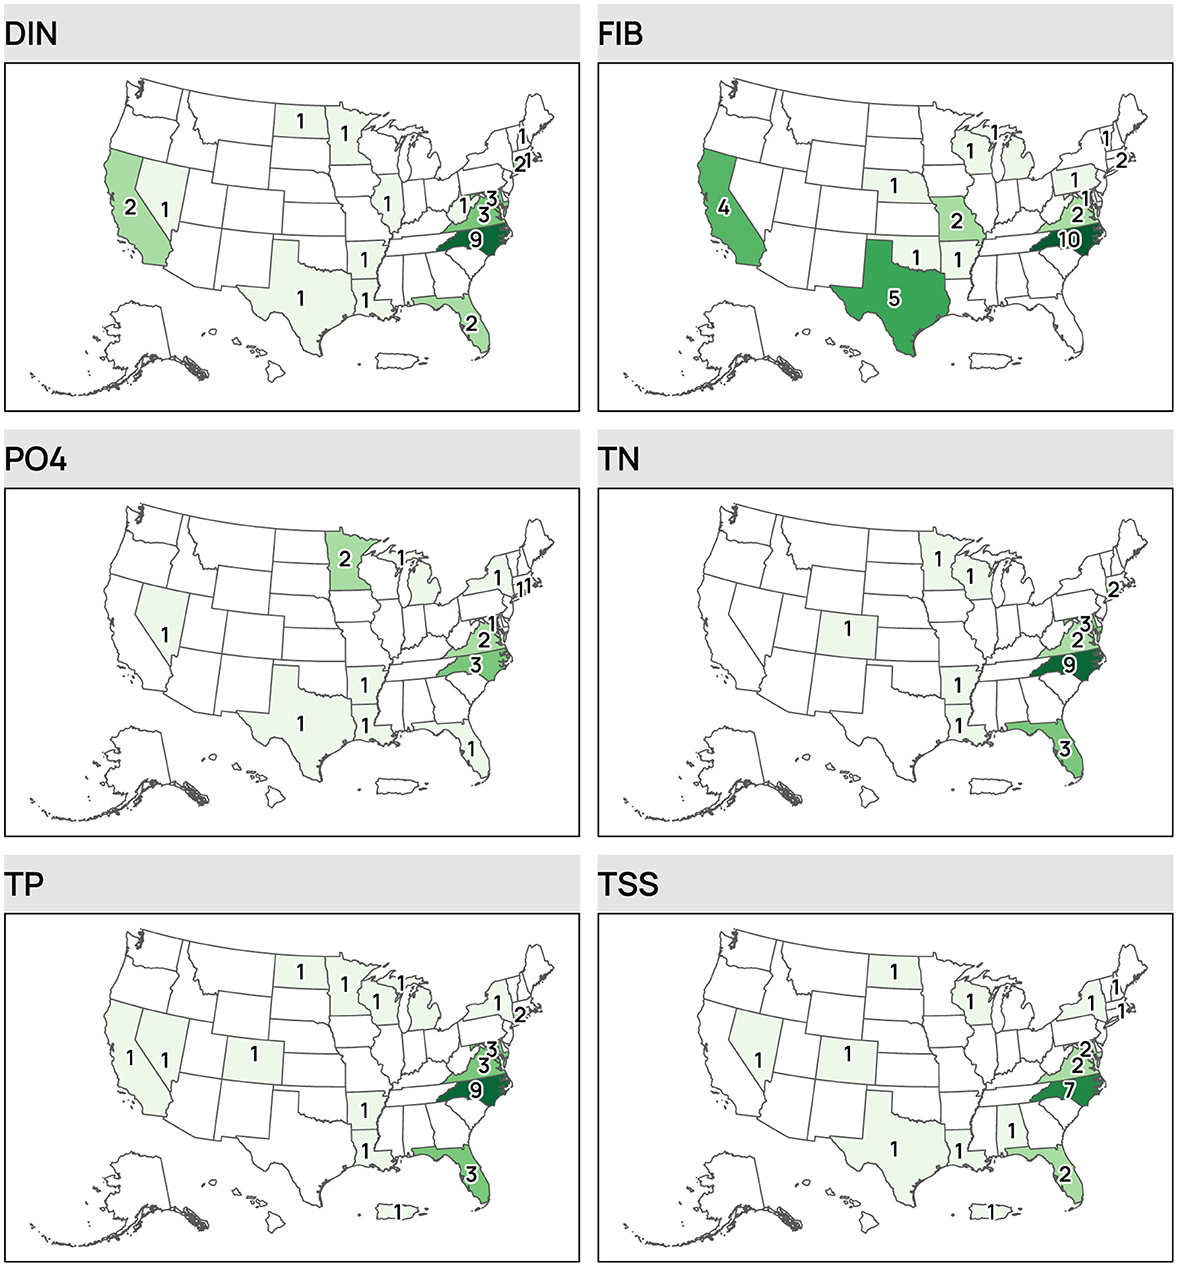
Figure 4. Distribution of studies identified in the systematic review by state and parameter. Water quality parameters include total suspended sediment (TSS), total phosphorus (TP), total nitrogen (TN), orthophosphate (PO4), fecal indicator bacteria (FIB), and dissolved inorganic nitrogen (DIN).
3.2 Regression models
3.2.1 Fecal indicator bacteria
There were only 19 studies and 63 FIB effect sizes available to model after removal of studies and effects that only reported BMPeff. The overall mean effect (estimated with the intercept only multilevel random effects model) showed significant mean reductions in FIB (ROM = 0.85, 95% CI [0.36, 1.34]; BMPeff = 57.4%, 95% CI [30.4%, 73.9%]; Figure 5) resulting from BMPs. Total heterogeneity was moderate with a relatively large amount of heterogeneity observed due to differences within studies (I2total = 53.54, I2study = 10.03, I2effect = 43.51).
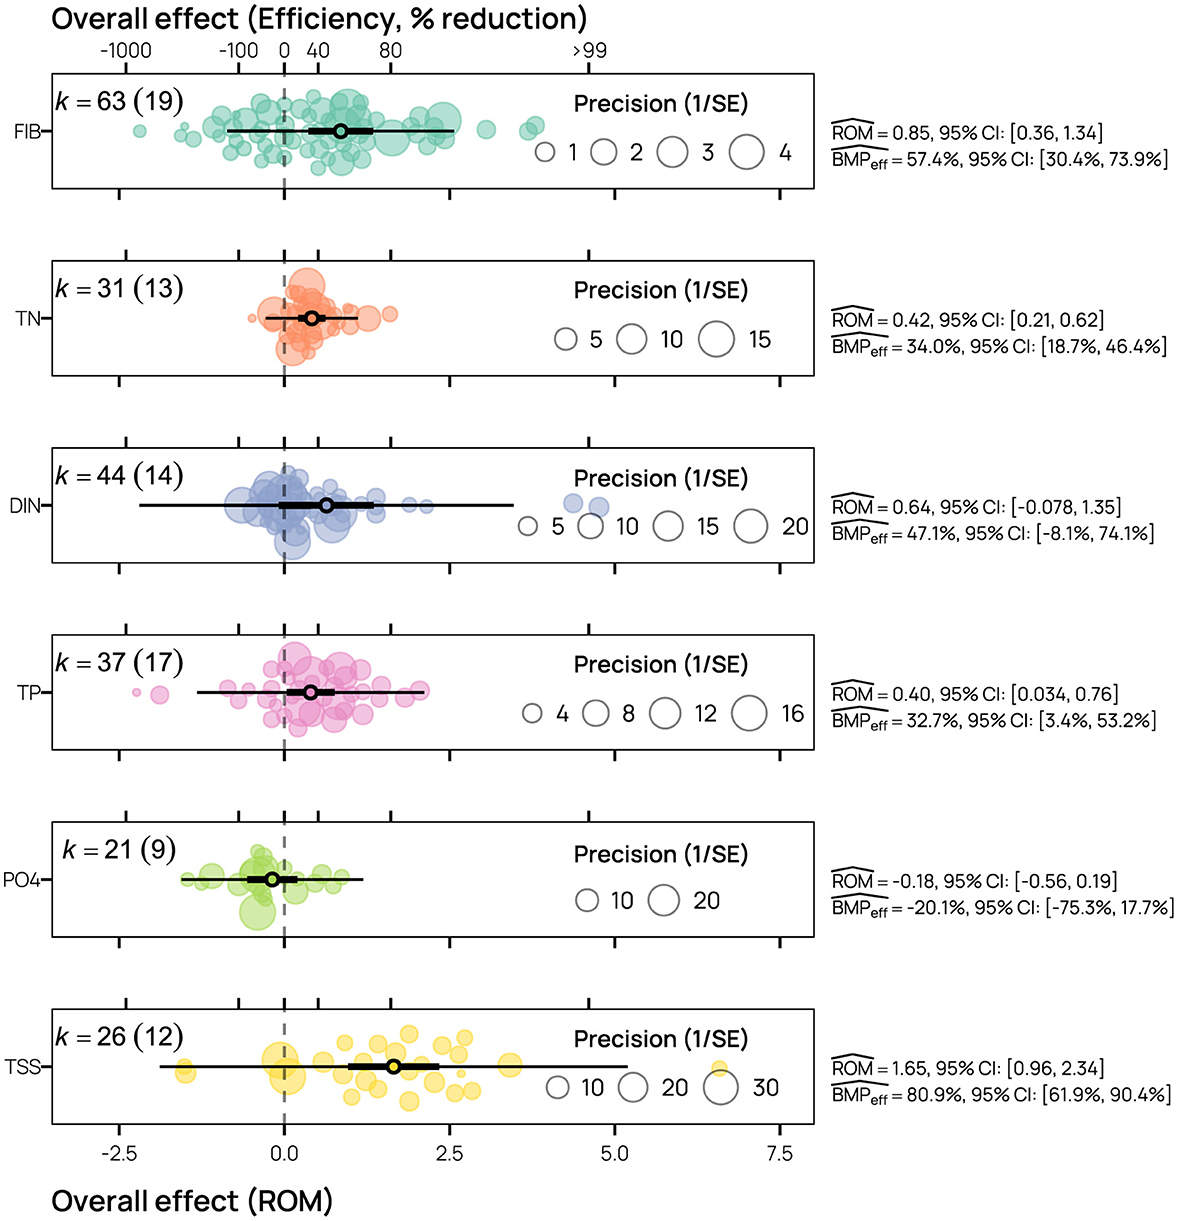
Figure 5. Estimated effect sizes and intervals from the intercept only multilevel random effects model. Individual points represent studies, with size scaled by sampling variance. The point estimate with uncertaintity bars indicate the estimated overall effect, 95% confidence intervals, and 95% prediction intervals. Here, k indicates the number of overall effects with the number of unique studies in parenthesis. Water quality parameters include total suspended sediment (TSS), total phosphorus (TP), total nitrogen (TN), orthophosphate (PO4), fecal indicator bacteria (FIB), and dissolved inorganic nitrogen (DIN).
AICc scores included log transformed influent concentration and the aridity index × BMP subcategory interaction as moderators for the FIB model (Table 3). Moderator terms and interactions explained a high proportion of effect size variance (R2marginal =0.89) in the FIB model. Increased influent concentrations (β = 0.25, 95% CI [0.14, 0.37]) resulted in significantly larger ROM effect for FIB (Figure 6). Compared to the baseline aridity index × detention BMP subcategory interaction, infiltration (β = -29.90, 95% CI [-50.34, -9.47]), livestock management (β = -30.37, 95% CI [-50.93, -9.81]), and treatment (β = -30.33, 95% CI [-49.62, -11.03]) interactions had significantly smaller slopes. However, the data had uneven coverage of BMP subcategories across the aridity index. Effects for detention BMPs were clustered in humid climates (aridity index > 0.65) and the resulting estimate for the baseline interaction (β = 32.63, 95% CI [12.57, 52.69]) may not be reliable when extrapolated to low-humidity regions.

Table 3. Sumary of AICc values used for model selection.
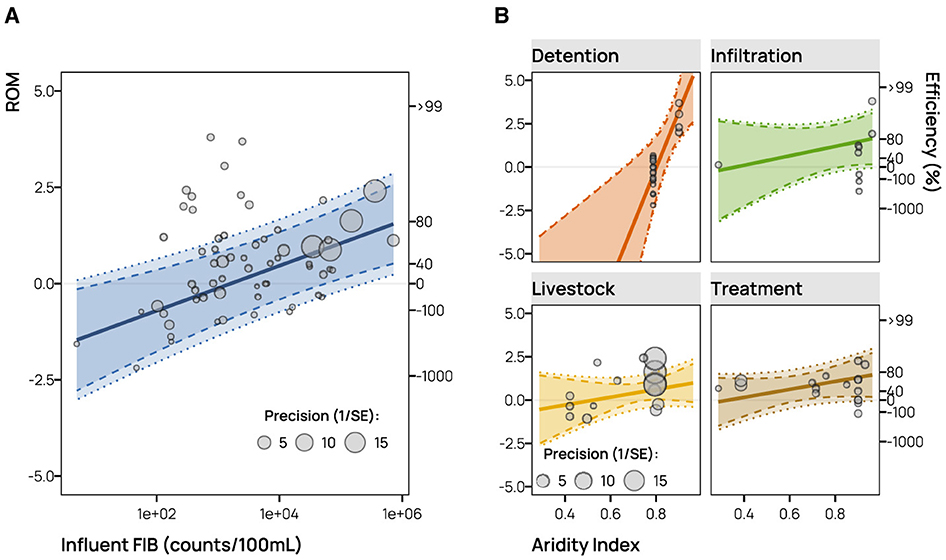
Figure 6. Predicted marginal effect of influent fecal indicator bacteria [FIB; (A)] and aridity index [conditioned on BMP subcategory; (B)]. Solid lines are the predicted mean effect, dashed lines are the 95% confidence intervals, and the dotted lines are the 95% prediction intervals. Individual dots represent each effect size identified in the literature with the size scaled by sampling variance. Higher aridity index (mean annual precipition/evapotranspiration) indicates more humid conditions.
3.2.2 Nitrogen
We identified 13 eligible TN studies and 14 DIN studies and 31 and 44 effect sizes respectively that could be included in the regression model. Overall effects showed that BMPs resulted in significant mean reductions in TN (ROM = 0.42, 95% CI [0.21, 0.62]; BMPeff = 34.0%, 95% CI [18.7%, 46.4%]; Figure 5) but not in DIN (ROM = 0.64, 95% CI [-0.08, 1.35]; BMPeff = 47.1%, 95% CI [-8.1%, 74.1%]; Figure 5). Heterogeneity was high for TN with a large proportion of heterogeneity attributed to within study effect (I2total = 77.12, I2study = 23.2, I2effect = 53.92). The DIN model had even higher heterogeneity with a larger proportion attributed between studies (I2total = 99.51, I2study = 83.53, I2effect = 15.97). AICc scores indicated that none of the moderators resulted in substantial improvement over the intercept only model (Table 3).
3.2.3 Phosphorus
We found 17 TP studies with 37 effect sizes and 9 PO4 studies with 21 effect sizes for inclusion in regression models. There was a significant overall reduction found for TP (ROM = 0.40, 95% CI [0.03, 0.76]; BMPeff = 32.7%, 95% CI [3.4%, 53.2%]) but no evidence of negative or positive effect for PO4 (ROM = -0.18, 95% CI [-0.56, 0.19]; BMPeff = -20.1%, 95% CI [-75.3%, 17.7%]). For both the TP and PO4 models, heterogenity was high, with moderate to high within study variance and low to moderate between study variance (TP: I2total = 96.13, I2study = 32.15, I2effect = 63.99; PO4: I2total = 97.28, I2study = 33.36, I2effect = 63.92). The best model for both parameters only included influent as a moderator (Table 3). Moderators explained a relatively small amount of variance for both models (TP: R2marginal =0.12, PO4: R2marginal =0.35). Influent concentration (β = 0.23, 95% CI [-0.035, 0.49]) was not significant at the 95% confidence level for the TP model (Figure 7; Supplementary Table S4). Influent concentration (β = 0.27, 95% CI [0.085, 0.44]) was significant for the PO4 model (Figure 7; Supplementary Table S5).
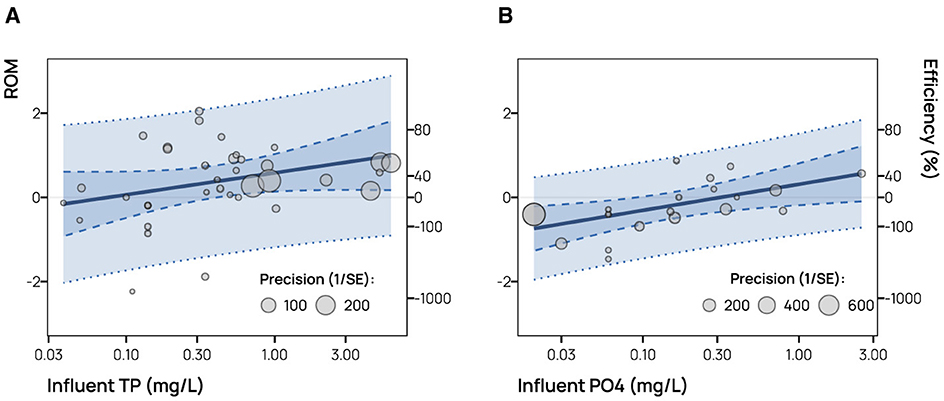
Figure 7. Predicted marginal effect of influent pollutant concentration on total phosphorus [TP; (A)] and orthophosphate [PO4; (B)] reductions. Solid lines are the predicted mean effect, dashed lines are the 95% confidence intervals, and the dotted lines are the 95% prediction intervals. Individual dots represent each effect size identified in the literature with the size scaled by sampling variance.
3.2.4 Sediment
There were 12 eligible TSS studies with 26 effect sizes for regression modeling. We found a significant and large reduction in TSS concentrations across studies (ROM = 1.65, 95% CI [0.96, 2.34]; BMPeff = 80.9%, 95% CI [61.9%, 90.4%]). Heterogeneity was high for TSS with a large proportion of heterogeneity attributed to within study effect (I2total = 99.57, I2study = 0, I2effect = 99.57). Similar to nitrogen, we did not find strong evidence linking any of the tested moderators to BMP performance (Table 3).
4 Discussion
Our systematic review revealed strong spatial disparities in published BMP studies (Figure 4). Similar spatial disparities have been identified and discussed in Koch et al. (2014) and Grudzinski et al. (2020) and can be problematic for extrapolating results to other regions of interest. Inconsistent spatial coverage presents a challenge for disentangling confounding spatially correlated predictors such as climate and soil due to poor representation within the dataset. Horvath et al. (2023) found overlapping BMP type and climate groups within their dataset that reduce the ability to distinguish effects due to either BMP type or climate. Similarly, we found detention type BMPs clustered only in humid climates (high aridity index) which reduces our confidence in extrapolating the interaction between BMP types and aridity index for FIB (Figure 6). Not only were there spatially disparities, but we observed that the relative distribution of aridity index values does not resemble the distribution of aridity values across the U.S. or the distribution of aridity values for agricultural and developed land uses across the U.S. (Figure 8). Our review indicates that BMP studies are over represented in the generally humid regions of the country and underrepresented the more arid regions. Study scale, runoff sources and BMP types appeared well distributed, with the caveat that we are not aware of the actual distribution of these values in BMPs deployed across the country.
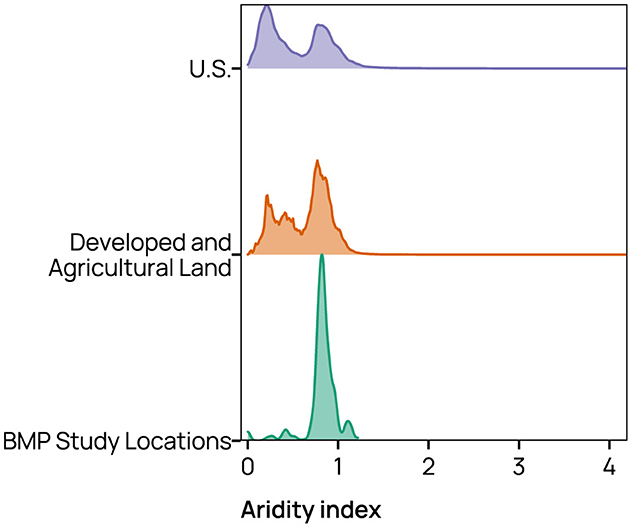
Figure 8. Comparison of the relative distributions (density) of aridity index values (mean annual precipition/evapotranspiration) across the U.S., across U.S. agricultural and developed land uses, and for BMP study locations. Higher aridity index values indicate more humid conditions.
We did not see an obvious trend in the number of published studies over time. However, there was a clearly skewed distribution in study length for all of the reviewed parameters. The prevalence of short-term studies has been observed in similar domains such as stream/river restoration (Bernhardt, 2005). Given the nature of funding resources, this is not a surprising result but does have implications for developing a full understanding of BMP performance. First, there is strong evidence that certain BMPs and larger scale projects require extended time to establish and demonstrate positive benefit (Meals et al., 2010; Grudzinski et al., 2020). Meals et al. (2010) documented lag times in the improvement of receiving water ranging from less than 1 year to upwards of 30 years, in particular sediment associated nutrients were assumed to have some of the longest effects. Second, BMP maintenance is an important components of BMP performance and success (Koch et al., 2014; Heidari et al., 2023). Relatively little work has been published investigating how the performance of BMPs change over time, but there is scattered evidence that BMP performance may change as a function of BMP type and pollutant type (Liu et al., 2017). While securing long term support for BMP monitoring and maintenance is a substantial hurdle (Heidari et al., 2023), unmaintained BMPs may see reduced performance (Koch et al., 2014; Liu et al., 2017).
Study design prevented us from properly assessing BMP effectiveness as a function of age. Conducting a meta-analysis of BMP effectiveness over time is hampered both by the lack of long-term studies and lack of standardized reporting mechanisms. Some studies simply describe the change in pollutant concentrations or loads at the beginning and end of the study as a percent change (Haile et al., 2016) which presents statistical problems, especially when sampling variance is not reported. Changes in performance can also be described using a linear regression using date (transformed as a numeric variable) as an independent variable and log-transformed water quality as the dependent variable (Mitsch et al., 2012, 2014; Paus et al., 2014). Slopes are a valid effect size for use in meta-analysis but the set of covariates used between studies should be the same since the coefficient of interest is adjusted to account for other terms in the regression model (Becker and Wu, 2007). It would be reasonable to assume that regressions equations vary between studies to adjust results for seasonality, flow rates, and other variables. Future efforts for assessing the performance of BMPs over time would benefit not only from more studies, but a more standardized method for providing comparable results.
Meta-analysis indicated that BMPs resulted in significant overall reductions in FIB, TN, TP, and TSS concentrations. We did not find strong evidence of leaching or reductions of DIN or PO4 across BMP studies. The results are in general agreement with previous reviews that found effective (but highly variable) removal efficiencies for nitrogen, phosphorus, and sediment (Clary et al., 2011; Koch et al., 2014; Liu et al., 2017). The FIB results are useful in particular because FIBs performance by BMPs have been sparsely reviewed and generally understudied (Hager et al., 2019).
The FIB reductions generally agreed with our hypothesis that BMP type, influent concentration, and aridity moderate the effectiveness. The lower predicted performance in more arid regions comes with the caveat that data coverage in arid regions was quite poor, in particular for detention type BMPs. Despite this, the results are promising considering the major limitations of using FIB as a water quality criteria. It is important to note that FIB can originate from non-human source and naturalize in soils, and result in different underlying risk of illness (Ishii and Sadowsky, 2008; Schoen and Ashbolt, 2010; Soller et al., 2010; Fujioka et al., 2015). Since the fate and transport of human pathogens within BMPs can potentially differ from FIB, BMP choices probably should not be based on FIB reduction alone as alternative indicators or even direct pathogen measurement becomes available (Walters et al., 2009; Peng et al., 2016). However, relatively few studies have compared human pathogen and FIB removal rates within BMPs (Rugh et al., 2022).
While we observed a strong relationship between FIB influent concentration and FIB removal across all BMPs, we anticipated this relationship to vary by BMP subcategory. The reliance on certain removal processes by BMP subcategories was expected to effect the ability of the BMP to retain FIB at higher or lower concentrations. We did have some evidence of differing BMP subcategory removal under different aridity. The impact of aridity might be due to differential fate and transport processes in arid versus humid environments. On one hand, we assume that arid conditions might be less hospitable to FIBs due to increased UV exposure and osmotic stress. Conversely, these conditions are also less hospitable to the protozoa, bacteriophages, and micro-zooplankton that can play a strong role in predating on and controlling FIB concentrations within BMP media (Zhang et al., 2010; Burtchett et al., 2017; Dean and Mitchell, 2022). Site specific conditions (such as retained soil moisture, turbidity, vegetation, and other factors) play an important role in bacteria survival as well as for influencing the filtration and attachment processes that retain FIB within BMP media. For example, the presence or absence of a submerged zone within a bioretention BMP has a strong effect on FIB removal (Rippy, 2015; Peng et al., 2016). While our models capture some of the variance due to these differences as between study effects, including these variables as fixed effect moderators in a meta-regression model would be valuable but these details are under reported in BMP studies.
Although we anticipated increases in nitrogen removal rates with increases in influent concentration, we did not find evidence to support this. Increased flow rates, which can reduce residence time and increase BMP flushing, lowers nitrogen retention (Wollheim et al., 2005; Craig et al., 2008). High nitrogen influent concentrations might be associated with higher flows and decreased BMP retention times in the included studies. However, we did not collect associated flow data or discern between flow-weighted and mean concentration data within this study. Many of the reviewed studies appear to fail to include associated flow volume information.
We also did not find evidence that BMP type or aridity moderated nitrogen removal. This result is largely consistent with findings in reviews by Koch et al. (2014), Hager et al. (2019), and Horvath et al. (2023). There are a large number of abiotic and biotic processes that control nitrogen retention and removal in BMPs and these processes are moderated by both site specific climate and design factors (LeFevre et al., 2015; Valenca et al., 2021). It is likely that these site specific factors (retained soil moisture, submerged anoxic zones, vegetation, media composition) are not captured by our broad categorization of BMP types and aridity index values. For example, Valenca et al. (2021), using data from the International Stormwater BMP Database, showed that the relative importance of climate and design variables for moderating nitrogen removal varied by BMP type.
Although influent phosphorus concentration was included in the selected TP and PO4 models, they provided relatively low explanatory ability. By comparison, Horvath et al. (2023) found three types of BMPs resulted in differing TP and dissolved inorganic phosphorus removal rates with influent concentrations explaining a small proportion of removal rate variance. Again, site-specific factors not captured in our broad categorizations of BMP type and aridity index play a role in differential phosphorus removal rates. Soil physical characteristics and media amendments (iron for example) can play an critical role in sorption capacity and are dependent on covariates such as contact time and pH (Hogan and Walbridge, 2007; LeFevre et al., 2015).
4.1 Study limitations
A few reviews have noted a common trend of insufficient methodological and site specific data among peer-reviewed BMP performance studies (Eagle et al., 2017; Liu et al., 2017; Grudzinski et al., 2020). We confirm that inconsistent reporting among studies complicates data extraction, effect size calculations, and attributing important sources of variance. Our desire to evaluate the effects of specific BMP parameters was hindered by the overall lack of reporting of relevant parameters such as drainage area, infiltration media/soil, infiltration volume, riparian/buffer width and area, and other relevant factors. The lack of BMP specific parameters certainly contributes to our relatively high model variance. The International Stormwater BMP Database addresses some of these concerns through a standardized reporting format. Our future efforts will incorporate data from the International Stormwater BMP Database with data retrieved through a systematic review. Additionally, this study was a broad scale look across BMP types which limits factors that cannot be compared across different types of BMPs. For example, livestock management BMPs may not rely on or report parameters such as vegetative buffer width or infiltration area. Inclusion of such factors in our meta-regression approach would necessarily exclude certain types of BMPs. Future BMP-specific meta-analysis might be more useful and informative for practitioners by providing effect sizes of parameters that were necessarily excluded from our study.
One reviewer also noted some examples of missing studies, attributable to our selection of search terms and inclusion criteria (Table 1). In particular, our search query did not include specifc practice names, instead using “BMP” or “best management practice” as a keyword search. This choice may have led us to miss studies that only included the practice name. Our inclusion criteria of concentration based studies may have also lead to the exclusion of studies that focused on load reductions (through flow reductions) but may have included data on relevant concentration effects.
5 Conclusion
Scaling BMP pollutant reductions to basin wide water quality improvement remains a substantial challenge. While there are numerous studies of field scale practices, linking BMPs with large scale watershed improvements is hindered by lack of adequate controls, scaling of measurement and analytic uncertainty, and substantial lags in downstream water quality improvement (Meals et al., 2010; Tomer and Locke, 2011; Melland et al., 2018). The major identified challenges include the lack of long term studies, inadequate data collected on BMP management, and incomplete understanding of BMP function (Liu et al., 2017; Lintern et al., 2020). As a result there is strong reliance on numeric watershed models to assess performance of BMPs at watershed scales, but Liu et al. (2017) notes there is discrepancy between rates of water quality improvements found in modeling studies and empirical studies. There is a clear need to fill knowledge gaps through additional long-term spatially relevant BMP studies. However, we emphasize the need for convergent research approaches that better align study design and reporting that produces data aligned with data synthesis and modeling approaches.
Improved reporting and data availability provides opportunity to improve decision-making through applied numeric modeling approaches that better represent BMP systems, or to advance new modeling methods for decision-making with statistical based approaches such as machine-learning. To improve future data synthesis efforts, we highly recommend future BMP studies follow the reporting guidelines provided in Eagle et al. (2017). In particular, authors should provide clearly defined water quality parameters, tabular data (either in the manuscript, as supplementary material, or in an open data repository), and error estimation at minimum. Control and treatment means should be made available in reports, not just the transformed efficiency or percent change values. Furthermore clearly defined controls and treatments are fundamental for comparing across studies. Finally, a major shortcoming in our synthesis was driven by the lack of reported covariate data. Although data such as soil type may not be an within study experimental covariate, documenting of these types of study variables is useful for data synthesis efforts.
In summary, we used multi-level random effects meta-regression models to estimate overall BMP effectiveness from systematically reviewed studies. Although there was relatively high variance between studies, we found strong evidence that BMPs reduce overall mean FIB, TN, TP, and TSS concentrations. These results are generally consistent with results from prior reviews that used different approaches to synthesize results. Influent concentrations moderated BMP efficiency for both FIB and PO4, with larger removal rates at high influent concentrations. We found that aridity and BMP subcategory moderated BMP performance for only FIB. We anticipated stronger interaction effects between inflow concentrations and BMP subcategory due to differences in influent based performance demonstrated in prior studies. Most likely, site specific design and climate variables not captured in our review or by our choice in BMP classification approach play a more important role in explaining BMP performance variability. Future efforts should seek to retrieve more detailed study information. Furthermore, our systematic review highlights the poor spatial coverage of BMP studies. The reviewed studies therefore fail to incorporate the range of soil, climate, and runoff conditions needed to adequately link BMP performance to local predictors. To adequately estimate the effects of moderating variable on BMP performance we suggest that there is a need for additional aligned BMP studies across regions and conditions.
Data availability statement
The datasets presented in this study can be found in online repositories. The names of the repository/repositories and accession number(s) can be found below: Zenodo (R code): https://doi.org/10.5281/zenodo.10795231; Zenodo (Raw data): https://doi.org/10.5281/zenodo.10451303.
Author contributions
MS: Conceptualization, Formal analysis, Funding acquisition, Methodology, Project administration, Supervision, Writing – original draft, Writing – review & editing. DK: Conceptualization, Data curation, Formal analysis, Writing – original draft, Writing – review & editing. JW: Data curation, Writing – original draft, Writing – review & editing. SJ: Data curation, Writing – original draft, Writing – review & editing.
Funding
The author(s) declare financial support was received for the research, authorship, and/or publication of this article. This project was supported by a state nonpoint source grant from the Texas State Soil and Water Conservation Board.
Conflict of interest
The authors declare that the research was conducted in the absence of any commercial or financial relationships that could be construed as a potential conflict of interest.
Publisher's note
All claims expressed in this article are solely those of the authors and do not necessarily represent those of their affiliated organizations, or those of the publisher, the editors and the reviewers. Any product that may be evaluated in this article, or claim that may be made by its manufacturer, is not guaranteed or endorsed by the publisher.
Supplementary material
The Supplementary Material for this article can be found online at: https://www.frontiersin.org/articles/10.3389/frwa.2024.1397615/full#supplementary-material
References
Agouridis, C. T., Workman, S. R., Warner, R. C., and Jennings, G. D. (2005). Livestock grazing management impacts on stream water quality: a review. J. Am. Water Resour. Assoc. 41, 591–606. doi: 10.1111/j.1752-1688.2005.tb03757.x
Allan, J. D. (2004). Landscapes and riverscapes: the influence of land use on stream ecosystems. Annu. Rev. Ecol. Evol. Syst. 35, 257–284. doi: 10.1146/annurev.ecolsys.35.120202.110122
Barrett, M. E. (2005). Performance comparison of structural stormwater best management practices. Water Environm. Res. 77, 78–86. doi: 10.2175/106143005X41654
Barrett, M. E. (2008). Comparison of BMP performance using the International BMP Database. J. Irrigat. Drain. Eng. 134, 556–561. doi: 10.1061/(ASCE)0733-9437(2008)134:5(556)
Becker, B. J., and Wu, M.-J. (2007). The synthesis of regression slopes in meta-analysis. Statist. Sci. 22, 414–429. doi: 10.1214/07-STS243
Benham, B., Zeckoski, R., and Yagow, G. (2008). Lessons learned from TMDL implementation case studies. Water Pract. 2, 1–13. doi: 10.2175/193317708X281370
Bernhardt, E. S. (2005). Synthesizing U.S. river restoration efforts. Science 308, 636–637. doi: 10.1126/science.1109769
Bernhardt, E. S., Band, L. E., Walsh, C. J., and Berke, P. E. (2008). Understanding, managing, and minimizing urban impacts on surface water nitrogen loading. Ann. N. Y. Acad. Sci. 1134, 61–96. doi: 10.1196/annals.1439.014
Bracken, M. (1992). “Statistical methods for analysis of effects of treatment in overviews of randomized trials,” in Effective Care of the Newborn Infant, eds. J. Sinclair, and M. Bracken (Oxford: Oxford University Press), 13–20.
Burnham, K. P., Anderson, D. R., and Huyvaert, K. P. (2011). AIC model selection and multimodel inference in behavioral ecology: Some background, observations, and comparisons. Behav. Ecol. Sociobiol. 65, 23–35. doi: 10.1007/s00265-010-1029-6
Burtchett, J. M., Mallin, M. A., and Cahoon, L. B. (2017). Micro-zooplankton grazing as a means of fecal bacteria removal in stormwater BMPs. Water Sci. Technol. 75, 2702–2715. doi: 10.2166/wst.2017.170
Carey, R. O., Hochmuth, G. J., Martinez, C. J., Boyer, T. H., Dukes, M. D., Toor, G. S., et al. (2013). Evaluating nutrient impacts in urban watersheds: challenges and research opportunities. Environm. Pollut. 173, 138–149. doi: 10.1016/j.envpol.2012.10.004
Carpenter, S. R., Caraco, N. F., Correll, D. L., Howarth, R. W., Sharpley, A. N., and Smith, V. H. (1998). Nonpoint pollution of surface waters with phosphorus and nitrogen. Ecol. Appl. 8, 559–568. doi: 10.1890/1051-0761(1998)0080559:NPOSWW2.0.CO;2
Cinar, O., Umbanhowar, J., Hoeksema, J. D., and Viechtbauer, W. (2021). Using information-theoretic approaches for model selection in meta-analysis. Res. Synth. Methods 12, 537–556. doi: 10.1002/jrsm.1489
Clary, J., Leisenring, M., Poresky, A., Earles, A., and Jones, J. (2011). “BMP performance analysis results for the International Stormwater BMP Database,” in World Environmental and Water Resources Congress 2011 (Palm Springs, California: American Society of Civil Engineers), 441–449.
Cole, T. J., and Altman, D. G. (2017). Statistics notes: what is a percentage difference? BMJ 358:j3663. doi: 10.1136/bmj.j3663
Collaboration for Environmental Evidence (2018). Guidelines and Standards for Evidence Synthesis in Environmental Management. Version 5.0, eds. A. S. Pullin, G. K. Frampton, B. Livoreil, and G. Petrokofsky. Available online at: www.environmentalevidence.org/information-for-authors
Craig, L. S., Palmer, M. A., Richardson, D. C., Filoso, S., Bernhardt, E. S., Bledsoe, B. P., et al. (2008). Stream restoration strategies for reducing river nitrogen loads. Front. Ecol. Environ. 6, 529–538. doi: 10.1890/070080
Dean, K., and Mitchell, J. (2022). Meta-analysis addressing the implications of model uncertainty in understanding the persistence of indicators and pathogens in natural surface waters. Environ. Sci. Technol. 56, 12106–12115. doi: 10.1021/acs.est.1c07552
Doncaster, C. P., and Spake, R. (2018). Correction for bias in meta-analysis of little-replicated studies. Methods Ecol. Evol. 9, 634–644. doi: 10.1111/2041-210X.12927
Eagle, A. J., Christianson, L. E., Cook, R. L., Harmel, R. D., Miguez, F. E., Qian, S. S., et al. (2017). Meta-analysis constrained by data: recommendations to improve relevance of nutrient management research. Agron. J. 109, 2441–2449. doi: 10.2134/agronj2017.04.0215
EPA (2017). National Water Quality Inventory: Report to Congress. Technical Report EPA 841-R-16-011, U.S. Environmental Protection Agency, Washington, D.C.
Freeman, L. A., Corbett, D. R., Fitzgerald, A. M., Lemley, D. A., Quigg, A., and Steppe, C. N. (2019). Impacts of urbanization and development on estuarine ecosystems and water quality. Estuar. Coasts 42, 1821–1838. doi: 10.1007/s12237-019-00597-z
Fu, B., Merritt, W. S., Croke, B. F., Weber, T. R., and Jakeman, A. J. (2019). A review of catchment-scale water quality and erosion models and a synthesis of future prospects. Environm.Modell. Softw. 114, 75–97. doi: 10.1016/j.envsoft.2018.12.008
Fujioka, R., Solo-Gabriele, H., Byappanahalli, M., and Kirs, M. (2015). U.S. recreational water quality criteria: A vision for the future. Int. J. Environ. Res. Public Health 12, 7752–7776. doi: 10.3390/ijerph120707752
Grudzinski, B., Fritz, K., and Dodds, W. (2020). Does riparian fencing protect stream water quality in cattle-grazed lands? Environ. Manage. 66, 121–135. doi: 10.1007/s00267-020-01297-2
Hager, J., Hu, G., Hewage, K., and Sadiq, R. (2019). Performance of low-impact development best management practices: a critical review. Environm. Rev. 27, 17–42. doi: 10.1139/er-2018-0048
Haile, T. M., Hobiger, G., Kammerer, G., Allabashi, R., Schaerfinger, B., and Fuerhacker, M. (2016). Hydraulic performance and pollutant concentration profile in a stormwater runoff filtration systems. Water Air Soil Pollut. 227:34. doi: 10.1007/s11270-015-2736-4
Hedges, L. V., Gurevitch, J., and Curtis, P. S. (1999). The meta-analysis of response ratios in experimental ecology. Ecology 80, 1150–1156.
Hedges, L. V., and Olkin, I. (1985). Statistical Methods for Meta-Analysis. Orlando: Academic Press.
Heidari, B., Randle, S., Minchillo, D., and Jaber, F. H. (2023). Green stormwater infrastructure: a critical review of the barriers and solutions to widespread implementation. WIREs Water 10:e1625. doi: 10.1002/wat2.1625
Hogan, D. M., and Walbridge, M. R. (2007). Best management practices for nutrient and sediment retention in urban stormwater runoff. J. Environ. Qual. 36, 386–395. doi: 10.2134/jeq2006.0142
Horvath, I. R., Zhang, K., Mayer, B. K., and Parolari, A. J. (2023). Effects of regional climate and BMP type on stormwater nutrient concentrations in BMPs: a meta-analysis. Environ. Sci. Technol. 57, 5079–5088. doi: 10.1021/acs.est.2c05942
Ishii, S., and Sadowsky, M. J. (2008). Escherichia coli in the environment: Implications for water quality and human health. Microbes Environm. 23, 101–108. doi: 10.1264/jsme2.23.101
Kambach, S., Bruelheide, H., Gerstner, K., Gurevitch, J., Beckmann, M., and Seppelt, R. (2020). Consequences of multiple imputation of missing standard deviations and sample sizes in meta-analysis. Ecol. Evol. 10, 11699–11712. doi: 10.1002/ece3.6806
Kikoyo, D., Jain, S., Wright, J., and Schramm, M. (2024). TWRI NPS-BMP-DB (v1.05) [Data set]. Zenodo. doi: 10.5281/zenodo.10451303
Koch, B. J., Febria, C. M., Gevrey, M., Wainger, L. A., and Palmer, M. A. (2014). Nitrogen removal by stormwater management structures: a data synthesis. JAWRA J. Am. Water Resour. Assoc. 50, 1594–1607. doi: 10.1111/jawr.12223
Kroger, R., Perez, M., Walker, S., and Sharpley, A. (2012). Review of best management practice reduction efficiencies in the Lower Mississippi Alluvial Valley. J. Soil Water Conservat. 67, 556–563. doi: 10.2489/jswc.67.6.556
LeFevre, G. H., Paus, K. H., Natarajan, P., Gulliver, J. S., Novak, P. J., and Hozalski, R. M. (2015). Review of dissolved pollutants in urban storm water and their removal and fate in bioretention cells. J. Environm. Eng. 141:04014050. doi: 10.1061/(ASCE)EE.1943-7870.0000876
Lintern, A., McPhillips, L., Winfrey, B., Duncan, J., and Grady, C. (2020). Best management practices for diffuse nutrient pollution: wicked problems across urban and agricultural watersheds. Environ. Sci. Technol. 54, 9159–9174. doi: 10.1021/acs.est.9b07511
Liu, Y., Engel, B. A., Flanagan, D. C., Gitau, M. W., McMillan, S. K., and Chaubey, I. (2017). A review on effectiveness of best management practices in improving hydrology and water quality: Needs and opportunities. Sci. Total Environm. 601–602:580–593. doi: 10.1016/j.scitotenv.2017.05.212
Meals, D. W., Dressing, S. A., and Davenport, T. E. (2010). Lag time in water quality response to best management practices: a review. J. Environm. Qual. 39:85. doi: 10.2134/jeq2009.0108
Melland, A., Fenton, O., and Jordan, P. (2018). Effects of agricultural land management changes on surface water quality: A review of meso-scale catchment research. Environm.Sci. Policy 84, 19–25. doi: 10.1016/j.envsci.2018.02.011
Mitsch, W. J., Zhang, L., Stefanik, K. C., Nahlik, A. M., Anderson, C. J., Bernal, B., et al. (2012). Creating wetlands: primary succession, water quality changes, and self-design over 15 years. BioScience 62, 237–250. doi: 10.1525/bio.2012.62.3.5
Mitsch, W. J., Zhang, L., Waletzko, E., and Bernal, B. (2014). Validation of the ecosystem services of created wetlands: Two decades of plant succession, nutrient retention, and carbon sequestration in experimental riverine marshes. Ecol. Eng. 72, 11–24. doi: 10.1016/j.ecoleng.2014.09.108
Nakagawa, S., Noble, D. W. A., Lagisz, M., Spake, R., Viechtbauer, W., and Senior, A. M. (2023a). A robust and readily implementable method for the meta-analysis of response ratios with and without missing standard deviations. Ecol. Lett. 26:232–244. doi: 10.1111/ele.14144
Nakagawa, S., and Santos, E. S. A. (2012). Methodological issues and advances in biological meta-analysis. Evol. Ecol. 26, 1253–1274. doi: 10.1007/s10682-012-9555-5
Nakagawa, S., and Schielzeth, H. (2013). A general and simple method for obtaining R2 from generalized linear mixed-effects models. Methods Ecol. Evol. 4, 133–142. doi: 10.1111/j.2041-210x.2012.00261.x
Nakagawa, S., Yang, Y., Macartney, E. L., Spake, R., and Lagisz, M. (2023b). Quantitative evidence synthesis: a practical guide on meta-analysis, meta-regression, and publication bias tests for environmental sciences. Environm. Evid. 12:8. doi: 10.1186/s13750-023-00301-6
National Research Council (2001). Assessing the TMDL Approach to Water Quality Management. Washington, DC: National Academies Press.
Nuzzo, R. (2018). Percent differences: another look. PM&R 10, 661–664. doi: 10.1016/j.pmrj.2018.05.003
Osenberg, C. W., Sarnelle, O., and Cooper, S. D. (1997). Effect size in ecological experiments: The application of biological models in meta-analysis. Am. Nat. 150, 798–812. doi: 10.1086/286095
Paus, K. H., Morgan, J., Gulliver, J. S., Leiknes, T., and Hozalski, R. M. (2014). Assessment of the hydraulic and toxic metal removal capacities of bioretention cells after 2 to 8 years of service. Water Air Soil Pollut. 225:1803. doi: 10.1007/s11270-013-1803-y
Peng, J., Cao, Y., Rippy, M., Afrooz, A., and Grant, S. (2016). Indicator and pathogen removal by low impact development best management practices. Water 8:600. doi: 10.3390/w8120600
Rippy, M. A. (2015). Meeting the criteria: Linking biofilter design to fecal indicator bacteria removal. WIREs Water 2, 577–592. doi: 10.1002/wat2.1096
Rugh, M. B., Grant, S. B., Hung, W.-C., Jay, J. A., Parker, E. A., Feraud, M., et al. (2022). Highly variable removal of pathogens, antibiotic resistance genes, conventional fecal indicators and human-associated fecal source markers in a pilot-scale stormwater biofilter operated under realistic stormflow conditions. Water Res. 219:118525. doi: 10.1016/j.watres.2022.118525
Schoen, M. E., and Ashbolt, N. J. (2010). Assessing pathogen risk to swimmers at non-sewage impacted recreational beaches. Environ. Sci. Technol. 44, 2286–2291. doi: 10.1021/es903523q
Schramm, M., Gitter, A., and Gregory, L. (2022). Total Maximum Daily Loads and Escherichia coli trends in Texas freshwater streams. J. Contemp. Water Res. Educ. 176, 36–49. doi: 10.1111/j.1936-704X.2022.3374.x
Simpson, D. T., and Weammert, S. (2009). “Developing best management practice definitions and effectiveness estimates for nitrogen, phosphorus and sediment in the Chesapeake Bay watershed,” in Technical Report, University of Maryland Mid-Atlantic Water Program.
Soller, J. A., Schoen, M. E., Bartrand, T., Ravenscroft, J. E., and Ashbolt, N. J. (2010). Estimated human health risks from exposure to recreational waters impacted by human and non-human sources of faecal contamination. Water Res. 44, 4674–4691. doi: 10.1016/j.watres.2010.06.049
Tasdighi, A., Arabi, M., Harmel, D., and Line, D. (2018). A Bayesian total uncertainty analysis framework for assessment of management practices using watershed models. Environm. Model. Softw. 108, 240–252. doi: 10.1016/j.envsoft.2018.08.006
Tomer, M. D., and Locke, M. A. (2011). The challenge of documenting water quality benefits of conservation practices: a review of USDA-ARS's conservation effects assessment project watershed studies. Water Sci. Technol. 64:300. doi: 10.2166/wst.2011.555
Ullrich, A., and Volk, M. (2009). Application of the Soil and Water Assessment Tool (SWAT) to predict the impact of alternative management practices on water quality and quantity. Agricult. Water Managem. 96, 1207–1217. doi: 10.1016/j.agwat.2009.03.010
Valenca, R., Le, H., Zu, Y., Dittrich, T. M., Tsang, D. C., Datta, R., et al. (2021). Nitrate removal uncertainty in stormwater control measures: Is the design or climate a culprit? Water Res. 190:116781. doi: 10.1016/j.watres.2020.116781
Viechtbauer, W. (2010). Conducting meta-analyses in R with the metafor package. J. Stat. Softw. 36:1–48. doi: 10.18637/jss.v036.i03
Walters, S. P., Yamahara, K. M., and Boehm, A. B. (2009). Persistence of nucleic acid markers of health-relevant organisms in seawater microcosms: implications for their use in assessing risk in recreational waters. Water Res. 43, 4929–4939. doi: 10.1016/j.watres.2009.05.047
Wollheim, W. M., Pellerin, B. A., Vörösmarty, C. J., and Hopkinson, C. S. (2005). N retention in urbanizing headwater catchments. Ecosystems 8, 871–884. doi: 10.1007/s10021-005-0178-3
Zhang, L., Seagren, E. A., Davis, A. P., and Karns, J. S. (2010). The capture and destruction of Escherichia coli from simulated urban runoff using conventional bioretention media and iron oxide-coated sand. Water Environm. Res. 82, 701–714. doi: 10.2175/106143010X12609736966441
Keywords: best management practice, water quality, nonpoint source pollution, fecal indicator bacteria, nutrients, suspended sediment
Citation: Schramm M, Kikoyo D, Wright J and Jain S (2024) A meta-analysis of the impacts of best management practices on nonpoint source pollutant concentration. Front. Water 6:1397615. doi: 10.3389/frwa.2024.1397615
Received: 07 March 2024; Accepted: 17 June 2024;
Published: 12 July 2024.
Edited by:
Reza Kerachian, University of Tehran, IranReviewed by:
Pan Yang, Guangdong University of Technology, ChinaChang Zhao, University of Florida, United States
Charlotte Lee, North Carolina State University, United States
Copyright © 2024 Schramm, Kikoyo, Wright and Jain. This is an open-access article distributed under the terms of the Creative Commons Attribution License (CC BY). The use, distribution or reproduction in other forums is permitted, provided the original author(s) and the copyright owner(s) are credited and that the original publication in this journal is cited, in accordance with accepted academic practice. No use, distribution or reproduction is permitted which does not comply with these terms.
*Correspondence: Michael Schramm, bWljaGFlbC5zY2hyYW1tQGFnLnRhbXUuZWR1