 Abu Bokkar Siddique*
 Eliyas Rayhan
 Faisal Sobhan
 Nabanita Das
 Md Azizul FazalShashowti Chowdhury Riya
 Subrata Sarker
- Department of Oceanography, Shahjalal University of Science and Technology, Sylhet, Bangladesh
This study investigates quantifiable and explicable changes in Land Use and Land Cover (LULC) within the context of a freshwater wetland, Hakaluki Haor, in Bangladesh. The haor is a vital RAMSAR site and Ecologically Critical Area (ECA), which needs to be monitored to investigate LULC change patterns for future management interventions. Leveraging Landsat satellite data, the Google Earth Engine Database, CART algorithm, ArcGIS 10.8 and the R programming language, this study analyses LULC dynamics from 2000 to 2023. It focuses explicitly on seasonal transitions between the rainy and dry seasons, unveiling substantial transformations in cumulative LULC change patterns over the study period. Noteworthy changes include an overall reduction (~51%) in Water Bodies. Concurrently, there is a significant increase (~353%) in Settlement areas. Moreover, vegetation substantially declines (71%), while Crop Land demonstrates varying coverage. These identified changes underscore the dynamic nature of LULC alterations and their potential implications for the environmental, hydrological, and agricultural aspects within the Hakaluki Haor region. The outcomes of this study aim to provide valuable insights to policymakers for formulating appropriate land-use strategies in the area.
1 Introduction
Wetlands are areas of natural or man-made, permanent or temporary, static or flowing fresh, brackish, or salt water bodies (Convention on Wetlands, 2021). These are highly valued ecosystems for providing significant services to humanity, ranging from freshwater supply, food, groundwater recharge, flood control and climate change mitigation (Sieben et al., 2018). In addition, wetland ecosystems are vital in supporting floral and faunal diversity (Xu et al., 2020; Kumar et al., 2023). However, wetlands are facing degradation due to the conversion of wetland areas to croplands and human settlements to support the demands of rapidly growing population (Zekarias et al., 2021; Abdulmalik et al., 2022). In addition, infrastructural expansion and water extraction for agriculture reduce wetland areas (Prigent et al., 2012). Increases in greenhouse gases and air temperature can alter precipitation patterns, cause drought or increase water levels. These changes can either reduce water levels in wetland areas or flooding and affect the biodiversity of wetland ecosystems (Choudhury et al., 2021; Nayak, 2022).
Both anthropogenic and natural phenomena drive the land use and land cover (LULC) changes in wetland ecosystems, which significantly impacts the ecology of wetlands (Bakr and Afifi, 2019; Assefa et al., 2021). Imran et al. (2023) reported that human activity is one of the key reasons for fish decline in the Hakaluki Haor. Research conducted on Tanguar Haor, a RAMSAR site, found that between 1989 and 2017, around 33% of the vegetation cover was converted into agricultural land due to rapid population increase (Haque et al., 2021). Climate change through increasingly erratic weather patterns that include temperature rises, unpredictable rainfall and flash floods impacts fish ecology and diversity in the haor ecosystems in Bangladesh (Majumder et al., 2013; Pandit et al., 2023).
Monitoring wetlands can offer significant insights into their functioning and responses to anthropogenic and environmental shifts (Stratford, 2018). Thus, understanding and identifying these changes in wetland ecosystems is crucial for effective environmental management, resource planning and decision-making processes (Gokce, 2018). Traditional labor-intensive field-based and satellite-based monitoring strategies have been employed for monitoring wetland ecosystem. However, globally, satellite-based remote sensing has become an inevitable tool for monitoring and evaluating LULC change patterns, thereby contributing to the long-term sustainability of wetland resources (Hossain et al., 2021; Kavhu et al., 2023).
The commonly used method of classifying remotely sensed images, for example, the Maximum Likelihood approach, requires downloading and managing large datasets, which results in higher computational requirements and comparatively longer processing times. As a result, there is an increasing inclination toward using machine learning algorithms in cloud-based platforms worldwide to analyze LULC classifications and estimate long-term changes because of their effectiveness (Lary et al., 2016; Biswas et al., 2023). Cloud-based platforms, e.g., Google Earth Engine, allow researchers to use different Machine Learning algorithms, i.e., CART, Random Forest (RF) and Support Vector Machine (SVM), which are gaining popularity in this regard (Shaharum et al., 2020; Loukika et al., 2021).
Bangladesh, a low-lying deltaic country in South Asia, has a vast network of wetlands that occupy over 7–8 million hectares, making up almost 50% of its total area (Akonda, 1989; Yousuf Haroon and Kibria, 2017). Bangladesh is a signatory to the RAMSAR convention, an international treaty to sustainably conserve wetlands ecosystems from natural and anthropogenic threats (Mulligan and Griffin, 2012; DBHWD, 2016). The wetland network of Bangladesh possesses various hydrological features, including rivers, floodplains, lakes, haors (backswamp), baors (oxbow lake), beels (deepr part of floodplain), fishponds, swamps, and low-lying regions, generally classified as wetlands, with ‘haors” specifically denoting seasonal/intermittent freshwater floodplains (Khan et al., 1994; DBHWD, 2016). During the monsoon season, haors—essentially bowl-shaped depressions nestled between the natural leaves of rivers—receive surface runoff and transform into vast water bodies for about 6 months of the year (Nishat et al., 1993). According to the DBHWD (2016), the haor region comprises 373 haors spanning approximately 859,000 hectares, constituting 10% of the nation’s overall wetland area. Recognizing significance, two freshwater haors have been declared as RAMSAR sites: Tanguar Haor and Hakaluki Haor. The importance of freshwater wetlands is profound; however, a recent study conducted by Waleed et al. (2023) revealed a concerning trend of wetland degradation in the north-eastern part of Bangladesh. This study reported about an 80% reduction in some of the wetlands from this region.
Hakaluki Haor, a freshwater wetland, is a vital RAMSAR site in Bangladesh’s Northeast hydrological region (WARPO, 2001; DBHWD, 2016). This Ecologically Critical Area (ECA) supports diverse biodiversity and fisheries resources (Choudhury and Nishat, 2005). About 200,000 people living in the vicinity of the haor directly or indirectly depend on the wetland resources (Banglapedia, 2021). However, the degradation of land cover in Hakaluki Haor caused by natural events like siltation, droughts, human activities, and insufficient monitoring and management might affect the entire ecosystem. Therefore, these wetlands need constant monitoring. While satellite-based techniques are extensively utilized globally, their application in Bangladesh for evaluating change and monitoring wetlands remains limited. Noteworthy studies include those conducted by Waleed et al. (2023) on ML-based study of wetlands in the Sylhet region, Haque and Basak (2017) on Tanguar Haor, Bhattacharjee et al. (2021) on Lakshibaur-Nalair Haor, and Islam et al. (2018) on Hakaluki Haor.
Here, we conduct a comprehensive analysis of LULC dynamics of Hakaluki Haor applying a Machine Learning algorithm (CART) and Google Earth Engine. While Random Forest is considered to be a more robust ML algorithm in Google Earth Engine (GEE), many researchers have applied the decision tree-based algorithm, particularly Classification and Regression Trees (CART), for accurately mapping changes in land cover of wetland habitats (Yao et al., 2019; Chen et al., 2021; Aslam et al., 2024). CART is a simple, fast, and computationally efficient algorithm with straightforward visualization and analysis extensively used for land use change analysis (Amani et al., 2017; Sang et al., 2019; Yao et al., 2019; Arpitha et al., 2023; Iandolo et al., 2024).
Classification and Regression Trees (CART) is particularly useful for classifying satellite images to identify different land use patterns due to its intuitive and interpretable decision-making process, ability to capture complex non-linear relationships, and robustness in handling high-dimensional and noisy data. The binary tree structure of CART allows it to efficiently select relevant features and make accurate classifications based on the hierarchical decision rules, which mimic human decision-making processes. This makes CART an effective tool for distinguishing between various land use categories in satellite imagery, providing clear and actionable insights into land use patterns (Blanquero et al., 2021; Biswas et al., 2023). CART also offers built-in functionality for handling large geospatial datasets. Although Support Vector Machines (SVM) are frequently reliable, their black-box nature sometimes restricts the interpretability of decision rules. For these reasons, we utilized the CART algorithm in GEE for the study.
This study spans a temporal scope from 2000 to 2023, focusing on two distinct seasons- rainy and dry. Each season spanned 6 months and was chosen to provide a more comprehensive representation of the actual conditions. As relying solely on dry or rainy seasons, data may not accurately capture the full spectrum of LULC dynamics of the haor basin. Employing remote sensing techniques to mosaic imagery across multiple years and seasons, the study aims to detect spatio-temporal LULC change patterns focusing on differences in the two distinct seasons of different land cover types within this critical wetland. The study also aims to provide valuable insights into the complex interactions between seasonal variations and human-environment interactions in this freshwater wetland of great importance.
2 Materials and methods
2.1 Study area
Covering around 8.5% of Bangladesh’s total area, the Sylhet Division consists of four districts in the northeastern region: Habiganj, Moulvibazar, Sunamganj, and Sylhet. The region is characterized by the Surma-Kusiyara floodplains and contains over 6,000 haors. Approximately two-thirds of these are permanent, while the rest are seasonal, when pre- and monsoon rains flood the area (Brammer, 2012; Climate Change Impacts and Adaptation Assessment in Bangladesh, 1999; Haque et al., 2017). The present study is conducted at Hakaluki Haor, which lies between 24° 34′ N and 24° 47′ N latitudes and 92° E and 92° 10′ E longitudes (Figure 1). The total area of the study region is approximately 410.56 square km.
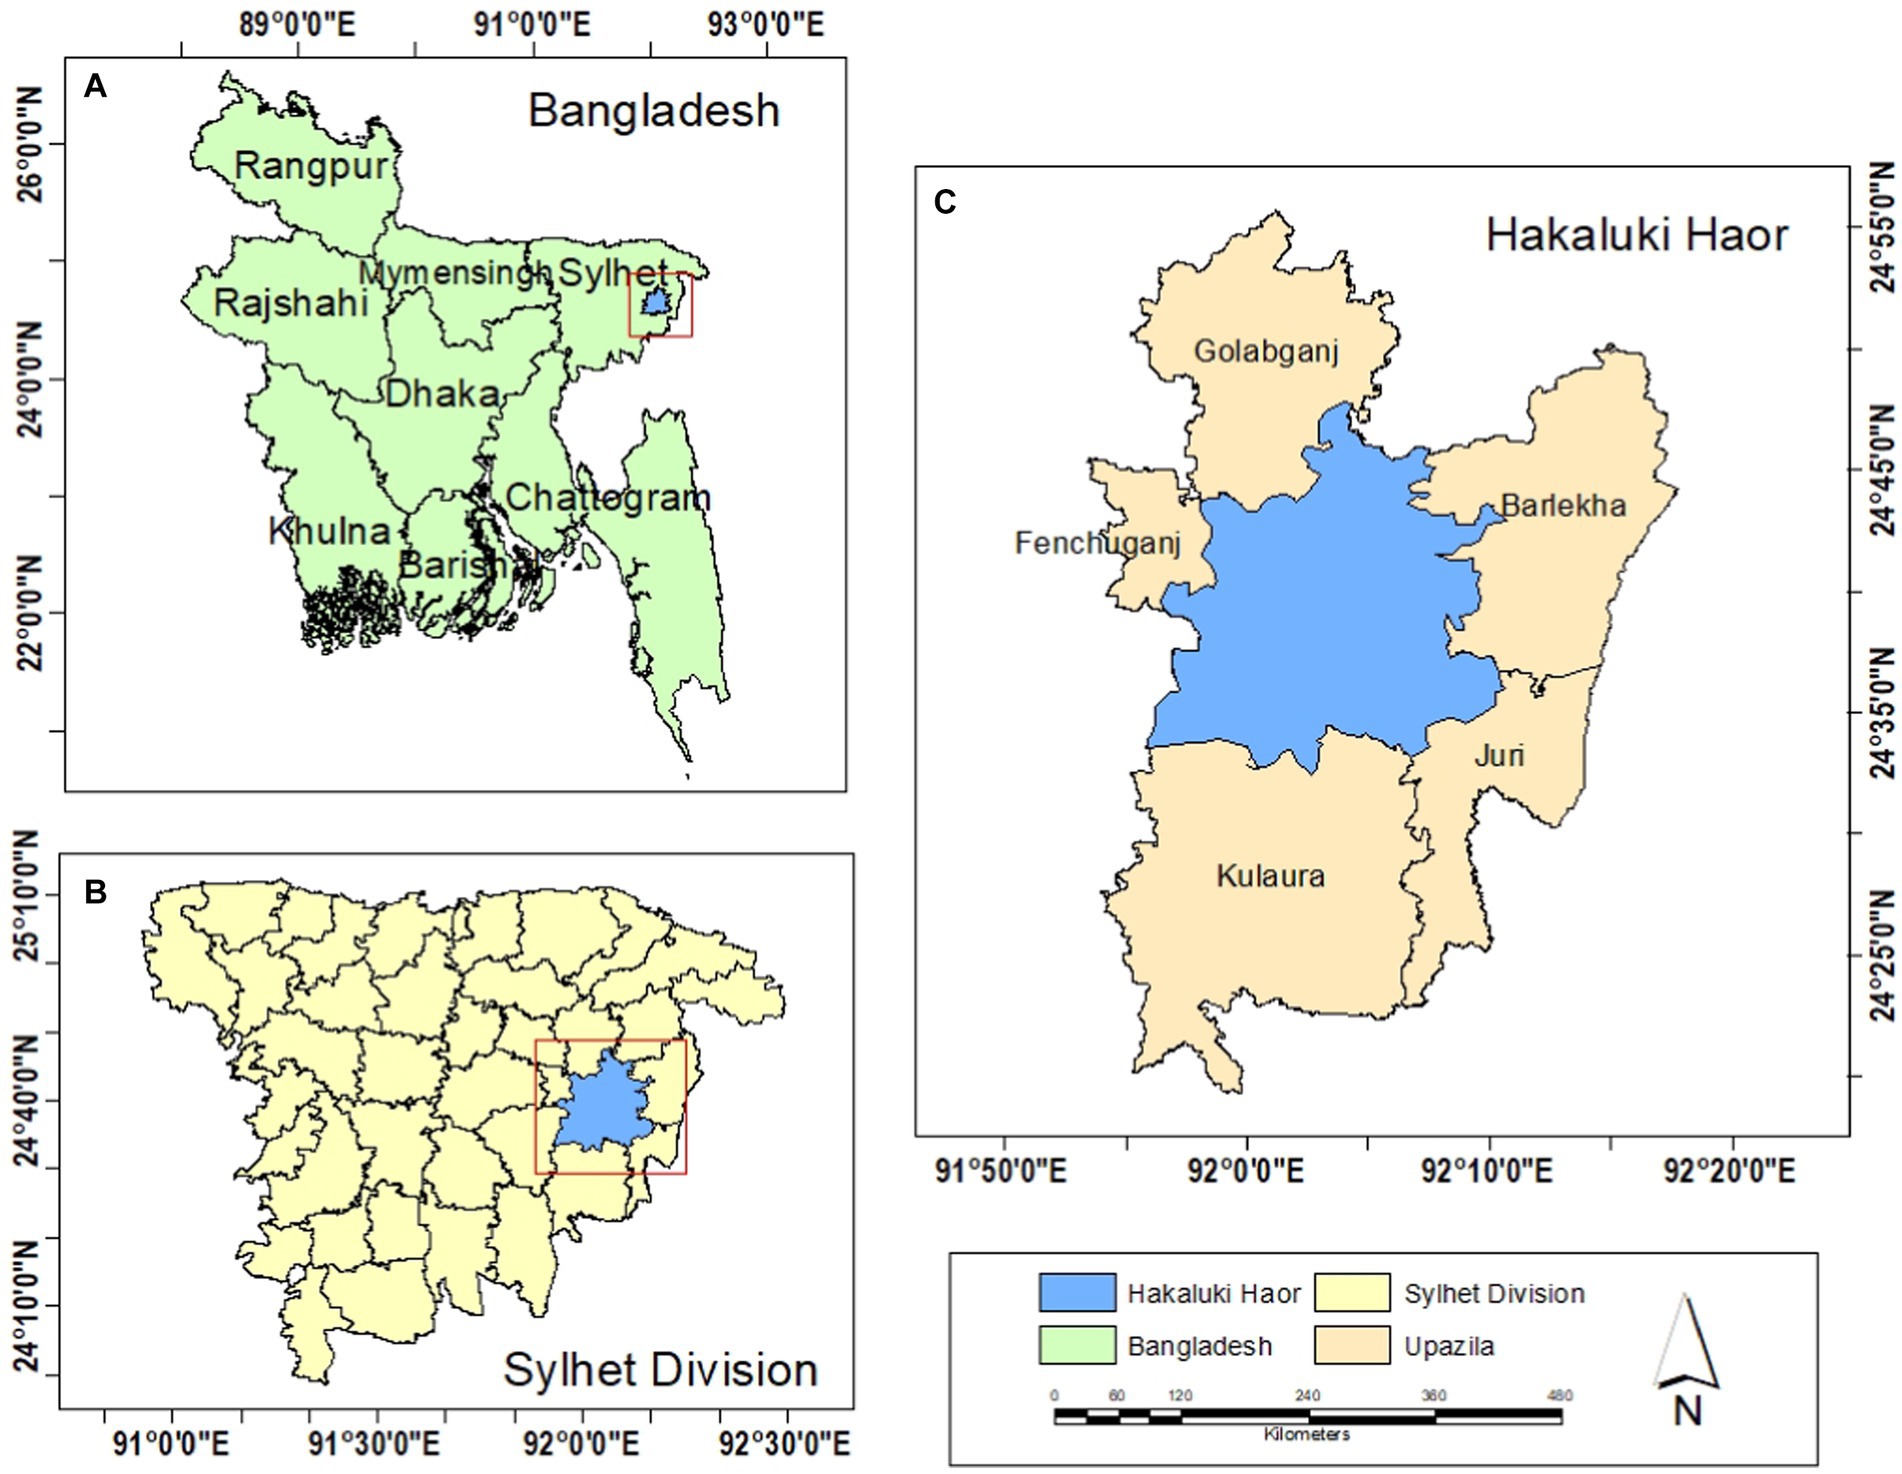
Figure 1. Geographical location of the Study area: (A) Location of Bangladesh, (B) Location of Greater Sylhet region and (lower-right) and (C) Map of the Hakaluki Haor, the study area.
The Haor is in a low-lying depression bordered by the Patharia and Madhab hills to the East and the Bhatera hills to the West. The structure has more than 238 interconnected beels, some permanent and others seasonal. The climate of this area is greatly influenced by the onset and end of the annual monsoon, leading to the recognition of four different seasons (pre-monsoon season, from April to May, is characterized by a progressive augmentation in precipitation; the monsoon season, from June to September, is characterized by long-lasting and heavy precipitation; post-monsoon season, from October to November, is characterized by a decrease in rainfall; and dry season, from November to March, is characterized by limited or no rainfall). During post-monsoon season, only a minute portion of 3 to 4% of the overall precipitation takes place. During the monsoon season, the haor significantly increases water levels, whereas it becomes dry in the dry season. This study utilized two distinct seasons, i.e., rainy season extends from May to October and the dry season extends from November to April.
2.2 Data collection and analysis
This study utilized the Landsat images from 2000 to 2023. The detailed procedure, which solely depends on the GEE environment, is depicted in Figure 2.
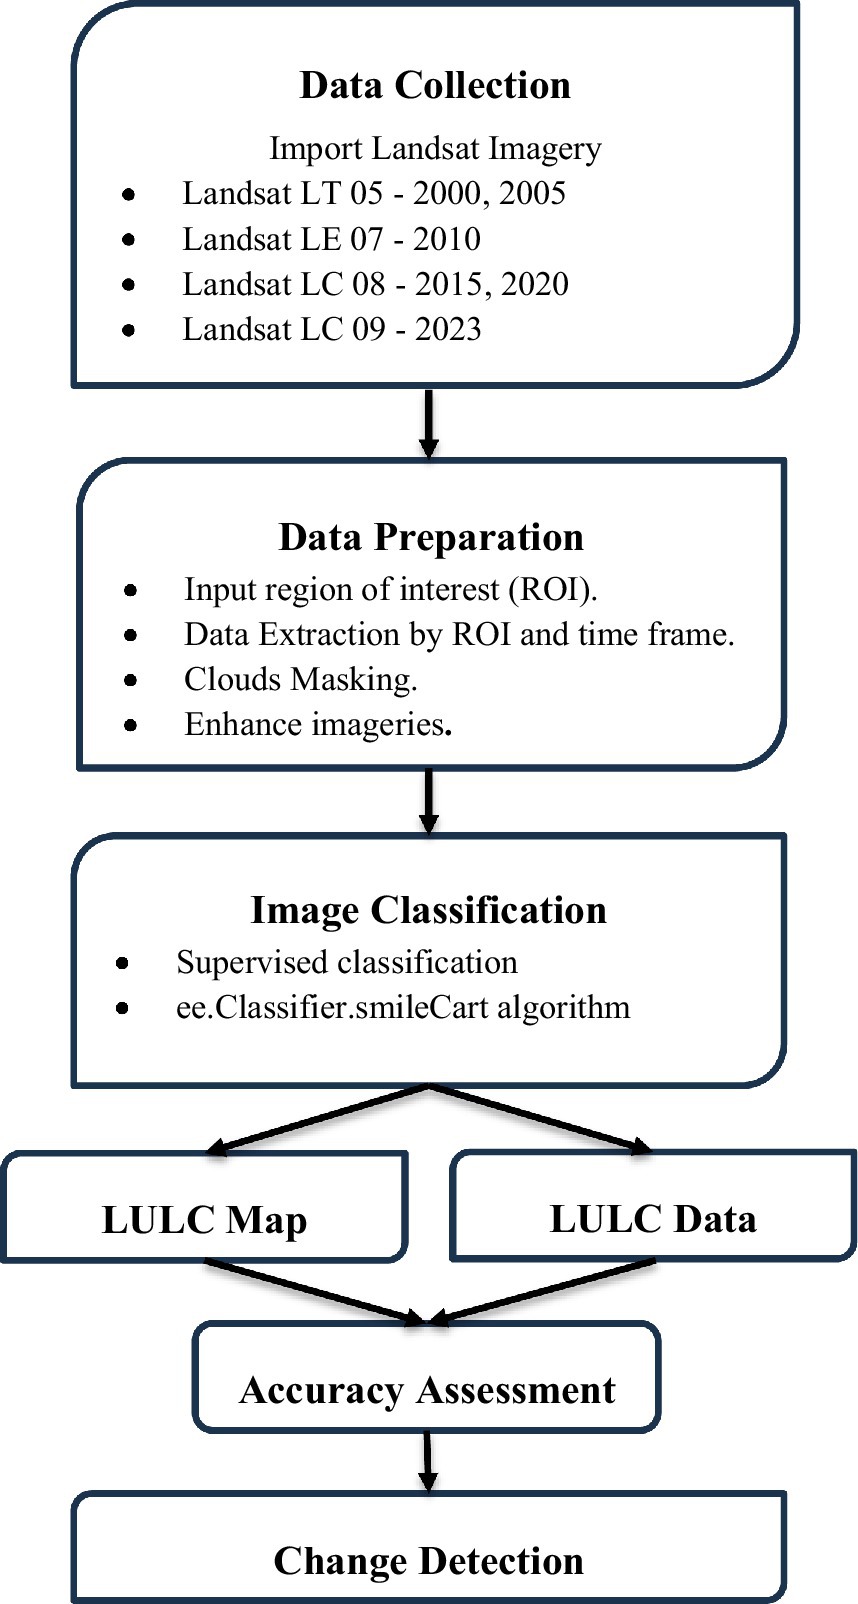
Figure 2. Flow chart of methodology.
2.3 Data acquisition
The study utilized United States Geological Survey (USGS) Landsat-5 (Collection 2 Tier 1 TOA Reflectance), Landsat-7 (Collection 2 Tier 1 TOA Reflectance), Landsat-8 (Collection 2 Tier 1 TOA Reflectance), and Landsat-9 (Collection 2 Tier 1 TOA Reflectance) data, along with remote sensing data accessible through Google Earth Engine (GEE). The images used in this study were taken at five-year intervals in the years 2000, 2005, 2010, 2015, 2020, and 2023. Due to the dynamic nature of the haor, shorter intervals may not adequately capture trends in transitions of LULC patterns. For this, a 5-year interval was chosen to depict significant shifts in LULC patterns. These images represent the surface reflectance data obtained from the sensors of Landsat-5 TM, Landsat-7 ETM+, Landsat-8 OLI/TIRS, and Landsat-9 OLI/TIRS after undergoing atmospheric correction.
The authors standardized the surface reflectance data obtained from the sensors of Landsat-5 TM, Landsat-7 ETM+, Landsat-8 OLI/TIRS, and Landsat-9 OLI/TIRS by using Google Earth Engine, which provides access to pre-processed datasets that include both radiometric and geometric corrections. This directly addresses the concern about different radiometric and slight variations in geometric attributes. Google Earth Engine’s pre-processed datasets are inherently correct for sensor-specific characteristics and acquisition dates, ensuring consistency in reflectance values across different Landsat missions. One key issue is the variation in spatial resolution among the sensors. Landsat-5 TM has a spatial resolution of 30 m for visible, near-infrared (NIR), and shortwave infrared (SWIR) bands, and 120 m for the thermal infrared (TIR) band. Landsat-7 ETM+ offers 30 m for visible, NIR, and SWIR bands, 15 m for the panchromatic band, and 60 meters for the TIR band. Landsat-8 OLI/TIRS and Landsat-9 OLI/TIRS both have 30 m for visible, NIR, and SWIR bands, 15 m for the panchromatic band, and 100 m for TIR bands (collected at 100 m and resampled to 30 m).
To address these differences, Google Earth Engine standardizes spatial resolution through resampling techniques, ensuring that all datasets are harmonized to a common resolution, typically 30 meters for most analyses. In addition to radiometric and geometric corrections, inherent standardization processes in Google Earth Engine include radiometric calibration, atmospheric correction, and geometric correction. These processes ensure that the data is comparable and reliable across different sensors. To further enhance standardization, cloud masking processes were employed to remove cloud and cloud shadow pixels, thereby ensuring the quality and accuracy of the surface reflectance data.
These steps were crucial in mitigating variations and ensuring the datasets were consistent for change detection analysis. The overall accuracy and kappa coefficient of the classification findings were subsequently assessed using ground truthing data obtained via Google Earth and GPS, validating the results.
The ground truthing data from 74 locations for the year 2023 was collected through field visits using the Global Positioning System (GPS) device (Figure 3). For the previous years, 100 reference validation points were generated from Google Earth applying random sampling method for each map by following the methods of (Rwanga and Ndambuki, 2017). Features found in the historical images from Google Earth were compared with the classified images. Table 1 provides comprehensive data regarding satellite imaging. Data were collected for two seasons, dry (November to April) and rainy (May to October). In total, 72 images were considered for this study (6 images per season × 2 seasons × 6 years).
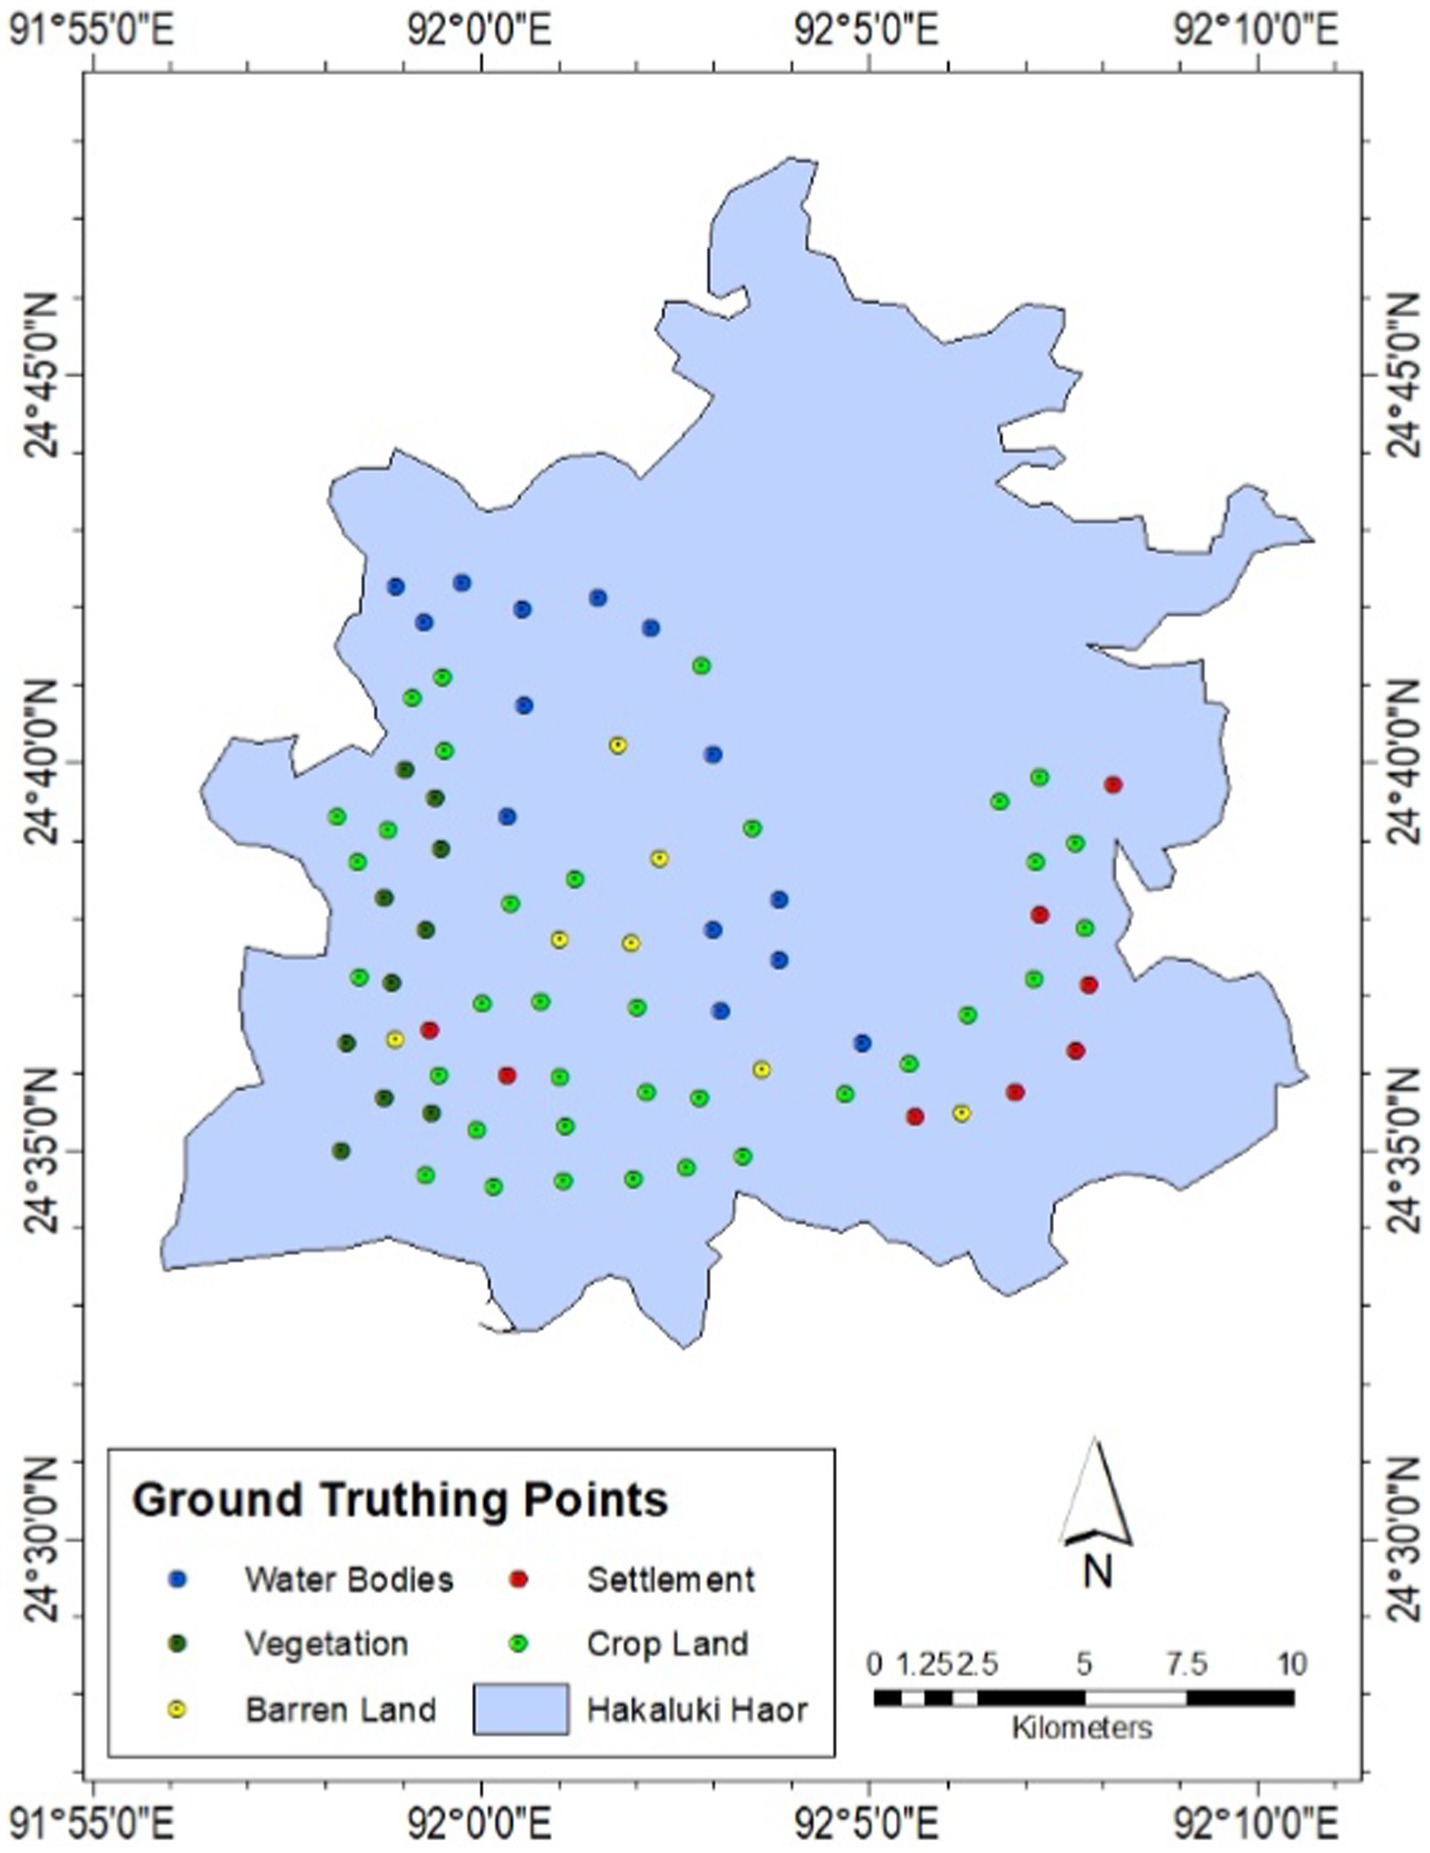
Figure 3. Ground-truthing data points for on-site visits in 2023.
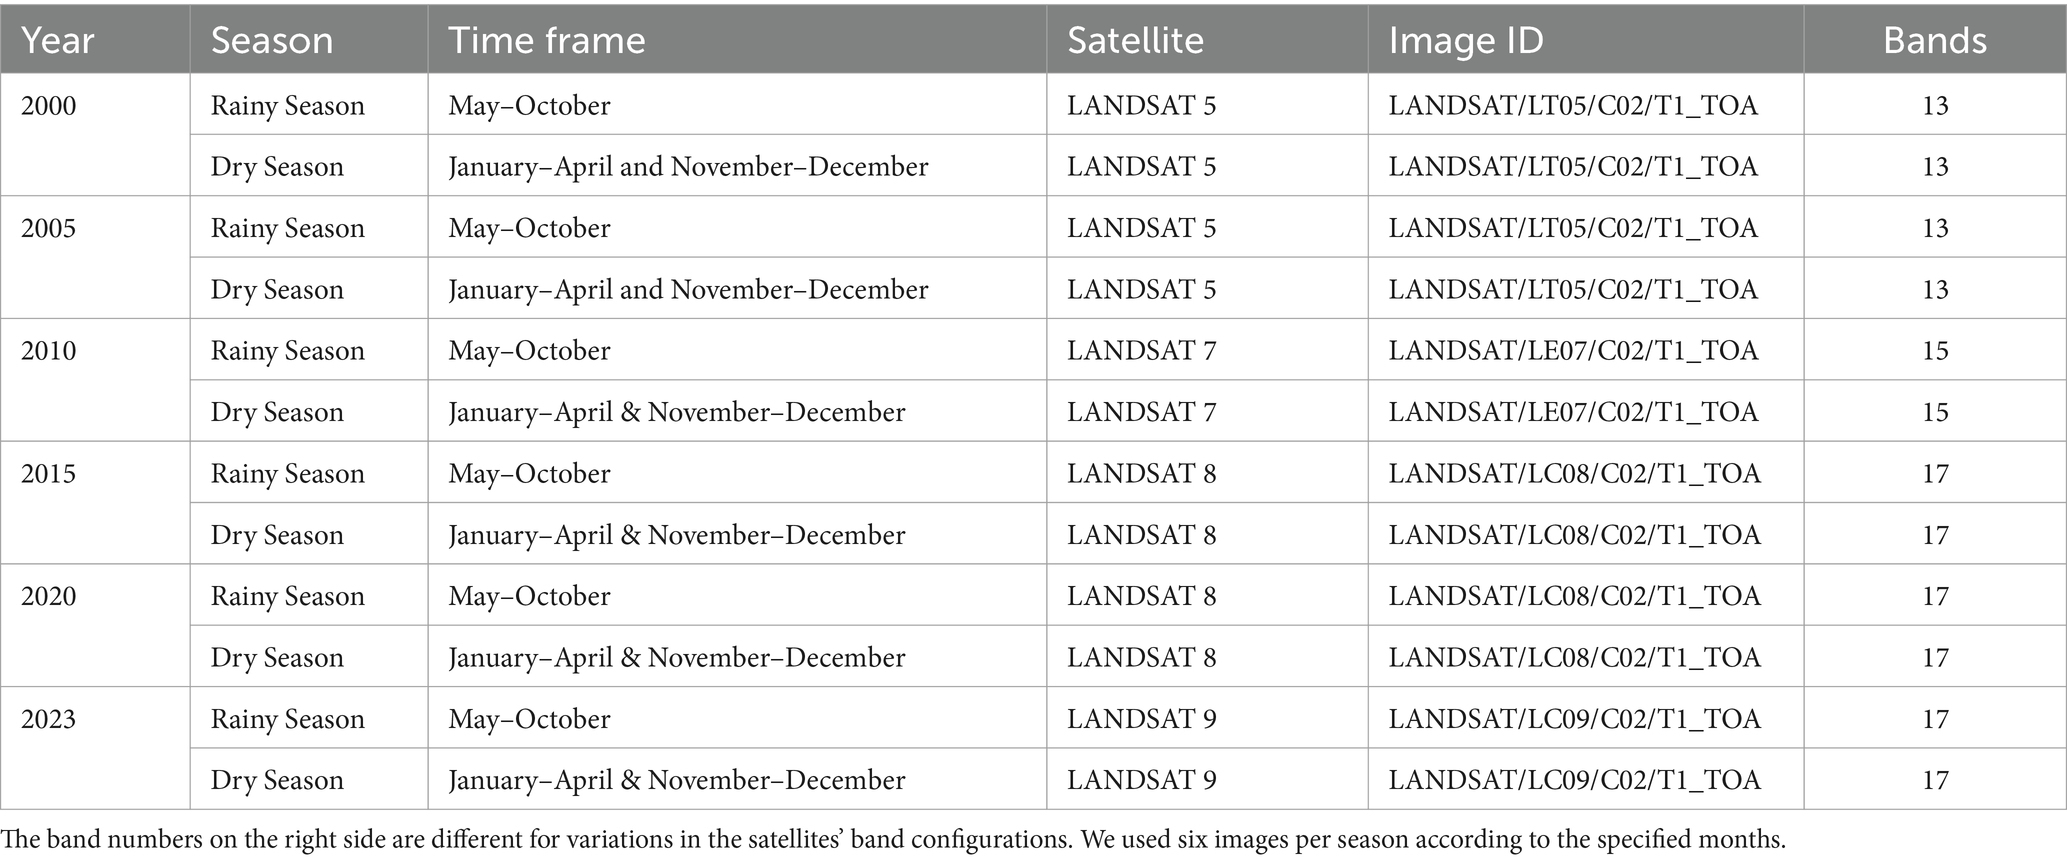
Table 1. Data Sources: data for the years 2000 and 2005 were collected from Landsat 5, for 2010 from Landsat 7, for 2015 and 2020 from Landsat 8, and for 2023 from Landsat 9.
2.4 Classification scheme
After conducting a comprehensive literature review and drawing upon prior knowledge in the study area, a subsequent classification system is formulated as depicted (Table 2).
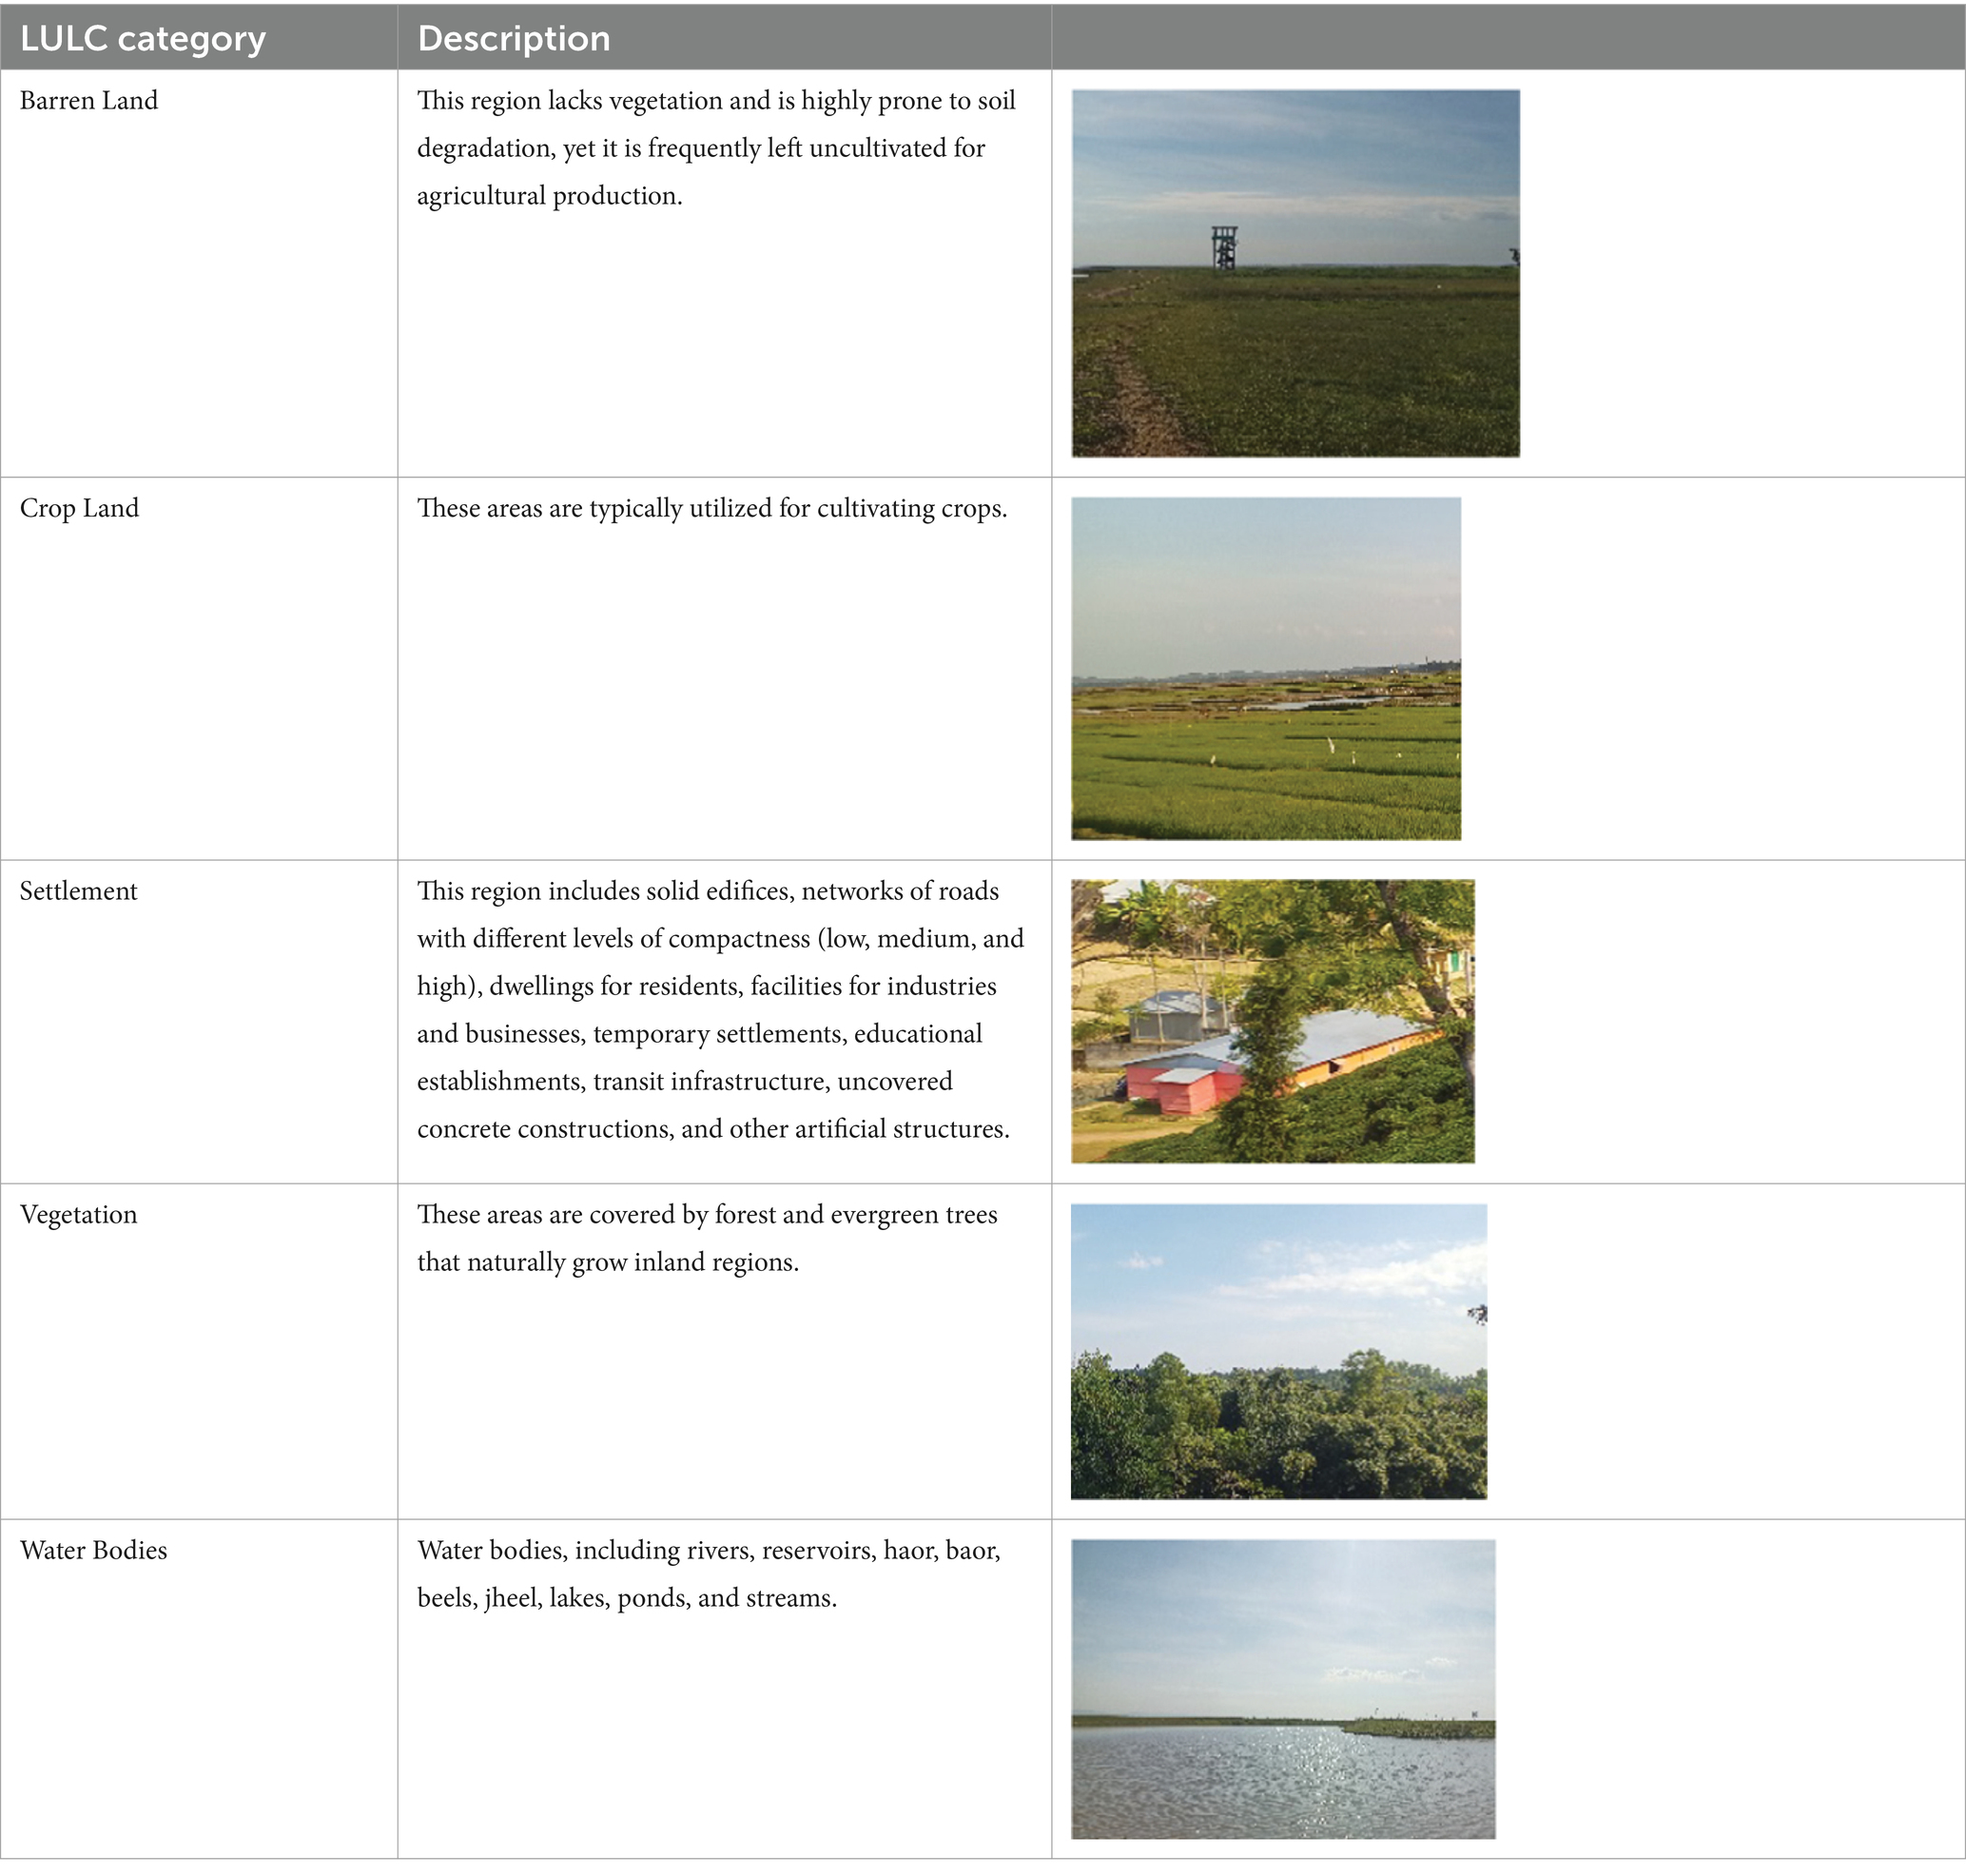
Table 2. LULC classification categories, brief description, and images (Image by Authors).
2.5 Classification and regression tree classifier algorithm
Leo Breiman first proposed the Classification and Regression Trees (CART) algorithm in 1984. Bittencourt and Clarke (2003) stated that CART algorithms use decision trees for non-parametric pattern classification. Using if-else decision rules, these trees build a model containing Root Nodes, Decision Nodes, and Terminal Nodes. Its usefulness is increased by a more robust tree with additional branches. Using a cost-complexity parameter, CART prunes a massive tree it built using binary decision trees in order to minimize cross-validation error (Loh, 2014). Surrogate splits are used to deal with missing data, and the model is checked using testing and training samples (Shaharum et al., 2020). Taking into account the limits of high-dimensional data and the effects of sample size on effectiveness, CART’s recursive operation makes simple decisions possible using the “classifier.smileCart” method from the GEE library (Loukika et al., 2021).
CART is a widely used machine-learning algorithm for image classification (Amani et al., 2017; Sang et al., 2019). In this study, we used CART algorithms for LULC classification. However, more Machine Learning algorithms like SVM and RF could be used to assess the changes and find which algorithm best suits these change analyses in the context of freshwater wetlands. We will work on these research areas in the near future. These research findings could significantly assist GIS analyses in haor areas and localized investigations. Mitigating the loss of Water Bodies and Vegetation requires rigorous conservation measures.
We employed the supervised classification (Smile CART classifier) method within Google Earth Engine to delineate the land cover within the study area. We manually gathered representative training samples for each land cover target class, referenced by spectral characteristics observed in high-resolution imagery from Google Earth Pro. Training data were collected from various locations across the study area, ensuring comprehensive representation for each class. We implemented a structured methodology, assigning 70% of the sample points for training the model and reserving the remaining 30% for validation purposes. This partitioning facilitated the construction of a robust predictive model, utilizing training samples for model development and testing samples for performance validation. Before training the Smile CART classifier algorithm with the designated data, we defined the model with essential arguments, including features, classProperty, and inputProperties. Iterative adjustments were made to the sample data to enhance accuracy, ultimately leading to the effective classification of LULC imagery. This classification process significantly contributed to a thorough comprehension of land use and cover dynamics in the study area, with the Smile CART classifier being instrumental in the actual classification process.
2.6 Accuracy assessment
Model evaluation is a crucial phase in the machine learning process as it validates the precision and dependability of the model. This study employed measures, including overall accuracy (OA) and kappa coefficient (k), to perform the classification procedure. The ground truthing data from 74 locations for the year 2023 was collected through field visits using the GPS device (Figure 3). For the previous years, 100 reference validation points were generated from Google Earth applying random sampling method (Rwanga and Ndambuki, 2017). This information assessed the overall accuracy and kappa coefficient of the classification findings. The formulae (1) and (2) were used to calculate the overall accuracy (OA) and kappa coefficient (K), respectively (Congalton, 1991). These calculations were based on the confusion matrix. The formulas for calculating the overall accuracy (OA) and kappa coefficient (K) are provided below.
Where, TS = Total Sample and TCS = Total Correct Sample.
An accuracy assessment was conducted to evaluate the credibility and reliability of the Land Use and Land Cover (LULC) maps during the study period. This assessment procedure involved utilizing various tools and methods, including ArcGIS 10.8 (Redlands, 2011), the Google Earth website, and on-site data collection within the study area. The data were collected from each of the land cover schemes (Figure 3).
3 Results
3.1 Accuracy assessment
Table 3 presents the accuracy assessment results, detailing Kappa coefficients and reference data percentages for the years 2000, 2005, 2010, 2015, 2020, and 2023, categorized by rainy and dry seasons. The accuracy assessments for the years 2000 to 2020 used Google Earth as the reference data source, yielding Kappa coefficients ranging from 74 to 84%. In 2023, on-site data was utilized, resulting in Kappa coefficients of 73% for the rainy season and 76% for the dry season. The results indicate varying classification accuracy across different years and seasons, with generally moderate to substantial agreement. The highest Kappa coefficient of 84% was observed in the dry season of 2000 using Google Earth data, while the lowest of 73% was recorded in the rainy season of 2023 using on-site data.
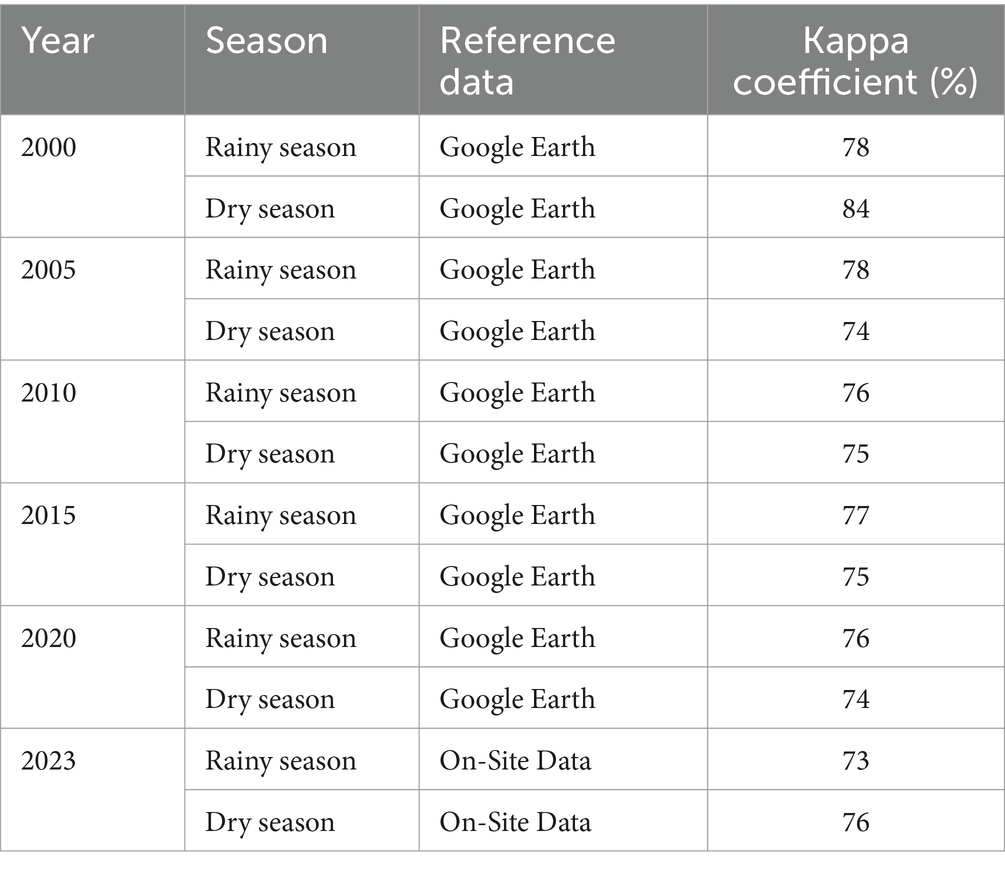
Table 3. Accuracy assessment results (Kappa Coefficients in percentage and ground-truthing on-site data in percentage).
3.2 LULC change detection
The Hakaluki Haor, our designated research area, was classified into five main categories to analyze changes in two distinct seasons from 2000 to 2023 with intervals of 5 years. The portrayal (Figure 4) highlights an overall decline (~10%) in water bodies in the rainy seasons over the 23 years. Hakaluki Haor’s water area may occasionally rise during the rainy seasons. This might be due to the inflow of too much water from river catchments and precipitation in Meghalaya, India’s uplands. So, we also analyzed the changes in the dry season to get the actual scenario. During the dry season, the water area originally covered approximately 83 km2 in 2000. After that, there was some stability until 2010, then a sharp decrease over the next 13 years, such that by 2023, it had decreased to nearly 41 km2 (Figure 5). The analysis emphasizes a worrisome overall reduction in water bodies (~51%) (Figure 6).
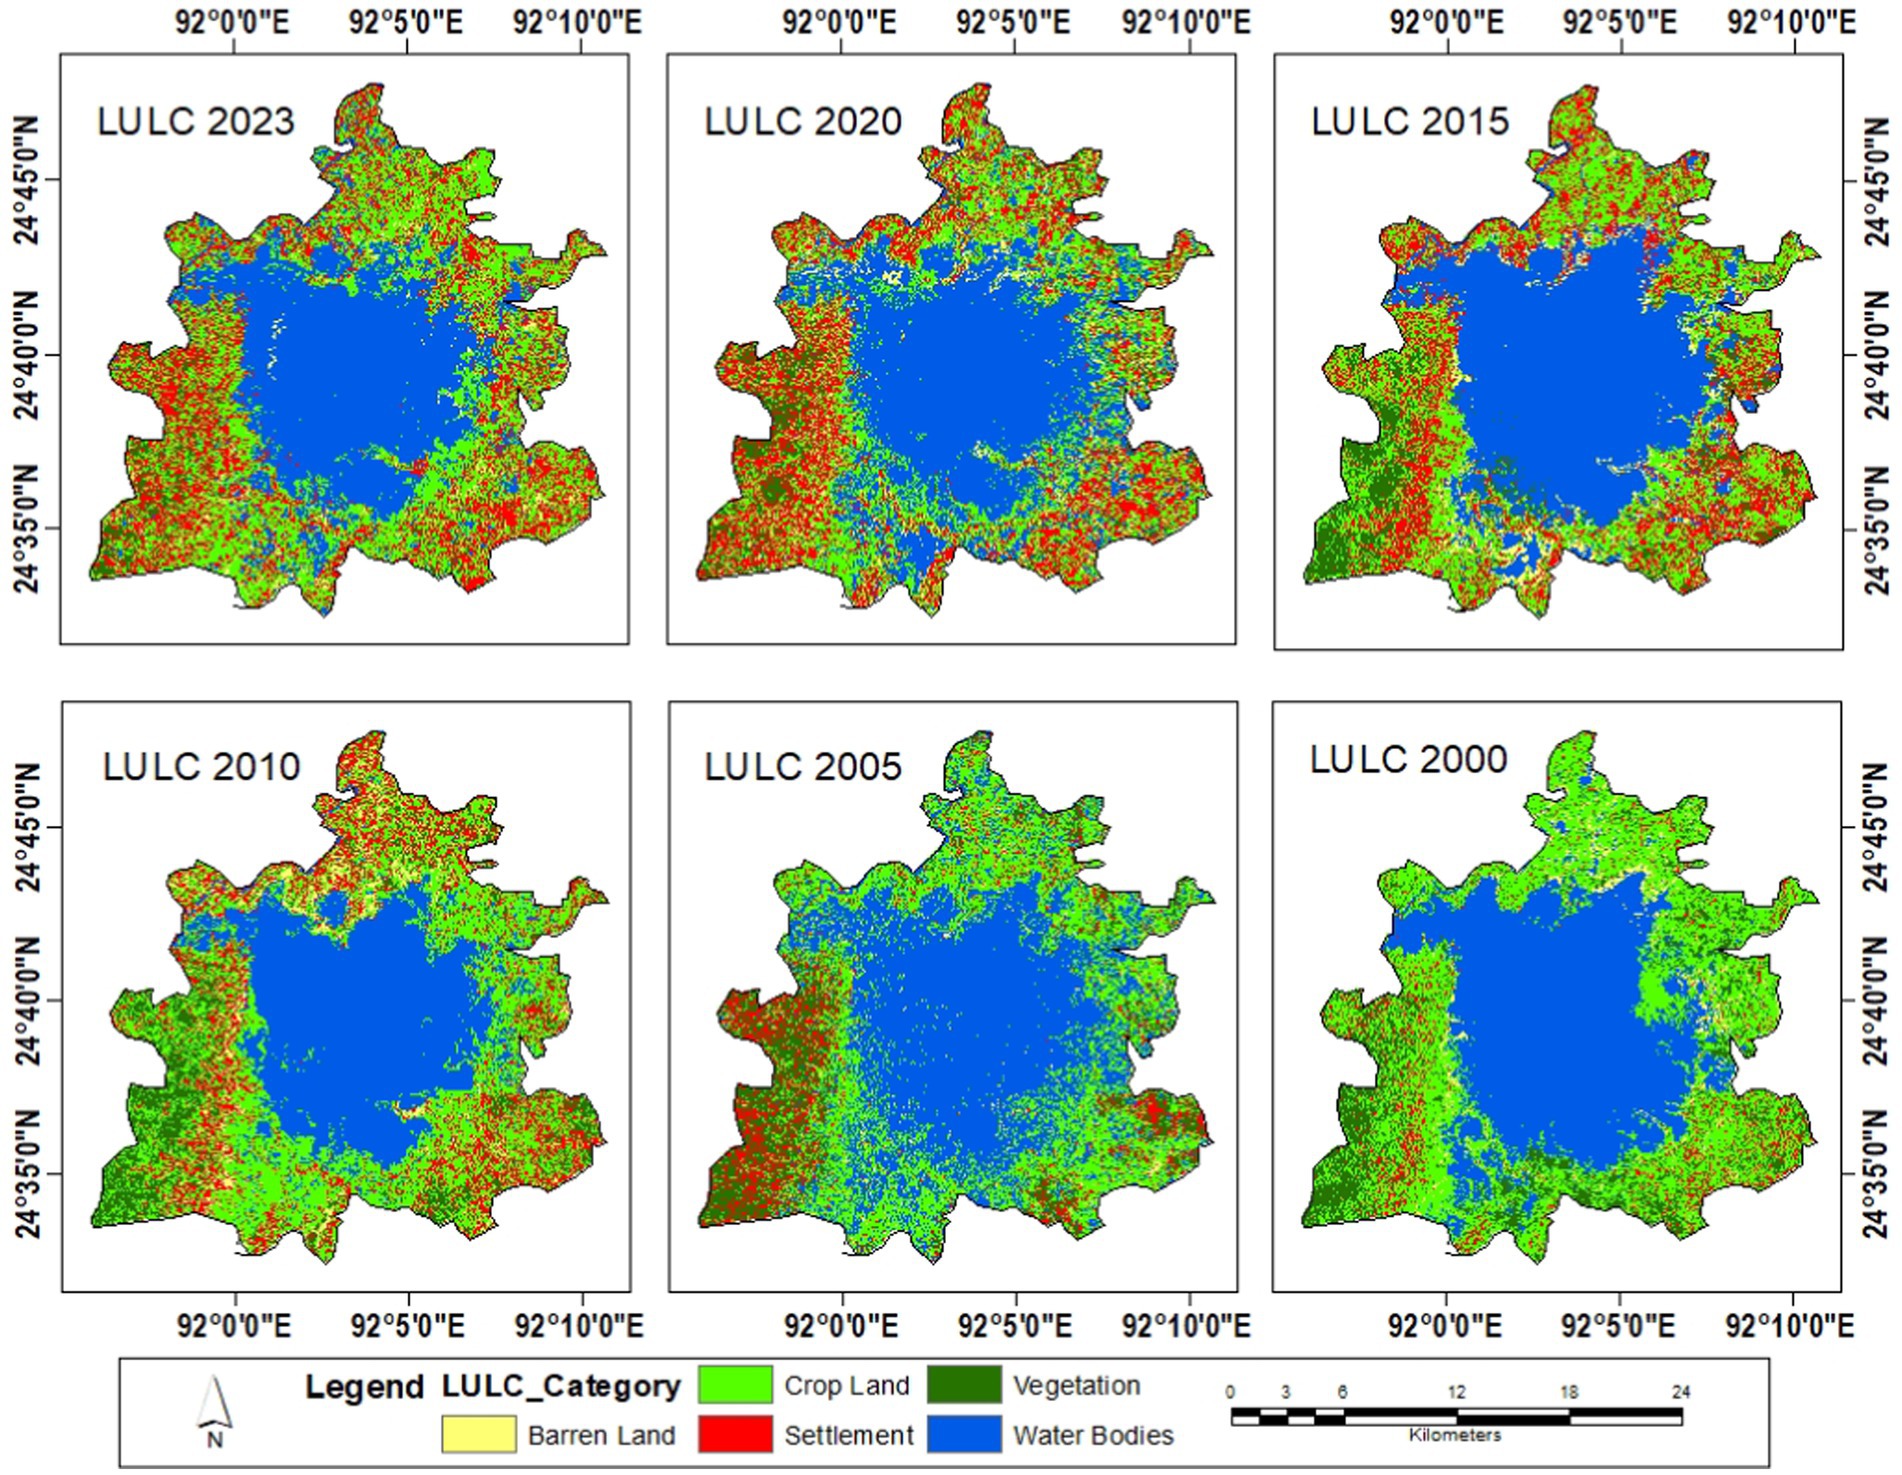
Figure 4. Changes in LULC during the Rainy season from 2000 to 2023.
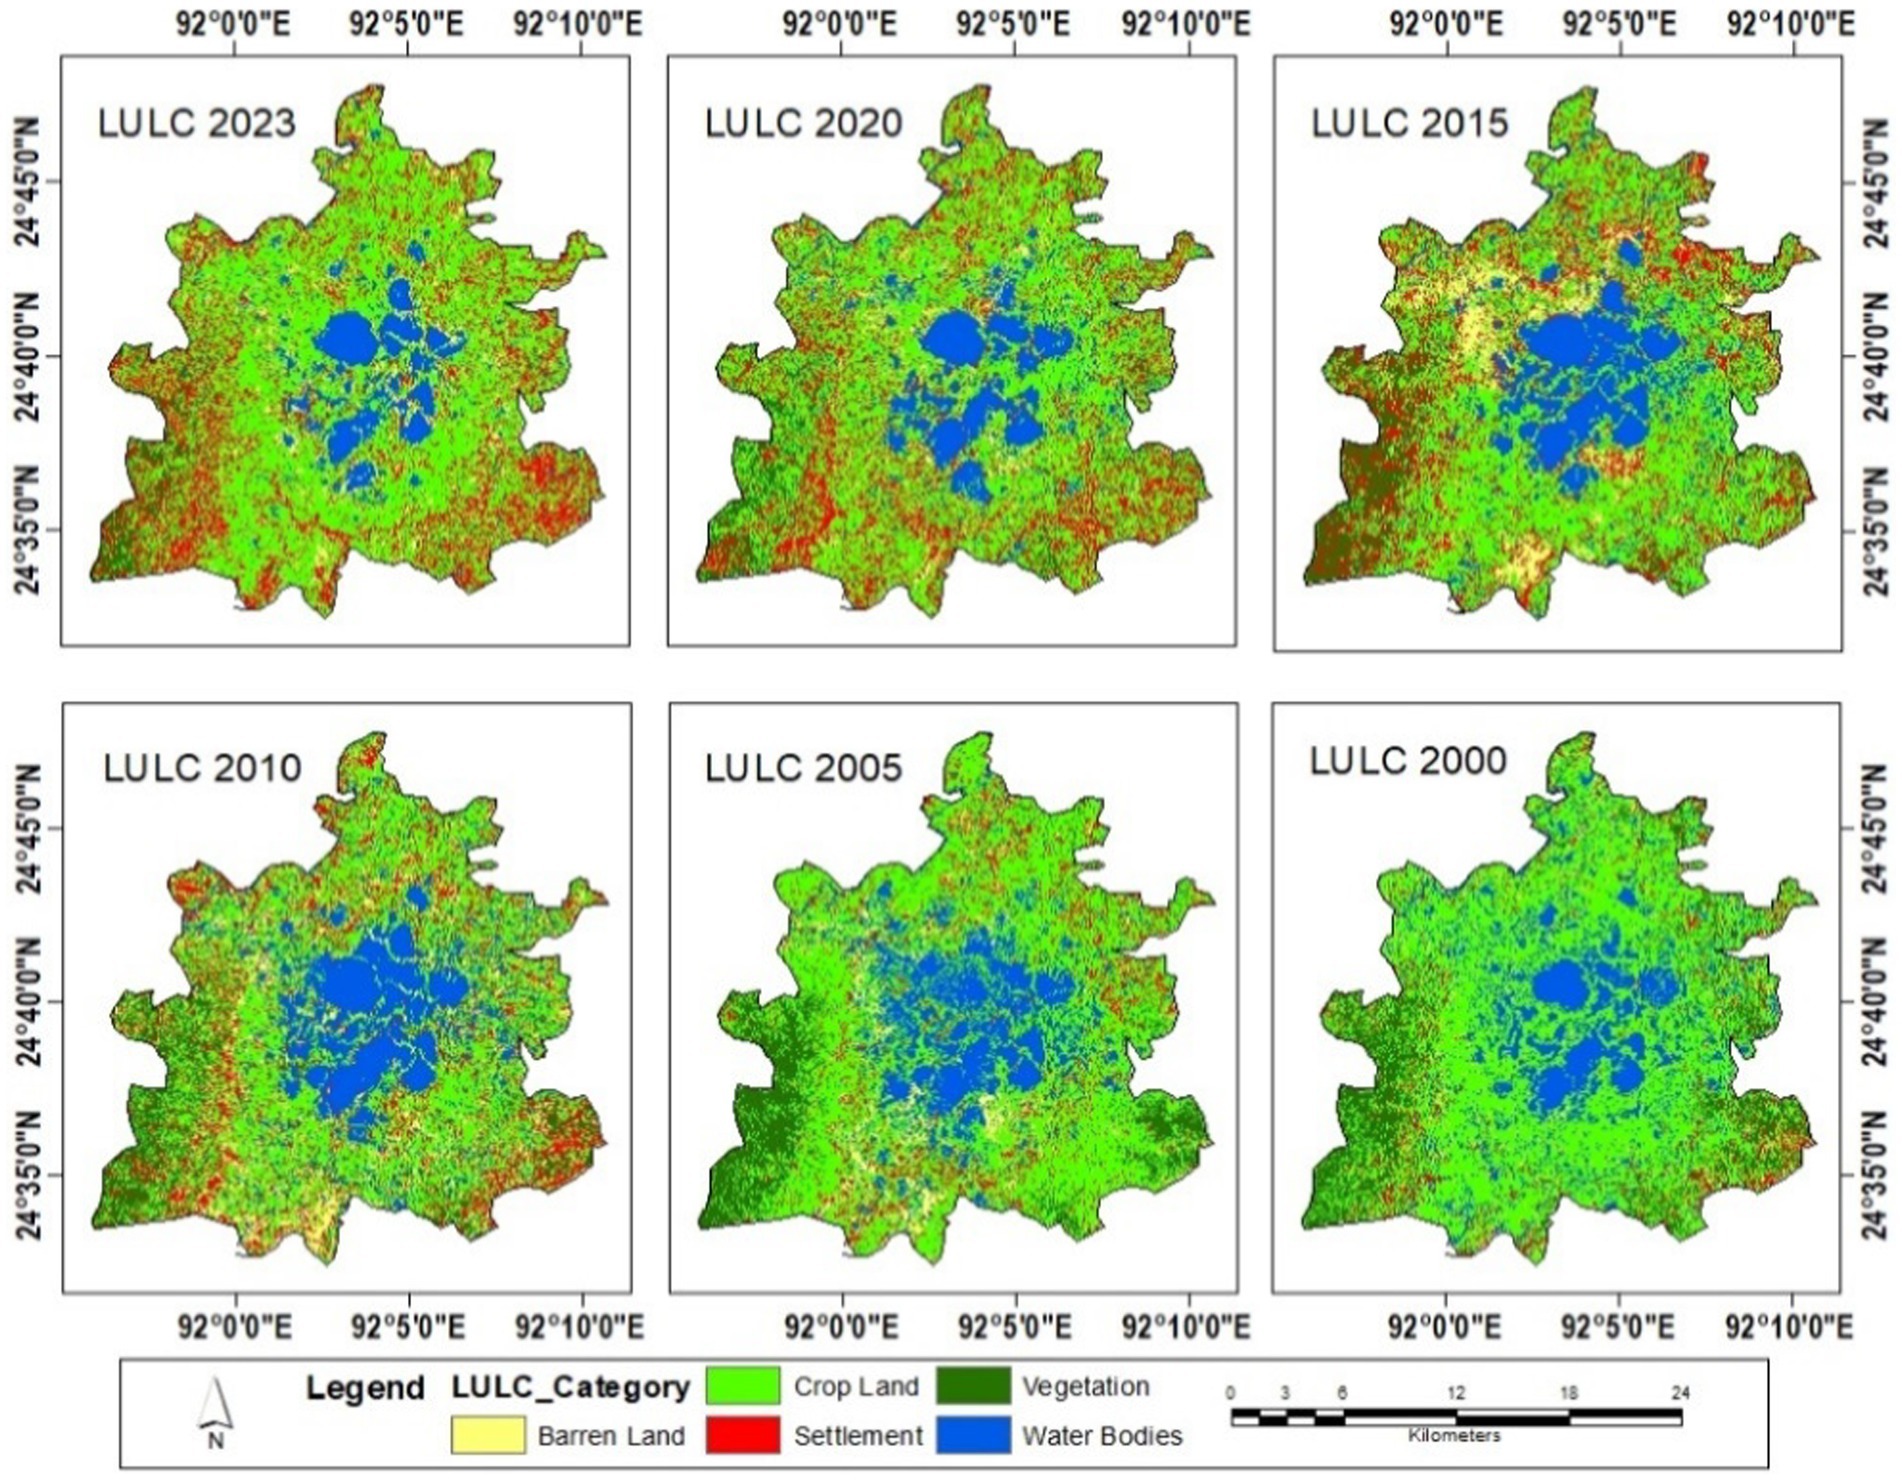
Figure 5. Changes in LULC during the dry season from 2000 to 2023.
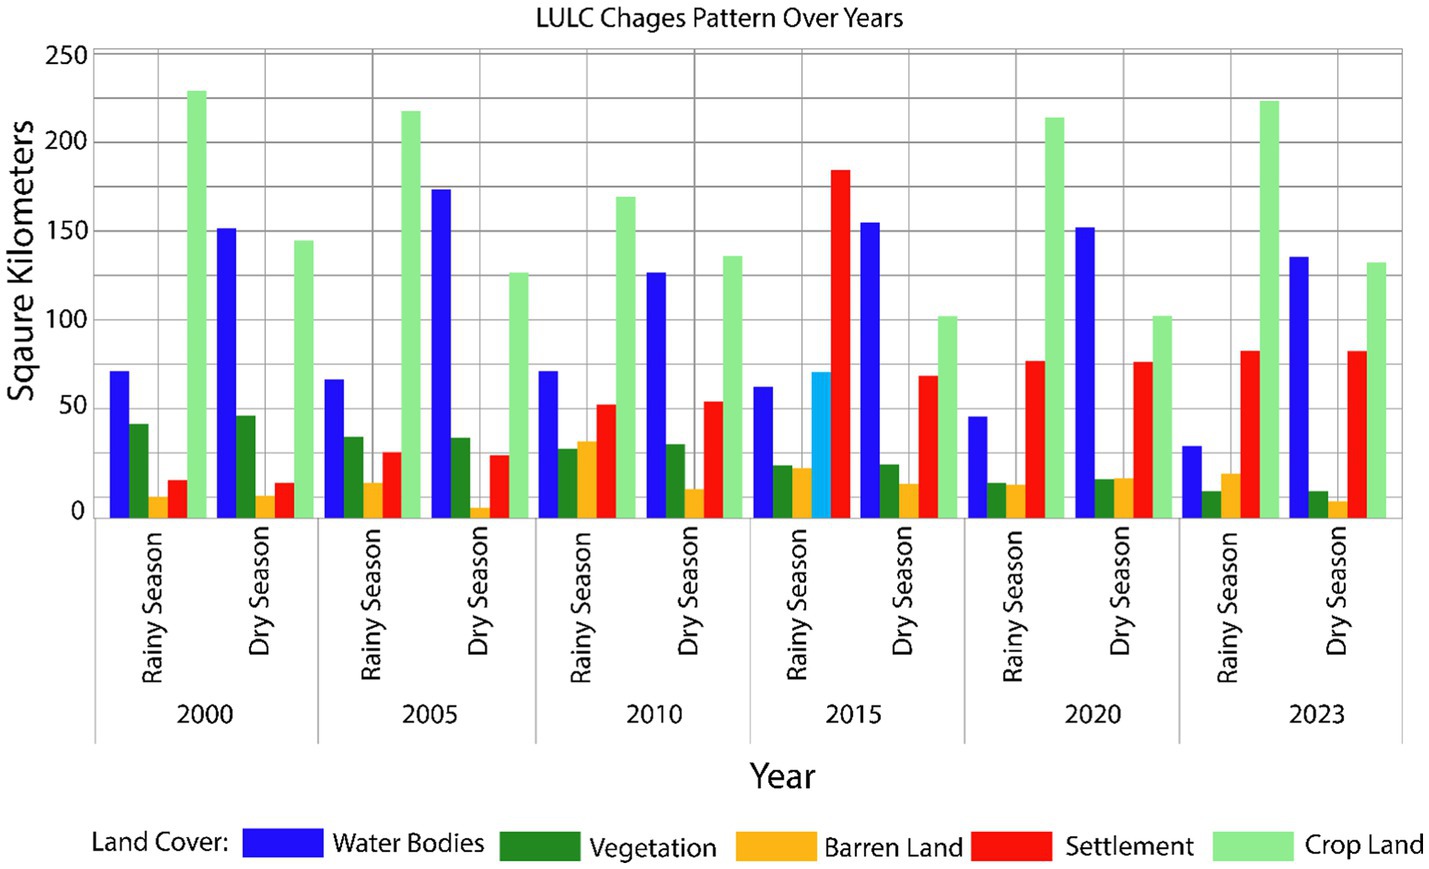
Figure 6. LULC change pattern in the Hakaluki Haor from 2000 to 2023 in both distinct seasons.
The areal coverage of vegetation had a significant decline, decreasing from nearly 58 km2 in 2020 to ~km2 in 2023 during the rainy seasons (Figure 4). This observed trend is also evident during the dry seasons, with a 71% reduction in vegetation (Figure 5). The analysis of land cover variation throughout the designated years and seasons unveils variations in the extent of cropland coverage in Hakaluki Haor. During both the rainy and dry seasons, the extent of cultivable land fluctuates noticeably between 2000 and 2023 (Figure 6). Significantly, a fluctuating trend in agricultural land coverage occurs in the years following the initial increase from 2000 to 2005.
The study revealed a substantial rise in the settlement areas in Hakaluki Haor across the given years and seasons (Figure 6). Between 2000 and 2023, a significant expansion in the inhabited area was seen throughout both the rainy and dry seasons. The habitation area increased from nearly 20 km2 in 2000 to ~94 km2 in 2023 during the rainy season and from around 22 km2 in 2000 to 94 km2 in 2023 during the dry season. Considering the rainy and dry seasons, the total percentage growth in settlement areas from 2000 to 2023 is around 353%.
The analysis of barren land in Hakaluki Haor during the study period showed significant variations in extent in both seasons (Figure 6). In 2000, the area of barren land during the rainy season was around 13km2, which decreased to nearly 12 km2 during the dry season. In 2005, there was a reduction in the barren land area to ~6 km2, which was then followed by an expansion to nearly 20 km2 during the dry season. This tendency continues with variations in succeeding years.
3.3 Change detection
Change analysis was conducted for Hakaluki Haor from 2000 to 2023, covering 23 years. This comprehensive approach enabled the assessment and evaluation of changes in land use and land cover dynamics over the specified timeframe (Figure 7). The analysis reveals a notable pattern of persistence, loss, and gain across the categories (Figure 8).
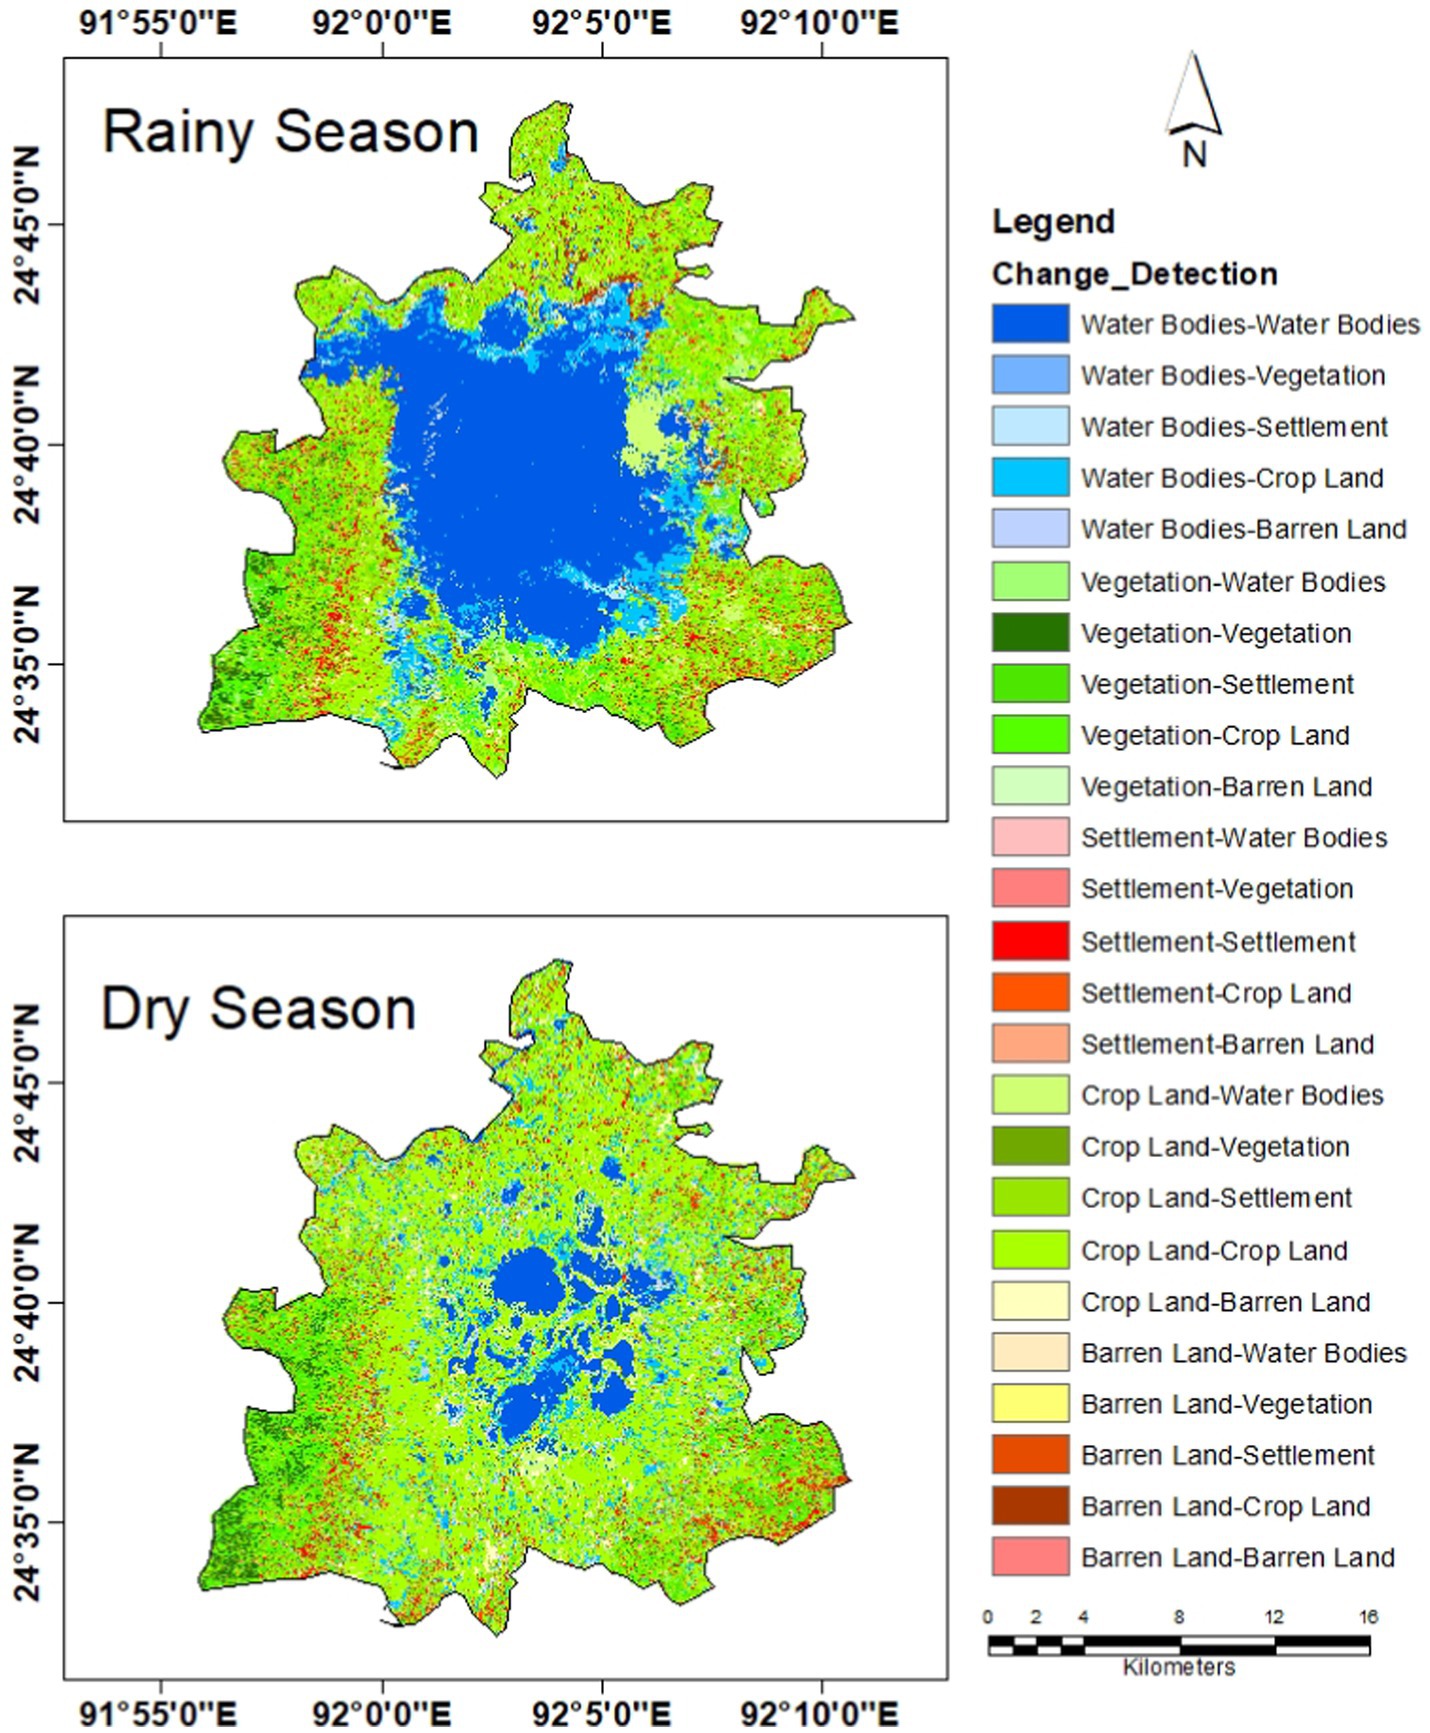
Figure 7. Land cover change detection from 2000 to 2023 in the study region.
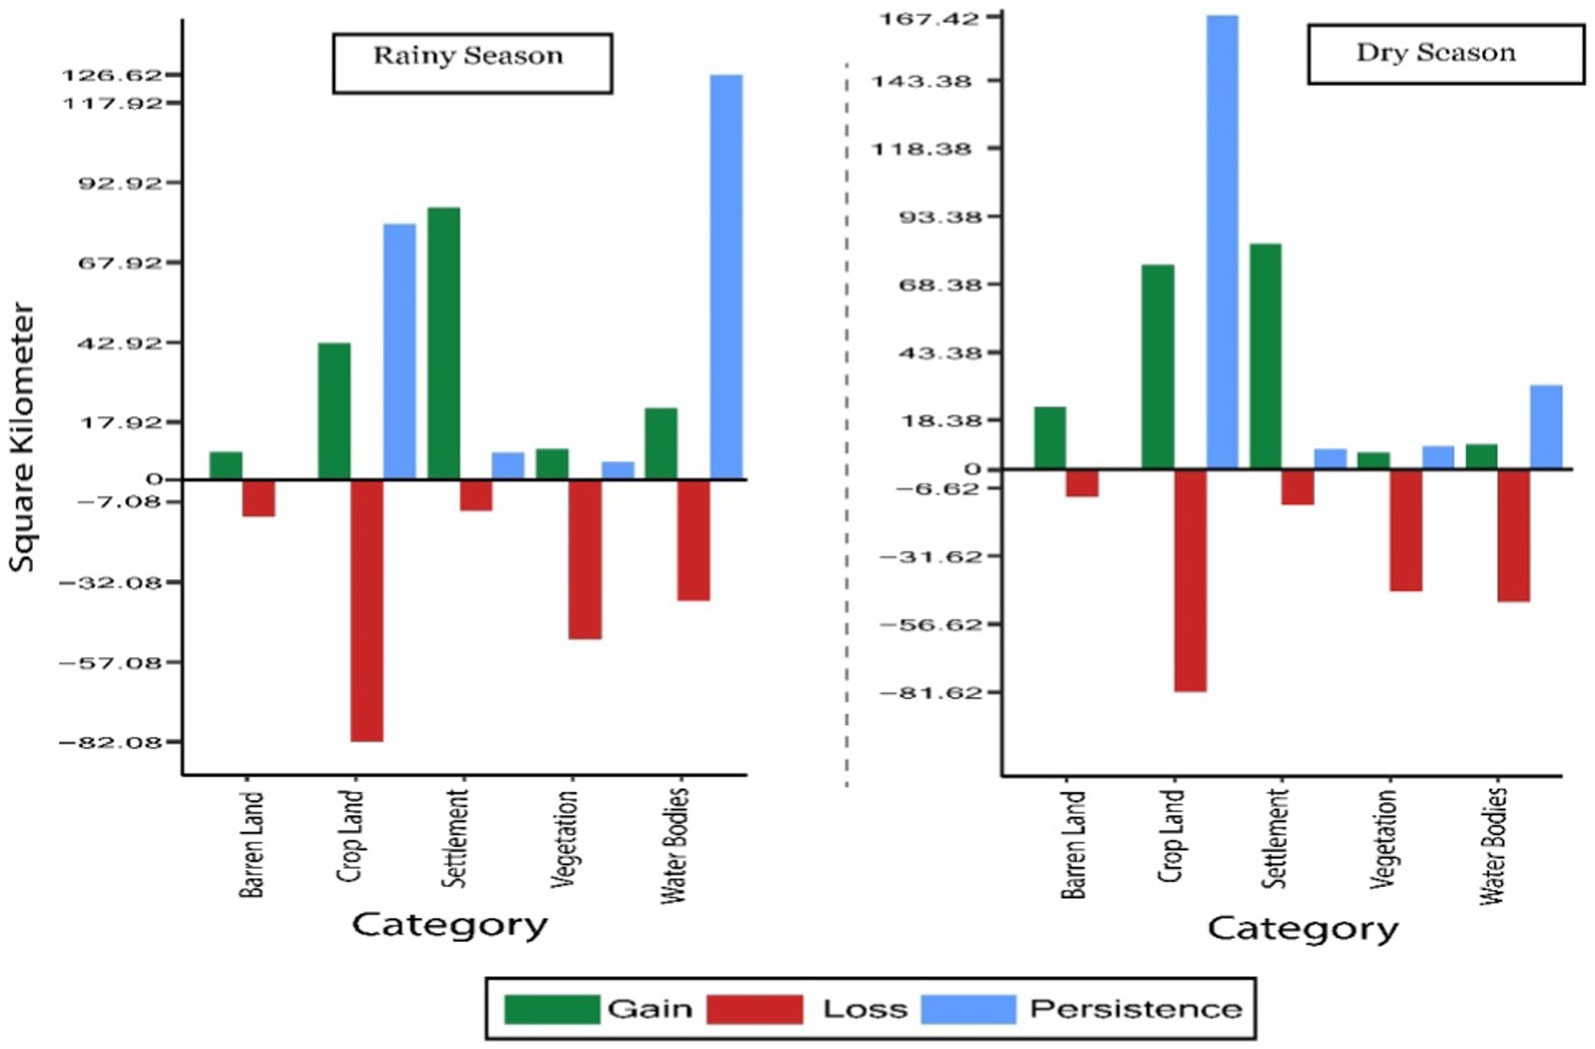
Figure 8. Overall persistence, gain and loss dynamics of land cover classes.
Water bodies in the Rainy season showed a higher persistence (~127 km2) than in the dry season (~31 km2) (Figure 8). Additionally, in the rainy season, water bodies exhibit losses (~38 km2) and gains (~22km2). Meanwhile, the dry season demonstrates substantial losses (~48 km2) and gains (~9 km2). The vegetation area had considerable persistence but underwent more significant losses (~50 km2) during the rainy season than increases (~9 km2). During the dry season, there were continuous changes in vegetation cover, as shown by losses of nearly 45 km2 and gains of approximately 6 km2. Settlement in the region demonstrated notable gains and persistence throughout the Rainy and dry seasons. On the contrary, cropland exhibited a moderate to high degree of persistence. However, it undergoes significant losses, particularly during the dry season. On the contrary, barren land showed negligible persistence, as losses exceeded gains during both seasons.
4 Discussion
The findings of this study illustrate the evolving environmental conditions within this critical freshwater ecosystem through the comprehensive analysis of the land use land cover dynamics occurring in the Hakaluki Haor from 2000 to 2023. A discerning decline in water bodies has been observed in both the rainy and dry seasons, which can negatively affect aquatic ecosystems and the availability of water resources. The decrease in water bodies also poses a threat to fish diversity in Hakaluki Haor, the largest inland freshwater wetland ecosystem (Islam et al., 2011; Aziz et al., 2021) Hakaluki Haor, which provides habitat for a diverse range of fisheries resources, has declined due to the loss of permanent waterbodies and overexploitation. From a documented 107 species in 2001, the fish species reduced to only 64 species in 2018 (Centre for Natural Resource Study, 2003; Imran et al., 2023). Aziz et al. (2021) argue that increasingly erratic rainfall, temperature rises and siltation in the beel (i.e., deeper portion of haor), and fishing practices are also responsible for the decline of fisheries.
Overall, the wetlands of the northeastern part of Bangladesh are experiencing a reduction in their coverage. In the same region, a study by Bhattacharjee et al. (2021) in Lakshmibaur-Nalair Haor revealed that deep water bodies have diminished by ~38% over the last three decades. The researchers found that this significant decrease in deep waterbodies was caused by the construction of dams in the upstream rivers that led to increased siltation and shallow water areas were converted into agricultural activities. Furthermore, also reported that the deep water bodies of the haor area are becoming increasingly scarce in the regionIncreased siltation in deep water parts and the conversion of shallow water parts into settlements and agricultural lands are critical drivers of this decline. The decrease in deep and shallow waterbodies could exacerbate the severity of flash floods in the haor basin of the region (Kamruzzaman and Shaw, 2018).
A substantial reduction in vegetation coverage in the study area has also been observed in the specified time frame, indicating significant changes in ecological conditions. Changes in wetland vegetation can significantly affect ecological processes within the ecosystems (Myneni et al., 1997; Chang et al., 2023). The present study found a significant loss (71%) of overall vegetation cover in the region from 2000 to 2023 (Figure 6). Polash et al. (2023) reported a similar trend of a substantial decline in dense vegetation cover (80%) in the Hakaluki Haor region from 2000 to 2019. Decreasing patterns in vegetation cover were also observed in other haor regions in the greater Sylhet (Haque and Basak, 2017; Bhattacharjee et al., 2021; Haque et al., 2021). Hakaluki Haor, recognized as a RAMSAR site and an Ecologically Critical Area (ECA), harbors migratory waterfowls, resident birds, mammals, amphibians, and reptiles (Choudhury and Nishat, 2005; DBHWD, 2016). The ongoing decrease in vegetation coverage poses a threat to the biodiversity of wildlife in this region (Polash et al., 2023; Waleed et al., 2023). The findings highlight the need for this information to be considered and for authorities to design and implement effective conservation strategies.
The potential causes for the observed fluctuations in cropland coverage within the Hakaluki Haor region may include alterations in land management practices, environmental circumstances, or something related to agricultural methodologies. By performing a more comprehensive examination and interpretation of these patterns, substantial insights can be obtained concerning the complexities of land use dynamics and human-environment interactions within this crucial wetland ecosystem.
Consistent with prior research that has documented the effects of human activities on wetland ecosystems, including settlements (Hu et al., 2017; Berkessa et al., 2023) and agricultural expansion (Convention on Wetlands, 2022), the results presented in this study support this notion. The study revealed a substantial rise in settlement areas in Hakaluki Haor from 2000 to 2023, with a significant expansion observed in both the rainy and dry seasons. According to the Bangladesh Bureau of Statistics (Bangladesh Bureau of Statistics, 2021), the population in the Sylhet region, where Hakaluki Haor is located, has been steadily increasing. This population pressure likely necessitated the conversion of land for residential purposes, leading to the observed rise in settlement areas. Rapid population growth may also accelerate settlements in the region, leading to the conversion of barren land, vegetation, shallow water bodies, into agricultural lands negatively impacting the ecosystem. For instance, earlier, the haor regions in the study area had freshwater swamp forests that are now nearly destroyed due to overexploitation and conversion for agriculture (Bokhtiar et al., 2024).
A recent study on the Tanguar Haor, another RAMSAR site, unveiled a notable decline in fish diversity, with recorded species decreasing from 122 to 58 within 9 years (2012–2021). Anthropogenic factors, such as overfishing, illegal fishing gear, infrastructure development, and swamp forest degradation, were the primary drivers contributing to the decline (Sultana et al., 2022). Moreover, the extent of the substantial increase in settlement area in the Hakaluki Haor region is highly dynamic in nature. In some instances, settlements disappear to appear in other landforms such as barren land, agricultural lands, etc. (Figure 5). Several implications may be drawn from this. These include an increase in the frequency of flooding in such areas, shifts in economic opportunities, or the relocation of people to places close to newly constructed roads for better communications. In addition, in Figure 7, it seems some water parts have changed to settlements. In this case, probable implications could be increasing sedimentation (Polash et al., 2023), building embankments or roads, or filling up shallow water parts by dredging (as seen in ground truthing) to create habitable settlements as the population is increasing. This practice is not uncommon in regions experiencing rapid population growth and urbanization, as seen in other parts of Bangladesh (Rahaman et al., 2023). The lack of effective land use planning and management has been identified as a key issue in other studies of land cover change in Bangladesh. Nevertheless, as witnessed in Hakaluki Haor, these patterns or shifts underscore the necessity for additional multidisciplinary research approaches concerning the precise catalysts and mechanisms that govern these changes. Lastly, several natural and anthropogenic activities, such as land-use changes and agricultural techniques, sedimentation, and erosion, may be responsible for the observed variations in the covering of barren land.
The haor regions have been consistently lagging behind Bangladesh’s steady-paced national development progress (CEGIS, 2012). Bangladesh Haor and Wetland Development Board (BHWDB), established in 2000, is a coordinating and leading institution for sustainable development and enhancing resilience in the regions. According to the BHWDB Master Plan (2012–2032), the haor regions are unique ecosystems and are regulated by a substantial number of policies, including water, fisheries, jolmohal (deep water portions), environment, land use, tourism, agriculture, forestry etc. (CEGIS, 2012). The ecosystem, environment, and biodiversity of Hakaluki Haor are gradually declining due to anthropogenic factors (diverse human activities) and natural factors (siltation, unpredictable rainfall patterns, etc.) (Uddin et al., 2013; Aziz et al., 2021; Polash et al., 2023).
The present study in the LULC change analysis of Hakaluki Haor indicated a substantial decline in water bodies (~51%) and vegetation cover (71%) while a dramatic increase in the settlement areas (~353%) (Figure 6). Our findings about these significant losses of waterbodies, vegetation and increasing settlements are consistent with other LULC change analysis studies for Hakaluki Haor and other adjacent haor regions (Haque and Basak, 2017; Islam et al., 2018; Bhattacharjee et al., 2021; Haque et al., 2017; Polash et al., 2023; Waleed et al., 2023). So, to conserve the ecological integrity in the Hakaluki Haor region, a crucial habitat, more investigation and interpretation of such LULC dynamics and interdisciplinary approaches may provide insights into better management practices. These holistic approaches may illuminate the ecological and biological dynamics with socioeconomic drivers governing wetland ecosystems. Further research may include socio-ecological assessments to explore complex interactions among human activities and environmental processes. From a broader perspective, the present study contributes to monitoring, sustainable conservation, ensuring resilience, and management strategies highlighting the transformations and patterns of the critical freshwater wetland ecosystem, Hakaluki Haor.
5 Conclusion
The study introduces a Machine learning approach utilizing Landsat data in Google Earth Engine and ArcGIS 10.8 to discern Land Use and Land Cover (LULC) changes in Bangladesh’s RAMSAR site freshwater wetland, Hakaluki Haor. The study demonstrated the potential of the CART algorithm in cloud-based GEE platform with efficient computation in analyzing LULC changes in the context of a freshwater wetland in Bangladesh. An analysis spanning 2000 to 2023 via Landsat satellite data revealed consistent alterations in Water Bodies, Vegetation, Barren Land, Settlement, and Crop Land throughout both rainy and dry seasons. The drivers of observed declines in water bodies and vegetation alongside variable Crop Land are considered to arise from climate change (e.g., warming, more erratic rainfall) and human activity such as development and agricultural expansion. Notably, settlement experienced rapid growth during this period. These persistent patterns underscore potential implications for the region’s ecosystem and agriculture. Despite escalating human settlements, substantial declines were noted in water bodies, dense vegetation, barren land, and crop land. Understanding the spatial distribution and LULC change patterns is critical for effective land-use strategies for the Hakaluki Haor.
Data availability statement
The original contributions presented in the study are included in the article/supplementary material, further inquiries can be directed to the corresponding author.
Author contributions
AS: Conceptualization, Formal analysis, Methodology, Project administration, Software, Visualization, Writing – original draft. ER: Formal analysis, Methodology, Software, Validation, Visualization, Writing – review & editing. FS: Formal analysis, Methodology, Writing – review & editing. ND: Formal analysis, Visualization, Writing – original draft. MF: Formal analysis, Writing – review & editing. SR: Methodology, Writing – review & editing. SS: Conceptualization, Formal analysis, Supervision, Visualization, Writing – review & editing.
Funding
The authors declare that there was no external funding for this study.
Acknowledgments
The authors would like to thank the Department of Oceanography, Shahjalal University of Science and Technology, for laboratory and other invaluable support during the study.
Conflict of interest
The authors declare that the research was conducted in the absence of any commercial or financial relationships that could be construed as a potential conflict of interest.
Publisher’s note
All claims expressed in this article are solely those of the authors and do not necessarily represent those of their affiliated organizations, or those of the publisher, the editors and the reviewers. Any product that may be evaluated in this article, or claim that may be made by its manufacturer, is not guaranteed or endorsed by the publisher.
References
Abdulmalik, K., Ingale, L., and Mulatu, K. (2022). Wetland Ecosystem: plant species diversity, services, degradation drivers, and community perception in Sinana district, Oromia region, southeast Ethiopia. Research Square. doi: 10.21203/rs.3.rs-1999074/v1
Akonda, A. W. (1989). “Wetlands of Bangladesh” in A directory of Asian wetlands. ed. D. A. Scott (Switzerland: IUCN), 684.
Amani, M., Salehi, B., Mahdavi, S., Granger, J. E., Brisco, B., and Hanson, A. (2017). Wetland classification using multi-source and multi-temporal optical remote sensing data in Newfoundland and Labrador, Canada. Can. J. Remote. Sens. 43, 360–373. doi: 10.1080/07038992.2017.1346468
Arpitha, M., Ahmed, S. A., and Harishnaika, N. (2023). Land use and land cover classification using machine learning algorithms in google earth engine. Earth Sci. Inf. 16, 3057–3073. doi: 10.1007/s12145-023-01073-w
Aslam, R. W., Shu, H., Tariq, A., Naz, I., Ahmad, M. N., Quddoos, A., et al. (2024). Monitoring landuse change in Uchhali and Khabeki wetland lakes, Pakistan using remote sensing data. Gondwana Res. 129, 252–267. doi: 10.1016/j.gr.2023.12.015
Assefa, W. W., Eneyew, B. G., and Wondie, A. (2021). The impacts of land-use and land-cover change on wetland ecosystem service values in peri-urban and urban area of Bahir Dar City, Upper Blue Nile Basin, Northwestern Ethiopia. Ecol. Process. 10. doi: 10.1186/s13717-021-00310-8
Aziz, M. S., Hasan, N. A., Mondol, M. M. R., Alam, M. M., and Haque, M. M. (2021). Decline in fish species diversity due to climatic and anthropogenic factors in Hakaluki Haor, an ecologically critical wetland in northeast Bangladesh. Heliyon. 7:e05861. doi: 10.1016/j.heliyon.2020.e05861
Bakr, N., and Afifi, A. A. (2019). Quantifying land use/land cover change and its potential impact on rice production in the northern Nile Delta, Egypt. Remote Sensing Appl. 13, 348–360. doi: 10.1016/j.rsase.2018.12.002
Bangladesh Bureau of Statistics (2021). Ministry of Planning, Government of the People’s Republic of Bangladesh, Dhaka, Bangladesh.
Banglapedia, (2021). Hakaluki Haor. In Banglapedia, National Encyclopedia of Bangladesh. Available at: https://en.banglapedia.org/index.php/Hakaluki_Haor
Berkessa, Y. W., Bulto, T. W., Moisa, M. B., Gurmessa, M. M., Werku, B. C., Juta, G. Y., et al. (2023). Impacts of urban land use and land cover change on wetland dynamics in Jimma city, southwestern Ethiopia. J. Water Climate Change 14, 2397–2415. doi: 10.2166/wcc.2023.102
Bhattacharjee, S., Islam, M. T., Kabir, M. E., and Kabir, M. M. (2021). Land-use and land-cover change detection in a north-eastern wetland ecosystem of Bangladesh using remote sensing and GIS techniques. Earth Syst. Environ. 5, 319–340. doi: 10.1007/s41748-021-00228-3
Biswas, J., Jobaer, A., Haque, S. F., Shozib, S. I., and Limon, Z. A. (2023). Heliyon mapping and monitoring land use land cover dynamics employing Google earth engine and machine learning algorithms on. Heliyon 9:e21245. doi: 10.1016/j.heliyon.2023.e21245
Bittencourt, H. R., and Clarke, R. T. (2003). Use of classification and regression trees (CART) to classify remotely-sensed digital images. In Proceeding of 2003 IEEE International Geoscience and Remote Sensing Symposium. Proceedings (IEEE Cat. No.03CH37477)
Blanquero, R., Carrizosa, E., Molero-Río, C., and Romero Morales, D. (2021). Optimal randomized classification trees. Comput. Oper. Res. 132:105281. doi: 10.1016/j.cor.2021.105281
Bokhtiar, S. M., Islam, M. J., Samsuzzaman, S., Jahiruddin, M., Panaullah, G. M., Salam, M. A., et al. (2024). Constraints and opportunities of agricultural development in Haor ecosystem of Bangladesh. Ecologies 5, 256–278. doi: 10.3390/ecologies5020017
CEGIS (2012). Master plan of haor area. Ministry of Water Resources. Dhaka, Bangladesh: Government of the People’s Republic of Bangladesh.
Centre for Natural Resource Study . (2003). Biophysical and socio-economic characterization of Hakaluki Haor: Step towards building community consensus on sustainable wetland resource management. Dhaka, Bangladesh.
Chang, X., Yu, L., Li, G., Li, X., and Bao, L. (2023). Wetland vegetation cover changes and its response to climate changes across Heilongjiang-Amur River basin. Front. Plant Sci. 14, 1–12. doi: 10.3389/fpls.2023.1169898
Chen, L., Gao, X., Liao, Y., Deng, J., and Zhou, B. (2021). Wetland classification method of Dongting Lake district based on CART using GF-2 image. Bull. Surveying Mapping 6, 12–15. doi: 10.13474/j.cnki.11-2246.2021.0168
Choudhury, G. A., and Nishat, A. (2005). Hydro-meteorological characteristics of Hakaluki haor. Available at: https://portals.iucn.org/library/node/8878
Choudhury, M., Sharma, A., Singh, P., and Kumar, D. (2021). Impact of climate change on wetlands, concerning son Beel, the largest wetland of north east, India. Amsterdam, The Netherlands: Elsevier, 393–414.
Climate Change Impacts and Adaptation Assessment in Bangladesh . (1999). Climate research, 12, 109–116. Available at: https://www.int-res.com/abstracts/cr/v12/n2-3/p109-116/
Congalton, R. G. (1991). A review of assessing the accuracy of classifications of remotely sensed data. Remote Sens. Environ. 37, 35–46. doi: 10.1016/0034-4257(91)90048-B
Convention on Wetlands . (2021). Global wetland outlook: Special edition 2021. Gland, Switzerland: Secretariat of the Convention of Wetlands.
Convention on Wetlands . (2022). Wetlands and agriculture: Impacts of farming practices and pathways to sustainability. Available at: http://www.fao.org/docrep/meeting/022/K8024E.pdf
DBHWD . (2016). Classification of wetlands of Bangladesh. Department of Bangladesh Haor & Wetlands Development, Dhaka, Bangladesh.
Gokce, D. (2018). “Introductory chapter: wetland importance and management” in Wetlands Management. ed. D. Gökçe (London, United Kingdom: IntechOpen Limited).
Haque, M. I., Islam, M. T., and Islam, S. B. (2021). Monitoring the complex dynamics of LULC change of Tanguar Haor, a Ramsar site in the northeastern part of Bangladesh. Environmental Analysis & Ecology Studies 8. doi: 10.31031/eaes.2021.08.000694
Haque, M. I., and Basak, R. (2017). Land cover change detection using GIS and remote sensing techniques: a spatio-temporal study on Tanguar Haor, Sunamganj, Bangladesh. Egyptian J. Remote Sens. Space Sci. 20, 251–263. doi: 10.1016/j.ejrs.2016.12.003
Haque, M. M., Bremer, S., Aziz, S. B., and van der Sluijs, J. P. (2017). A critical assessment of knowledge quality for climate adaptation in Sylhet division, Bangladesh. Clim. Risk Manag. 16, 43–58. doi: 10.1016/j.crm.2016.12.002
Hossain, F., Rana, M. M. P., and Moniruzzaman, M. (2021). Modelling agricultural transformation: a remote sensing-based analysis of wetlands changes in Rajshahi, Bangladesh. Environ. Challenges 5:100400. doi: 10.1016/j.envc.2021.100400
Hu, S., Niu, Z., Chen, Y., Li, L., and Zhang, H. (2017). Global wetlands: potential distribution, wetland loss, and status. Sci. Total Environ. 586, 319–327. doi: 10.1016/j.scitotenv.2017.02.001
Iandolo, M. R., Razzano, F., Zarro, C., Yogesh, G. S., and Ullo, S. L. (2024). Multitemporal analysis in Google earth engine for detecting urban changes using optical data and machine learning algorithms, The India Geoscience and Remote Sensing Symposium (InGARSS) 1–4.
Imran, M. F., Habib, A. S., and Hossain, M. N. (2023). Seasonal variation and fish assemblage at Hakaluki Haor, Moulvibazar, Bangladesh. Int. J. Fisheries Aquatic Stud. 11, 17–27. doi: 10.22271/fish.2023.v11.i3a.2803
Islam, M. N., Rakib, M. R., Sufian, M. A., and Raihan Sharif, A. H. M. (2018). “Detection of Climate Change Impacts on the Hakaluki Haor Wetland in Bangladesh by Use of Remote Sensing and GIS”. in Bangladesh I: Climate Change Impacts, Mitigation and Adaptation in Developing Countries. Eds. Islam, M., van Amstel, A. Springer Climate. Springer, Cham, 195–214. doi: 10.1007/978-3-319-26357-1_8
Islam, M., Saha, N., and Rahman, M. (2011). Economic activities decrease biodiversity in Hakaluki haor, the largest inland fresh water ecosystem in Banglades economic activities decrease biodiversity in Hakaluki haor, the largest inland fresh water ecosystem in Bangladesh. 2.
Kamruzzaman, M., and Shaw, R. (2018). Flood and sustainable agriculture in the Haor Basin of Bangladesh: a review paper. Universal J. Agric. Res. 6, 40–49. doi: 10.13189/ujar.2018.060106
Kavhu, B., Mashimbye, Z. E., and Luvuno, L. (2023). Predicting priority management areas for land use/cover change in the transboundary Okavango basin based on machine learning. Heliyon 9:e22762. doi: 10.1016/j.heliyon.2023.e22762
Khan, M. S., Huq, E., Rahman, A. A., Huq, S., Rashid, S. M. A., and Ahmed, H. (1994). Wetlands of Bangladesh. Bangladesh Centre for Advanced Studies in Association with Nature Conservation Movement (NACOM), Dhaka, Bangladesh.
Kumar, A., Thakur, T. K., and Yu, Z. G. (2023). Editorial: wetland ecosystems as important greenhouse hotspots. Front. Environ. Sci. 10, 9–11. doi: 10.3389/fenvs.2022.1127269
Lary, D. J., Alavi, A. H., Gandomi, A. H., and Walker, A. L. (2016). Geoscience Frontiers machine learning in geosciences and remote sensing. Geosci. Front. 7, 3–10. doi: 10.1016/j.gsf.2015.07.003
Loh, W. (2014). Fifty years of classification and regression trees International Statistical Review, vol. International Statistical Review, 82, 329–348.
Loukika, K. N., Keesara, V. R., and Sridhar, V. (2021). Analysis of land use and land cover using machine learning algorithms on Google Earth Engine for Munneru River Basin, India. Sustainability, 13, 13758. doi: 10.3390/su132413758
Majumder, K. M., Mazumder, S. K., Monwar, M. M., and Basak, L. R. (2013). Towards climate change resilient of hail Haor, Sylhet: reviewing the role of co-management approach. IOSR J. Agric. Veter. Sci. 5, 59–66. doi: 10.9790/2380-0525966
Mulligan, J., and Griffin, P. J. (2012). The Ramsar convention: A new window for environmental diplomacy? Available at: https://api.semanticscholar.org/CorpusID:156551664
Myneni, R. B., Keeling, C. D., Tucker, C. J., Asrar, G., and Nemani, R. R. (1997). Increased plant growth in the northern high latitudes from 1981 to 1991. Nature 386, 698–702. doi: 10.1038/386698a0
Nayak, S. (2022). Factoring climate risks in the wetlands governance: a policy look ahead. Amsterdam, The Netherlands: IOS Press.
Nishat, A., Hussain, Z., Roy, M. K., and Karim, A. (1993). Freshwater wetlands in Bangladesh: issues and approaches for management. Available at: https://portals.iucn.org/library/dir/publications-list?field_pub_organization_tid=%22IUCN%2C%20Wetlands%20Programme%22
Pandit, D., Shefat, S. H. T., and Kunda, M. (2023). “Fish diversity decline threatens small-scale fisheries in the Haor Basin of Bangladesh” in Small in scale, big in contributions. (St. John’s, NL,Canada: TBTI Global), 268.
Polash, A. G., Islam, M., Alam, M. M., and Al-Amin, A. Q. (2023). Dynamics of changes in land use and land cover and perceived causes in Hakaluki Haor, Bangladesh. J. Environ. Plan. Manag. 66, 1209–1228. doi: 10.1080/09640568.2021.2017865
Prigent, C., Papa, F., Aires, F., Jimenez, C., Rossow, W. B., and Matthews, E. (2012). Changes in land surface water dynamics since the 1990s and relation to population pressure. Geophys. Res. Lett. 39, 2–6. doi: 10.1029/2012GL051276
Rahaman, M. A., Kalam, A., and Al-Mamun, M. (2023). Unplanned urbanization and health risks of Dhaka City in Bangladesh: uncovering the associations between urban environment and public health. Frontiers in Public Health, 1:1269362 doi: 10.3389/fpubh.2023.1269362
Rwanga, S. S., and Ndambuki, J. M. (2017). Accuracy assessment of land use/land cover classification using remote sensing and GIS. Int. J. Geosci. 8, 611–622. doi: 10.4236/ijg.2017.84033
Sang, X., Guo, Q., Wu, X., Fu, Y., Xie, T., He, C., et al. (2019). Intensity and stationarity analysis of land use change based on CART algorithm. Sci. Rep. 9, 12279–12212. doi: 10.1038/s41598-019-48586-3
Shaharum, N. S. N., Shafri, H. Z. M., Ghani, W. A. W. A. K., Samsatli, S., Al-Habshi, M. M. A., and Yusuf, B. (2020). Oil palm mapping over peninsular Malaysia using Google earth engine and machine learning algorithms. Remote Sensing Applic 17:100287. doi: 10.1016/j.rsase.2020.100287
Sieben, E. J. J., Khubeka, S. P., Sithole, S., Job, N. M., and Kotze, D. C. (2018). The classification of wetlands: integration of top-down and bottom-up approaches and their significance for ecosystem service determination. Wetl. Ecol. Manag. 26, 441–458. doi: 10.1007/s11273-017-9585-4
Stratford, C. J. (2018). Monitoring of wetlands: overview BT - the wetland book: I: structure and function, management, and methods. Dordrech, The Netherlands: Springer Netherlands, 1767–1778.
Sultana, M. A., Pandit, D., Barman, S. K., Tikadar, K. K., Tasnim, N., Fagun, I. A., et al. (2022). A review of fish diversity, decline drivers, and management of the Tanguar Haor ecosystem: a globally recognized Ramsar site in Bangladesh. Heliyon 8:e11875. doi: 10.1016/j.heliyon.2022.e11875
Uddin, M. J., Mohiuddin, A. S. M., Hossain, S. T., and Hakim, A. (2013). Ecoenvironmental changes of wetland resources of Hakaluki Haor in Bangladesh using GIS technology. ournal of Biodiversity & Endangered Species, 1, 103. doi: 10.4172/2332-2543.1000103
Waleed, M., Sajjad, M., Shareef, M., Tariq, M., and Alam, T. (2023). Ecological informatics machine learning-based spatial-temporal assessment and change transition analysis of wetlands: an application of Google earth engine in Sylhet, Bangladesh (1985–2022). Eco. Inform. 75:102075. doi: 10.1016/j.ecoinf.2023.102075
WARPO . (2001). National Water Management Plan: Regional plans. Ministry of Water Resources. Government of the People’s Republic of Bangladesh, Dhaka, Bangladesh.
Xu, X., Chen, M., Yang, G., Jiang, B., and Zhang, J. (2020). Wetland ecosystem services research: a critical review. Global Ecol. Conserv. 22:e01027. doi: 10.1016/j.gecco.2020.e01027
Yao, B., Zhang, H., Liu, Y., Liu, H., and Ling, C. (2019). Remote sensing classification of wetlands based on object-oriented and CART decision tree method. For. Res. 32, 91–98. doi: 10.13275/j.cnki.lykxyj.2019.05.012
Yousuf Haroon, A. K., and Kibria, G. (2017). Wetlands: biodiversity and livelihood values and significance with special context to Bangladesh BT – wetland science: perspectives from South Asia. New Delhi, India: Springer India, 317–346.
Keywords: LULC, Hakaluki Haor, machine learning, Google earth engine, freshwater wetland monitoring
Citation: Siddique AB, Rayhan E, Sobhan F, Das N, Fazal MA, Riya SC and Sarker S (2024) Spatio-temporal analysis of land use and land cover changes in a wetland ecosystem of Bangladesh using a machine-learning approach. Front. Water. 6:1394863. doi: 10.3389/frwa.2024.1394863
Edited by:
Sujan Pal, Argonne National Laboratory (DOE), United StatesReviewed by:
Mbulisi Sibanda, University of the Western Cape, South AfricaAfeefa Rahman, University of Illinois at Urbana-Champaign, United States
Copyright © 2024 Siddique, Rayhan, Sobhan, Das, Fazal, Riya and Sarker. This is an open-access article distributed under the terms of the Creative Commons Attribution License (CC BY). The use, distribution or reproduction in other forums is permitted, provided the original author(s) and the copyright owner(s) are credited and that the original publication in this journal is cited, in accordance with accepted academic practice. No use, distribution or reproduction is permitted which does not comply with these terms.
*Correspondence: Abu Bokkar Siddique, YWJzaWRkaXF1ZS1vY2dAc3VzdC5lZHU=