
94% of researchers rate our articles as excellent or good
Learn more about the work of our research integrity team to safeguard the quality of each article we publish.
Find out more
ORIGINAL RESEARCH article
Front. Water, 30 October 2024
Sec. Water and Hydrocomplexity
Volume 6 - 2024 | https://doi.org/10.3389/frwa.2024.1393884
This article is part of the Research TopicClimate, Water and Land in Africa: Research Trends and ChallengesView all 8 articles
 Laura Nadolski1,2
 Jan Bliefernicht2
 Dragan Petrovic2
 Manuel Rauch2
 Souleymane Sy2
 Samuel Guug3,4
 Rainer Steinbrecher5
 Frank Neidl5
 Luitpold Hingerl2
 Harald Kunstmann2,5*
A good understanding of land-atmosphere exchange processes is essential for developing sustainable land management practices in Africa, in order to enhance food security and strengthen the resilience against climate change and extremes in this vulnerable region. In this study, we explore the energy balance closure (EBC) of three eddy covariance (EC) sites implemented along a land use gradient (pristine savanna forest, cropland, and degraded grassland) in the Sudanian savanna of West Africa. Our results show that the EBC strongly varies over the monsoon season and the EC sites. However, the best EBC is observed at the pristine site, which has the most homogenous vegetation. Thus, landscape heterogeneity seems to play an important role in the quality of the EC measurements. Moreover, we develop a novel post-closure method based on a quantile-mapping technique conditioned on monsoonal circulation patterns specifically determined for the West African Monsoon. This method is also compared to two well-established methods, the Bowen-ratio (BR) correction and a pure quantile-mapping using various bias measures. Our results show that the novel post-closure method outperforms the other methods and, therefore, leads to better elimination of the underestimation of the turbulent fluxes at the three savanna sites. In addition, specific characteristics of turbulent fluxes, like their strong diurnal cycle, are well represented by the new correction method.
The West African Sudanian savanna in Burkina Faso and Ghana is one of Africa’s bread-basket zones, where surplus food is produced and distributed to national and international markets (Berger et al., 2019). It is characterized by strong ongoing changes in land use and land management practices (LULM), associated with a significant agricultural intensification due to rapid population growth (Foley et al., 2011; Berger et al., 2019). These LULM have recognized effects on the surface climate, both in terms of changes in surface energy budget mediated by albedo, roughness, and other land surface properties (Sy et al., 2017; Bonan, 2008) and through variations in surface gas emissions such as CO2, CH4, and N2O (Pitman et al., 2009; Ondiek et al., 2021).
To measure atmosphere-ecosystem interactions and the different components of the surface energy balance like net radiation, sensible and latent heat flux (turbulent fluxes), eddy covariance (EC) stations have been established worldwide over the past decades. However, EC measurements are still very underrepresented in data-scarce regions, such as West Africa, with only a few EC stations operated by initiatives like AMMA or WASCAL as part of mesoscale environmental observatories (Bliefernicht et al., 2018; Galle et al., 2018). The EC stations of the WASCAL observatory are located in the Sudanian savanna in northern Ghana and southern Burkina Faso along a land use gradient (degraded grassland, fallow and croplands and near-natural pristine savanna). Therefore, they provide a unique opportunity to study the impact of LULM on land surface properties in this region. So far, only a few studies have used the EC measurements from the WASCAL sites. For instance, Quansah et al. (2015) compared diurnal and seasonal estimates of CO2-fluxes from the three sites based on the first year of measurement and quantified their magnitude and temporal variability in gross primary production, net ecosystem exchange (NEE) and ecosystem respiration in response to changing vegetation characteristics and distinct soil moisture conditions. In a subsequent study, Berger et al. (2019) analyzed the impact of different rain events and the dry spell length on the NEE of CO2 over a period of 4 years for the three EC sites. In a recent study by Rahimi et al. (2021), the NEE of the EC sites was used for model calibration and validation of the process-based biogeochemical model (LandscapeDNCD).
Despite its fundamental role in directly measuring fluxes of gases, energy, and momentum, the EC technique underestimates turbulent heat fluxes compared to the available energy at almost all research sites—meaning that the energy balance is not closed, thus violating the first law of thermodynamics (e.g., Foken, 2008; Stoy et al., 2013; Mauder et al., 2018; Widmoser and Michel, 2021). The persistent issue of non-closure in the energy balance is regarded as a significant challenge in micrometeorology, crucially hindering progress in environmental and atmospheric sciences (Mauder et al., 2018). Several factors can cause systematic errors in the EBCs, such as: (I) instrumental errors, (II) data processing errors, (III) additional sources of energy which are not accounted for (e.g., heat storage in canopy, the potential energy of water), and (IV) large-scale additional sources of energy not captured by regular EC tower measurements (Panin et al., 1998; Inagaki et al., 2006; Foken, 2008; Stoy et al., 2013; Eder et al., 2014; Soltani et al., 2018; Mauder et al., 2020). In recent years, much progress was made in determining the sources of the EBC gap and improving instrumentation as well as post-processing steps, and the primary cause of the observed lack of closure can nowadays be attributed to mesoscale transport (Mauder et al., 2020). There is no universal approach to post-close the energy balance since it is uncertain how to partition the residuals, as their composition is site-specific (Ingwersen et al., 2015; Imukova et al., 2016). One option is to attribute the missing fluxes completely to the latent heat flux (LE) (Falge et al., 2005; Imukova et al., 2016; Wohlfahrt et al., 2010), another is to attribute them completely to the sensible heat flux (H) (Ingwersen et al., 2011; Imukova et al., 2016). However, the most common post-closing method is to assume that the residual turbulent fluxes have the same Bowen-ratio as the measured fluxes—the Bowen-ratio (BR) method (Blanken et al., 1997; Twine et al., 2000; Mauder et al., 2013; Ingwersen et al., 2015). It has been applied in various studies (e.g., Blyth et al., 2010; Winter and Eltahir, 2010; Ingwersen et al., 2011; Gerken et al., 2012; Mauder et al., 2018), but still has some limitations, which may introduce systematic biases in the turbulent fluxes (Chen and Li, 2012) and only corrects daytime fluxes, as it has weaknesses for negative Bowen-ratio values (Staudt et al., 2010). Some studies suggest splitting the residual determining a correction factor based on the ratio between buoyancy flux and sensible heat flux (Charuchittipan et al., 2014; Gatzsche et al., 2018). A good agreement for the Buoyancy correction is found during conditions with high Bowen ratio values, while for lower Bowen ratio values (<1.5), the BR method performed better (Gatzsche et al., 2018; Mauder et al., 2018).
In this study, we quantify the systematic errors in the measurements of turbulent fluxes at the three WASCAL EC sites in detail. In contrast to other studies available in the literature, we analyze the EBC over a multi-year period (2013–2016), and in different seasons and monsoonal periods based on large-scale atmospheric circulation patterns specifically determined for West Africa (Bliefernicht et al., 2022). Moreover, we develop a novel post-closure approach accounting for large-scale circulation patterns to reduce systematic errors, and its performance is compared with other well-established correction methods like the BR method.
The study sites are located in Central-Southern Burkina Faso and northern Ghana. The area belongs to the northern zone of West Africa’s Sudanian savanna belt (White, 1983). The climate is semi-arid and highly influenced by the West African monsoon (Berger et al., 2019). There is a pronounced dry season between November and March, a rainy season between May and September, and two transitional periods in April and October. The mean annual precipitation ranges between 700 and 1,100 mm (Bliefernicht et al., 2018). The region is marked by steep local gradients in land use intensity (Berger et al., 2019). For analyzing the influence of land use change on water, energy, and CO2 cycles, the three measurement stations were set up in areas with different land use practices that lead to different vegetation covers (Figure 1). In Nazinga there is near-natural pristine savanna due to wildlife conservation, in Kayoro there is a mixture of fallow and cropland, and Sumbrungu is a highly degraded grassland site, occasionally used as pasture for cattle and sheep (Quansah et al., 2015). Other site characteristics like climate, soil, and topography as well as the latitude were chosen to be as similar as possible to assure that long-term differences between the analyzed variables were primarily the result of land use changes. The instrumentation is nearly identical at each site but with individual measurement heights (Table 1), depending on the respective mean vegetation height (Bliefernicht et al., 2018). For a more detailed description of the three sites and the instrumentation of the EC stations, refer to Quansah et al. (2015) and Bliefernicht et al. (2018).
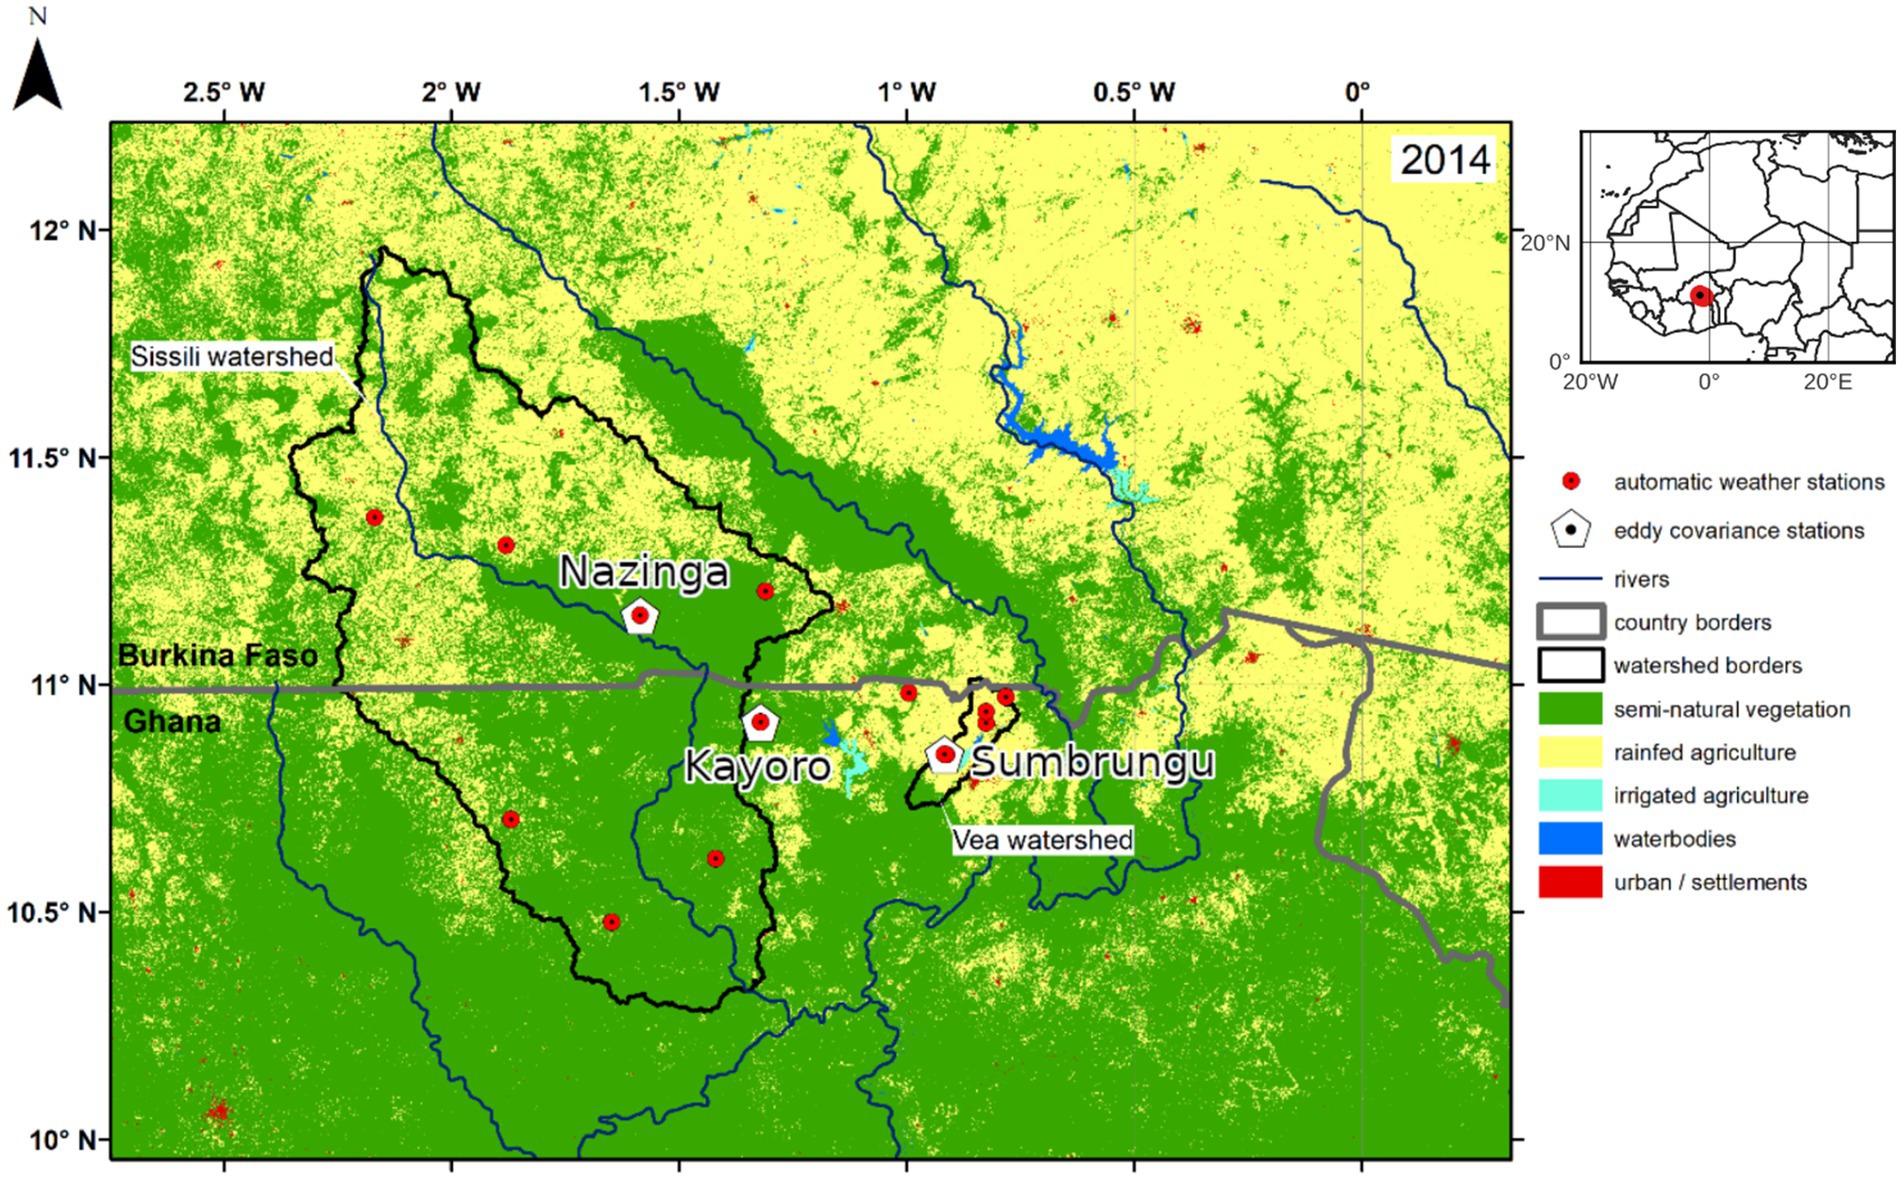
Figure 1. Study site showing the three eddy covariance stations in the Sudanian savanna of Southern Burkina Faso and Northern Ghana. In addition, further information like land use, the implemented automatic weather stations, and relevant watersheds of the WASCAL observatory are shown. A map of West Africa with stations marked as red points is shown on the right side for orientation.
For the study we used EC data from 10/18/2012 to 09/26/2016 (Table 1) with the variables needed for the energy budget as well as turbulence data. The fluxes were integrated over half-hour periods from the covariance of vertical wind velocity and gas concentrations measured at 20 Hz frequency using 3-dimensional sonic anemometers (Gill WindMaster; Gill Instruments Ltd., Lymington, Hampshire, England) and open-path infrared gas analyzers (LI-7500A; LI-COR, Lincoln, NE, USA). All sites are equipped with the same instrumentation. The raw turbulence data and the three-dimensional wind speeds were processed with the “Turbulence Knight” (TK3.1) software. The software performs several kinds of post field processing and produces turbulence fluxes automatically (Quansah et al., 2015; Soltani et al., 2018). It uses standardized quality assessment routines and user-specified consistency limits to detect and reject physically or electronically impossible values of the measurement data including CO2, sensible and latent heat fluxes (Quansah et al., 2015; Mauder and Foken, 2015). For more information about the calculation of the turbulent fluxes and quality control used by the TK3.1 software refer to Mauder et al. (2013) and Mauder and Foken (2015). It is important to note that this analysis is based exclusively on raw observational data, with no gap-filling algorithms applied.
Moreover, we performed a quality control of the aggregated 30-min measurements for each energy balance variable and conducted several subsequent calculations to determine the required variables for the EBC. At each EC station, the ground heat flux (G) was measured with three heat flux plates at the same depth, and we performed a cross-comparison of those time series by using correlation measures to eliminate unreliable time series. In Nazinga we only used the measurement information from two sensors for the calculation of the mean ground heat fluxes, as the central device showed much lower correlation with the other two devices here, possibly indicating a defect in the sensor. Because the exchanges of longwave radiation LWx [W/m2] between the instrument and the ground or atmosphere were recorded instead of the longwave radiation, which is needed, we applied the sensor body temperature T [K] to obtain this variable:
We applied a fuzzy rule-based classification of atmospheric circulation patterns (CPs) introduced by Bliefernicht et al. (2022) to acquire a better understanding of how the distinct phases of the West African monsoon (WAM) impact the EBC and to use this additional information for the development of the post-closure approaches. In general, this classification was developed to relate large-scale monsoon features such as the West African heat low (WAHL) (Lavaysse et al., 2009) to daily rainfall variability in Central Burkina Faso (Bliefernicht et al., 2022). Depending on the spatial patterns of mean sea level pressure anomalies (Figure 2) and the movement of the WAHL, the different WAM seasons can be divided into three main periods: CP1, CP6, CP7 are predominant during the dry period, CP2, CP3, CP8 during the transitional periods and CP4, CP5 dominate during the wet period. In this study, we transfer the classification method to the period of 2012–2016 using ERA5-reanalysis data (Hersbach et al., 2020) to derive a time series of daily CPs. Table 2 shows the wetness index (WI) of each CP and some further statistics. For a more detailed description of the methods and CPs, see Bliefernicht et al. (2022).
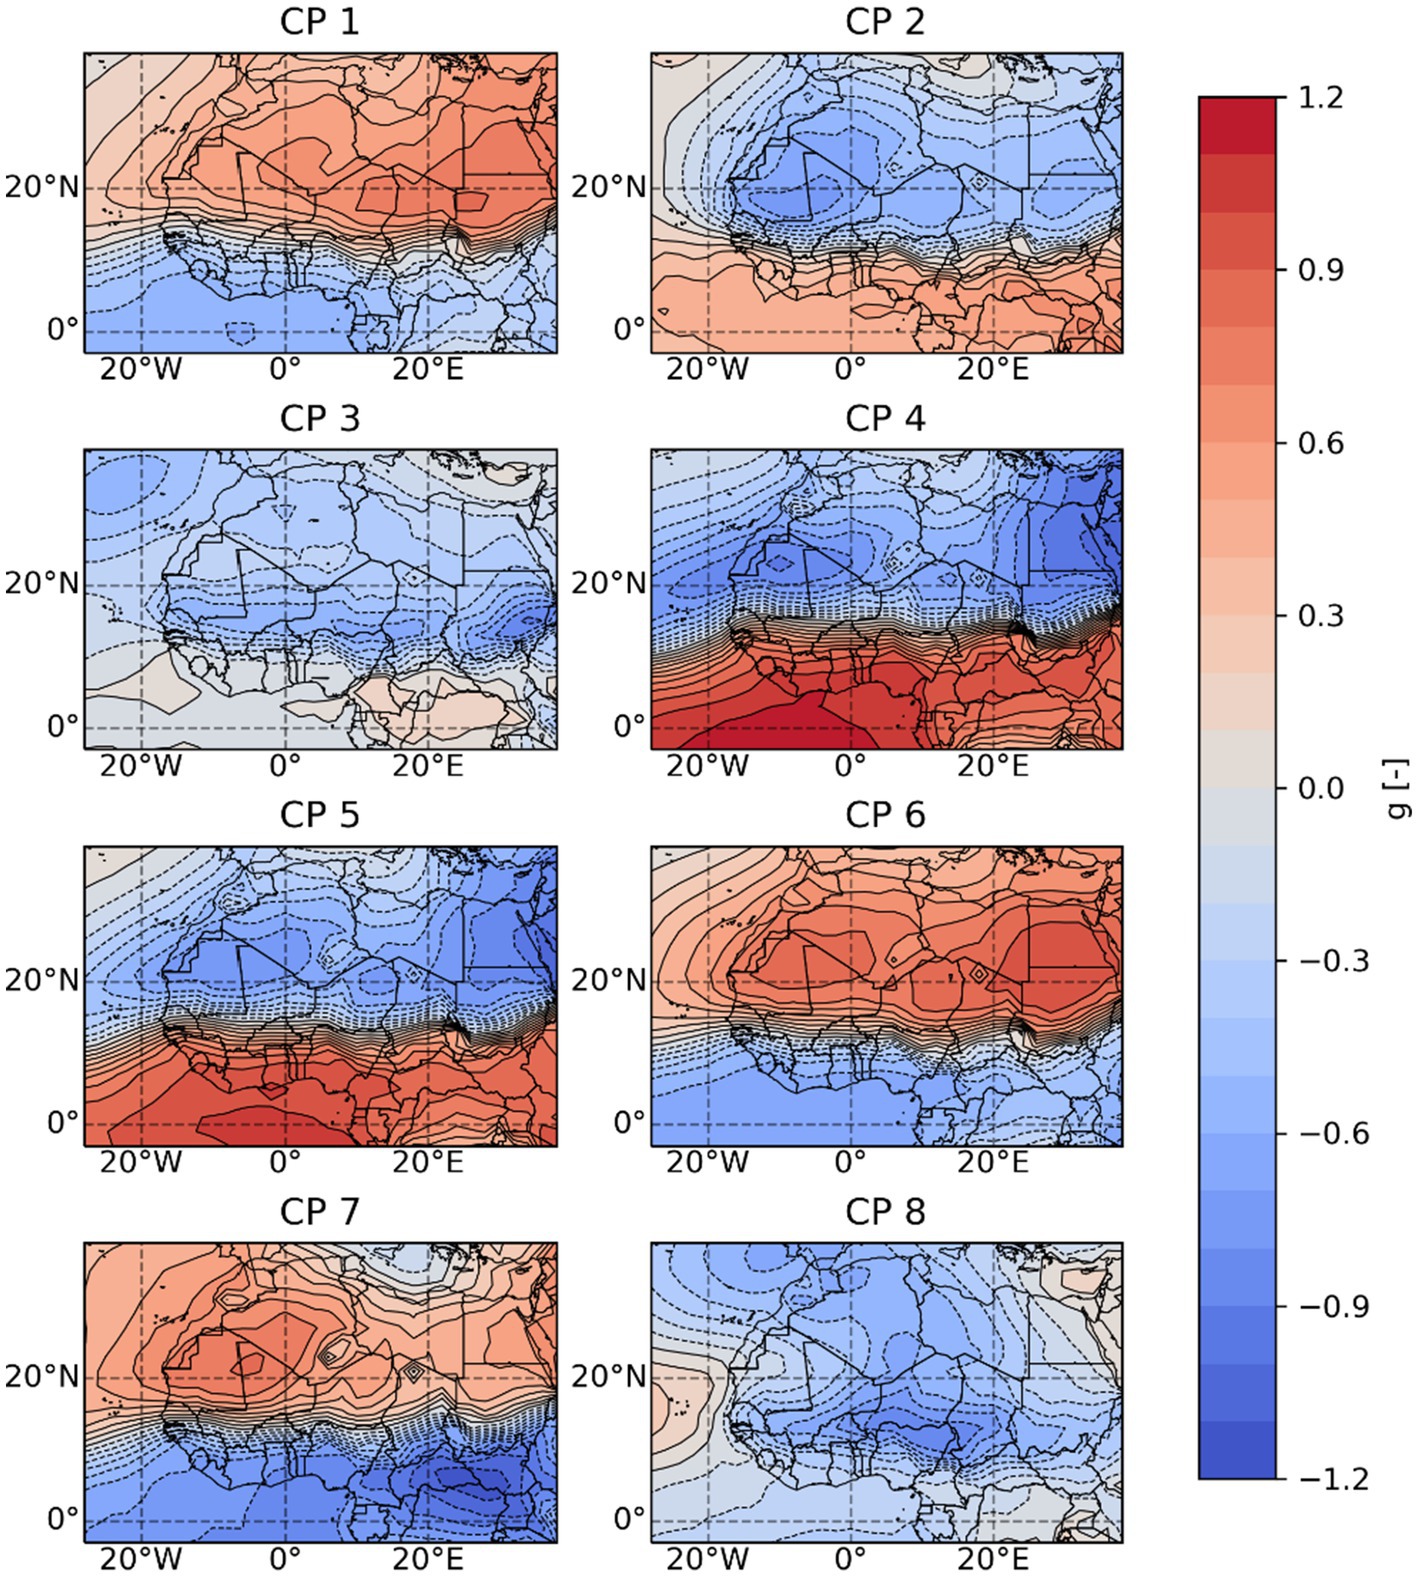
Figure 2. Atmospheric circulation patterns based on mean sea level pressure anomalies determined for the investigation period (2012–2016) of this study using a classification proposed by Bliefernicht et al. (2022).
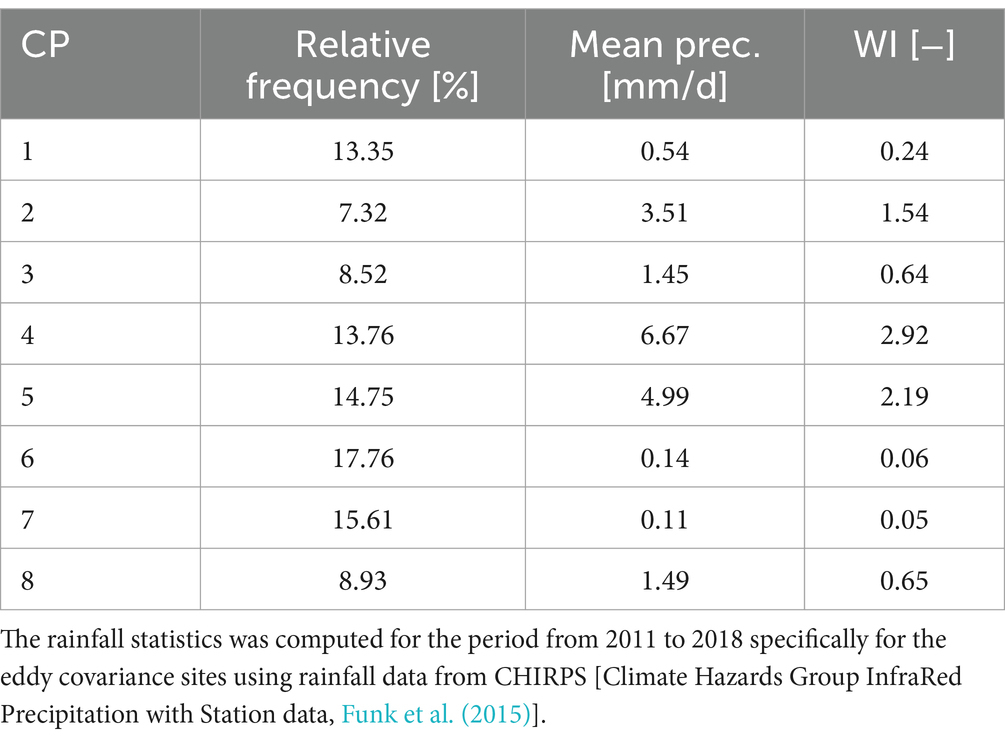
Table 2. Relative frequency, mean precipitation and wetness Index (WI) for the atmospheric circulation patterns using the classification approach by Bliefernicht et al. (2022).
In this study, three different closure approaches to minimize the bias of the EC measurements are applied: the standard Bowen-ratio (BR) method after Mauder et al. (2013), a novel correction method that is based on quantile mapping of the empirical distributions from the EBC variables, hereafter referred to as QM method, and an extension of the QM method conditioned on regional CPs, hereafter referred to as QM-CP method.
The BR describes the ratio of the sensible heat flux H to the latent heat flux LE (Bowen, 1926; Imukova et al., 2016):
The BR method assumes that both latent and sensible heat flux are “equally” underestimated and the Bowen ratio is maintained (Twine et al., 2000; Mauder et al., 2018). The method is used in various studies for post-closing the energy balance (e.g., Ingwersen et al., 2011; Mauder et al., 2013; Imukova et al., 2016; Mauder et al., 2018). Here, we applied it according to Mauder et al. (2013). We present an adapted mathematical description to provide better comparability between the different methods used. According to Mauder et al. (2010) and Mauder et al. (2013), the thermally driven large-scale and non-propagating eddies only develop in a convective boundary layer. Thus, the systematic error is determined for daytime conditions, defined as situation with a global radiation (Rg) > 20 Wm−2 (Mauder et al., 2013). As a first step, we calculated the correction factor c for a given measurement day as follows:
with K as the number of observations per day with global radiation Rg > 20 Wm−2. Then, we calculated the corrected sum of the turbulent fluxes TF* for every 30-min daytime value of the respective day by using the correction factor:
with TFi as the original measured sum of the turbulent fluxes for every time step. To partition the corrected sum of the turbulent fluxes into sensible and latent heat flux we calculated the evaporative faction EFj for each day j:
EFj on day-time conditions usually ranges between 0 and 1 and we therefore used it as weighting factor to determine the corrected latent heat fluxes
and the corrected sensible heat fluxes
This procedure is applied to all time steps of the investigation period.
The base of the Quantile Mapping (QM) method are the empirical cumulative distribution functions (CDF) of the turbulent fluxes (TF) and the available energy (AE). This method corrects turbulent fluxes by aligning the corresponding quantiles of both empirical CDFs. QM is a very common method and has been frequently applied in climate and hydrological sciences to remove biases from measurements (Ringard et al., 2017; Katiraie-Boroujerdy et al., 2020) and model simulations (Siegmund et al., 2015; Ayugi et al., 2020; Enayati et al., 2021). The bias of the EC measurements is a function of the empirical distribution function, which allows to correct the bias of the flux measurements over their entire range, and therefore for higher but also for lower turbulent fluxes like those at nighttime. For the QM method the following steps were performed, exemplarily also shown in Figure 3 for a single measurement value:
1. We used the original measurement values for the 30-min time steps for the available energy AEi = (Rni − Gi) and the sum of the turbulent fluxes TFi = (Hi + LEi) as initial point.
2. Then we determined the empirical distribution function for TF and AE.
3. We calculated the quantile ɑi of TFi using the corresponding empirical distribution.
4. To determine the corrected sum of TFi*, we used the inverse ɑi of the empirical distribution of AE.
5. We repeated step 3 to 4 for every time step.
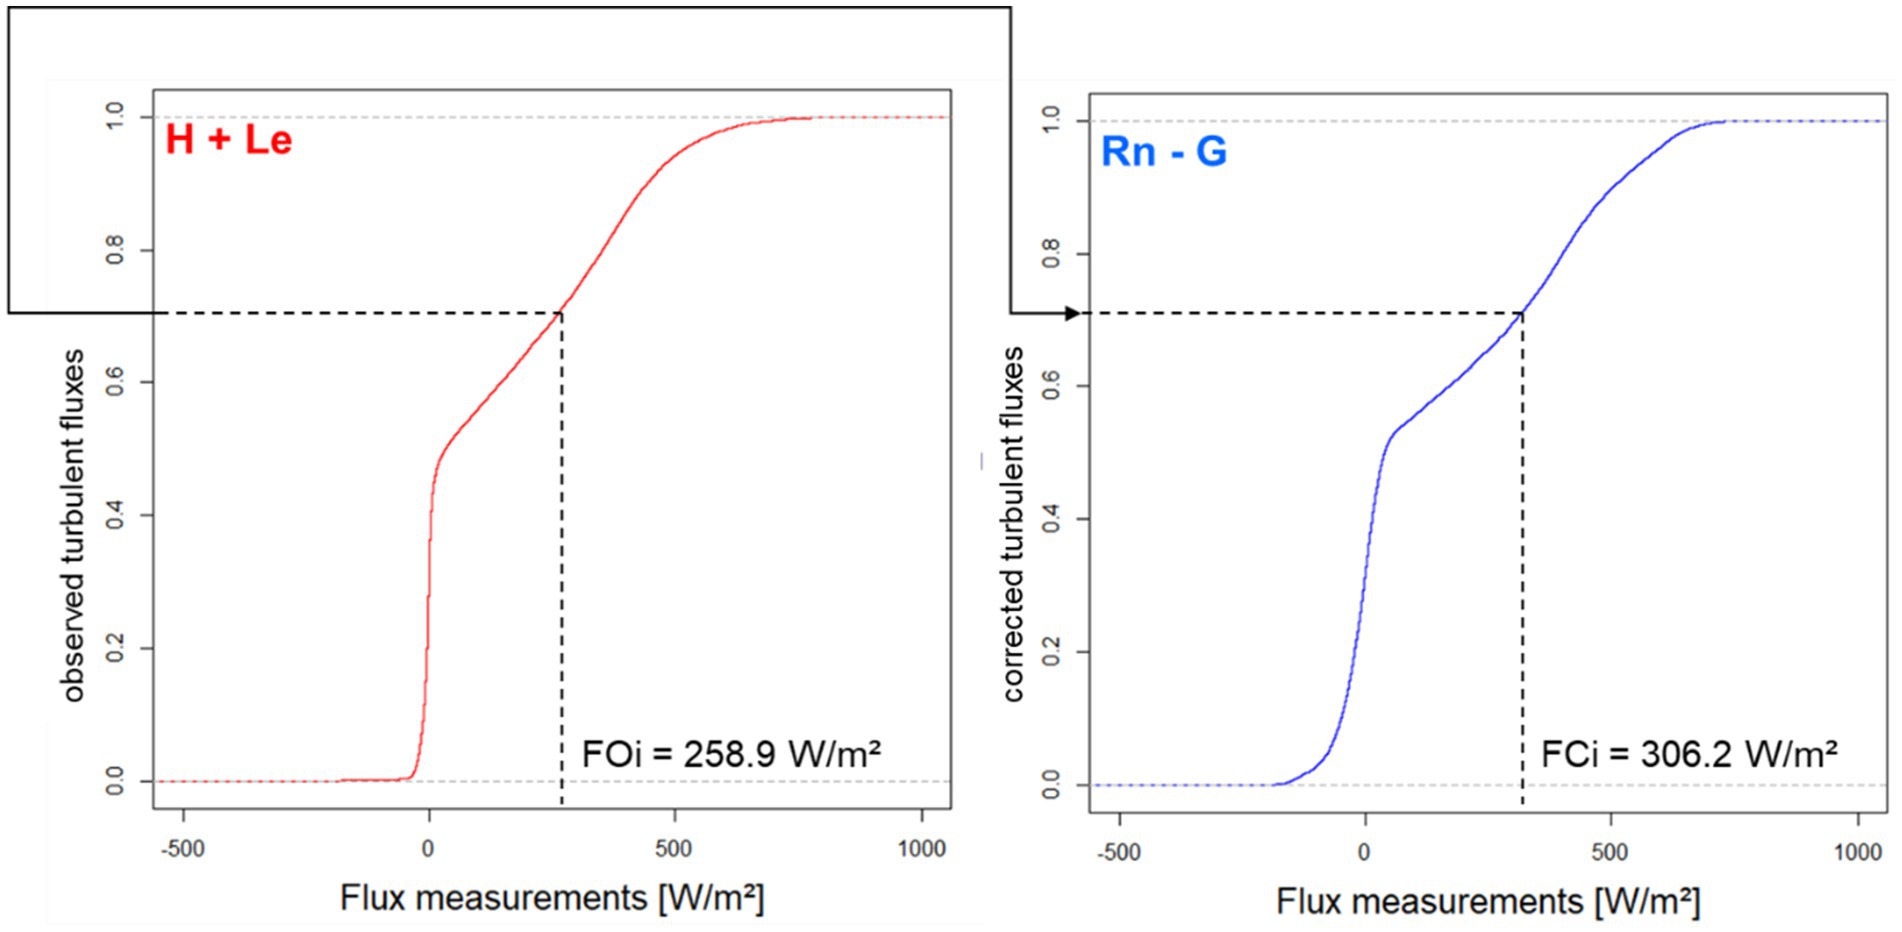
Figure 3. Schematic representation of the quantile-mapping method to correct the sum of observed turbulent fluxes FOi. The method uses the empirical distributions function of the turbulent fluxes (H + LE) and the available energy (Rn-G). The correction is shown for a single measurement using data from Nazinga.
As in the BR method, we used the evaporative fraction EF for the partitioning of the corrected turbulent fluxes and in this case also for nighttime values. To avoid negative values of the EF and to keep the correct ratio between and , we used the absolute values of the fluxes for the EF calculation.
1. EFi we calculated as follows:
1. Then we determined the difference Di (residual component) between the measured turbulent fluxes and the corrected turbulent fluxes for every time step:
1. We calculated the corrected latent and sensible heat flux using EFi as weight for distributing Di to the respective flux:
The EBC varies not only between different sites, but also for different turbulence intensities and wind directions (Mauder et al., 2020). In the study region, these factors strongly depend on monsoon dynamics (Nicholson, 2013). To take their effects into account, we developed the QM-CP method. It also employs the empirical CDFs for determining the measurement bias. But instead of using a single functional relationship for the correction of the flux measurements, we determined the empirical CDFs for each CP. For this, we classified the EC measurements in eight subsets, according to the CP that was assigned for each day. Then, we applied the same steps described above for the QM method to every subset.
The performance of EC measurements is usually assessed through a scatter plot between the available energy and turbulent fluxes (Mauder et al., 2010; Soltani et al., 2018; Eshonkulov et al., 2019; Grachev et al., 2020). In contrast to other post-processing studies (e.g., Eder et al., 2014; Imukova et al., 2016; Xin et al., 2018), we performed here a more detailed analysis to determine if the correction method could eliminate the bias of the EC measurements. Therefore, we implemented some additional bias measures to assess the quality of the approach quantitatively.
The half-hourly averaged data sets of Rn, G, LE and H for Nazinga, Kayoro and Sumbrungu were used to evaluate the performance of the EC measurements for the study period. We calculated the sums of Rn − G and H + LE for all joint measurement pairs over the whole time period and visualized them in a scatter plot. We performed a linear regression between the half-hourly averaged turbulent fluxes (H + LE) and the available energy (Rn − G):
where m is the slope and b the intercept. Under best conditions, m should be close to 1 and b close to zero, indicating a nearly perfect closure of the energy balance. However, the available energy is usually found to be 10–30% larger than the turbulent fluxes (Foken, 2008; Stoy et al., 2013; Mauder et al., 2020; Finnigan et al., 2003). We calculated several performance measures to evaluate the quality of the EBC for the whole investigation period, four different seasons (DJF, MAM, JJA, and SON) and eight different CPs at each site. First, we calculated the mean values of the sum of TF () and the sum of AE ()
to determine the first-degree bias (B1):
A negative bias indicates an average underestimation of the turbulent fluxes. Moreover, we calculated the standard deviation of the sum of TF () and of AE ():
to determine the second-degree bias (B2):
A negative value indicates an underestimation of the variability of the sum of TF. Additionally, a relative bias measures, RB1, was calculated, as ratio from the B1-value to the mean sum of the available energy.
Additionally, we implemented a conditional bias measure to evaluate the overall performance of each correction method. Therefore, for each site we calculated the occurrence frequency of each CP (fk) over the study period. Then, the absolute value of the bias of each CP was weighted according to its fk. These conditioned bias values for each CP we summed up, providing a conditional bias measure (CB) for each site and each correction method. We performed this for B1 as well as for B2 (CB1 and CB2, respectively):
with K as the number of CPs and f as the relative frequency of the CP within each measurement site.
Maintaining a flux site in quite remote regions can be challenging and different problems occurred during the measurement period at the three sites. Especially the natural site Nazinga is not reachable during the wet season. Thus, sensor defects that require maintenance can cause big data gaps. Further, the theft of solar panels, entire devices, and attacks on guards were also challenges that occurred (Bliefernicht et al., 2018). We only considered the datapoints when all four energy balance variables were available. Therefore, the data availability for calculating EBC is even lower. Nonetheless, the data from the three investigated sites allows insights into the hydrometeorological characteristics of the region (Figure 4). Similar patterns of net radiation can be seen at all three sites, whereby a seasonal cycle with higher net radiation can be observed during the northern hemisphere summer. The ground heat flux shows a similar seasonal pattern. However, it peaks during the dry season (northern hemisphere winter) where more sun can reach the ground due to a less cloudy sky. Consequently, the available energy Rn − G is slightly higher during the wet season in summer than during the dry season in winter. The latent heat flux also shows a clear seasonality with higher values during the wet season, where the soil water availability is higher, and more energy can be transported through evapotranspiration. In the drier winter months, the latent heat flux becomes very small, and more energy is transported through sensible heat. This pattern can be seen across all land use sites. However, at the natural site in Nazinga (Figure 4a) we also see high seasonal differences in the sensible heat flux with lower values in the wet season and higher values in the dry season. At the other two sites with less vegetation height and cover, Kayoro and Sumbrungu (Figures 4b,c, respectively), we observe less pronounced seasonal variations in the sensible heat flux. The latent heat flux further has lower values at these two sites. While Nazinga is characterized by tall grasses of up to 2.5 m, dominated by perennial C4 grasses and a dense savanna woodland (Berger et al., 2019), at Kayoro the grass layer is much lower (around 1 m). The tree layer is more sparse and influenced by grazing animals. In Sumbrungu the herbaceous layer is only about 10 cm high (Berger et al., 2019). Thus, the vegetation in Nazinga offers more plant mass and surface for transpiration of water, facilitating a higher latent heat flux. This shows how the relative composition of tree and grass canopy that have different capacities for photon interception and absorption as well as transpiration (Kelliher et al., 1993; Miranda et al., 1997) strongly influences the surface energy balance of a landscape. These eco-physiological processes are especially intricate in savanna ecosystems, as the two layers (tree and grass) introduce multiple levels of complexity, differing in their phenological cycle (Whitecross et al., 2017), rooting depths (Bachofen et al., 2024) and water use strategies (Miller et al., 2010).
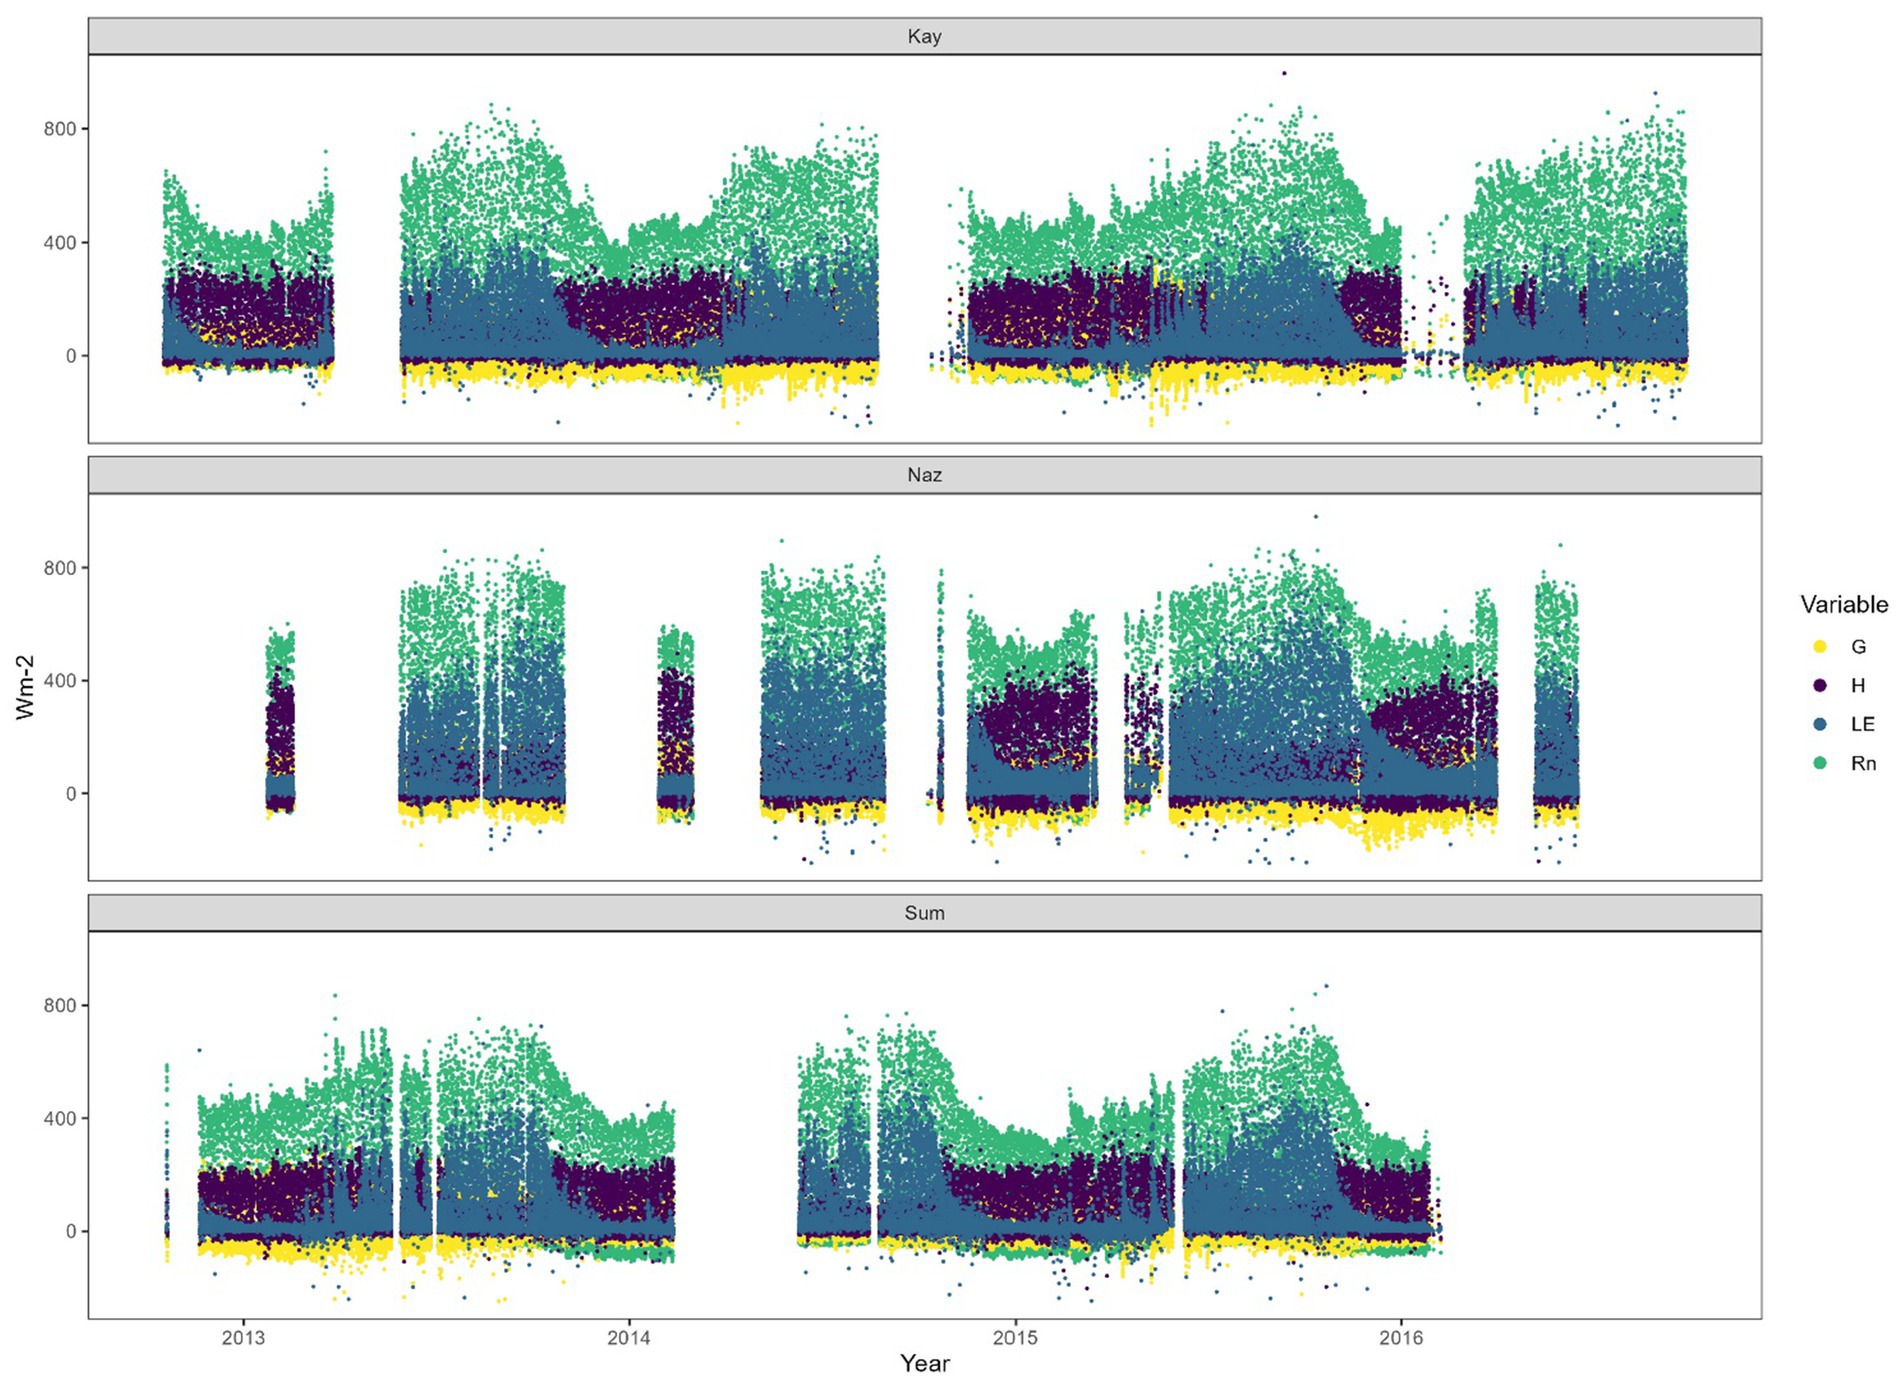
Figure 4. Time series of the energy balance components from the eddy covariance (EC) stations at three different sites from 2013 to 2016. The plots show net radiation (Rn, green), latent heat flux (LE, blue), sensible heat flux (H, purple), and ground heat flux (G, yellow) at Kayoro (Kay), Nazinga (Naz), and Sumbrungu (Sum).
The EBC analysis carried out over the measurement period for the sites Nazinga, Kayoro, and Sumbrungu revealed EBC gaps ranging from 10 to 30%. Nazinga had the highest coefficient of determination at 0.88, indicating a more consistent EBC, while Sumbrungu had the lowest at 0.85. With intercept values of 18.3 for Nazinga, 8.3 for Kayoro, and 24.6 for Sumbrungu, and corresponding slope values of 0.81, 0.68, and 0.66, the data suggest the best energy balance performance at Nazinga (Figure 5). This indicates that the EBC is the best in the natural site of Nazinga, worse in Sumbrungu and worst in Kayoro. This might be due to the higher heterogeneity of the landscape around Kayoro and Sumbrungu compared to that at the Nazinga site. Here, the surrounding vegetation canopy is much more homogenous compared to the other sites, which may cause turbulent structures that are better recorded by the EC method. A study by Stoy et al. (2013) across Fluxnet sites in 173 ecosystems shows, that landscape-level heterogeneity is negatively related to EBC. Also, Foken (2008) state that surface heterogeneity enhances buoyancy-driven turbulences. It further causes large-scale eddies that cannot be captured by a single EC tower with an half-hourly averaging period due to their size and slow motion and therefore leads to a bigger EBC gap (Kanda et al., 2004; Foken et al., 2011; Eder et al., 2014; de Roo and Mauder, 2018). Quansah et al. (2015) obtained very similar EBC results for the first year of the EC measurements. Their regression fits resulted in a coefficient of determination of 0.92 in Nazinga, 0.90 for Kayoro and of 0.89 for Sumbrungu. The slopes and intercepts were 0.89 and 9.85, 0.67 and 11.34, and 0.67 and 32.60 for the three sites, respectively, (Quansah et al., 2015). Thus, they were slightly higher than those in the analysis conducted here, which indicates that the EBC for the first year of measurements was better than for the time periods analyzed in this study. This suggests that throughout 2013 the meteorological conditions for EC measurements (stationary and turbulent transport) were slightly better than in the other years (2014–2016). Seasonal and CP-dependent energy balance closure.
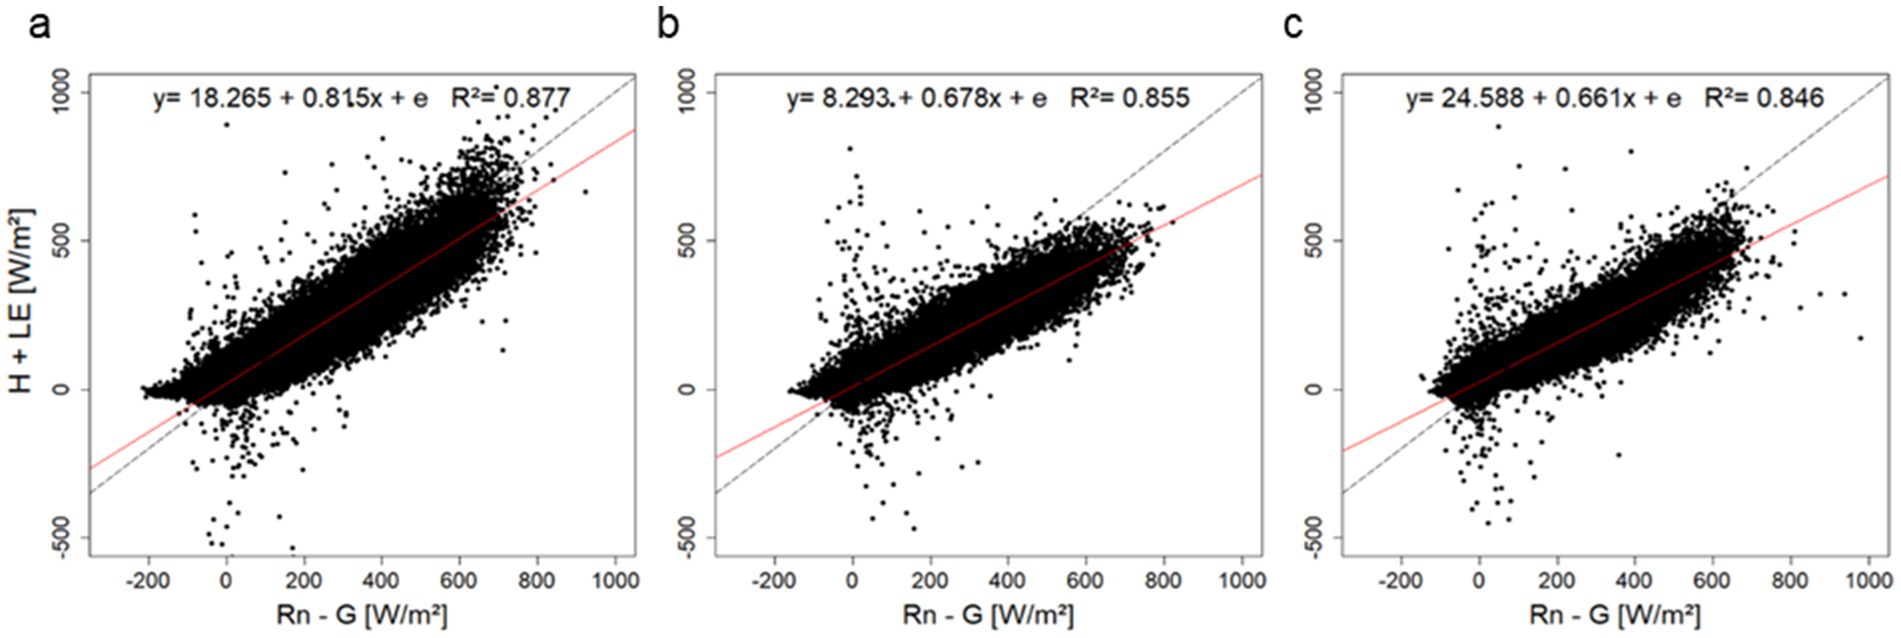
Figure 5. Energy balance closure for Nazinga (a), Kayoro (b), and Sumbrungu (c) for the total investigation period (2012–2016). Rn represents the net radiation, G the ground heat flux, H the sensible heat flux and LE the latent heat flux. R2 is the coefficient of determination, indicating how well the regression line represents the values.
We examine the EBC additionally for four monsoon seasons and for the different CPs by computing different performance measures for these sub-classes (Supplementary 1, 2). Figure 6 shows the regression fits of the EBC exemplarily for CP4 (typical for the monsoon phase) and CP6 (typical for the dry phase). The quality of the flux measurements is relatively high for the different seasons and CPs with coefficient of determination values ranging between 0.84 and 0.88. The scatter plots also indicate that there are differences in EBC for the wet and dry CPs. This effect becomes much clearer when calculating relative values of the two bias measures and relating them to the wetness index of the CPs (Figure 7). There is a tendency that the EBC (in terms of the mean and variance) is better for the rainy (high WI) than for the dry season (low WI). However, in the case of Nazinga, a slight overestimation of the fluxes occurs during the dry season. Quansah et al. (2015) suggest that the EBC can be affected by changes in the meteorological conditions prevalent during the dry and rainy season. Dust accumulation on the sensors, which affects the measurements, is a possible reason for the positive bias (B1) in the dry season in Nazinga, as itis located in a natural reserve and not maintained as regularly as the other two sites. Bagayoko et al. (2006) also found that the sensitivity of the measurement system to dust and raindrops has a significant effect on the reliability of EC measurements in this region. The overestimation could also be attributed to an overestimation of LE during dry conditions (Liu et al., 2024). Our results stand in contrast to recent findings of Liu et al. (2024), who found that the EBC gap improves over dry soil compared to wet soils due to an overestimated latent heat flux. However, this might be explained by the open-path gas analyzer, as the underestimation of LE under atmospheric conditions with high relative humidity is smaller when using this instrument than when using closed path systems (Zhang et al., 2023).
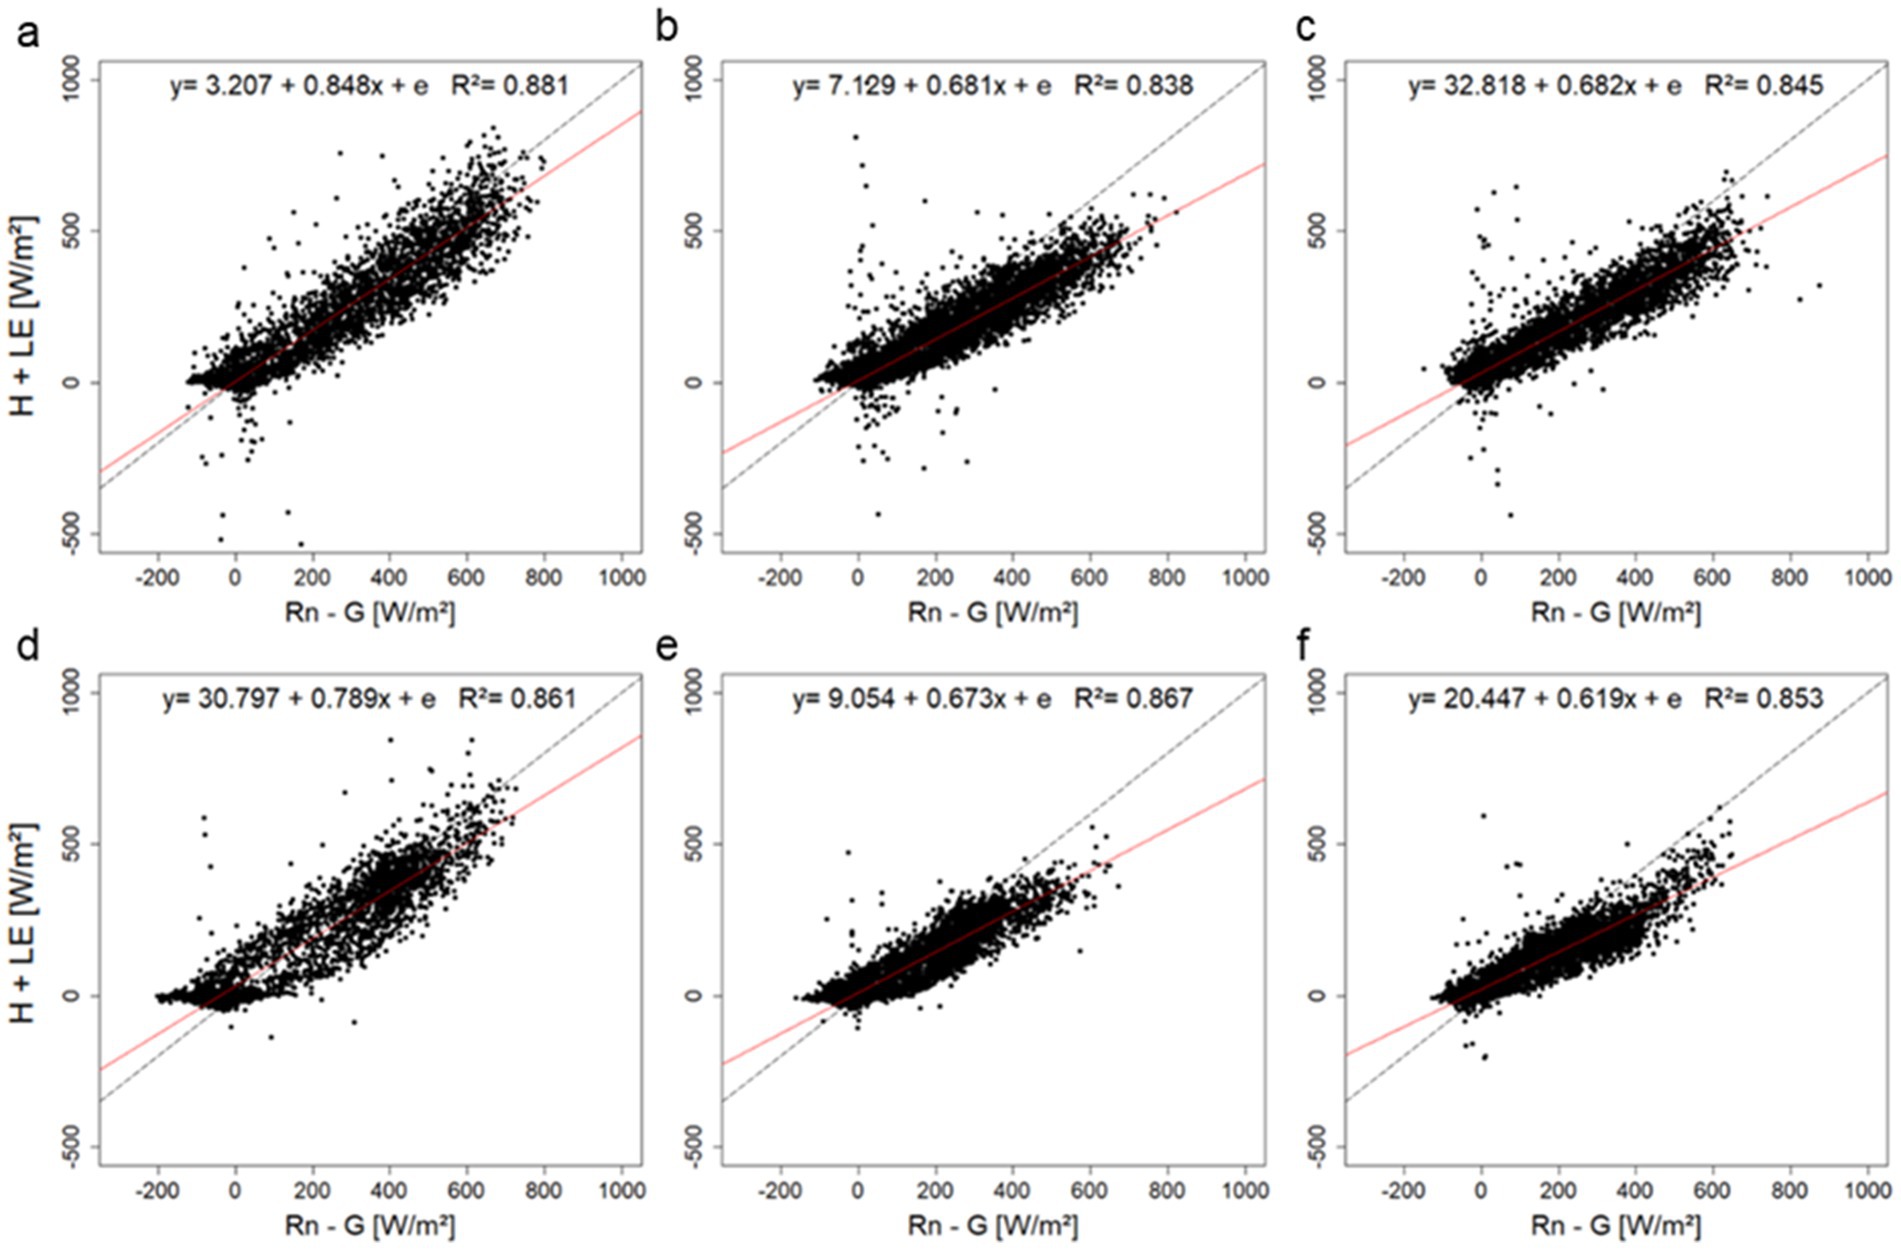
Figure 6. Energy balance closure regression fits for Nazinga (a,d), Kayoro (b,e), and Sumbrungu (c,f), exemplary for two circulation patterns: CP4 (a–c) which is characteristic for the wet season, and CP6 (d–f) which is characteristic for the dry season. Rn represents the net radiation, G the ground heat flux, H the sensible heat flux and LE the latent heat flux. R2 is the coefficient of determination, indicating how well the regression line represents the values.

Figure 7. Relative bias measure for the mean (a) and the variance (b) of the turbulent fluxes for different wetness conditions in the study region. The statistics were calculated for each circulation pattern for the entire investigation period (2012–2016).
Moreover, it stakes out that the differences between the biases of the EBCs were greater among the three stations than among the CPs at each station. This leads to the assumption that site factors, and in this case also the land use in which the three sites differ, have a greater impact on the EBC than the atmospheric conditions. Zhou et al. (2019) found that the EBC gap increases with surface heterogeneity, as long as the heterogeneity scale is smaller than the boundary layer height. As the landscape in the studied areas becomes heterogeneous at quite small scales (Bliefernicht et al., 2018), this strengthens our argument. Further, not only the mean but also the variance of the turbulent fluxes is too low. This underestimation is even more pronounced in terms of relative values for each site as illustrated in Figure 6.
All post-closure approaches reduce the underestimation of the turbulent fluxes leading to a regression slope closer to 1 (Figure 8). The slope of the regression line improved significantly, with an enhancement by approximately 33–40%, particularly at sites where the underestimation was most pronounced. However, the scatterplots alone do not reveal clear distinctions between the performances of the three post-closure approaches. For a closer look at the quality of the correction methods for the different monsoon phases, we determine B1 and B2 for each CP (Figure 9). All post-closure approaches can reduce the strong biases for the different WAM phases (Table 3). However, in many cases the BR correction does not lead to a full reduction of the biases. In several cases, new overestimates are introduced, especially for the B1-values at Sumbrungu (Figure 9e), but also for several CPs at the other sites, which were even higher than the original bias (e.g., CP1, CP6 and CP7 for the mean of Nazinga, Figure 9a). We find a similar pattern looking at the relative bias measure RB1 (Supplementary 3). This indicates a clear limitation of this methodology. A potential reason might be the overestimation of evapotranspiration, as pointed out by Mauder et al. (2018) in a study of two grassland sites. As Finnigan et al. (2003) and Mauder and Foken (2006) have shown that the energy balance closure can be improved with a higher averaging time. Furthermore, Wohlfahrt et al. (2009) suggest adjusting the energy balance closure (EBC) using a longer-term (i.e., monthly) correction factor. However, our analysis (not shown) shows that applying the Bowen ratio method with a monthly correction factor does not improve the results compared to using daily hourly corrections across the different EC sites.
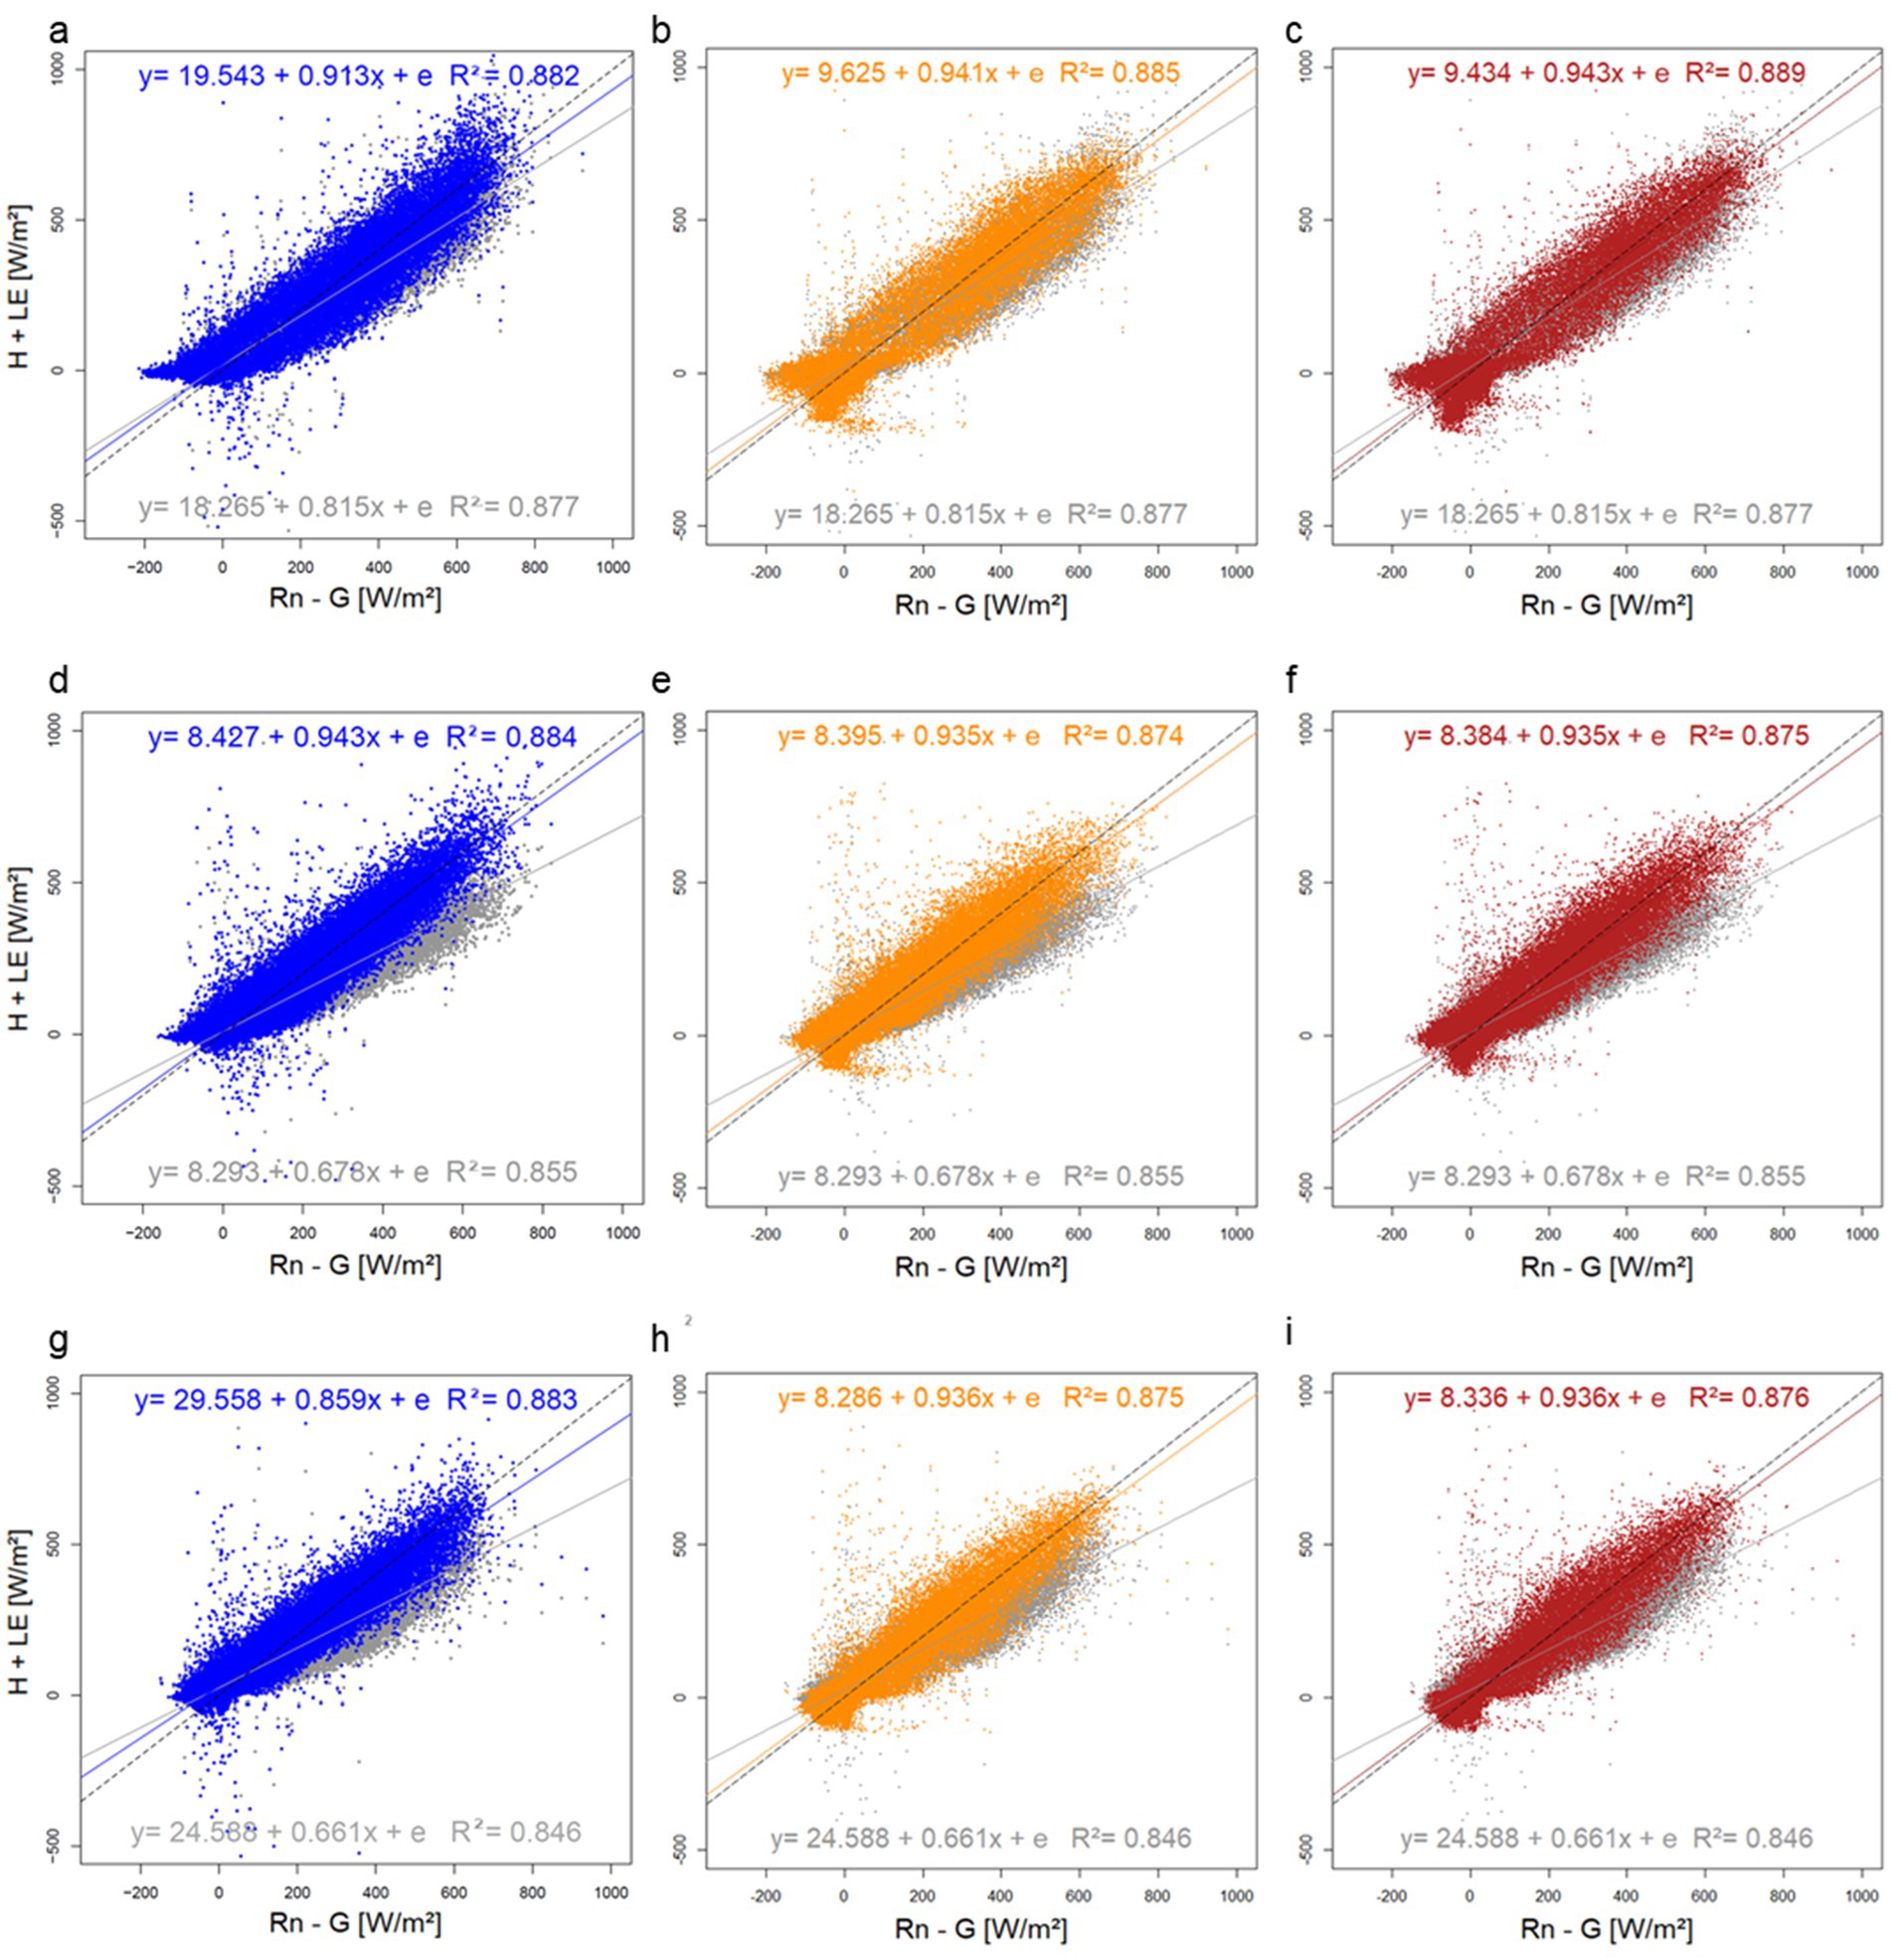
Figure 8. Energy balance closures for Nazinga (a–c), Kayoro (d–f), and Sumbrungu (g–i), corrected (in colors) with the Bowen-ratio method (blue), the quantile mapping method (orange) and the quantile mapping conditioned on circulation patterns (red), compared to the uncorrected energy balance closure (gray). The dotted black line indicates the 1:1 line.
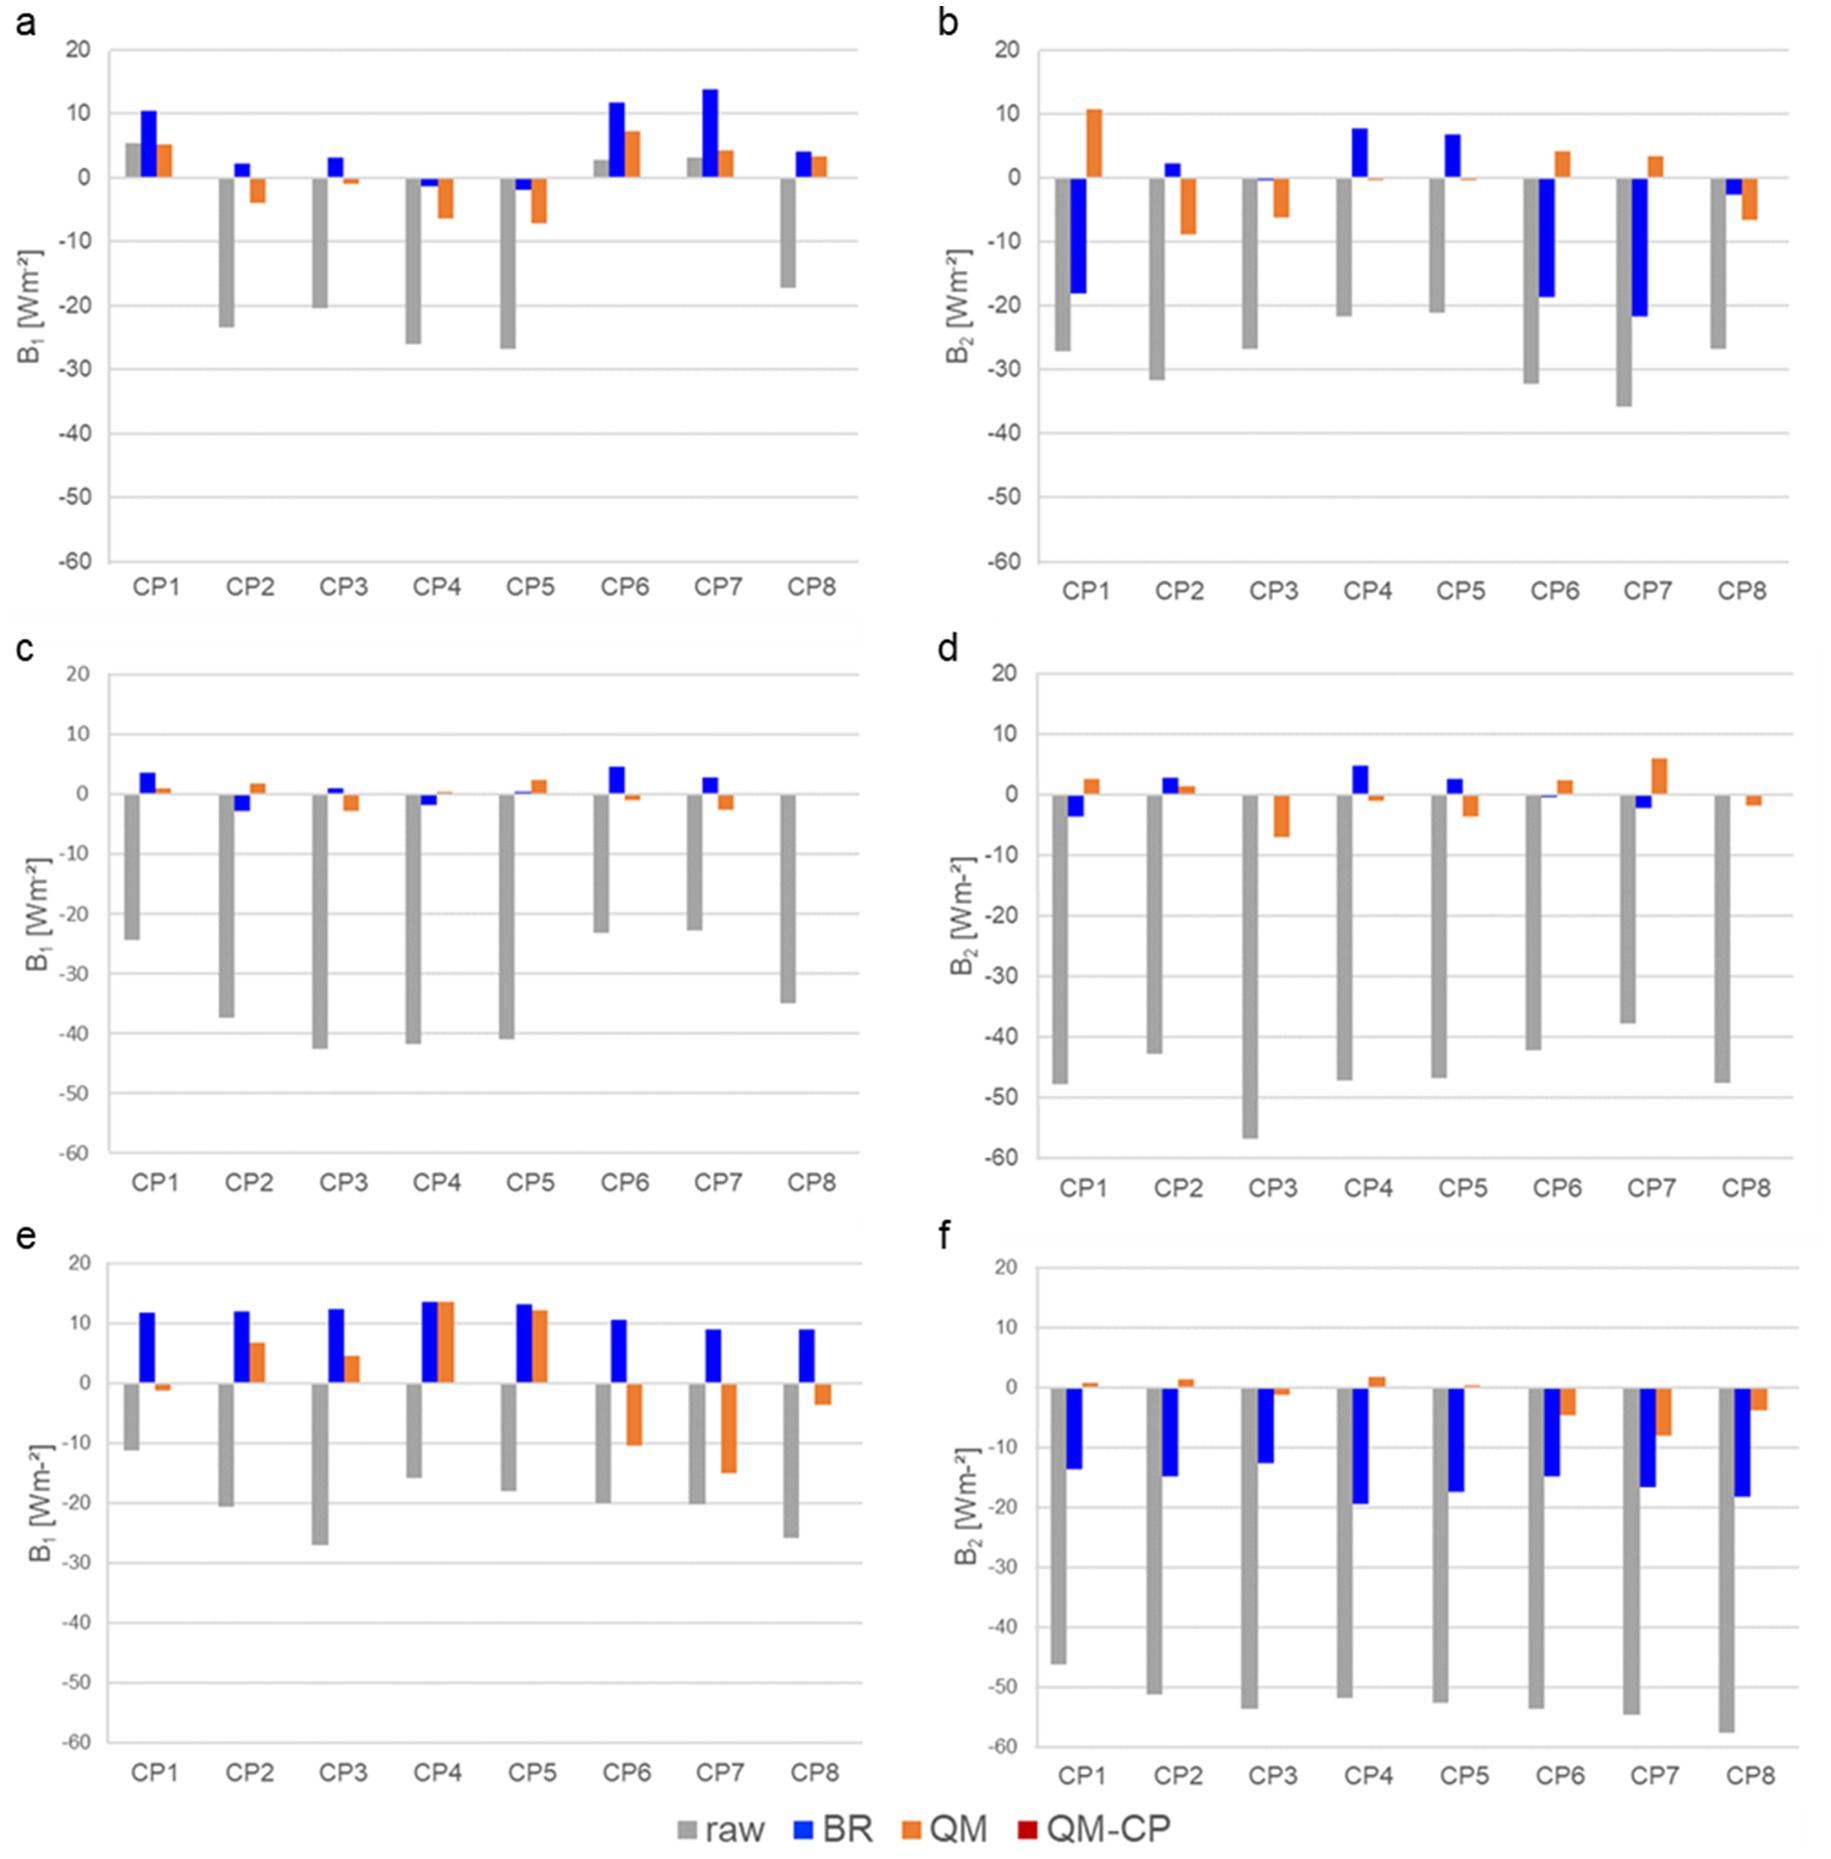
Figure 9. Bias measures B1 (a,c,e) and B2 (b,d,f) for Nazinga (a,b), Kayoro (c,d) and Sumbrungu (e,f) calculated for the uncorrected values (gray), the values corrected with the Bowen-ratio method (blue), quantile-mapping method (orange) and the quantile-mapping method conditioned on circulation patterns (red), grouped by circulation patterns.
The correction of the turbulent fluxes with the QM method achieves a further reduction of both bias values in most cases compared to the BR method. In contrast to the BR method, a correction of the entire distribution function is performed, minimizing any systematic deviations from the mean and variance and therefore outperforming the BR method. However, the outcomes in Figure 9 also show that significant biases of the turbulent fluxes remain for certain CPs if the QM method is used. After performing the bias correction for each CP using the QM-CP approach, the bias is even further reduced for each CP and no longer visible in the chart. Thus, the post-closure approach based on the empirical distribution function of the turbulent fluxes conditioned on the monsoon phases outperforms the other methods. The overall performance measures CB1 and CB2 confirm this (Figure 10). With the QM-CP correction, CB1 and CB2 are almost fully eliminated (with values between 0.02 and 0.1 W/m2). Therefore, the novel QM-CP method performs best in comparison to the other two correction methods.
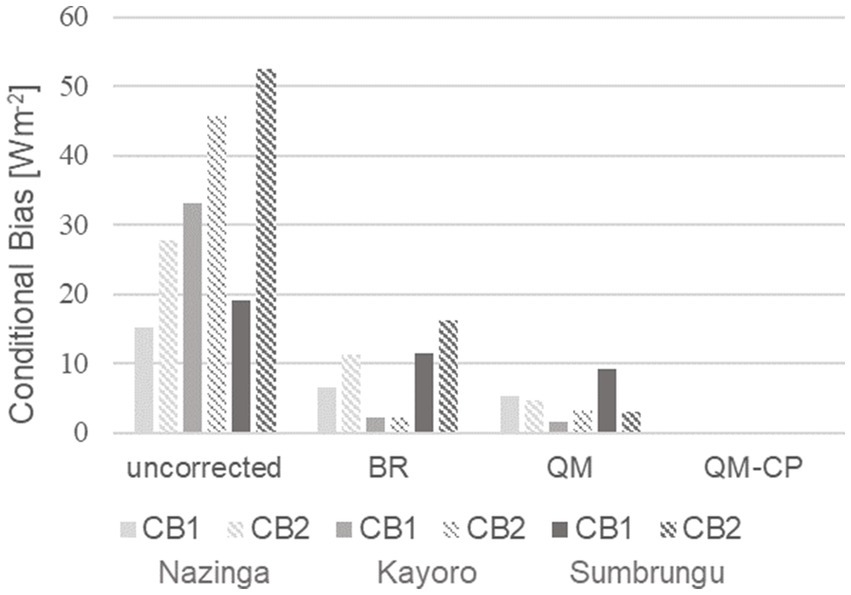
Figure 10. Overall performance measures in terms of the conditional bias measures CB1 and CB2, calculated for the uncorrected and corrected values at the three sites Nazinga (light gray), Kayoro (gray), and Sumbrungu (dark gray), in Wm−2.
We further use the post-closure approaches to generate corrected partitioned sensible and latent heat fluxes to analyze the impact of the bias correction methods on both. Figure 11 shows the corrected and uncorrected fluxes for 3 days in the rainy season (July 20th–23rd 2014) for the sites where the underestimation of the turbulent fluxes was strongest (cropland site at Kayoro) and weakest (near-nature site at Nazinga). In the rainy season, LE is usually distinctly higher than H compared to the dry season (Timouk et al., 2009). It is noticeable that all correction methods preserve the diurnal cycle of the turbulent fluxes for the different sites and lead to no obvious outliers due to the correction. The QM approaches lead to higher H during the day at both sites, especially over midday, while the BR method leads to a lower H compared to the original time series. LE is increased by all approaches, at the natural site to a similar degree across methods, at the cropland site the quantile mapping approaches increase it more than the BR correction at two of the 3 days.
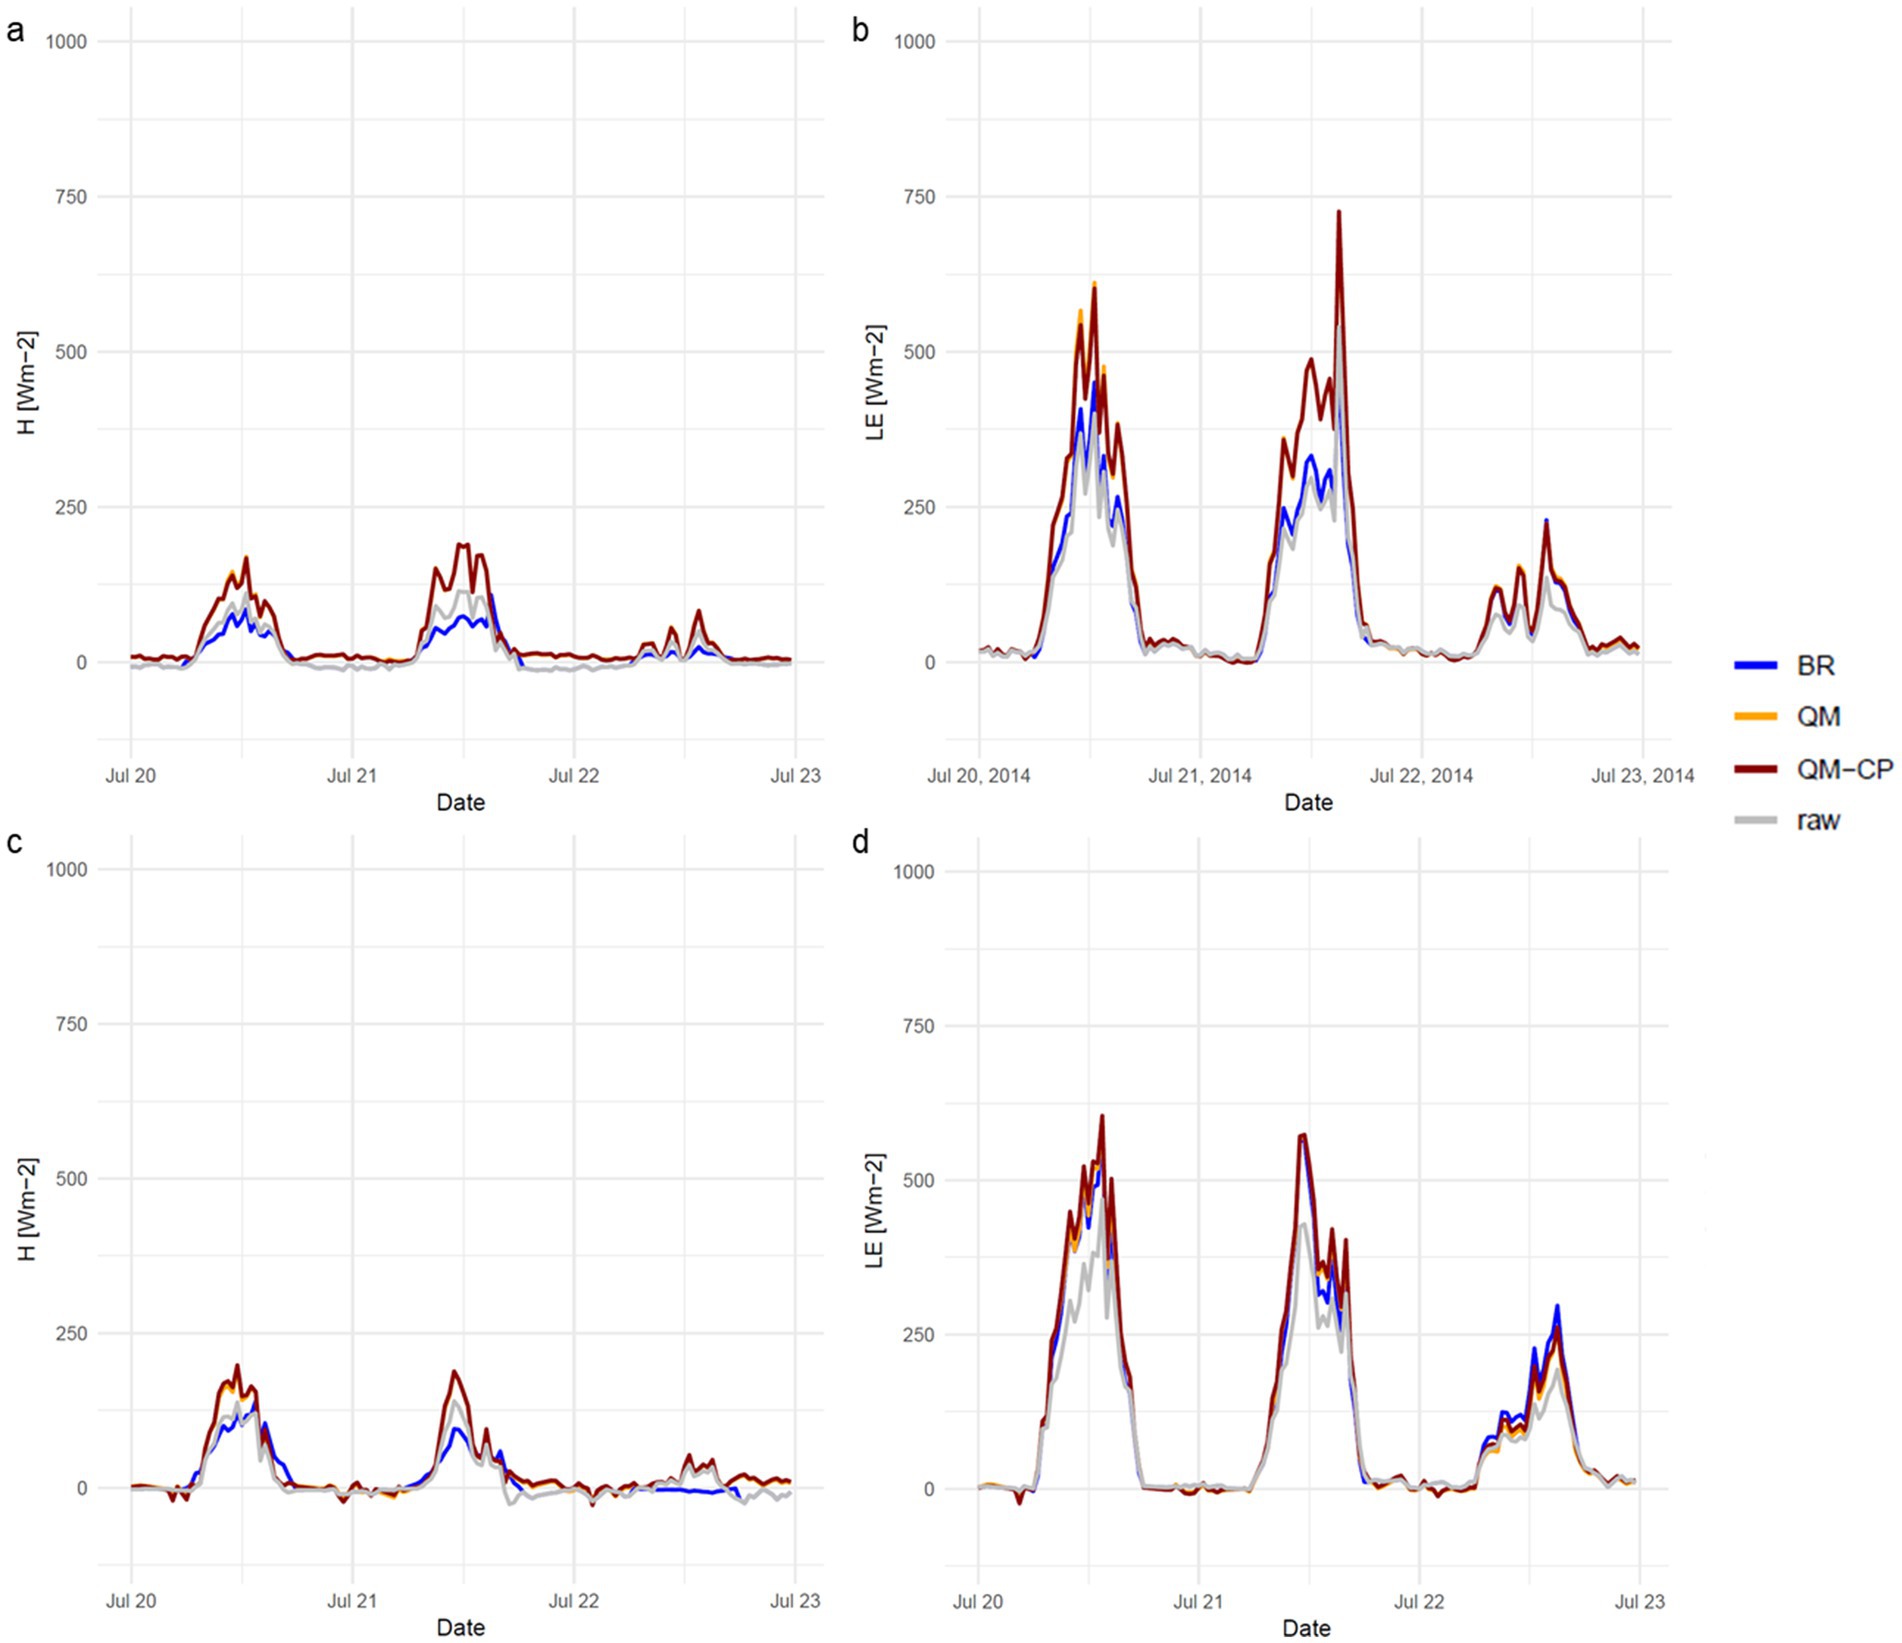
Figure 11. Uncorrected and corrected turbulent fluxes for the cropland site (a,b) and the near-natural site (c,d) for the rainy season 2014 using different post-closure approaches (BR, Bowen ratio method; QM, quantile mapping; QM-CP, quantile mapping conditioned on atmospheric circulation patterns).
The time series examples (Figure 11) clearly show that the typical diurnal cycle of the turbulent fluxes can be preserved by all applied post-closure approaches. However, there are strong differences regarding the magnitude and orientation of the corrected turbulent fluxes, leading to significant differences in comparison to the original and corrected measurements for specific days and diurnal periods (noon). The difference between the QM approaches is not very large as the bias reduction due to the introduction of the CPs is minor as shown in the previous section.
There are also several possibilities for a further advancement of the post-closure methods. Especially, the adjustment factor (EF) used for the partitioning of the residuals should be explored in more detail in future. For instance, Mauder et al. (2018) found that a daily adjustment factor leads to less scatter in the evapotranspiration than sub-hourly factor as chosen for the quantile-mapping approaches in this study. To keep the scatter in the corrected data on a lower level, the EBC adjustment factor should be determined for longer periods as already proposed by Mauder et al. (2013). This can be done for each CP by determining a mean diurnal profile for EF which can then be used for partitioning the turbulent fluxes. There is a controversial discussion about the diurnal constancy of EF, the “daytime self-preservation” (Gentine et al., 2007). In many experimental conditions, the EF is found to be stable during daylight hours (Shuttleworth, 1991; Nichols and Cuenca, 1993; Crago, 1996). However, various studies question that. Although Lhomme and Elguero (1999) confirmed that in conditions of “fair weather,” the curve representing the diurnal course of EF has a typical concave-up shape and appears relatively constant around mid-day, they have shown that it is not necessarily constant during daytime especially in “non-fair weather conditions.” Thus, determining a mean profile for EF for different weather conditions (or circulation patterns) seems to be relevant and the corresponding impact of choosing this profile for an adjustment of the turbulent fluxes needs to be explored in future studies in more detail.
In order to check whether the corrections have a positive effect on the ascertainment of the latent heat flux and therefore evaporation, the results of this study should be verified with independent reference datasets. One option is the comparison with highly precise lysimeter estimates of actual evapotranspiration to identify practical approaches for a correction of the energy fluxes (Gebler et al., 2015; Wohlfahrt et al., 2010). Mauder et al. (2018) performed these comparisons with EC measurements from two grassland sites in southwestern Germany within the TERENO (Terrestrial Environmental Observatories) network. However, this type of measurement is not (yet) available for the sites examined in this study. A further option is integrated numerical modeling of the relevant land surface processes, as it provides useful insights about the possible partitioning of the energy balance residuals into sensible and latent heat fluxes (Ingwersen et al., 2011). In future the use of machine-learning techniques could also be useful in this context. Zhang et al. (2023) have applied such method to correct the LE in conditions of high relative humidity (>70%). They emphasize the potential underestimation of ET and LE during such conditions as source of uncertainty, which is often not characterized. The outcome was compared to LE corrections based on the BR methods and to the total LE attribution of the residual.
This study evaluated EC measurements from 2013 to 2016 at three distinct land use sites (degraded grassland, cropland, near-nature) within the West African Sudanian savanna. The focus was on assessing EBC over the seasonal cycle of the West African Monsoon. Key findings include:
• EBC gaps: Turbulent heat fluxes were consistently underestimated by 10–30%, with the highest accuracy observed at the near-natural site and the lowest at the cropland site.
• Seasonal Variability: The underestimation of turbulent fluxes showed significant seasonal variation, being lowest during the dry season.
• Site-dependent factors: Factors such as the homogeneity of land use appeared to have a more substantial impact on EBC than atmospheric dynamics.
• Method comparison: The BR correction was least effective and partly introduced new biases, while the QM methods improved bias reduction. Notably, the QM-CP method performed the best, significantly outperforming both the BR correction and standard QM methods.
Overall, the research underscores the influence of land use and large-scale atmospheric circulation patterns on EBC accuracy. It highlights the QM-CP method as a significant advancement, demonstrating its effectiveness in reducing measurement biases in this understudied environment.
The data analyzed in this study is subject to the following licenses/restrictions: The data can be provided upon request. Requests to access these datasets should be directed to amFuLmJsaWVmZXJuaWNodEB1bmktYS5kZQ==.
LN: Conceptualization, Formal analysis, Methodology, Writing – original draft. JB: Conceptualization, Methodology, Writing – review & editing. DP: Methodology, Writing – review & editing. MR: Methodology, Writing – review & editing. SS: Writing – review & editing. SG: Writing – review & editing. RS: Writing – review & editing. FN: Writing – review & editing. LH: Data curation, Formal analysis, Writing – review & editing. HK: Funding acquisition, Writing – review & editing.
The author(s) declare that financial support was received for the research, authorship, and/or publication of this article. This work was part of the WASCAL (West African Science Service Center on Climate Change and Adapted Land Use, www.wascal.org), granted by the Federal Ministry of Education and Research in Germany (grant number: 01LG1202C1). This research is also supported by the Federal Ministry of Education and Research of Germany (BMBF) through the Concerted Regional Modeling and Observation Assessment for Greenhouse Gas Emissions and Mitigation Options under Climate and Land Use Change in West Africa (CONCERT-West Africa; grant number 01LG2089A BMBF).
The authors would further like to gratefully acknowledge the editor and the four reviewers for their helpful comments.
The authors declare that the research was conducted in the absence of any commercial or financial relationships that could be construed as a potential conflict of interest.
All claims expressed in this article are solely those of the authors and do not necessarily represent those of their affiliated organizations, or those of the publisher, the editors and the reviewers. Any product that may be evaluated in this article, or claim that may be made by its manufacturer, is not guaranteed or endorsed by the publisher.
The Supplementary material for this article can be found online at: https://www.frontiersin.org/articles/10.3389/frwa.2024.1393884/full#supplementary-material
Ayugi, B., Tan, G., Ruoyun, N., Babaousmail, H., Ojara, M., Wido, H., et al. (2020). Quantile mapping bias correction on Rossby Centre regional climate models for precipitation analysis over Kenya, East Africa. Water 12:801. doi: 10.3390/w12030801
Bachofen, C., Tumber-Dávila, S. J., Scott Mackay, D., McDowell, N. G., Carminati, A., Klein, T., et al. (2024). Tree water uptake patterns across the globe. New Phytol. 242, 1891–1910. doi: 10.1111/nph.19762
Bagayoko, F., Yonkeu, S., and van de Giesen, N. C. (2006). Energy balance closure and footprint analysis using eddy covariance measurements in Eastern Burkina Faso, West Africa. Hydrol. Earth Syst. Sci. Discuss. 3, 2789–2812. doi: 10.5194/HESSD-3-2789-2006
Berger, S., Bliefernicht, J., Linstadter, A., Canak, K., Guug, S., Heinzeller, D., et al. (2019). The impact of rain events on CO2 emissions from contrasting land use systems in Semi-Arid West African Savannas. Sci. Total Environ. 647, 1478–1489. doi: 10.1016/j.scitotenv.2018.07.397
Blanken, P. D., Black, T. A., Yang, P. C., Neumann, H. H., Nesic, Z., Staebler, R., et al. (1997). Energy balance and canopy conductance of a boreal Aspen Forest: partitioning overstory and understory components. J. Geophys. Res. Atmos. 102, 28915–28927. doi: 10.1029/97JD00193
Bliefernicht, J., Berger, S., Salack, S., Guug, S., Hingerl, L., Heinzeller, D., et al. (2018). The WASCAL hydrometeorological observatory in the Sudan Savanna of Burkina Faso and Ghana. Vadose Zone J. 17:180065, 1–20. doi: 10.2136/vzj2018.03.0065
Bliefernicht, J., Rauch, M., Laux, P., and Kunstmann, H. (2022). Atmospheric circulation patterns that trigger heavy rainfall in West Africa. Int. J. Climatol. 42, 6515–6536. doi: 10.1002/joc.7613
Blyth, E., Gash, J., Lloyd, A., Pryor, M., Weedon, G. P., and Shuttleworth, J. (2010). Evaluating the JULES land surface model energy fluxes using FLUXNET data. J. Hydrometeorol. 11, 509–519. doi: 10.1175/2009JHM1183.1
Bonan, G. B. (2008). Forests and climate change: forcings, feedbacks, and the climate benefits of forests. Science 320, 1444–1449. doi: 10.1126/science.1155121
Bowen, I. S. (1926). The ratio of heat losses by conduction and by evaporation from any water surface. Phys. Rev. 27, 779–787. doi: 10.1103/PhysRev.27.779
Charuchittipan, D., Babel, W., Mauder, M., Leps, J.-P., and Foken, T. (2014). Extension of the averaging time in eddy-covariance measurements and its effect on the energy balance closure. Bound. Layer Meteorol. 152, 303–327. doi: 10.1007/s10546-014-9922-6
Chen, Y.-Y., and Li, M.-H. (2012). Determining adequate averaging periods and reference coordinates for eddy covariance measurements of surface heat and water vapor fluxes over mountainous terrain. Terr. Atmos. Ocean. Sci. 23:685. doi: 10.3319/TAO.2012.05.02.01(Hy)
Crago, R. D. (1996). Conservation and variability of the evaporative fraction during the daytime. J. Hydrol. 180, 173–194. doi: 10.1016/0022-1694(95)02903-6
de Roo, F., and Mauder, M. (2018). The influence of idealized surface heterogeneity on virtual turbulent flux measurements. Atmos. Chem. Phys. 18, 5059–5074. doi: 10.5194/acp-18-5059-2018
Eder, F., de Roo, F., Kohnert, K., Desjardins, R. L., Schmid, H. P., and Mauder, M. (2014). Evaluation of two energy balance closure parametrizations. Bound. Layer Meteorol. 151, 195–219. doi: 10.1007/s10546-013-9904-0
Enayati, M., Bozorg-Haddad, O., Bazrafshan, J., Hejabi, S., and Chu, X. (2021). Bias correction capabilities of quantile mapping methods for rainfall and temperature variables. J. Water Climate Change 12, 401–419. doi: 10.2166/wcc.2020.261
Eshonkulov, R., Poyda, A., Ingwersen, J., Pulatov, A., and Streck, T. (2019). Improving the energy balance closure over a winter wheat field by accounting for minor storage terms. Agric. For. Meteorol. 264, 283–296. doi: 10.1016/j.agrformet.2018.10.012
Falge, E., Reth, S., Brüggemann, N., Butterbach-Bahl, K., Goldberg, V., Oltchev, A., et al. (2005). Comparison of surface energy exchange models with eddy flux data in forest and grassland ecosystems of Germany. Ecol. Model. 188, 174–216. doi: 10.1016/j.ecolmodel.2005.01.057
Finnigan, J. J., Clement, R., Malhi, Y., Leuning, R., and Cleugh, H. A. (2003). A re-evaluation of long-term flux measurement techniques part I: averaging and coordinate rotation. Bound. Layer Meteorol. 107, 1–48. doi: 10.1023/A:1021554900225
Foken, T. (2008). The energy balance closure problem. Ecol. Appl. 18, 1351–1367. doi: 10.1890/06-0922.1
Foken, T., Aubinet, M., Finnigan, J. J., Leclerc, M. Y., Mauder, M., Paw, K. T., et al. (2011). Results of a panel discussion about the energy balance closure correction for trace gases. Bull. Am. Meteorol. Soc. 92:ES13–18. doi: 10.1175/2011BAMS3130.1
Foley, J. A., Ramankutty, N., Brauman, K. A., Cassidy, E. S., Gerber, J. S., Johnston, M., et al. (2011). Solutions for a cultivated planet. Nature 478, 337–342. doi: 10.1038/nature10452
Funk, C., Peterson, P., Landsfeld, M., Pedreros, D., Verdin, J., Shukla, S., et al. (2015). The climate hazards infrared precipitation with stations—a new environmental record for monitoring extremes. Scientific data. 2, 1–21.
Galle, S., Grippa, M., Peugeot, C., Bouzou Moussa, I., Cappelaere, B., Demarty, J., et al. (2018). AMMA–CATCH, a critical zone observatory in West Africa monitoring a region in transition. Vadose Zone J. 17, 1–24. doi: 10.2136/vzj2018.03.0062
Gatzsche, K., Babel, W., Falge, E., Pyles, R. D., Kyaw Tha Paw, U., Raabe, A., et al. (2018). Footprint-weighted tile approach for a spruce forest and a nearby patchy clearing using the ACASA model. Biogeosciences 15, 2945–2960. doi: 10.5194/bg-15-2945-2018
Gebler, S., Hendricks Franssen, H.-J., Pütz, T., Post, H., Schmidt, M., and Vereecken, H. (2015). Actual evapotranspiration and precipitation measured by lysimeters: a comparison with eddy covariance and tipping bucket. Hydrol. Earth Syst. Sci. 19, 2145–2161. doi: 10.5194/hess-19-2145-2015
Gentine, P., Entekhabi, D., Chehbouni, A., Boulet, G., and Duchemin, B. (2007). Analysis of evaporative fraction diurnal behaviour. Agric. For. Meteorol. 143, 13–29. doi: 10.1016/j.agrformet.2006.11.002
Gerken, T., Babel, W., Hoffmann, A., Biermann, T., Herzog, M., Friend, A. D., et al. (2012). Turbulent flux modelling with a simple 2-layer soil model and extrapolated surface temperature applied at Nam co Lake Basin on the Tibetan Plateau. Hydrol. Earth Syst. Sci. 16, 1095–1110. doi: 10.5194/hess-16-1095-2012
Grachev, A. A., Fairall, C. W., Blomquist, B. W., Fernando, H. J. S., Leo, L. S., Otárola-Bustos, S. F., et al. (2020). On the surface energy balance closure at different temporal scales. Agric. For. Meteorol. 281:107823. doi: 10.1016/j.agrformet.2019.107823
Hersbach, H., Bell, B., Berrisford, P., Hirahara, S., Horányi, A., Muñoz-Sabater, J., et al. (2020). The ERA5 global reanalysis. Q. J. R. Meteorol. Soc. 146, 1999–2049. doi: 10.1002/qj.3803
Imukova, K., Ingwersen, J., Hevart, M., and Streck, T. (2016). Energy balance closure on a winter wheat stand: comparing the eddy covariance technique with the soil water balance method. Biogeosciences 13, 63–75. doi: 10.5194/bg-13-63-2016
Inagaki, A., Letzel, M. O., Raasch, S., and Kanda, M. (2006). Impact of surface heterogeneity on energy imbalance: a study using LES. J. Meteorol. Soc. Japan Ser. 84, 187–198. doi: 10.2151/jmsj.84.187
Ingwersen, J., Imukova, K., Högy, P., and Streck, T. (2015). On the use of the post-closure methods uncertainty band to evaluate the performance of land surface models against eddy covariance flux data. Biogeosciences 12, 2311–2326. doi: 10.5194/bg-12-2311-2015
Ingwersen, J., Steffens, K., Högy, P., Warrach-Sagi, K., Zhunusbayeva, D., Poltoradnev, M., et al. (2011). Comparison of Noah simulations with eddy covariance and soil water measurements at a winter wheat stand. Agric. For. Meteorol. 151, 345–355. doi: 10.1016/j.agrformet.2010.11.010
Kanda, M., Inagaki, A., Letzel, M. O., Raasch, S., and Watanabe, T. (2004). LES study of the energy imbalance problem with eddy covariance fluxes. Bound. Layer Meteorol. 110, 381–404. doi: 10.1023/B:BOUN.0000007225.45548.7a
Katiraie-Boroujerdy, P.-S., Naeini, M. R., Asanjan, A. A., Chavoshian, A., Hsu, K.-l., and Sorooshian, S. (2020). Bias correction of satellite-based precipitation estimations using quantile mapping approach in different climate regions of Iran. Remote Sens. 12:2102. doi: 10.3390/rs12132102
Kelliher, F. M., Leuning, R., and Schulze, E. D. (1993). Evaporation and canopy characteristics of coniferous forests and grasslands. Oecologia 95, 153–163. doi: 10.1007/BF00323485
Lavaysse, C., Flamant, C., Janicot, S., Parker, D. J., Lafore, J.-P., Sultan, B., et al. (2009). Seasonal evolution of the West African heat low: a climatological perspective. Clim. Dyn. 33, 313–330. doi: 10.1007/s00382-009-0553-4
Lhomme, J.-P., and Elguero, E. (1999). Examination of evaporative fraction diurnal behaviour using a soil-vegetation model coupled with a mixed-layer model. Hydrol. Earth Syst. Sci. 3, 259–270. doi: 10.5194/hess-3-259-1999
Liu, H., Liu, C., Huang, J., Desai, A. R., Zhang, Q., Ghannam, K., et al. (2024). Scalar flux profiles in the unstable atmospheric surface layer under the influence of large eddies: implications for eddy covariance flux measurements and the non-closure problem. Geophys. Res. Lett. 51:e2023GL106649. doi: 10.1029/2023GL106649
Mauder, M., Cuntz, M., Drüe, C., Graf, A., Rebmann, C., Schmid, H. P., et al. (2013). A strategy for quality and uncertainty assessment of long-term eddy-covariance measurements. Agric. For. Meteorol. 169, 122–135. doi: 10.1016/j.agrformet.2012.09.006
Mauder, M., Desjardins, R. L., Pattey, E., and Worth, D. (2010). An attempt to close the daytime surface energy balance using spatially-averaged flux measurements. Bound. Layer Meteorol. 136, 175–191. doi: 10.1007/s10546-010-9497-9
Mauder, M., and Foken, T. (2006). Impact of Post-field data processing on eddy covariance flux estimates and energy balance closure. Meteorol. Z. 15, 597–609. doi: 10.1127/0941-2948/2006/0167
Mauder, M., and Foken, T. (2015). Documentation and instruction manual of the eddy covariance software package TK3 (update). Arbeitsergebnisse Abteilung Mikrometeorologie 62, 1–60.
Mauder, M., Foken, T., and Cuxart, J. (2020). Surface-energy-balance closure over land: a review. Bound. Layer Meteorol. 177, 395–426. doi: 10.1007/s10546-020-00529-6
Mauder, M., Genzel, S., Jin, F., Kiese, R., Soltani, M., Steinbrecher, R., et al. (2018). Evaluation of energy balance closure adjustment methods by independent evapotranspiration estimates from lysimeters and hydrological simulations. Hydrol. Process. 32, 39–50. doi: 10.1002/hyp.11397
Miller, G. R., Chen, X., Rubin, Y., Ma, S., and Baldocchi, D. D. (2010). Groundwater uptake by Woody vegetation in a semiarid oak savanna. Water Resour. Res. 46:2009WR008902. doi: 10.1029/2009WR008902
Miranda, A. C., Miranda, H. S., Lloyd, J., Grace, J., Francey, R. J., Mcintyre, J. A., et al. (1997). Fluxes of carbon, water and energy over Brazilian Cerrado: an analysis using eddy covariance and stable isotopes. Plant Cell Environ. 20, 315–328. doi: 10.1046/j.1365-3040.1997.d01-80.x
Nichols, W. E., and Cuenca, R. H. (1993). Evaluation of the evaporative fraction for parameterization of the surface energy balance. Water Resour. Res. 29, 3681–3690. doi: 10.1029/93WR01958
Nicholson, S. E. (2013). The West African Sahel: a review of recent studies on the rainfall regime and its interannual variability. ISRN Meteorol. 2013, 1–32. doi: 10.1155/2013/453521
Ondiek, R., Hayes, D. S., Kinyua, D. N., Kitaka, N., Lautsch, E., Mutuo, P., et al. (2021). Influence of land-use change and season on soil greenhouse gas emissions from a tropical wetland: a stepwise explorative assessment. Sci. Total Environ. 787:147701. doi: 10.1016/j.scitotenv.2021.147701
Panin, G. N., Tetzlaff, G., and Raabe, A. (1998). Inhomogeneity of the land surface and problems in TheParameterization of surface fluxes in natural conditions. Theor. Appl. Climatol. 60, 163–178. doi: 10.1007/s007040050041
Pitman, A. J., de Noblet-Ducoudré, N., Cruz, F. T., Davin, E. L., Bonan, G. B., Brovkin, V., et al. (2009). Uncertainties in climate responses to past land cover change: first results from the LUCID intercomparison study. Geophys. Res. Lett. 36, 1–6. doi: 10.1029/2009GL039076
Quansah, E., Mauder, M., Balogun, A. A., Amekudzi, L. K., Hingerl, L., Bliefernicht, J., et al. (2015). Carbon dioxide fluxes from contrasting ecosystems in the Sudanian savanna in West Africa. Carbon Balance Manag. 10:1. doi: 10.1186/s13021-014-0011-4
Rahimi, J., Ago, E. E., Ayantunde, A., Berger, S., Bogaert, J., Butterbach-Bahl, K., et al. (2021). Modeling gas exchange and biomass production in West African Sahelian and Sudanian ecological zones, Geosci. Model Dev. 14, 3789–3812. doi: 10.5194/gmd-14-3789-2021
Ringard, J., Seyler, F., and Linguet, L. (2017). A quantile mapping bias correction method based on hydroclimatic classification of the Guiana shield. Sensors 17, 1–17. doi: 10.3390/s17061413
Shuttleworth, W. J. (1991). “Evaporation models in hydrology” in Land surface evaporation. eds. T. J. Schmugge and J.-C. André (New York, NY: Springer), 93–120.
Siegmund, J., Bliefernicht, J., Laux, P., and Kunstmann, H. (2015). Toward a seasonal precipitation prediction system for West Africa: performance of CFSv2 and high–resolution dynamical downscaling. J. Geophys. Res. Atmos. 120, 7316–7339. doi: 10.1002/2014JD022692
Soltani, M., Mauder, M., Laux, P., and Kunstmann, H. (2018). Turbulent flux variability and energy balance closure in the TERENO Prealpine observatory: a hydrometeorological data analysis. Theor. Appl. Climatol. 133, 937–956. doi: 10.1007/s00704-017-2235-1
Staudt, K., Falge, E., Pyles, R. D., Paw U, K. T., and Foken, T. (2010). Sensitivity and predictive uncertainty of the ACASA model at a spruce forest site. Biogeosciences 7, 3685–3705. doi: 10.5194/bg-7-3685-2010
Stoy, P. C., Mauder, M., Foken, T., Marcolla, B., Boegh, E., Andreas Ibrom, M., et al. (2013). A data-driven analysis of energy balance closure across FLUXNET research sites: the role of landscape scale heterogeneity. Agric. For. Meteorol. 171-172, 137–152. doi: 10.1016/j.agrformet.2012.11.004
Sy, S., Noblet-Ducoudré, N., Quesada, B., Sy, I., Dieye, A., Gaye, A., et al. (2017). Land-surface characteristics and climate in West Africa: models’ biases and impacts of historical anthropogenically-induced deforestation. Sustain. For. 9:1917. doi: 10.3390/su9101917
Timouk, F., Kergoat, L., Mougin, E., Lloyd, C. R., Ceschia, E., Cohard, J.-M., et al. (2009). Response of surface energy balance to water regime and vegetation development in a Sahelian landscape. J. Hydrol. 375, 178–189. doi: 10.1016/j.jhydrol.2009.04.022
Twine, T. E., Kustas, W. P., Norman, J. M., Cook, D. R., Houser, P. R., Meyers, T. P., et al. (2000). Correcting eddy-covariance flux underestimates over a grassland. Agric. For. Meteorol. 103, 279–300. doi: 10.1016/S0168-1923(00)00123-4
White, F. (1983). “Carte de Végétation de l’Afrique: Vegetation Map of Africa” in Natural resources research, UNESCO. 20:50.
Whitecross, M. A., Witkowski, E. T. F., and Archibald, S. (2017). Savanna tree-grass interactions: a phenological investigation of green-up in relation to water availability over three seasons. S. Afr. J. Bot. 108, 29–40. doi: 10.1016/j.sajb.2016.09.003
Widmoser, P., and Michel, D. (2021). Partial energy balance closure of eddy covariance evaporation measurements using concurrent lysimeter observations over grassland. Hydrol. Earth Syst. Sci. 25, 1151–1163. doi: 10.5194/hess-25-1151-2021
Winter, J. M., and Eltahir, E. A. B. (2010). The sensitivity of latent heat flux to changes in the radiative forcing: a framework for comparing models and observations. J. Clim. 23, 2345–2356. doi: 10.1175/2009JCLI3158.1
Wohlfahrt, G., Haslwanter, A., Hörtnagl, L., Jasoni, R. L., Fenstermaker, L. F., Arnone, J. A., et al. (2009). On the consequences of the energy imbalance for calculating surface conductance to water vapour. Agric. For. Meteorol. 149, 1556–1559. doi: 10.1016/j.agrformet.2009.03.015
Wohlfahrt, G., Irschick, C., Thalinger, B., Hörtnagl, L., Obojes, N., and Hammerle, A. (2010). Insights from independent evapotranspiration estimates for closing the energy balance: a grassland case study. Vadose Zone J. 9, 1025–1033. doi: 10.2136/vzj2009.0158
Xin, Y.-F., Chen, F., Zhao, P., Barlage, M., Blanken, P., Chen, Y.-L., et al. (2018). Surface energy balance closure at ten sites over the Tibetan Plateau. Agric. For. Meteorol. 259, 317–328. doi: 10.1016/j.agrformet.2018.05.007
Zhang, W., Jung, M., Migliavacca, M., Poyatos, R., Miralles, D. G., El-Madany, T. S., et al. (2023). The effect of relative humidity on eddy covariance latent heat flux measurements and its implication for partitioning into transpiration and evaporation. Agric. For. Meteorol. 330:109305. doi: 10.1016/j.agrformet.2022.109305
Keywords: eddy covariance, energy balance closure, Bowen ratio, statistical post-processing, bias correction, land use change, West Africa
Citation: Nadolski L, Bliefernicht J, Petrovic D, Rauch M, Sy S, Guug S, Steinbrecher R, Neidl F, Hingerl L and Kunstmann H (2024) Exploring and closing the energy balance of eddy covariance measurements along a land use gradient in the West African Sudanian savanna. Front. Water. 6:1393884. doi: 10.3389/frwa.2024.1393884
Received: 29 February 2024; Accepted: 24 September 2024;
Published: 30 October 2024.
Edited by:
Giacomo Bertoldi, Eurac Research, ItalyReviewed by:
Torbern Tagesson, Lund University, SwedenCopyright © 2024 Nadolski, Bliefernicht, Petrovic, Rauch, Sy, Guug, Steinbrecher, Neidl, Hingerl and Kunstmann. This is an open-access article distributed under the terms of the Creative Commons Attribution License (CC BY). The use, distribution or reproduction in other forums is permitted, provided the original author(s) and the copyright owner(s) are credited and that the original publication in this journal is cited, in accordance with accepted academic practice. No use, distribution or reproduction is permitted which does not comply with these terms.
*Correspondence: Harald Kunstmann, aGFyYWxkLmt1bnN0bWFubkBraXQuZWR1
Disclaimer: All claims expressed in this article are solely those of the authors and do not necessarily represent those of their affiliated organizations, or those of the publisher, the editors and the reviewers. Any product that may be evaluated in this article or claim that may be made by its manufacturer is not guaranteed or endorsed by the publisher.
Research integrity at Frontiers

Learn more about the work of our research integrity team to safeguard the quality of each article we publish.