 Melissa Schlegel1*Jennifer Souza1
 Sara R. Warix1Erin M. Murray2
 Sarah E. Godsey1Mark S. Seyfried2Zane Cram2
 Kathleen A. Lohse1,3
- 1Department of Geosciences, Idaho State University, Pocatello, ID, United States
- 2Northwest Watershed Research Center, USDA ARS, Boise, ID, United States
- 3Department of Biological Sciences, Idaho State University, Pocatello, ID, United States
Using hydrochemical and isotopic compositions of springs and wells, we trace carbon from critical zone carbon dioxide (CO2) into groundwater of the semi-arid Reynolds Creek Experimental Watershed - Critical Zone Observatory, southwestern Idaho, USA. Dissolved inorganic carbon (DIC) concentrations, pH and stable isotope tracers of carbon for DIC (δ13CDIC), are used to show that most groundwater evolves under open system conditions, moving carbon into the groundwater and acting as a carbon sink. However, one sample (−10.94‰ δ13CDIC, 6,350 14C years before present (yrs. BP)) may have evolved under closed system conditions with a higher partial pressure of critical zone CO2 than present-day soils. By characterizing the carbon cycle, we show that (1) carbon evolution is primarily under open-system conditions, (2) shallow groundwater samples are generally less mixed and more recent (10 to 70 3H yrs. BP) than deeper groundwater samples (1,469 to 6,350 14C yrs. BP), and (3) the older portion of the groundwater may be even older than the calculated 14C ages, as indicated by the mixing of age tracers in intermediate wells. Our global conception of the deep critical zone should include carbon cycling of critical zone CO2 in old groundwater. Characterizing the deep critical zone in a semi-arid weathered silicate watershed improves our global understanding of carbon, nutrient and water cycling.
1 Introduction
The critical zone (CZ), which extends from the vegetation canopy through groundwater, is tightly connected to the hydrologic cycle, and sustains nearly all terrestrial life (National Research Council, 2001). A thorough understanding of water in this thin reactive global envelope is essential for meeting societal demands such as population growth, industrialization, toxin disposal, and CO2 sequestration (National Research Council, 2001). In 2007, the National Science Foundation established the Critical Zone Observatory (CZO) Program to understand the structure and function of the CZ. In 2013, a CZO was established in the Reynolds Creek Experimental Watershed (RCEW), located south of the western Snake River Plain in the Intermountain West of the United States. The purpose of the RCEW-CZO was to improve prediction of carbon storage at the plot to landscape scale and examine the processes regulating it, including understanding the role of groundwater in controlling carbon turnover at the watershed scale. Though silicate rocks account for 41% of global land area, few studies have investigated the role of groundwater in carbon cycling in fractured basalts at the watershed scale (Zhang et al., 2021). Carbon cycling in groundwater is an important part of the CZ, as it plays a crucial role in mineral weathering and carbon storage, especially in silicate minerals. Determining rates of these processes requires an understanding of carbon evolution and age tracers such as 14C.
Carbon systems in groundwater are commonly defined as systems with access to CZ CO2 (open systems) and systems isolated from access to CZ CO2 (closed systems). The CZ CO2 in groundwater is primarily derived from the decomposition of belowground organic matter, reaching 20 to 100 times the aboveground atmospheric levels in the unsaturated groundwater zone, which is then dissolved into groundwater and carried into the deep critical zone of the saturated aquifer (Richter and Billings, 2015; Keller, 2019). Open carbon systems have an essentially unlimited source of CO2 due to constant interaction with soil gasses. In contrast, closed carbon systems have a fixed amount of CO2 obtained when the water was in contact with CZ CO2. In open carbon systems, a positive feedback exists where carbonic acid is consumed in mineral dissolution enabling adsorption and dissociation of CO2, which leads to further mineral dissolution. This process increases the pH and dissolved inorganic carbon (DIC) concentrations, (e.g., Langmuir, 1971; Clark and Fritz, 1997). In a closed system, carbonic acid is quickly consumed, limiting extensive mineral dissolution beyond calcite saturation; however slower reactions such as silicate weathering continue to increase the pH. Dissolution of CZ CO2 into groundwater and mineral interactions controls pH and DIC, which aid in defining systems as open or closed carbon systems.
Differentiating between closed system carbonate and silicate weathering relies on combining our understanding of the evolution of δ13CDIC values along with pH and DIC. In pH / DIC space, the open system weathering trajectory and the δ13CDIC tracer is the same for both carbonate and silicate systems, but closed system silicate weathering trajectories have lower DIC concentrations than closed system carbonate weathering trajectories (Figure 1; Deines et al., 1974; Clark and Fritz, 1997; Bottrell et al., 2019). Furthermore, along a pure closed system silicate weathering trajectory, there is no change in the δ13CDIC value, and therefore, a transition from open system weathering to closed silicate weathering can be identified by a cessation of δ13CDIC evolution. The pH value also differentiates between closed system carbonate and silicate weathering, as the pH continues to increase due to H+ consumption in clay formation, resulting in values higher than calcite saturation for carbonate systems (Appelo and Postma, 2005). By combining the pH and DIC values with δ13CDIC values, we can differentiate between closed system carbonate and silicate weathering; however, this can be complicated because most silicate systems are partially open to carbon exchange with respiratory CO2 (Vogel et al., 1970; Clark and Fritz, 1997; Cartwright et al., 2013). It is important to assess the degree of open or closed carbon evolution in a system because this information is used in 14C groundwater age estimates.
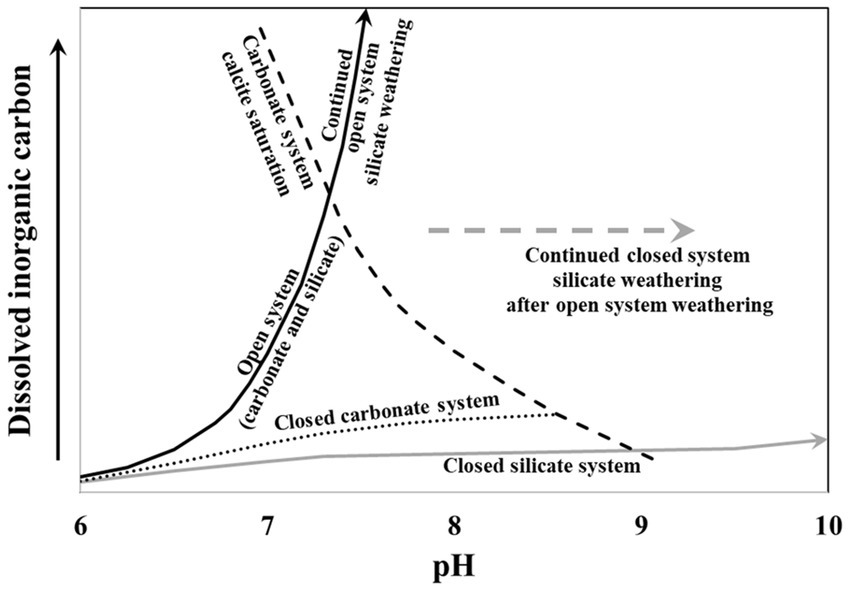
Figure 1. The pH and dissolved inorganic carbon (DIC) trajectories under open and closed carbon evolution for carbonate and silicate systems. Modified from Bottrell et al. (2019).
There are many models for correcting 14C groundwater residence times. Different models of 14C residence times are corrected using δ13CDIC (e.g., Ingerson and Pearson, 1964; Fontes and Garnier, 1979; Clark and Fritz, 1997), major ion geochemistry (e.g., Tamers, 1975), and net geochemical reactions (Parkhurst and Charlton, 2008). Open and closed system calcite dissolution is considered in some models (e.g., Fontes and Garnier, 1979), but ignored in others, and partially open systems are often poorly addressed (Gillon et al., 2009; Cartwright et al., 2013). Ignoring the system boundaries may result in overestimating the extent of δ13CDIC and 14C from calcite dissolution, which would lead to underestimating groundwater residence times (Cartwright et al., 2013). Within the context of carbon evolution in the RCEW-CZO, choosing a model for calculating 14C residence times requires careful consideration of the carbon system.
In this study, we trace carbon in groundwater in the deep CZ of the semi-arid silicate watershed of RCEW-CZO, southwestern Idaho, U.S.A., using hydrogeochemical and isotopic tracers. Geochemical parameters from 10 groundwater monitoring wells and 6 springs are integrated with our understanding of water and carbon evolution to interpret age tracers 3H and 14C in a layered fractured basalt aquifer of the deep critical zone. By combining multiple techniques, we distinguish open vs. closed carbon systems and determine groundwater residence times for our area. For RCEW-CZO, we seek to determine: (1) under which conditions does carbon evolution primarily occur, (2) how well mixed is the groundwater, and (3) how old is the groundwater. A companion paper by Schlegel et al. (in review) applies the groundwater ages established in this paper to estimate carbon sequestration rates in weathered silicates.
2 Geologic setting
The RCEW-CZO is a semi-arid basin in the Owyhee Mountain Range, bordering the western Snake River Plain in southwestern Idaho, U.S.A. (Figure 2). RCEW was established in 1960 to monitor and investigate the soil, vegetation, and water within the basin, and was extended in 2013 to be a CZO in collaboration with the Agricultural Research Service (ARS) to investigate the movement of carbon through the critical zone (Kormos et al., 2018; Seyfried et al., 2018).
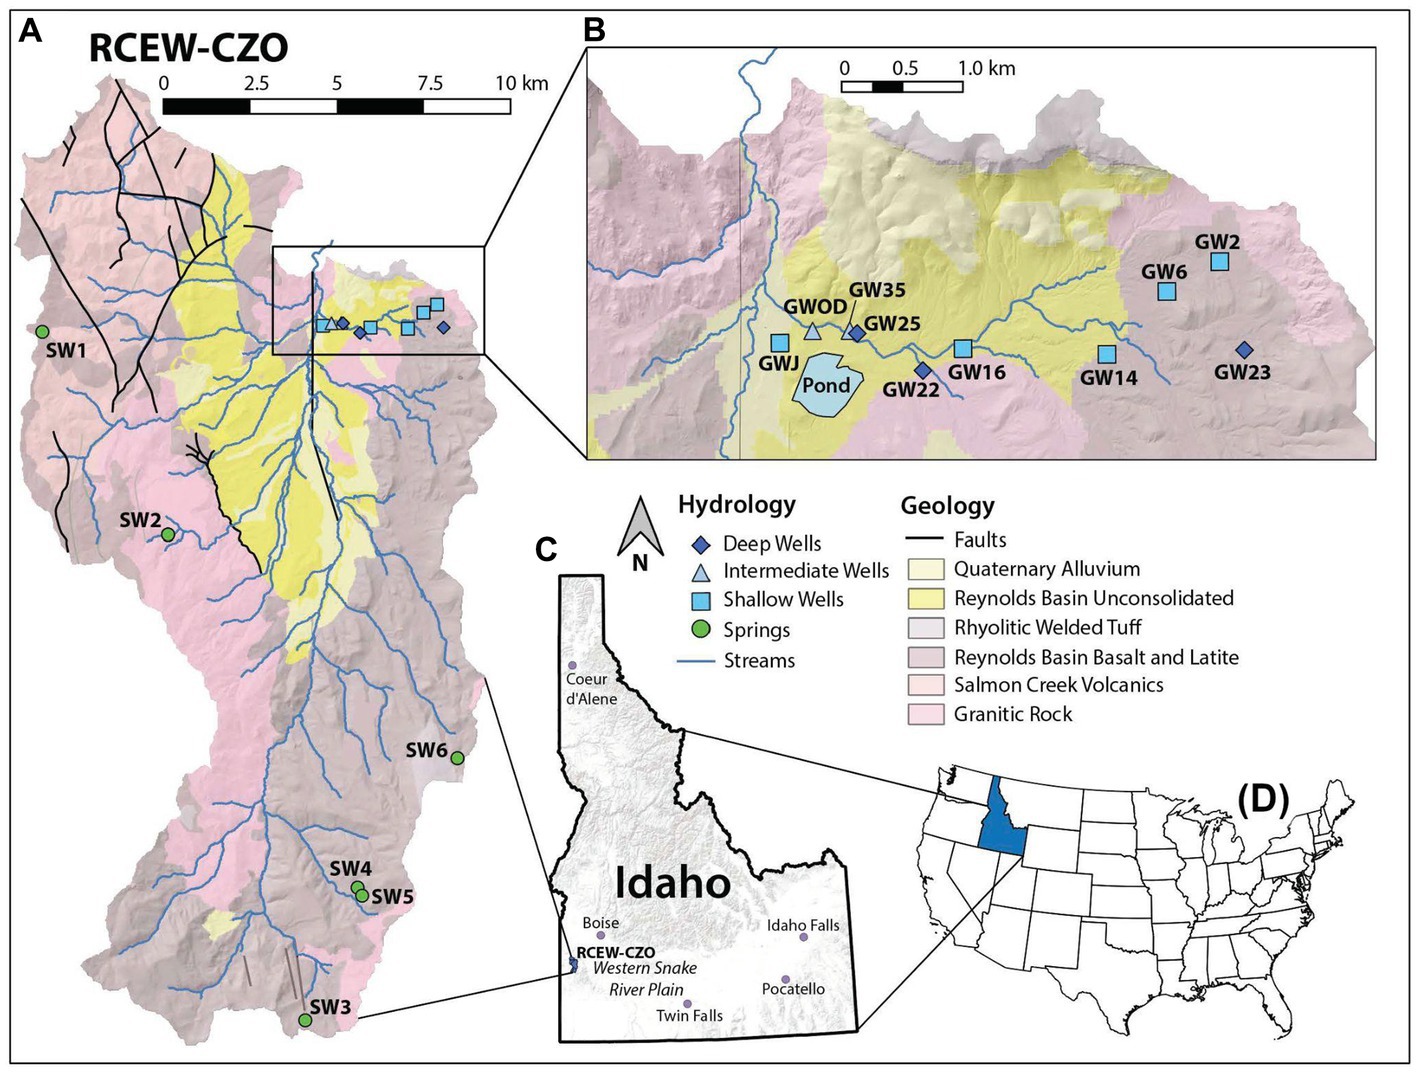
Figure 2. (A) Geologic map of RCEW-CZO with groundwater sample locations. (B) Inset map of well locations and irrigation pond, with relative depths detailed in §3.4. (C) Location of RCEW-CZO in the basin and range province, USA in southwestern Idaho, just south of the western Snake River Plain. (D) Location of Idaho in the USA. Sample groups are based on physical properties (Souza, 2022) as summarized in §3.4.
RCEW is a 238 km2 silicate watershed with an elevation range of 2,244 to 1,100 m, and has a range of climate conditions, spanning cold semi-arid and warm-summer mediterranean continental Köppen climate classifications.1 Based on 31 years (1 October 1983 to 30 September 2014) of data, mean monthly temperatures ranged from −2.3°C in December to 20.5°C in July, with a mean annual temperature of 7.8°C (Kormos et al., 2018). Mean annual precipitation is 462 mm, with a seasonal peak during the coldest months from November to April (Kormos et al., 2018). Precipitation extremes occurred in December and July, with mean monthly precipitation in December of >60 mm and in July of <10 mm (Kormos et al., 2018). Furthermore, precipitation varies strongly with elevation: in low-elevation catchments, mean annual precipitation is 200 mm whereas it increases to 1,140 mm in the high-elevation catchments (Kormos et al., 2018). Of this precipitation, snow accounted for approximately 31.7% at lower elevations (1,207 m) and approximately 67% at higher elevations (2093 m; Nayak et al., 2010).
The range of climate conditions, slope curvature and aspect, and water availability affects vegetation, leading to a general gradient of dominant vegetative types as described in Seyfried et al. (2009) and Radke et al. (2019). Intermittent stream corridors host willow (Salix spp.). On hillslopes, mixed sagebrush (Artemisia tridentata subsp. wyomingensis) and greasewood (Sarcobatus vermiculatus) dominate at lower elevations, with many grasses (C3 plants), and some cactus (CAM plants). At slightly higher elevations, vegetation shifts to low sagebrush (Artemisia arbuscula) and bitterbrush (Purshia tridentata). Mountain big sagebrush (Artemisia tridentata subsp. vaseyana) and aspen (Populus tremuloides) dominate at even higher elevations. At the highest elevations, we find subalpine fir (Abies lasiocarpa) and Douglas fir (Pseudotsuga menziesii).
RCEW is predominantly underlain by igneous rocks, with the granitic basement rock (i.e., Silver City batholith) emplaced during the Cretaceous, and unconformably overlain by Miocene age andesitic tuff (i.e., andesite of the upper Salmon Creek) and olivine-rich basalt flows of the Owyhee Mountains (McIntyre, 1972; Bonnichsen and Godchaux, 2006). The basalt flows, with phenocrysts composing <10% of the total mass, are predominantly clinopyroxene (augite) and plagioclase (anorthite and albite), with smaller amounts of olivine and magnetite, and secondary calcite in many basalt vesicles (McIntyre, 1972; field observation). The surface is sculpted by many Quaternary features, such as landslides and floodplain alluviums (McIntyre, 1972; Mahoney, 2022).
3 Methods
3.1 Sampling design overview
To investigate groundwater flow in a silicate watershed, we sampled 10 wells (Figure 2) and analyzed samples for dissolved inorganic carbon (DIC), stable isotopes of carbon in DIC (δ13CDIC) and age tracers (3H, 14C; Souza, 2022). We resampled and analyzed 6 cold (non-geothermal) springs previously sampled for chlorofluorocarbon (CFC) age dating (Warix et al., 2021; Souza, 2022) for additional geochemical parameters (including DIC, δ13CDIC, 3H, and 14C) to represent high-elevation groundwater that could potentially contribute to groundwater at lower elevations in the basin (Figure 2), with 926 m difference between highest spring and lowest well sampled. By combining multiple techniques, we can distinguish open vs. closed carbon systems and assess mixing to better constrain groundwater ages for our area.
3.2 Water sampling
To obtain samples representative of groundwater from the aquifer matrix, we adhered to the following protocol during our sampling of seven monitoring wells, one artesian well (GW 22), two domestic wells, and six springs in the summer and fall of 2019 and 2020 (Figure 2). We sampled at the source for the artesian well and all springs. For all remaining wells, we purged at least 3 pore volumes for monitoring wells and 1 pore volume for domestic wells (Eq. 1), and then sampled after field parameters (pH, temperature and electrical conductivity) stabilized. Both domestic wells are constantly used, and thus require less purging prior to sampling than the monitoring wells that are not used often. This protocol is supported by field observations that during purging, field parameters stabilized more quickly for the domestic wells than the monitoring wells. To calculate pore volumes, we used total depth of wells, which was obtained from direct measurements, original drill logs (for domestic wells), or caliper logs. Water levels for each well were measured prior to pumping using a Solinst (Georgetown, Ontario, Canada) flat taped water level meter.
On site, we measured field parameters (pH, temperature, and specific conductivity) with two sensors. Temperature and pH were measured with an Oakton (Vernon Hills, Illinois, US) Handheld pH and Temperature Meter (3-point calibration (4.01, 7.00, 10.00) for ±0.01 pH accuracy). Electrical conductivity was measured on a YSI (Yellow Springs, Ohio, US) Model Pro 30 Handheld Conductivity and Temperature Meter (calibrated with a 500 μS/cm solution for ±0.5% accuracy and converted to specific conductivity; U.S. Geological Survey, 2019). Daily calibrations were completed prior to purging and sampling. Following purging, field parameters were considered stabilized when 5 or more consecutive measurements over approximately a half hour occurred within the level of accuracy for their respective instruments.
After identification of sample locations for springs and the artesian well, and purging and stabilization of field parameters for wells, we collected samples. All sample bottles were pre-conditioned by leaching with MilliQ deionized water for 24 h, and then rinsed three times with sample water prior to being filled with no headspace and refrigerated. On site, unfiltered samples were collected into several 1 L amber high-density polyethylene (HDPE) Nalgene bottles, which were immediately chilled. Also on site, two 500 mL pre-conditioned clear HDPE bottles were used to collect sample for 3H analysis. Off site and within 24 h, unfiltered sample was filtered and preserved for additional analyses, and alkalinity was determined. A 0.22 μm Whatman Puradisc nylon syringe was used to filter sample into two 500 mL amber HDPE bottles with polyseal cone caps for δ13C and 14C analysis. A 0.45 μm Whatman Puradisc nylon syringe was used to filter sample into two 500 mL amber HDPE bottles for DIC analysis. Though originally planned, we did not obtain CFC or 3He data due to turbulent pumping that introduced modern air into the groundwater samples.
3.3 Environmental tracer analyses
To investigate carbon cycling in the deep critical zone and determine groundwater residence times, multiple environmental tracers were analyzed, including: alkalinity, DIC, δ13CDIC, 3H, and 14C. Alkalinity, an indication of the groundwater’s buffering capacity, was measured within 24 h of sampling on a Hanna Instruments (Woonsocket, Rhode Island, US) Total Alkalinity Mini Titrator, calibrated with Total Alkalinity Calibration standard (HI 84531–55), and the sample was titrated with Total Alkalinity Titrant (HI 85531–50), resulting in accuracy of ±1 mg/L.
DIC concentrations were measured at the Soil and Aqueous Biogeochemistry Research laboratory at Idaho State University using a Shimadzu Corporation (Kyoto, Japan), TOC-V CSH (error less than 2%). Additional DIC samples were analyzed the University of Arizona Laboratory for Emerging Contaminants using a Shimadzu Corporation (Kyoto, Japan) TOC-L. All samples were reported as mg/L with standard deviation.
Carbon isotope ratios (13CDIC) were measured using a Thermo Scientific (Bremen, Germany) GasBench system interfaced to a Delta V Plus IRMS at the Stable Isotope Facility at the University of Califonia, Davis. The 13C values were reported in ‰ relative to Vienna Pee Dee Belemnite (V-PDB), with a reported an accuracy of <± 0.1‰ for 13CDIC.
Tritium concentrations were analyzed by the Dissolved Gas Lab at the University of Utah and reported in tritium units (TU) with 1 sigma error. 14C was analyzed by the University of Arizona Accelerator Mass Spectrometry Laboratory and reported in percent modern carbon (pMC). The 14C values were calculated as a weighted average from multiple machine runs to reduce overall error, with detection limit <0.2 pMC.
Degassing of CO2 from groundwater as it comes into contact with the air during pumping and sampling can cause supersaturation with respect to calcite and a fractionation of δ13CDIC (e.g., Michaelis et al., 1985). However, this effect is expected to have minimal effect on our samples. Though care is taken to minimize any exposure to air, some exposure is inevitable, resulting in some degassing of CO2, which will decrease DIC, increase pH, and cause a small increase in the δ13CDIC. The degassing of CO2 is the rate-limiting step, with any subsequent reactions re-equilibrating quickly (Michaelis et al., 1985). In comparing the artesian well (GW 22) to wells that required pumping, we see that the artesian well is within ranges of DIC, pH and δ13CDIC for other wells, indicating that any CO2 degassing from pumping did not have a large effect on the carbon system (Table 1). Furthermore, sampling protocol for the springs and the wells are identical and follow common sampling practices, indicating that if any CO2 degassing from sampling occurred, it should have a similar effect on all samples in this study, comparable to unintentional CO2 degassing effects in other studies. The likely minimal effect of CO2 degassing during sampling from groundwater may cause correspondingly minimal changes in measured DIC concentrations, pH levels and δ13CDIC values.
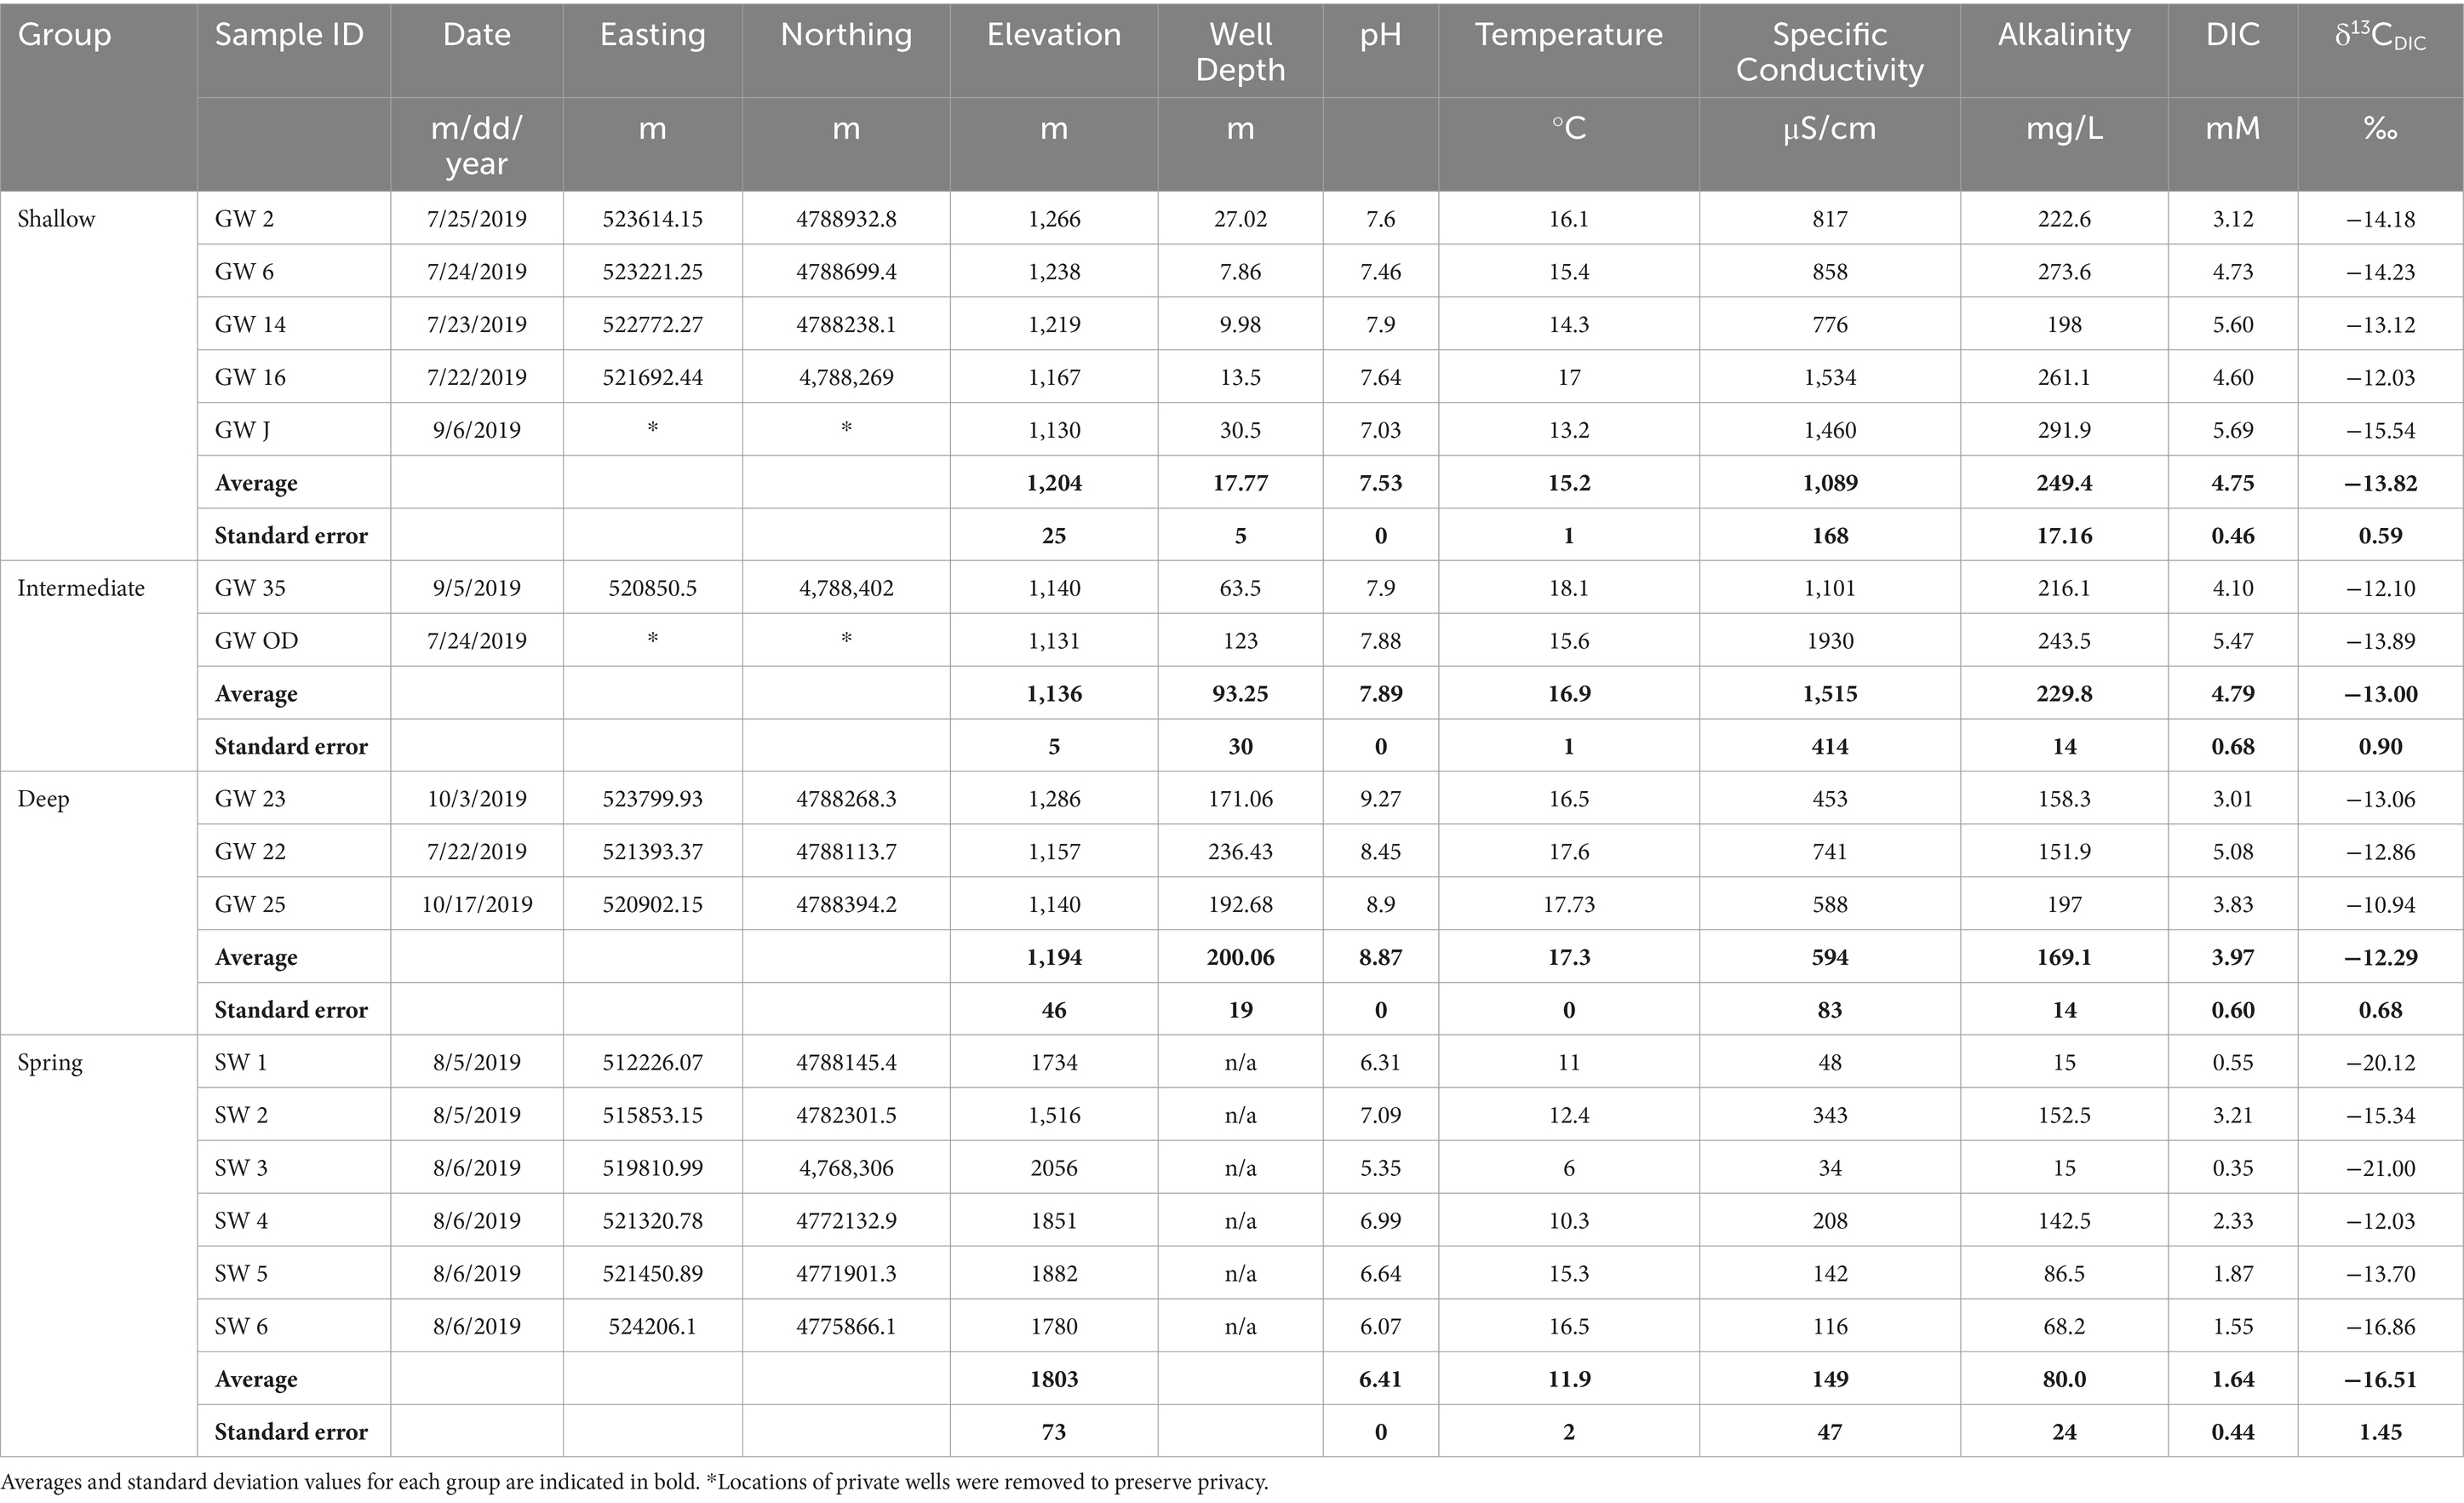
Table 1. Field and carbon parameters for shallow, intermediate, deep and spring groups.
3.4 Groundwater groups
To aid our conceptual understanding, we analyzed samples based on groundwater groups; shallow, intermediate, deep, and springs. These groups are based on sample type (springs (n = 6) vs. wells (n = 10)) as well as fracture layers intercepted by each well. As discussed in Souza (2022), at least 3 fracture layers were observed that increase with depth towards the basin center: the shallow layer and two deep layers. Wells that only access the shallow layer are in the shallow group [n = 5; 7.86–30.50 meters below ground surface (mbgs)]. Wells that only access the two deeper layers are in the deep group (n = 3; 171.06–236.43 mbgs). Wells that access both shallow and deep layers are in the intermediate group (n = 2; 63.50–123.00 mbgs).
3.5 Carbon system evolution modeling
To determine if carbon in our system evolved under primarily open or closed conditions, we calculated trend lines of dissolved inorganic carbon (DIC), pH and δ13CDIC using equations from Clark and Fritz (1997). For DIC trends from a pH of 5.6 to 8.4 at a temperature of 15°C, we used the following equations (Eq. 1):
For open systems, PCO2 was kept constant at 10−2, and for closed systems, PCO2 was initially at 10−2 and then decreased as it partitioned into the water as determined by KCO2. Calcite saturation was calculated, assuming complexes are negligible, from Eq. 2:
The evolution of δ13CDIC was calculated from enrichment factors at 15°C with −1.1‰ for CO2(g) to CO2(aq), 9.0‰ for CO2(g) to HCO3−, and 8.6‰ for CO2(g) to CO32−.
3.6 3H age tracer modeling
To determine ages of younger groundwater (approximately <100 yrs. BP), we used 3H concentrations, which we calculated using estimated initial 3H values. Determining ages based on 3H concentrations is convoluted and non-unique due to the spike in atmospheric 3H associated with atmospheric testing of nuclear weapons and subsequent decay, resulting in more than one plausible residence time for some 3H concentrations (Clark and Fritz, 1997; Michel et al., 2018). Additionally, inputs of 3H concentrations vary naturally in both time and space (Clark and Fritz, 1997; Michel et al., 2018). To account for spatial variation, Michel et al. (2018) used 3H measurements from 10 precipitation stations in the continental United States, as well as other data sets, to reconstruct 3H concentrations in precipitation from 1953 through 2012 at a grid of 2 degrees latitude by 5 degrees longitude for the continental United States. We relied on reconstructions based on the section 45-43o latitude, 120-115o longitude for RCEW-CZO. We also recognized that groundwater recharge occurs primarily between November and April (Kormos et al., 2018). To calculate the most likely 3H age (t3H) for each sample, we followed Michel et al. (2018) using Eqs 2, 3:
where 3H is the measured tritium unit (TU) value and 3H0 is the initial TU value of precipitation resulting in groundwater recharge. The 3H0 value used was 7.1 TU, determined from average November through April precipitation over the past 10 years, and is in the range of modern tritium values (5–10 TU) for continental regions (Clark and Fritz, 1997). Using 3H concentrations, we determined ages of younger groundwater via calculations using estimated initial 3H values.
3.7 14C age tracer modeling
To determine ages of older groundwater (approximately >1,000 yrs. BP), we used 14C values and multiple methods. The 14C ages (t14C) are calculated based on their known rate of decay from the estimated initial 14C (14C0) and measured 14C (14CDIC) using Eqs 2, 4 (e.g., Cartwright et al., 2013).
However, estimating the 14C0 value can be done using multiple methods.
By applying the Han-Plummer graphical method (Han et al., 2012; Han and Plummer, 2016) to compare DIC concentration, δ13CDIC, and 14C, we can interpret the evolution of each sample. Inputs needed for this method include: the δ13C of the CZ CO2 value, which was estimated as −21‰, the most negative value from our samples and coincident with the lowest pH and DIC values; and the carbonate solid value, which was estimated to be similar to calcite measured in the nearby western Snake River Plain (−6.65‰; Wood and Low, 1988). All viable 14C results, as determined by the Han-Plummer graphical method, were used to calculate 14C ages in NetpathXL (Parkhurst and Charlton, 2008) using the revised Fontes and Garnier method for solid exchange and gas exchange (Han and Plummer, 2013) for GW 25, and the Tamers method (1975), which assumes a simple 50–50 mixing (14C0 = 50 pMC) of solid carbonates and CZ CO2 for GW 35, GW OD and GW 22.
4 Results
Springs have lower mean temperature (11.92°C) than wells, which warm with depth (shallow 15.20°C, intermediate 16.85°C, and deep 17.28°C; Table 1). On average, springs have lower pH, DIC concentrations and δ13CDIC values (6.41, 1.64 mM, −16.51‰, respectively), compared to all groundwater groups (Table 1). Furthermore, there is a general increase in average pH and δ13CDIC values with well depth (pH: shallow 7.53, intermediate 7.89, and deep 8.87; δ13CDIC: shallow −13.82‰, intermediate −13.00‰, and deep −12.29‰; Table 1). In contrast, a decrease in average DIC concentration with well depth is observed, with similar concentrations for shallow and intermediate wells (4.75 mM and 4.79 mM, respectively) and lower concentrations for the deep wells (3.97 mM; Table 1). However, there is overlap in the ranges for all these parameters (Table 1).
Both age tracers generally decrease with depth. Average 3H values are highest in spring samples and decline with well depth (spring 3.43 TU, shallow 1.36 TU, intermediate 0.53 TU, and deep 0.08 TU (detection limit); Table 2). Similarly, average 14C values were also higher in spring and shallow well samples (84.59 pMC and 93.33 pMC, respectively) and decreased in the intermediate and deep samples (39.15 pMC and 36.5 pMC, respectively; Table 2). These results suggest an increase in groundwater age with increase in well depth; however, springs show a mix of younger and older age tracers.
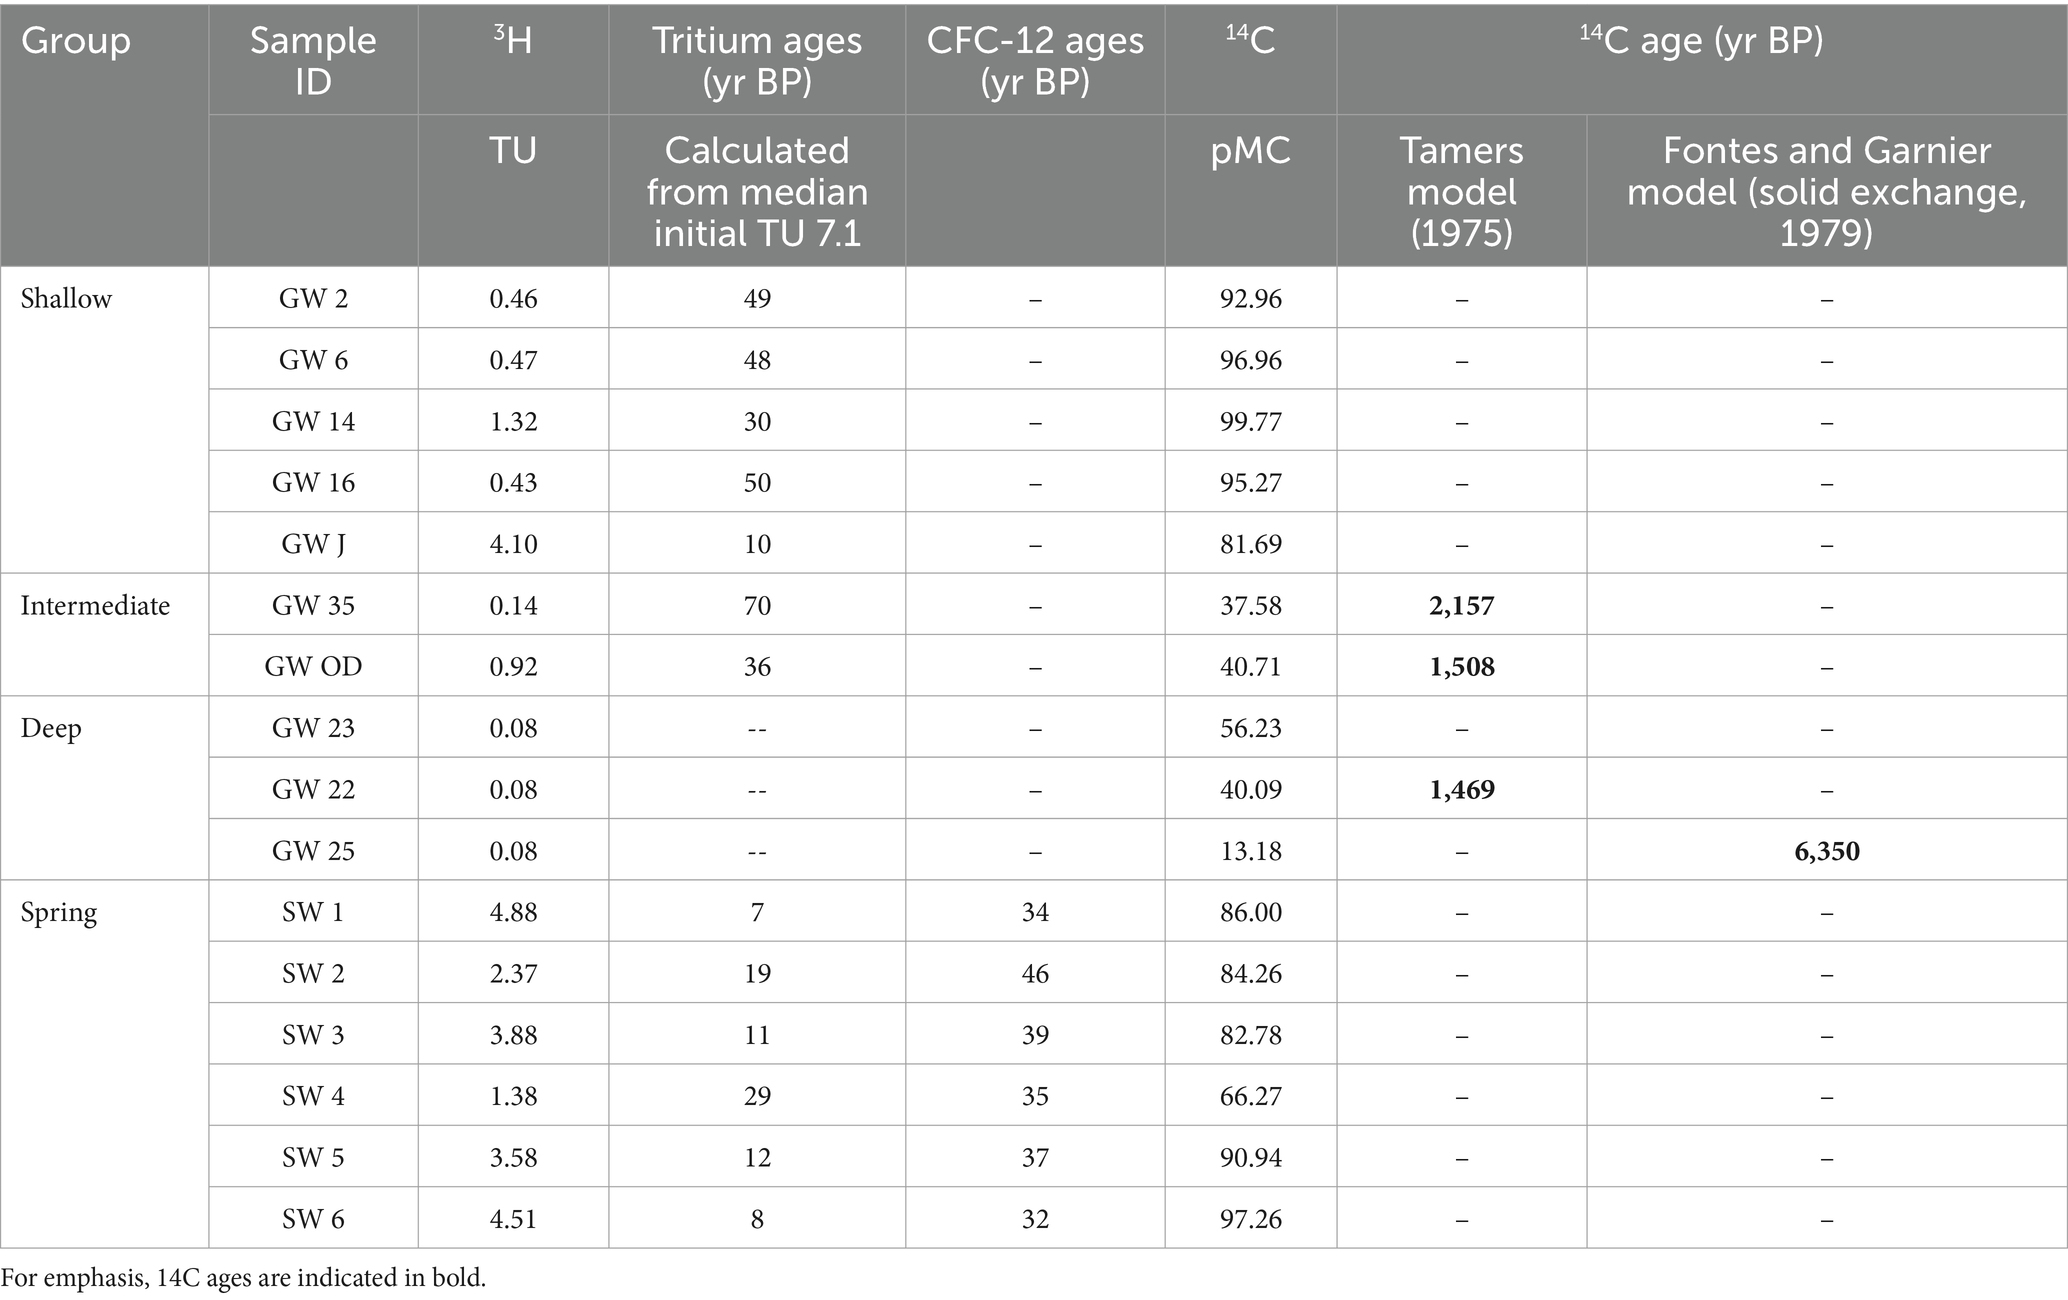
Table 2. Age tracer parameters and interpreted results in years Before Present (yrs BP) for shallow, intermediate, deep and spring groups.
5 Discussion
In addition to springs, physical analyses identified three groundwater groups in the Summit area of the RCEW-CZO. These different groups reveal differences in their degree of open vs. closed system evolution, which is important for interpreting groundwater ages. Our discussion begins by interpreting DIC concentrations and isotopes in the context of open and closed system evolution. We show that DIC concentrations and isotopic values initially undergo open system evolution, followed by closed system silicate weathering, which increase pH values beyond the carbonate system saturation line without increasing δ13CDIC values. We then discuss the possible mechanisms that can explain the variation in carbon evolution of δ13CDIC observed in the wells, including (1) secondary calcite dissolution, and (2) possible closed system calcite dissolution in one of the wells. Additionally, we discuss mixing of groundwater with different ages using 3H and 14C tracers, with evidence for mixing between young and old groundwater for many spring and one shallow samples. Finally, ages determined from 3H and 14C are also discussed considering the observations of system evolution.
5.1 Evolution of carbon in RCEW-CZO groundwater systems
5.1.1 Open-to-closed system carbon evolution
Differences between the springs and wells illustrate the open vs. closed system characteristics. In the springs, low pH, low DIC concentrations and depleted δ13CDIC values follow an open system curve in contrast to well samples that generally have higher DIC concentrations, pH values, and plot to the right of a carbonate system calcite saturation line, indicating continued silicate weathering (Figure 3; Clark and Fritz, 1997; Bottrell et al., 2019). Furthermore, the δ13CDIC values of the wells are generally similar to the δ13CDIC value at the calcite saturation line for carbonate systems along the open system curve (−13.2‰), indicating that continued silicate weathering occurred primarily under closed system conditions (e.g., Bottrell et al., 2019). This finding of silicate weathering increasing the pH of groundwater beyond the carbonate system calcite saturation line has been observed in other silicate systems, including basaltic aquifers in northeastern Brazil, silicic crystalline aquifers in Norway, and deep silicic sediment in southeastern Australia (Cartwright et al., 2013; Gastmans et al., 2016, 2017; Bottrell et al., 2019). CZ carbon combined with silicate weathering that reaches calcite saturation for a silicate system has the potential to precipitate calcite and sequester CO2, and is further discussed in Schlegel et al. (in review). In the next section, we expand on possible mechanisms that explain variation in carbon evolution and final δ13CDIC values across these groundwater groups.
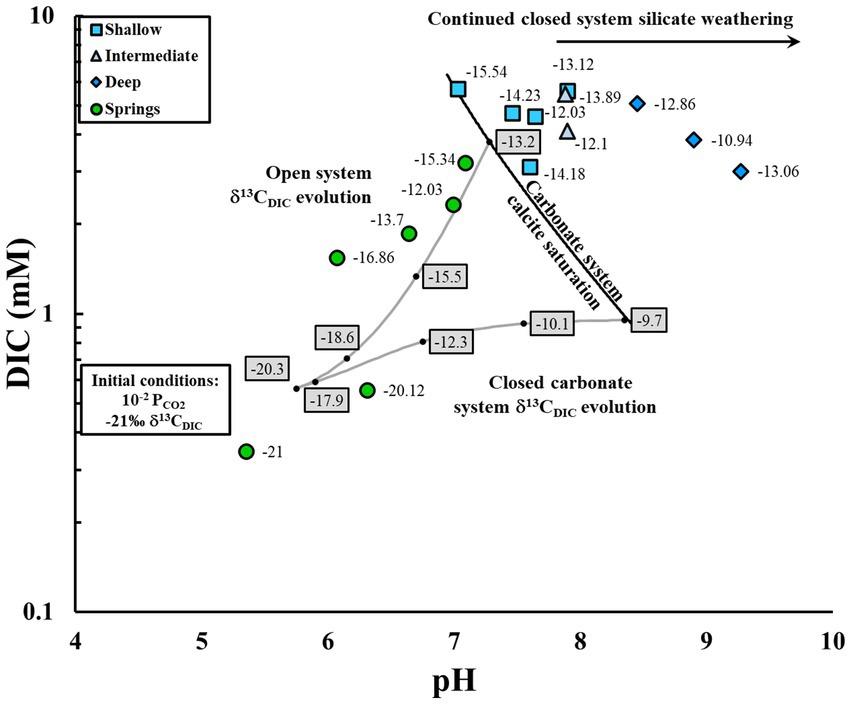
Figure 3. Evolution of dissolved inorganic carbon (DIC), pH and δ13CDIC for systems that are open and closed to critical zone (CZ) CO2 based on initial conditions appropriate for RCEW-CZO. Trend lines and calculated values of δ13CDIC are from chemical equilibrium and fractionation calculations of carbonate species as described in §3.5. Calculated values of δ13CDIC along open and closed system evolution are indicated in gray rectangles. RCEW-CZO groundwater samples exhibit a primarily open system and continued silicate weathering past carbonate system calcite saturation under closed system conditions. Sample labels are δ13CDIC values in per mil (‰).
5.1.2 Effect of secondary calcite dissolution on δ13CDIC
Secondary calcite dissolution may affect carbon evolution and final δ13CDIC values in some of the groundwater wells. Interaction between water and secondary calcite can further decrease the δ13CDIC value of groundwater. The model differentiating open and closed systems is based on the dissolution of marine carbonates (0‰ δ13CDIC). However, the δ13C of secondary carbonates measured in the western Snake River plain is −6.65‰ (Wood and Low, 1988). A secondary carbonate endmember will decrease the δ13CDIC, and the effect can be approximated by averaging the δ13C of the CZ CO2 (−21‰) and the dissolved carbonate (−6.65‰; Clark and Fritz, 1997), resulting in −13.8‰ δ13CDIC, which is comparable with the δ13CDIC range found in the RCEW-CZO wells (−15.54 to −10.94‰). Thus, the presence of secondary calcite could further decrease the δ13CDIC value of groundwater.
5.1.3 Possible closed system calcite dissolution
Closed system carbon evolution may explain the pathway for one deep groundwater sample, conditional upon higher CZ PCO2. More typical of moist tropical soils or deep vadose zone conditions, a high initial PCO2 could obtain high DIC concentrations under closed system conditions (Brook et al., 1983; Appelo and Postma, 2005; Richter and Billings, 2015; Keller, 2019). For example, closed system carbon evolution with an initial log PCO2 of 10–1.4 results in −10.0‰ δ13CDIC and 3.6 mM DIC at the calcite saturation line. These values are similar to our highest δ13CDIC value of −10.94 with 3.83 mM of DIC. This sample also has the lowest 14C value, hinting that if water from this sample evolved under closed system conditions, the partial pressure of CZ CO2 has significantly changed over the past 6,000 years (see §5.3.2). This suggests that carbon systems can change in conjunction with soil and climate fluctuations, and that care should be taken when interpreting carbon evolution over time. However, most of the system appears to have initially evolved under mostly open system conditions.
5.2 Extent of open systems and mixing of groundwater with different ages
Mixing between groundwater with different percentages of openness during calcite dissolution and between groundwater with different ages can be observed using δ13CDIC and 14C tracers, revealing that shallow samples are generally less mixed than spring samples. The role of mixing between open and apparent closed system carbonate dissolution is depicted in a graph of δ13CDIC versus 14C (Figure 4) and compared to open and closed system carbonate dissolution trends (Gillon et al., 2009). The open system carbonate dissolution trend is based on an initial pre-1950s 14C of soil CO2 of 95 pMC, which fits the highest 14C values in our system, and a δ13CDIC value calculated for our CZ CO2, and continues to incorporate modern 14C values from CZ CO2 as carbonate dissolution progresses. The closed system carbonate dissolution trend originates from our initial values, and continues to calcite saturation having incorporated approximately 50% of the carbon from mineral dissolution. At least four springs, one shallow sample and one deep sample reveal mixing between open and closed system carbonate dissolution, consistent with observed open and partially open systems in nearby subwatersheds of the RCEW-CZO for yearly recharge (Seyfried and Wilcox, 1995). Compared to spring samples, the comparatively tight clustering of most shallow samples at the open system saturation point indicates that generally shallow samples exhibit less mixing than spring samples.
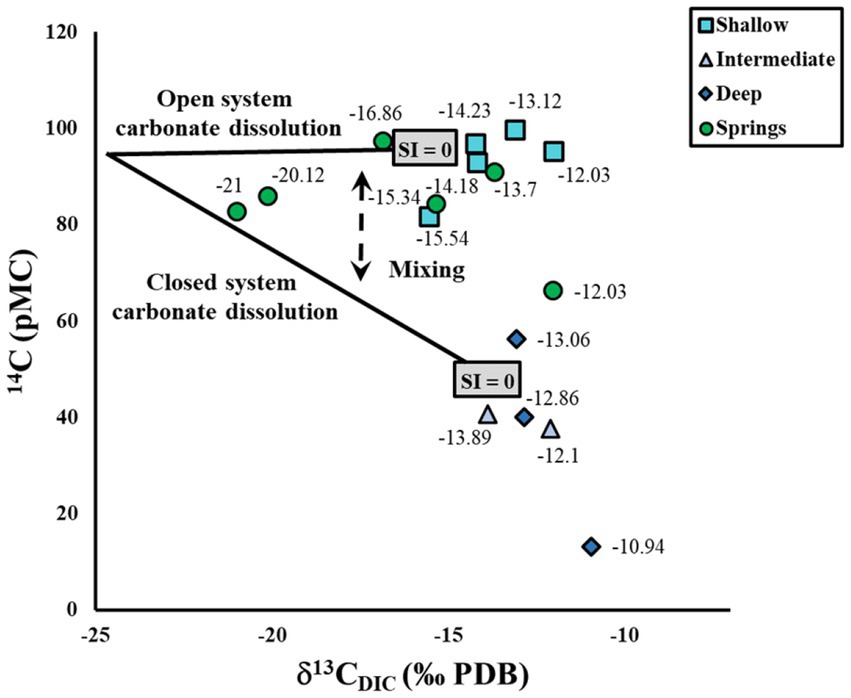
Figure 4. Stable isotope δ13C of dissolved inorganic carbon (DIC) and 14C values from RCEW-CZO groundwater with approximate open and closed system carbon evolution lines to calcite saturation from Gillon et al. (2009). Labels are δ13CDIC values in per mil (‰).
In contrast to shallow and spring samples, intermediate and deep samples have mixed and/or “aged” to the closed system carbonate dissolution line in Figure 4. Intermediate and deep samples near calcite saturation along the closed system trend may have initially followed the open system trend to calcite saturation and then aged and/or mixed with older water, plotting near the calcite saturation point along closed system carbonate dissolution. Support for initial open system calcite dissolution followed by mixing includes: (1) intermediate and most deep samples exhibit δ13CDIC values in agreement with open system processes in Figure 3, (2) intermediate samples have both young and old components of groundwater (low 14C values and detectable tritium); (3) intermediate and deep samples obtain water from two fracture layers (Souza, 2022). Support for an “aging” effect include: (1) the deep sample with the lowest 14C value also plots below the saturation point for the closed system carbonate dissolution line; and (2) the deep sample with the highest 14C value plots near, but above, the saturation point for the closed system carbonate dissolution line despite exhibiting open system δ13CDIC evolution in Figure 3. These scenarios indicate that initial open system processes have over time been affected by more closed system processes. As intermediate and deep samples have mixed and/or “aged” to the closed system carbonate dissolution line, we can assume at least partially closed system conditions for 14C age calculations.
5.3 Groundwater water ages
To determine the ages of groundwater, we applied two groundwater age tracers: 3H to focus on younger waters, and 14C, to focus on older groundwater. Here we compare findings from both tracers and discuss their alignment and implications.
5.3.1 Groundwater ages from 3H
Calculated 3H ages require an estimated initial 3H value. The initial pre-nuclear testing 3H value was estimated assuming that for the last 10 years, (1) most of the nuclear testing spike has decayed, and (2) the 5-year average of the wettest months (November through April) is appropriate for groundwater recharge (Kormos et al., 2018). Based on these assumptions, initial 3H estimates ranged from a minimum of 6.7 TU and a maximum of 7.4 TU, with a median of 7.1 TU. Using the median value, 3H ages for shallow samples are 10 yrs. BP in the shallow sample recharged by the irrigation pond, with other shallow samples ranging from 30 to 50 yrs. BP (Table 2). Use of minimum or maximum estimates of initial TU values result in ±1-year estimates.
Calculated 3H ages using estimated initial 3H values from pre-nuclear testing are not accurate for spring and intermediate samples. Spring CFC-12 ages, though poorly correlated with 3H data (r2 = 0.3) and possibly affected disparately by factors such as excess air and mixing, would correspond to 3H values that are elevated due to above-ground nuclear testing (32 to 46 yrs. BP; Table 2), suggesting that initial 3H values in spring samples may be elevated above background, precluding an accurate 3H age calculation. Intermediate samples mix groundwater from a shallow 3H-containing groundwater and a deeper groundwater without 3H, indicating that the 3H value may be diluted, also precluding an accurate 3H age calculation. For example, spring samples have young 3H ages, averaging 14 yrs. BP, clearly younger than CFC-12 ages, and the 3H ages of intermediate samples averaged 53 years, but also have 14C values viable for age calculations (see §5.3.2). The calculated 3H ages are most appropriate for shallow samples sourced from only the uppermost fracture layer rather than intermediate samples sourced from fracture layers that included the shallow and deeper layers with different ages or the spring samples that may have an elevated initial 3H value. Furthermore, the spring and intermediate samples fall between open and closed calcite dissolution, indicating that in our system an ambiguous 3H age correlates with mixing between open and closed system carbonate dissolution.
5.3.2 Groundwater ages from 14C
Obtaining 14C ages requires applying an understanding of the evolution of carbon parameters in the system of consideration. Recall that in our system, carbon recharge typically started under open conditions prior to reaching closed system conditions. One deep sample (−10.94‰ δ13CDIC) may have recharged under closed system conditions with a significantly higher partial pressure of CZ CO2. Furthermore, deep samples eventually enter closed system conditions and precipitate calcite, reducing the DIC (Schlegel et al., in review), suggesting that we may be able to estimate 14C age assuming closed conditions.
Assuming primarily closed system conditions, we found that intermediate and deep samples plotted in the 14C viable age section based on the Han et al. (2012) and Han and Plummer (2016) graphical method. The exception was one deep sample (δ13CDIC -13.06, GW23; Figure 5) for which a 14C age could not be calculated because it contained more than 50 pMC (Figure 5; Table 2). Of all the wells, this deep well (GW23) is located the closest to the watershed boundary (Figure 2) and has the highest elevation (1,286 m), indicating that even though no tritium was detected (<0.08 TU), the groundwater may be closer to the source of recharge as compared to the intermediate and deep wells located lower and further from the watershed boundary, and may therefore have younger water. The graphical method also provided fields for the most appropriate single sample-based model, which is the Tamers model (1975) for three samples and the revised Fontes and Garnier solid exchange model (Parkhurst and Charlton, 2008; Han and Plummer, 2013) for one sample located to the right of the viable Tamers age (Figure 5). The Tamers model (1975) accounts for bicarbonate dissolution of calcite, which dilutes the CZ carbon contribution by about 50%. In contrast, the Fontes and Garnier solid exchange model (Parkhurst and Charlton, 2008; Han and Plummer, 2013) determines the dilution of CZ CO2 from dissolution of carbonates using ion concentrations and further equilibrium exchange between water and carbonate minerals using δ13CDIC.
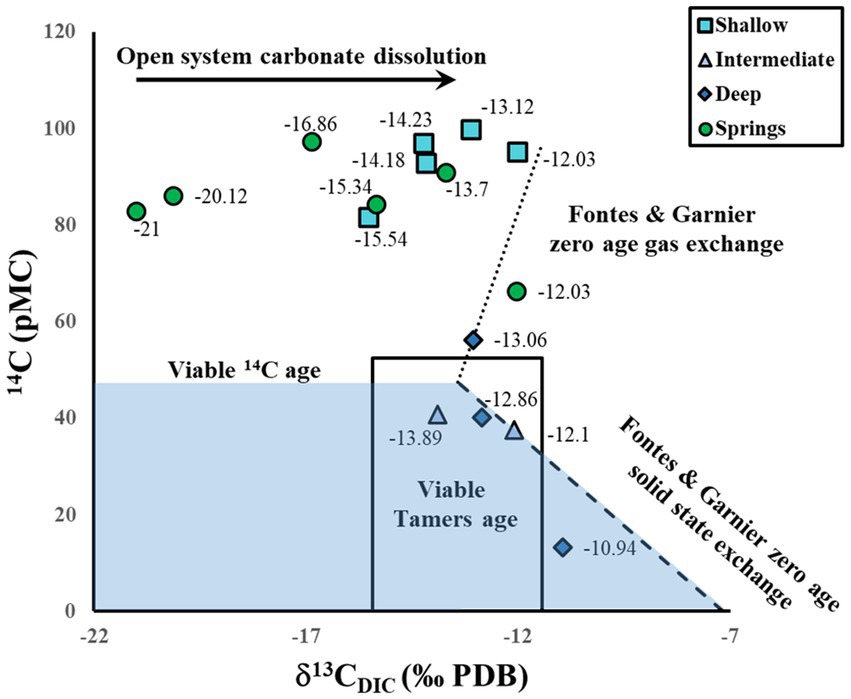
Figure 5. Stable isotope δ13C of dissolved inorganic carbon (DIC) and 14C values from RCEW-CZO groundwater with lines for determining appropriate 14C models from Han et al. (2012, 2016) calculated in NetpathXL (Parkhurst and Charlton, 2008). Blue shaded area indicates viable 14C age area, dotted line indicates zero age gas exchange, dashed line indicates zero age solid exchange, and solid line delineates the area where 50:50 exchange assumed with the Tamers model (1975) is appropriate. Labels are δ13CDIC values in per mil (‰) (Compare with Figure 4).
Calculated ages are presented in Table 2, showing that intermediate and deep samples are generally older than shallow and spring samples (except for well GW 23). Intermediate and one deep samples have ages that range from 1,469 to 2,157 yrs. BP; however, one deep well (GW 25) exhibits a much older age (6,350 yrs. BP), suggesting that GW 25 recharged primarily from deeper, older water. The older age found at GW 25 in conjunction with mixing of age tracers demonstrated in the intermediate wells suggests that the older portion of the groundwater in samples GW OD, GW 35, and GW 22 may be older than the calculated 14C ages for these samples. Groundwater with an old age has been observed elsewhere in and near the western Snake River Plain. For example, hot springs in the Idaho Batholith, a contemporary of the granite and granodiorite rock of the RCEW-CZO and located on the northern side of the western Snake River Plain, have 14C values as low as 6.60 pMC, and groundwater at depth in the western Snake River Plain has 14C values as low as 2.78 pMC (Schlegel, 2005; Schlegel et al., 2009). Geothermal water 4,000 to 10,000 years old has also been observed nearby in the Twin Falls region (Mariner et al., 1997).
The ages of groundwater imply that young shallow groundwater moves through the aquifer at much quicker rates than the deeper old groundwater, impacting the hydrogeochemistry, with relatively quick open system carbon evolution dominating younger shallow groundwater, and relatively slower closed system carbon evolution dominating older deeper groundwater. Though the interaction of water, carbon, and rock in the groundwater at depth is generally slower than in near surface groundwater, on geologic time scales, deep critical zone processes in silicate terrains can impact atmospheric CO2 by sequestering carbon.
Findings from this study indicate that groundwater acts as a long-term reservoir for carbon as it moves from the atmosphere to plants and soil, and then through vertical and lateral flow paths to groundwater and springs and streams at the RCEW-CZO. Using 4 eddy covariance towers, Flerchinger et al. (2020) showed that montane sagebrush ecosystems at the RCEW-CZO are large carbon sinks (~100–200 g/m2/yr. as net ecosystem production (NEP)), and that carbon uptake is largely determined by annual soil-water storage (Fellows et al., 2019, 2020; Flerchinger et al., 2020). Only in dry years are the lowest elevation sites neutral sources of carbon (1 g/m2/yr.; Flerchinger et al., 2020). Although storage of soil organic carbon (SOC) ranges from 5.4 at the lowest site to 17.6 kg/m2 at the highest and soil inorganic carbon (SIC) ranges from 13.1 kg/m2 at the lowest site to 0.0 at the highest two sites, these stores likely cannot explain the entire sink of carbon. To accumulate both SIC and SOC stores would only take between 71 and 243 years assuming average NEP estimates reported by Flerchinger et al. (2020). Movement of carbon as dissolved inorganic carbon to groundwater predominately through open system evolution as documented in this paper may be an explanation for the carbon sink observed at these sites.
6 Conclusion
Carbon from springs and wells is traced through the critical zone (CZ) from CZ CO2 into groundwater in fractured basalts of the semi-arid RCEW-CZO. We show that pH, DIC, and δ13CDIC values initially undergo open system evolution, followed by closed system silicate weathering, which increase pH values beyond the carbonate system saturation line without increasing δ13CDIC values. Findings from this study also reveal a possible exception: one sample (−10.94‰ δ13CDIC, 6,350 14C yrs. BP) may have evolved under closed system conditions. To obtain this condition, a higher partial pressure of CZ CO2 than present is required for this to occur. This suggests that carbon systems can change in conjunction with soil and climate fluctuations, and that care should be taken when interpreting carbon evolution over time. Mixing of groundwater with different ages may complicate the signature of open and closed carbon systems, as carbon moves deeper in the critical zone. In our study area, this mixing is more pronounced in springs and deeper groundwater samples (1,469 to 6,350 14C yrs. BP) as compared to younger shallow groundwater (10 to 50 3H yrs. BP). However, over time and at greater depths, carbon may become completely disconnected with the atmosphere and go through closed system carbon evolution. A companion paper (Schlegel et al., in review) applies these calculated ages to show closed system weathered basalt CO2 sequestration rates in the deep CZ of RCEW-CZO.
Data availability statement
The original contributions presented in the study are included in the article/supplementary material, further inquiries can be directed to the corresponding author.
Author contributions
MeS: Investigation, Methodology, Writing – original draft, Writing – review & editing. JS: Investigation, Methodology, Writing – original draft, Writing – review & editing. SW: Investigation, Methodology, Visualization, Writing – review & editing. EM: Investigation, Methodology, Writing – review & editing. SG: Funding acquisition, Investigation, Methodology, Project administration, Supervision, Writing – review & editing. MaS: Conceptualization, Funding acquisition, Investigation, Methodology, Writing – review & editing. ZC: Investigation, Methodology, Project administration, Writing – review & editing. KL: Conceptualization, Formal analysis, Funding acquisition, Investigation, Methodology, Resources, Supervision, Writing – review & editing, Project administration, Writing – original draft.
Funding
The author(s) declare that financial support was received for the research, authorship, and/or publication of this article. This study was conducted in collaboration and cooperation with the USDA Agricultural Research Service, Northwest Watershed Research Center, Boise, Idaho, and landowners within the Reynolds Creek Experimental Watershed and Critical Zone Observatory (RCEW-CZO). The Reynolds Creek Experimental Watershed is supported by the USDA Long-Term Agroecosystem Research (LTAR) network. Support for this research was provided by the U.S. National Science Foundation (NSF) via RCEW-CZO Cooperative agreement NSF EAR- 1331872 (Lohse, Seyfried), NSF CAREER 1653998 (Godsey), and ISU Internal Seed Grant (LIGS17).
Acknowledgments
We thank reviewers, whose comments have improved the manuscript.
Conflict of interest
The authors declare that the research was conducted in the absence of any commercial or financial relationships that could be construed as a potential conflict of interest.
Publisher’s note
All claims expressed in this article are solely those of the authors and do not necessarily represent those of their affiliated organizations, or those of the publisher, the editors and the reviewers. Any product that may be evaluated in this article, or claim that may be made by its manufacturer, is not guaranteed or endorsed by the publisher.
Footnotes
References
Appelo, C. A. J., and Postma, D. (2005). Geochemistry, groundwater and pollution. 2nd Edn. Leiden, The Netherlands: A.A. Balkema Publishers.
Bonnichsen, B., and Godchaux, M.M. (2006). Geologic map of the murphy 30 x 60 quadrangle, Ada, canyon, Elmore, and Owyhee counties, Idaho. Idaho geo. Surv. DWM-80 Available at: https://www.idahogeology.org/product/dwm-80
Bottrell, S., Hipkins, E. V., Lane, J. M., Zegos, R. A., Banks, D., and Frengstad, B. S. (2019). Carbon-13 in groundwater from English and Norwegian crystalline rock aquifers: a tool for deducing the origin of alkalinity? Sustain. Water Resour. Manag. 5, 267–287. doi: 10.1007/s40899-017-0203-7
Brook, G. A., Folkoff, M. E., and Box, E. O. (1983). A world model of soil carbon dioxide. Earth Surf. Process. Landf. 8, 79–88. doi: 10.1002/esp.3290080108
Cartwright, I., Fifield, L. K., and Morgenstern, U. (2013). Using 3H and 14C to constrain the degree of closed-system dissolution of calcite in groundwater. Appl. Geochem. 32, 118–128. doi: 10.1016/j.apgeochem.2012.10.023
Clark, I. D., and Fritz, P. (1997). Environmental isotopes in hydrogeology. 2nd Edn. New York: Lewis Publishers.
Deines, P., Langmuir, D., and Harmon, R. (1974). Stable carbon isotope ratios and the existence of a gas phase in the evolution of carbonate waters. Geochim. Cosmochim. Acta 38, 1147–1164. doi: 10.1016/0016-7037(74)90010-6
Fellows, A. W., Flerchinger, G. N., Seyfried, M. S., Biederman, J. A., and Lohse, K. A. (2020). Winter CO2 efflux from sagebrush shrublands distributed across the rain-to-snow transition zone. J. Geophys. Res. Biogeosci. 125:e2019JG005325. doi: 10.1029/2019JG005325
Fellows, A. W., Flerchinger, G. N., Seyfried, M. S., Lohse, K. A., and Patton, N. R. (2019). Controls on gross production in an aspen–sagebrush vegetation mosaic. Ecohydrology 12:e2046. doi: 10.1002/eco.2046
Flerchinger, G. N., Fellows, A. W., Seyfried, M. S., Clark, P. E., and Lohse, K. A. (2020). Water and carbon fluxes along an elevational gradient in a sagebrush ecosystem. Ecosystems 23, 246–263. doi: 10.1007/s10021-019-00400-x
Fontes, J. C., and Garnier, J. M. (1979). Determination of the initial 14C activity of the total dissolved carbon: a review of the existing models and a new approach. Water Resour. Res. 15, 399–413. doi: 10.1029/WR015i002p00399
Gastmans, D., Hutcheon, I., Menegário, A. A., and Chang, H. K. (2016). Geochemical evolution of groundwater in a basaltic aquifer based on chemical and stable isotopic data: case study from the northeastern portion of Serra Geral aquifer, São Paulo state (Brazil). J. Hydrol. 535, 598–611. doi: 10.1016/j.jhydrol.2016.02.016
Gastmans, D., Menegário, A., and Hutcheon, I. (2017). Stable isotopes, carbon-14 and hydrochemical composition from a basaltic aquifer in São Paulo state, Brazil. Environ. Earth Sci. 76:150. doi: 10.1007/s12665-017-6468-1
Gillon, M., Barbecot, F., Gibert, E., Corcho Alvarado, J. A., Marlin, C., and Massault, M. (2009). Open to closed system transition traced through the TDIC isotopic signature at the aquifer recharge stage, implications for groundwater 14C dating. Geochim. Cosmochim. Acta 73, 6488–6501. doi: 10.1016/j.gca.2009.07.032
Han, L. F., and Plummer, L. N. (2013). Revision of Fontes & Garnier's model for the initial 14C content of dissolved inorganic carbon used in groundwater dating. Chem. Geol. 351, 105–114. doi: 10.1016/j.chemgeo.2013.05.011
Han, L. F., and Plummer, L. N. (2016). A review of single-sample-based models and other approaches for radiocarbon dating of dissolved inorganic carbon in groundwater. Earth-Sci. Rev. 152, 119–142. doi: 10.1016/j.earscirev.2015.11.004
Han, L. F., Plummer, L. N., and Aggarwal, P. (2012). A graphical method to evaluate predominant geochemical processes occurring in groundwater systems for radiocarbon dating. Chem. Geol. 318-319, 88–112. doi: 10.1016/j.chemgeo.2012.05.004
Ingerson, R., and Pearson, F. J. (1964). “Estimation of the age and rate of motion of groundwater by the 14C method” in Recent research in the field of hydrosphere, atmosphere, and nuclear geochemistry. eds. Y. Miyake and T. Koyama (Tokyo: Marusen), 263–283.
Keller, C. K. (2019). Carbon exports from terrestrial ecosystems: A critical-zone framework. Ecosystems 22, 1691–1705. doi: 10.1007/s10021-019-00375-9
Kormos, P. R., Marks, D. G., Seyfried, M. S., Havens, S. C., Hedrick, A., Lohse, K. A., et al. (2018). 31 years of hourly spatially distributed air temperature, humidity, and precipitation amount and phase from Reynolds critical zone observatory. Earth Syst. Sci. Data 10, 1197–1205. doi: 10.5194/essd-10-1197-2018
Langmuir, D. (1971). The geochemistry of some carbonate ground waters in Central Pennsylvania. Geochim. Cosmochim. Acta 35, 1023–1045. doi: 10.1016/0016-7037(71)90019-6
Mahoney, L. (2022). Topographic evolution and surficial geology of Reynold Creek critical zone observatory, Southwest Idaho. [Master’s Thesis]: Idaho State University Available at: https://etd.iri.isu.edu/ViewSpecimen.aspx?ID=2040
Mariner, R. H., Young, H. W., Bullen, T. D., and Janik, C. J. (1997). Sulfate-water isotope geothermometry and lead isotope data for regional geothermal system in the twin falls area, south-Central Idaho. Geotherm. Resour. Counc. Transact. 21. Available at: https://pubs.er.usgs.gov/publication/70019251
McIntyre, D. H. (1972). Cenozoic geology of the Reynolds Creek experimental watershed, Owyhee County, Idaho. Idaho Bur. Mines Geol. :151. Available at: https://www.idahogeology.org/product/P-151
Michaelis, J., Usdowski, E., and Menschel, G. (1985). Partitioning of 13C and 12C on the degassing of CO2 and the precipitation of calcite-Rayleigh-type fractionation and a kinetic model. Am. J. Sci. 285, 318–327. doi: 10.2475/ajs.285.4.318
Michel, R. L., Jurgens, B. C., and Young, M. B. (2018). Tritium deposition in precipitation in the United States, 1953–2012: U.S. Geological Survey Scientific Investigations Report. 11, 2018–5086.
National Research Council (2001). Basic research opportunities in earth science. Washington, DC: The National Academies Press.
Nayak, A., Marks, D., Chandler, D. G., and Seyfried, M. (2010). Long-term snow, climate, and streamflow trends at theReynolds creek experimental watershed, Owyhee Mountains, Idaho, United States. Water Resour. Res. 46:W06519. doi: 10.1029/2008WR007525
Parkhurst, D. L., and Charlton, S. R. (2008). NetpathXL—an excel® Interface to the program NETPATH. USGS Tech. Methods. Available at: https://pubs.usgs.gov/tm/06A26/pdf/TM6-A26.pdf
Radke, A. G., Godsey, S. E., Lohse, K. A., McCorkle, E. P., Perdrial, J., Seyfried, M. S., et al. (2019). Spatiotemporal heterogeneity of water flowpaths controls dissolved organic carbon sourcing in a snow-dominated, headwater catchment. Front. Ecol. Evol. 7:46. doi: 10.3389/fevo.2019.00046
Richter, D. D., and Billings, S. A. (2015). ‘One physical system’: Tansley’s ecosystem as Earth’s critical zone. New Phytol. 206, 900–912. doi: 10.1111/nph.13338
Schlegel, M. E. (2005). Evaluation of paleo-climate for the Boise area, Idaho, from the last glacial maximum to the present based on δ2H and δ18O groundwater composition [Master’s thesis: Brigham Young University https://scholarsarchive.byu.edu/cgi/viewcontent.cgi?article=1316&context=etd.
Schlegel, M. E., Mayo, A. L., Nelson, S., Tingey, D., Henderson, R., and Eggett, D. (2009). Paleo-climate of the Boise area, Idaho from the last glacial maximum to the present based on groundwater δ2H and δ18O compositions. Quat. Res. 71, 172–180. doi: 10.1016/j.yqres.2008.09.008
Schlegel, M. E., Souza, J., Murray, E., Carr, B., Warix, S. R., Godsey, S. E., et al. (in review). Schlegel, M. E., Souza, J., Murray, E., Carr, B., Warix, S. R., Godsey, S. E., et al. (in review). Estimated in-situ carbon sequestration rates in a weathered silicate basin, southwestern Idaho, U.S.A. Chemical Geology.
Seyfried, M. S., Grant, L. E., Marks, D., Winstral, A., and McNamara, J. P. (2009). Simulated soil water storage effects on streamflow generation in a mountainous snowmelt environment, Idaho, USA. Hydrol. Process 23, 858–873. doi: 10.1002/hyp.7211
Seyfried, M. S., Lohse, K., Marks, D., Flerchinger, G., Pierson, F., and Holbrook, W. S. (2018). Reynolds Creek experimental watershed and critical zone observatory. Vadose Zone J. 17, 1–20. doi: 10.2136/vzj2018.07.0129
Seyfried, M. S., and Wilcox, P. B. (1995). Scale and the nature of spatial variability: field examples having implications for hydrologic modeling. Water Resour. Res. 31, 173–184. doi: 10.1029/94WR02025
Souza, J. L. (2022). Evolution of carbon and water through the subsurface of a semi-arid basin: A geochemical and geophysical approach [Master’s Thesis]: Idaho State University https://www.proquest.com/openview/58d7d9fe46ce91c461cc99e962f006a6/1?pq-origsite=gscholar&cbl=18750&diss=y.
Tamers, M. A. (1975). The validity of radiocarbon dates on groundwater. Geophys. Surv. 2, 217–239. doi: 10.1007/BF01447909
U.S. Geological Survey (2019). Geological Survey Techniques and Methods, book 9, chap. A6.3, 15 p. doi: 10.3133/tm9A6.3
Vogel, J. C., Grootes, P. M., and Mook, W. G. (1970). Isotope fractionation between gaseous and dissolved carbon dioxide. Z. Phys. 230, 225–238. doi: 10.1007/BF01394688
Warix, S. R., Godsey, S. E., Lohse, K. A., and Hale, R. L. (2021). Influence of groundwater and topography on stream drying in semi-arid headwater streams. Hydrol. Process. 35:e14185. doi: 10.1002/hyp.14185
Wood, W. W., and Low, W. H. (1988). Solute geochemistry of the Snake River plain regional aquifer system, Idaho and Eastern Oregon, US Government Printing Office. Available at: https://pubs.usgs.gov/pp/1408d/report.pdf
Keywords: critical zone carbon evolution, groundwater ages, dissolved inorganic carbon, open system evolution, closed system evolution, tritium, radiocarbon 14C
Citation: Schlegel M, Souza J, Warix SR, Murray EM, Godsey SE, Seyfried MS, Cram Z and Lohse KA (2024) Carbon evolution and mixing effects on groundwater age calculations in fractured basalt, southwestern Idaho, U.S.A. Front. Water. 6:1388465. doi: 10.3389/frwa.2024.1388465
Edited by:
Lin Ma, The University of Texas at El Paso, United StatesReviewed by:
Gregory Todd Carling, Brigham Young University, United StatesLouis Derry, Cornell University, United States
Copyright © 2024 Schlegel, Souza, Warix, Murray, Godsey, Seyfried, Cram and Lohse. This is an open-access article distributed under the terms of the Creative Commons Attribution License (CC BY). The use, distribution or reproduction in other forums is permitted, provided the original author(s) and the copyright owner(s) are credited and that the original publication in this journal is cited, in accordance with accepted academic practice. No use, distribution or reproduction is permitted which does not comply with these terms.
*Correspondence: Melissa Schlegel, c2NobG1lbGlAaXN1LmVkdQ==