 Barra Faisal Bokhari
 Bassam Tawabini
 Husam Musa Baalousha
- Department of Geosciences, College of Petroleum Engineering and Geosciences, King Fahd University of Petroleum and Minerals, Dhahran, Saudi Arabia
The Kingdom of Saudi Arabia is undergoing massive and rapid urbanization as part of Vision 2030. This includes development projects along Saudi Arabia’s coastline across the Red Sea. Coastal areas, especially the ones along Saudi’s western regions are susceptible to natural disasters such as flooding. NEOM, a futuristic city currently being developed in the northwest of Saudi Arabia, exemplifies a potential flooding hazard due to its geographic location and proposed urbanization plans. This research aims to enhance flood hazard assessment in NEOM by applying the Fuzzy Analytical Hierarchy Process (FAHP) in combination with Geographic Information System (GIS). Acknowledging traditional limitations related to data availability and parameter selection consensus, the study carefully selects parameters such as drainage density, elevation, slope, rainfall, land use/land cover (LULC), soil type, normalized difference vegetation index (NDVI), and topographic wetness index (TWI). The 30 m DEM was used to derive Drainage Density, Slope, and TWI while LULC data helped assess land cover changes. Rainfall data and soil type information are integrated to evaluate their impact on flood susceptibility. NDVI is employed to analyze vegetation cover. Utilizing ArcGIS Pro’s weighted overlay model, the criteria were combined to generate the final flood susceptibility map. The research outcomes manifest in a flood susceptibility map categorizing areas into seven distinct susceptibility classes, ranging from ‘very low’ to ‘very high.’ A quantitative breakdown in a summary table provides insights into the proportional distribution of flood risk. Results indicate a significant portion of NEOM falls within varying degrees of moderate susceptibility range with relatively limited distribution of flood susceptibility on the extremes, equating to areas with ‘low to moderate’ susceptibility is 4,322.8 km2, areas with ‘moderate’ susceptibility is 5,109.69 km2, areas with ‘moderate to high’ is 4,081.39 km2. The flood susceptibility map developed in this study can shed insights on potential optimum areas for flood mitigation measures (i.e., optimum locations for establishing stormwater collection points).
1 Introduction
The rapid urbanization under the Kingdom’s Vision 2023 will see many developments along Saudi Arabia’s coastal areas. These areas, along the western coast of Saudi Arabia, are highly vulnerable to natural disasters such as flooding (Youssef et al., 2016). Therefore, an accurate flood hazard assessment is paramount for ensuring the safety of the proposed developments. NEOM, a futuristic city intended to drive the future of urban planning poses a prime example of a city prone to potential flooding as a consequence of its geographical location and ambitious development plans. This research paper aims to provide an enhanced flood susceptibility assessment by utilizing advanced geospatial techniques. Moreover, this study endeavors to provide a better understanding of flood susceptibility and potential impacts in the hopes of supporting urban planning of NEOM that is disaster-prepared.
The significance of flood hazard assessments cannot be overstated. With NEOM being strategically placed and its expectation to accommodate a high population, it is expected to become a global tourism and economic hub that will support the kingdom’s efforts in diversifying the economy. This entails a massive urbanization undertaking. Urbanization, which will trigger changes in Landuse and Landcover (LULC), is a prime culprit in changing the hydrologic processes as it increases runoff as well as peak water discharge (Sanyal et al., 2014; Apollonio et al., 2016; Khosravi et al., 2016; Zope et al., 2016; Yousuf Gazi et al., 2019; Tellman et al., 2021; Hagos et al., 2022). Coupled with climate change, which is leading to variable changes in weather/climate trends as floods are expected to vary in terms of magnitude and frequency (Cheng et al., 2007; Parry, 2007; Arnell and Gosling, 2016; Abdulalim and El Damaty, 2022), necessitates the development of accurate flood susceptibility maps.
The development of accurate and up-to-date flood maps is not an easy endeavor (Lin and Billa, 2021). This is generally attributed to three main factors. First, the varying nature of flood hazards is a consequence of climate, land use, and developing flood-control projects (Parvaiz et al., 2011; Kusler, 2016). Second, the availability of data and their accurate reflection of up-to-date disaster management practices (Tomaszewski et al., 2015). Finally, a lack of consensus on the selection of parameters for flood susceptibility studies (Alam et al., 2021). There are currently four existing methods to research flood susceptibility which are: (a) hydrological modeling, (b) machine learning models, (c) qualitative models, and (d) quantitative models. Hydrological models, such as SWAT (Soil and Water Assessment Tool) or HEC-RAS (Hydrological Engineering Centre – River Analysis System), are simple nonlinear models that are generally less effective when attempting to integrate complex features (Shafapour Tehrany et al., 2019). Elsebaie et al. (2023) developed both an AHP-GIS model as well as a 100-year return period scenario model using HEC-RAS for Wadi Al-Lith basin in Saudi Arabia and showed that both models produced comparable results. Machine learning integrates artificial intelligence but is generally very complex, requires high computational performance, and involves a relatively extended processing time making it less practical (Maier and Dandy, 2000; Ghalkhani et al., 2013). Al-Areeq et al. (2024) examined various Deep Neural Networks (DNN) algorithms for flash-flood prediction in Jeddah, Saudi Arabia, and have listed, in order, the various models that showed the highest accuracy. Qualitative strategies are able to solve complex decision-making problems, but they generally rely on expert knowledge in the required field exposing them to potential biases (Shafapour Tehrany et al., 2019). The incorporation of AHP, a tool widely utilized for flood susceptibility mapping, is heavily reliant on expert judgment for prioritizing criteria associated with flooding. For example, Dano (2022) used AHP to develop a flood susceptibility map for Dammam, Saudi Arabia, and pointed out that the qualitative nature of AHP can tend to lead to biases. Finally, Quantitative approaches encompass numerical representations of the connections between influencing factors and the incidence of disasters (Ayalew and Yamagishi, 2005). For example, Theilen-Willige and Wenzel (2019) utilized a technique that combines GIS and frequency ratio method to assess the natural hazards assessment along western Saudi Arabia and determined that it is most susceptible to floods.
Traditional flood susceptibility mapping methods have been limited by the availability of data (Alharbi, 2023). DEM and LULC, for example, are important for generating accurate flood susceptibility maps. DEMs provide information on the study area’s topography. Topography, namely slope, is a major factor in floods as areas with steeper slopes tend to be at higher risk of flooding than those with gentle ones. Therefore, a high-resolution DEM is ideal. It should be noted that higher resolution does not necessarily guarantee higher accuracy, particularly in areas with dense vegetation (Xafoulis et al., 2023). The study by Xafoulis et al. (2023) compared several DEM resolutions, namely 5 m, 2 m, and 0.5 m DEM, and noticed that despite various over-and-underestimations, the DEM resolution of 5 m managed to capture the true geometry of the site’s cross-section while supposedly being at a lower resolution than a DEM of 2 m. On the other hand, LULC provides information on the type of land cover of the study area. Most land use activities involve the conversion of the natural landscape, whether it be deforestation or simply converting large, vegetated expanses to areas suitable for human use. Impermeable surfaces such as roads, make a higher contribution to floods than areas overlain with vegetation. Land use changes have been deemed a prime cause of severe flood events (Owrangi et al., 2014) and deemed by some as potentially having irreversible effects (DeFries et al., 2004).
Pallard et al. (2009) investigated the link between drainage density and floods. The authors highlighted that drainage density controls flood peaks directly and indirectly. Control over stream network length and hillslope routes is a major direct effect. Drainage density impacts concentration time and peak flow magnitude in river networks due to higher flow velocity. Increasing drainage density increases flood peaks. Longer concentration times allow more water infiltration. Thus, decreasing drainage density reduces flood volumes. Drainage density as a geological measure has indirect impacts. Impervious rocky hillslopes limit drainage density, storage volumes, and flood peaks. Karstic regions, highly worn bedrock, and/or highly permeable fluvial deposits in valley floors may also cause low drainage density due to huge storage volumes and reaction times and modest flood peaks and volumes. Landform evolution, soil formation, erosion, and floods (driven by climate and regulated by geology) may also indirectly control. Large floods may modify catchments over generations by increasing topographic gradients, drainage density, and storage volumes, which may raise flood peaks and volumes. Finally, drainage density’s relationship with vegetation cover can provide indirect management in semiarid environments. Due to soil erosion, bare soils have high drainage density and runoff output, resulting in huge flood peaks and volumes.
Another key parameter affecting floods is precipitation. Ghoneim and Foody (2013) investigated flash floods in arid mountainous regions. The aim of the research was to determine the impact of rainfall depth, areal coverage and the locations of flash floods. They found that the study basin’s hydrological response to rainfall is determined by its inherent geomorphometry and land cover types. Furthermore, the basin’s response exhibits a high degree of sensitivity to the depth, size, and spatial distribution of the downpour. It should also be noted that surface run-off over extended periods of times (i.e., centuries) changes the morphology of basins and ultimately affects the drainage density which, in turns has an effect on the sites vulnerability to flooding (Pallard et al., 2009).
In this context, the Analytical Hierarchy Process (AHP), can be a very useful tool. First proposed by Saaty (1988), AHP has been widely utilized in the field of flood hazard mapping and risk assessment due to its ability to handle complex multi-criteria decision-making. Researchers have applied AHP to systematically evaluate and prioritize various factors that contribute to flood hazards, such as terrain characteristics, land use, climate data, and more. One of its most notable strengths is that it can be used to handle poor-quality data (Chen et al., 2014). AHP achieves this by assigning relative weights to these factors, enabling a comprehensive assessment of flood susceptibility, and providing valuable insights for flood management and mitigation strategies (Dodgson et al., 2009). This allows for AHP to be effective in handling both qualitative and quantitative datasets (Vinod Kumar and Ganesh, 1996). While AHP has been praised for this ability, it is often criticized for not being able to handle uncertainties (Büyüközkan et al., 2011). As a result, research has evolved to incorporate the Fuzzy Analytical Hierarchy Process (FAHP) to better enhance the generated weights from AHP with the aim of expanding the use, so it is not only limited to crisp values but also accounts for vague ones (Kerkez et al., 2017; Baalousha et al., 2023). Through fuzzification, this modified approach can convert crisp values into vague ones by employing a fuzzy judgment matrix, incorporating fuzzy numbers, to generate definitive weights through both consistent and inconsistent fuzzy comparison matrices (Baalousha et al., 2023). Another utilization of Fuzzy theory is to employ fuzzy logic. Fuzzy logic was first proposed Zadeh (1965) and involves the usage of partial truths instead of definitive values. This method allows for converting a definitive value ranging from 0 to 1, to a variant in-between them to represent the partial truths. A previous study by Baalousha et al. (2023) compared Fuzzy logic and FAHP, for flood exposure in arid regions, and found that Fuzzy logic is generally more conservative, especially in the high-risk zones, and that ultimately FAHP was likely more accurate.
The study area was investigated in three previous studies. The first by Abdulalim and El Damaty (2022) divided NEOM into eight (8) basins and utilized AHP to generate a flood risk map per stream for each basin through a morphometric analysis. For the assessment, the authors used the topographic wetness index, elevation, slope, stream power index, topographic roughness index, normalized difference vegetation index, sediment transport index, stream order, flow accumulation, and geological formation as the assessment criteria and have ultimately generated only flood-hazard maps for streams within Wadi Surr and Wadi Zhawi. The second study was done by Alharbi (2023) and utilized a weighted overall function in GIS software to map groundwater, flood, and drought zones. For this study, the author used drainage density, precipitation, elevation, slope, and soil type as the assessment criteria and divided NEOM into only four hazard classes ranging from Very Low to High with the majority of the study area falling under moderate risk. The third and latest study was undertaken by Bashir and Alsalman (2023) where they employed a morphometric analysis and followed the Approach set out by El-Shamy in order to determine Flash-flood vulnerability in NEOM and concluded that severe flash-flooding events in NEOM are highly improbable. It can be noted that two of the aforementioned studies relied largely on morphometric analysis, with only one incorporating environmental factors, namely precipitation and Soil Type. Our aim is to optimize and distill the relevant criteria in order to include relevant morphometric and environmental parameters for our assessment.
With the scarcity of data, namely in-situ data, the present investigation seeks to enhance the precision of the flood susceptibility map for NEOM. This is achieved by employing remote sensing techniques and integrating the Fuzzy Analytic Hierarchy Process (FAHP) with spatial modeling in ArcGIS Pro using open-sourced data to refine the analysis by allowing the assessment to account for uncertain or vague values within the data. The main starting point will be the development of adjusted assessment criteria based on the three prior studies to include eight criteria that combine morphometric and environmental factors affecting flooding. The ultimate goal is to deliver a more nuanced flood susceptibility map by utilizing and dividing the study area into seven categories of susceptibility, as opposed to the conventional four or five, which would maximize the potential of the final map to capture the wide diversity of the topographic and geomorphological features of the study area in an effort to avoid potential over or under-estimations. This refined map is intended to serve as a valuable tool for guiding master planning and facilitating decision-making for both present and future developments in NEOM.
2 Materials and methods
2.1 Study area
The study area for this research encompasses the entire NEOM region (Figure 1), a futuristic city currently being developed along the western coast of Saudi Arabia. NEOM spans from Tabuk, toward the east, to the Red Sea, west, and runs along the Red Sea coastline from Duba to Haql, Saudi Arabia. It includes a diverse range of geological units, from sand dunes to mountains thus making it susceptible to flood hazards since mountain basins generally respond rapidly to intense rainfall as a result of large slopes (Xafoulis et al., 2023) whereas precipitation is variable both spatially and temporally (Rotunno and Houze, 2007). It is worth noting that although Saudi Arabia’s annual precipitation generally occurs in Winter and Spring, the annual precipitation in NEOM ranges from 51 mm to 150 mm per annum (Alharbi, 2023). Running along the coastline also exposes NEOM to sea-level rise which is generally attributed to climate change (Arkema et al., 2013). NEOM varies in elevation from around 5 m above mean sea level (asl) along the coastline to around 2,518 m along the mountains and covers a total area of 26,500 km2 (Alharbi, 2023). It is strategically situated near Egypt and Jordan meaning that most people around the world will be able to reach NEOM on an average 8-h flight.
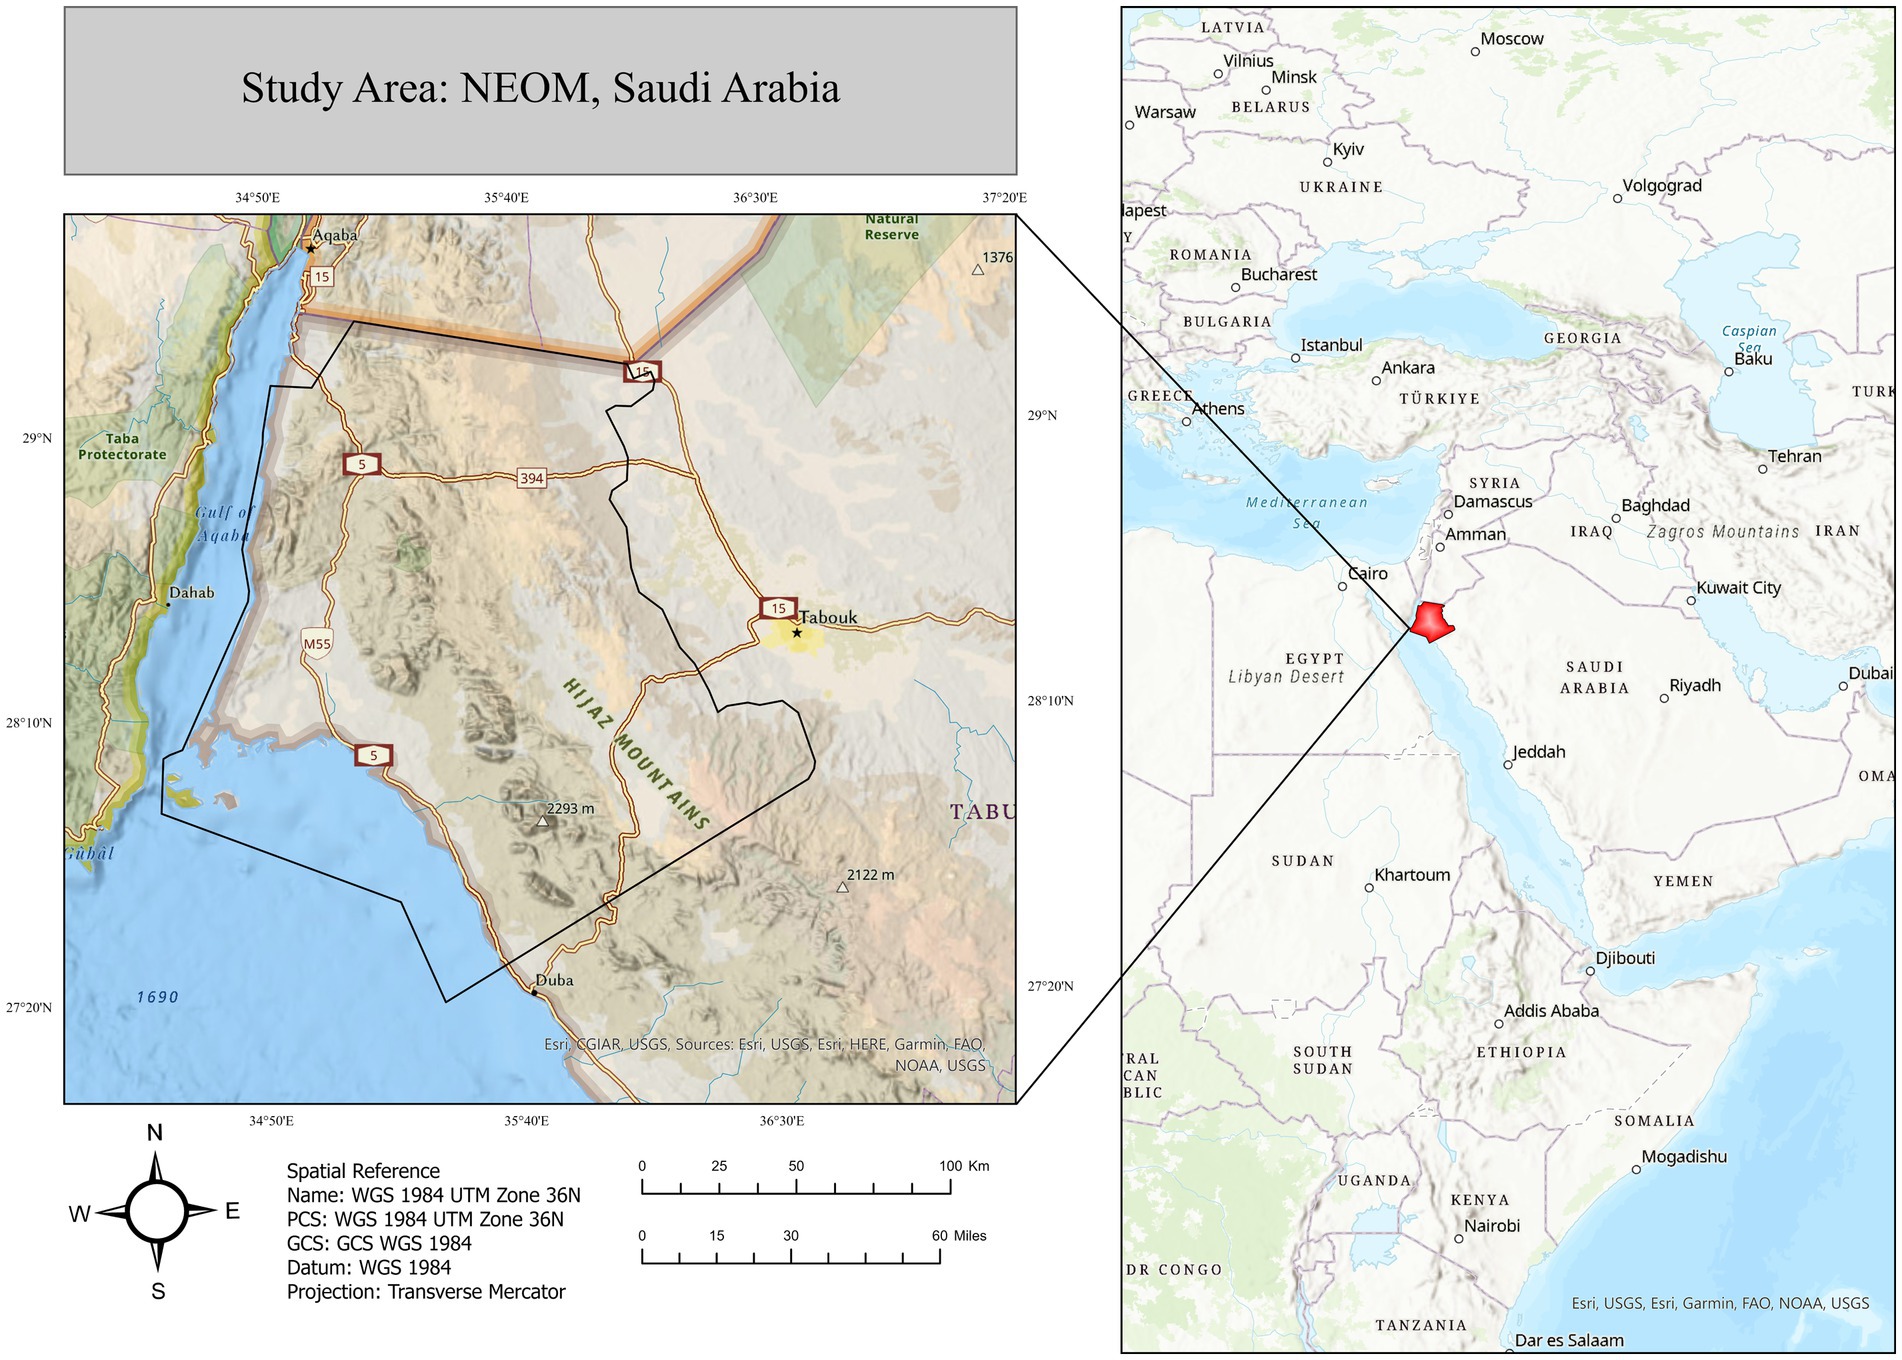
Figure 1. Study area.
2.2 Input data
Employing remote sensing methods for generating flood hazard maps is generally considered an effective tool for generating flood hazard maps, especially in remote areas (Althuwaynee et al., 2014). As highlighted earlier, the assessment criteria were selected by optimizing the criteria set out in the previous three studies developed for NEOM, namely the studies by Abdulalim and El Damaty (2022), Alharbi (2023), and Bashir and Alsalman (2023). The final assessment criteria selected were Drainage Density, Elevation, Slope, TWI, LULC, Rainfall, Soil type and NDVI.
DEM of 30 m resolution, obtained from Shuttle Radar Topography Mission (SRTM), was first used to create Slope, Drainage Density, and TWI. LULC map, obtained from ESRI’s Sentinel 2 Global Landcover maps, was used in this study. A soil map was generated from the Food and Agriculture Organization (FAO). Rainfall data was obtained from the Climate Hazards Group Infrared Precipitation with Stations (CHIRPS). Finally, NDVI was derived from Landsat Satellite to assess vegetation cover.
2.2.1 Drainage density
Drainage density is a term used to describe the drainage lengths to the area of a Basin and is influenced by permeability, erosion capacity, vegetation, slope, and time (Subraelu et al., 2023). The density of drainage systems directly impacts flooding, as an increase in drainage density corresponds to a rise in peak discharge (Yang et al., 2022). In arid regions, higher drainage density values exhibit a significant negative correlation with the likelihood of floods in the region. This is attributed to the increased capacity for surface runoff associated with a denser stream network. Conversely, lower drainage density values are indicative of increased vulnerability to flash floods (Subraelu et al., 2023). Drainage density is calculated using (Equation 1).
Where ‘D’ is the drainage density, ‘L’ is the channel’s length and ‘A’ is the water area.
2.2.2 Slope
The quantity of water infiltrated into the soil is directly affected by the slope of the study area (Ouma and Tateishi, 2014). The lower the infiltration, the higher the surface flow and ultimately the size of the flood since slope describes the steepness of the study area, it is therefore deemed an important parameter to consider when developing a flood assessment (Khosravi et al., 2016; Wondium, 2016; Das, 2019; Hagos et al., 2022). The slope map was created using the spatial analysis tool in ArcGIS 10.8.2 and a DEM resolution of 5 m.
2.2.3 Elevation
DEM is a numerical depiction of the height or elevation of a terrain from a reference datum devoid of any vegetation or manmade features and is widely used for urban planning as it provides a digital representation of elevation, where each pixel provides a distinct elevation value (Croneborg et al., 2020). Water hydrology is dependent on the flow direction which is created from digital elevation models (Tarboton, 1997; Yousuf Gazi et al., 2019). For this study, a DEM of 30 m resolution, obtained from SRTM was used. The DEM was subsequently used to develop the TWI, Slope, and Drainage Density maps using ArcGIS Pro. Elevation is a prime factor when investigating floods since areas with higher elevations are generally at lower risk of flooding than those with lowered ones (Das, 2018, 2019; Shen et al., 2021).
2.2.4 Rainfall
Rainfall is considered a major contributor to floods (Paul et al., 2019; Yousuf Gazi et al., 2019; Hagos et al., 2022), especially in arid regions where the majority of floods are flash floods. In this study, CHIRPS precipitation data was used to generate rainfall maps.
2.2.5 Topographic wetness index
TWI’s contribution to flood hazard mapping is given by its ability to describe the accumulation trends (Pourali et al., 2016). It is directly related to flood vulnerability (Chapi et al., 2017). TWI provides an indication of flood vulnerability as the areas with a high TWI are more vulnerable to flooding as opposed to those with lower ones (Paul et al., 2019). In this study, TWI was calculated using DEM in ArcGIS’s Raster calculator tool via the following formula (Equation 2):
Where ‘AS’ is the upstream contributing area, and the slope gradient is denoted by ‘β’.
2.2.6 Land use/land cover
Urbanization leads to massive changes in LULC. These changes have a significant effect on basin drainage (Zope et al., 2016; Hagos et al., 2022; Ziwei et al., 2023). They also contribute to wider system changes such as surface flow and infiltration rates, since replacing soil, for concrete or asphalt for example, reduces the overall land infiltration (De Roo et al., 2003; Kazakis et al., 2015; Khosravi et al., 2016; Yousuf Gazi et al., 2019; Hagos et al., 2022; Riazi et al., 2023) hence it is an essential factor to consider for flood hazard assessments (Khosravi et al., 2016; Das, 2019). The LULC map was generated using ESRI’s Sentinel 2 Global Landcover maps.
2.2.7 Soil type
In addition to TWI and LULC, soil types also shed light on soil infiltration. Different soil types have different textures and hence different infiltration capacities (Hartemink and Bockheim, 2013; Kazakis et al., 2015). For example, clay has a much lower infiltration rate than sandy soils, hence, it also tends to support investigating hydraulic conductivities since soil pores are directly correlated to texture (Ward and Robinson, 1990). The soil type map was generated using information obtained from the FAO.
2.2.8 Normalized difference vegetation index
The presence of vegetation, or lack thereof, greatly impacts floods. Vegetation tends to reduce water flow rate as well as increase infiltration (Wondium, 2016; Zhao et al., 2019). As such, converting vegetation cover into barren areas, with much lower infiltration rates, can have a negative impact in terms of flood risk (Vaghefi et al., 2019; Yousuf Gazi et al., 2019). Where NDVI comes in is that it provides both the presence of vegetation cover along with its vigor (Parsian et al., 2021). NDVI values range from −1 to +1 (Khosravi et al., 2016; Riazi et al., 2023) where the positive NDVI values represent active vegetation covers while negative values refer to water bodies (Wang et al., 2020; Ziwei et al., 2023). NDVI was generated from Landsat 8 satellite imagery and calculated using the following formula (Equation 3):
Where ‘NIR’ denotes near-infrared light while ‘Red’ is the near-visible light.
2.3 Methodology
2.3.1 Analytical hierarchy process
AHP is a multi-criteria decision-making tool, first proposed by Saaty (1988). This tool allows for the organization of multiple criteria into hierarchal form and ultimately deciding on the relative importance of each criterion (Saaty, 1977, 1988). This method has been extensively used to solve complex problems by assigning weights to each criterion to allow for suitable decision-making (Dodgson et al., 2009) which makes it especially useful in Flood hazard mapping (Darwish, 2023). In this study AHP played a pivotal role in computing the weightings of all the input parameters essential for flood susceptibility mapping. The tool developed by Goepel (2013) was utilized for creating a pairwise comparison matrix. To normalize the pairwise comparison matrix, each element was divided by the sum of its column. Following that, the value of each row was average and calculated as the final value of the corresponding parameter using the tool developed.
The Consistency Ratio (CR) was computed using (Equation 4) to ensure that the degree of consistency is acceptable. CR values greater than 10% should be reconsidered whereas the ones below 10% are generally considered acceptable (Parsian et al., 2021). This approach allowed for a comprehensive assessment of the input parameters’ relative importance, contributing to the accuracy and reliability of the flood hazard mapping process.
Where ‘CI’ is the Inconsistency Index and ‘RI’ is the Random Inconsistency.
2.3.2 Fuzzy analytic hierarchy process
The Analytical Hierarchy Process (AHP), on its own, only tends to account for crisp values which is ultimately a function of preference and human judgment (Cikmaz et al., 2023). Therefore, Fuzzification is introduced to bridge that gap and allows for the consideration of vague ones. This is achieved by combining fuzzy logic and AHP. In fuzzy logic, linguistic variables and represented by triangular numbers (Kilincci and Onal, 2011). Table 1 presents the Saaty scale and its corresponding Fuzzy Triangular scale. The process for FAHP was adopted from the procedure lain-out by (Jovčić et al., 2019).
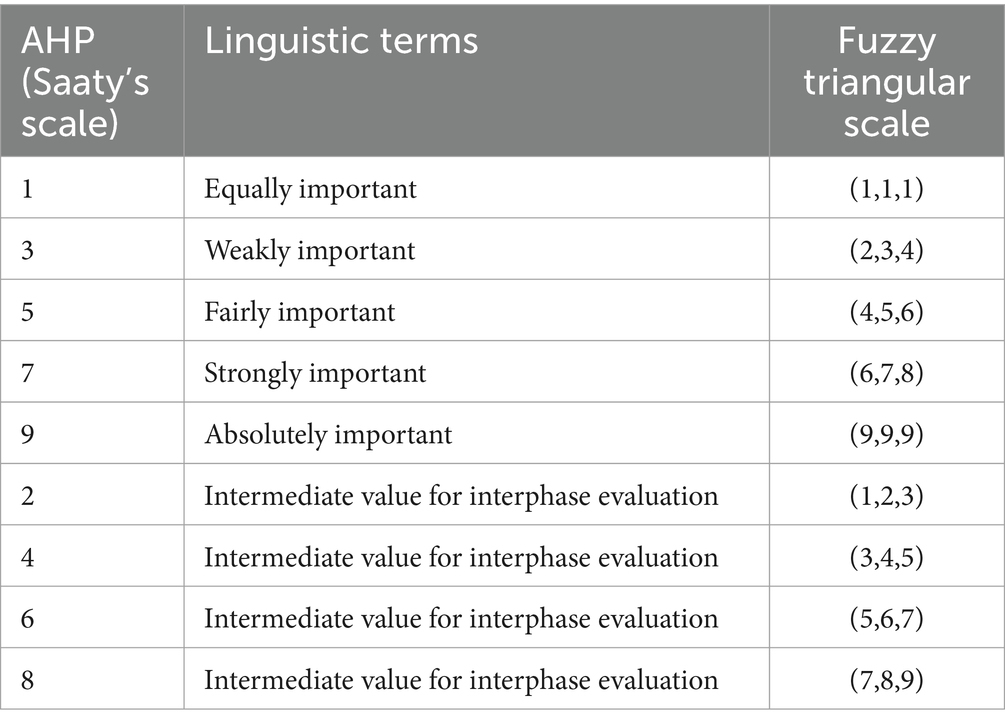
Table 1. Triangular fuzzy-AHP scale from Jovčić et al. (2019).
Following the conversion of the standard AHP matrix, the geometric mean of the fuzzy values is calculated using (Equation 5).
Where ti represents the geometric mean of fuzzy values, ij represents the preference of the i-th criterion over the j-th criterion and Z represents the specific decision maker (the authors in this instant).
After that, the Fuzzy weight of each criterion is calculated using (Equation 6).
Where i represent criterion i. This is applied for criteria i,j,….n.
Defuzzification is then undertaken to convert Wi to non-fuzzy weights.
Where Mi is the non-fuzzy number and Wia, Wib and Wic represent the obtained fuzzy weights for criterion i.
The final step is normalizing the non-fuzzy numbers for each criterion. This is achieved using (Equation 8)
Where Ni represents the final normalized weight of each criterion.
2.3.3 Flood susceptibility mapping
The spatial criteria were classified in ArcGIS based on their relative contribution to flooding. The results from the FAHP were then integrated into a weighted overlay model in ArcGIS Pro where they were scaled from 1 to 100. The produced map was then classified into seven categories, using the natural breaks method, demonstrating varying degrees of flood susceptibility. Table 2 provides a summary of the data sources used while Figure 2 provides a simplified diagram summarizing the methodology employed in the study.
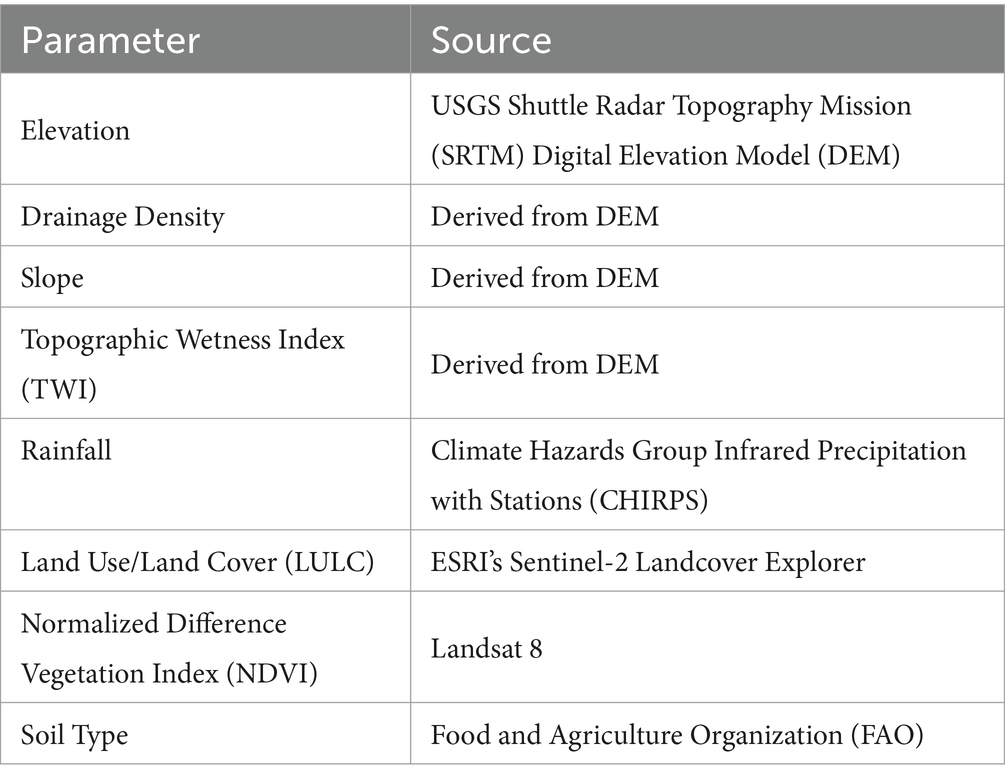
Table 2. Summary of input data and their sources.
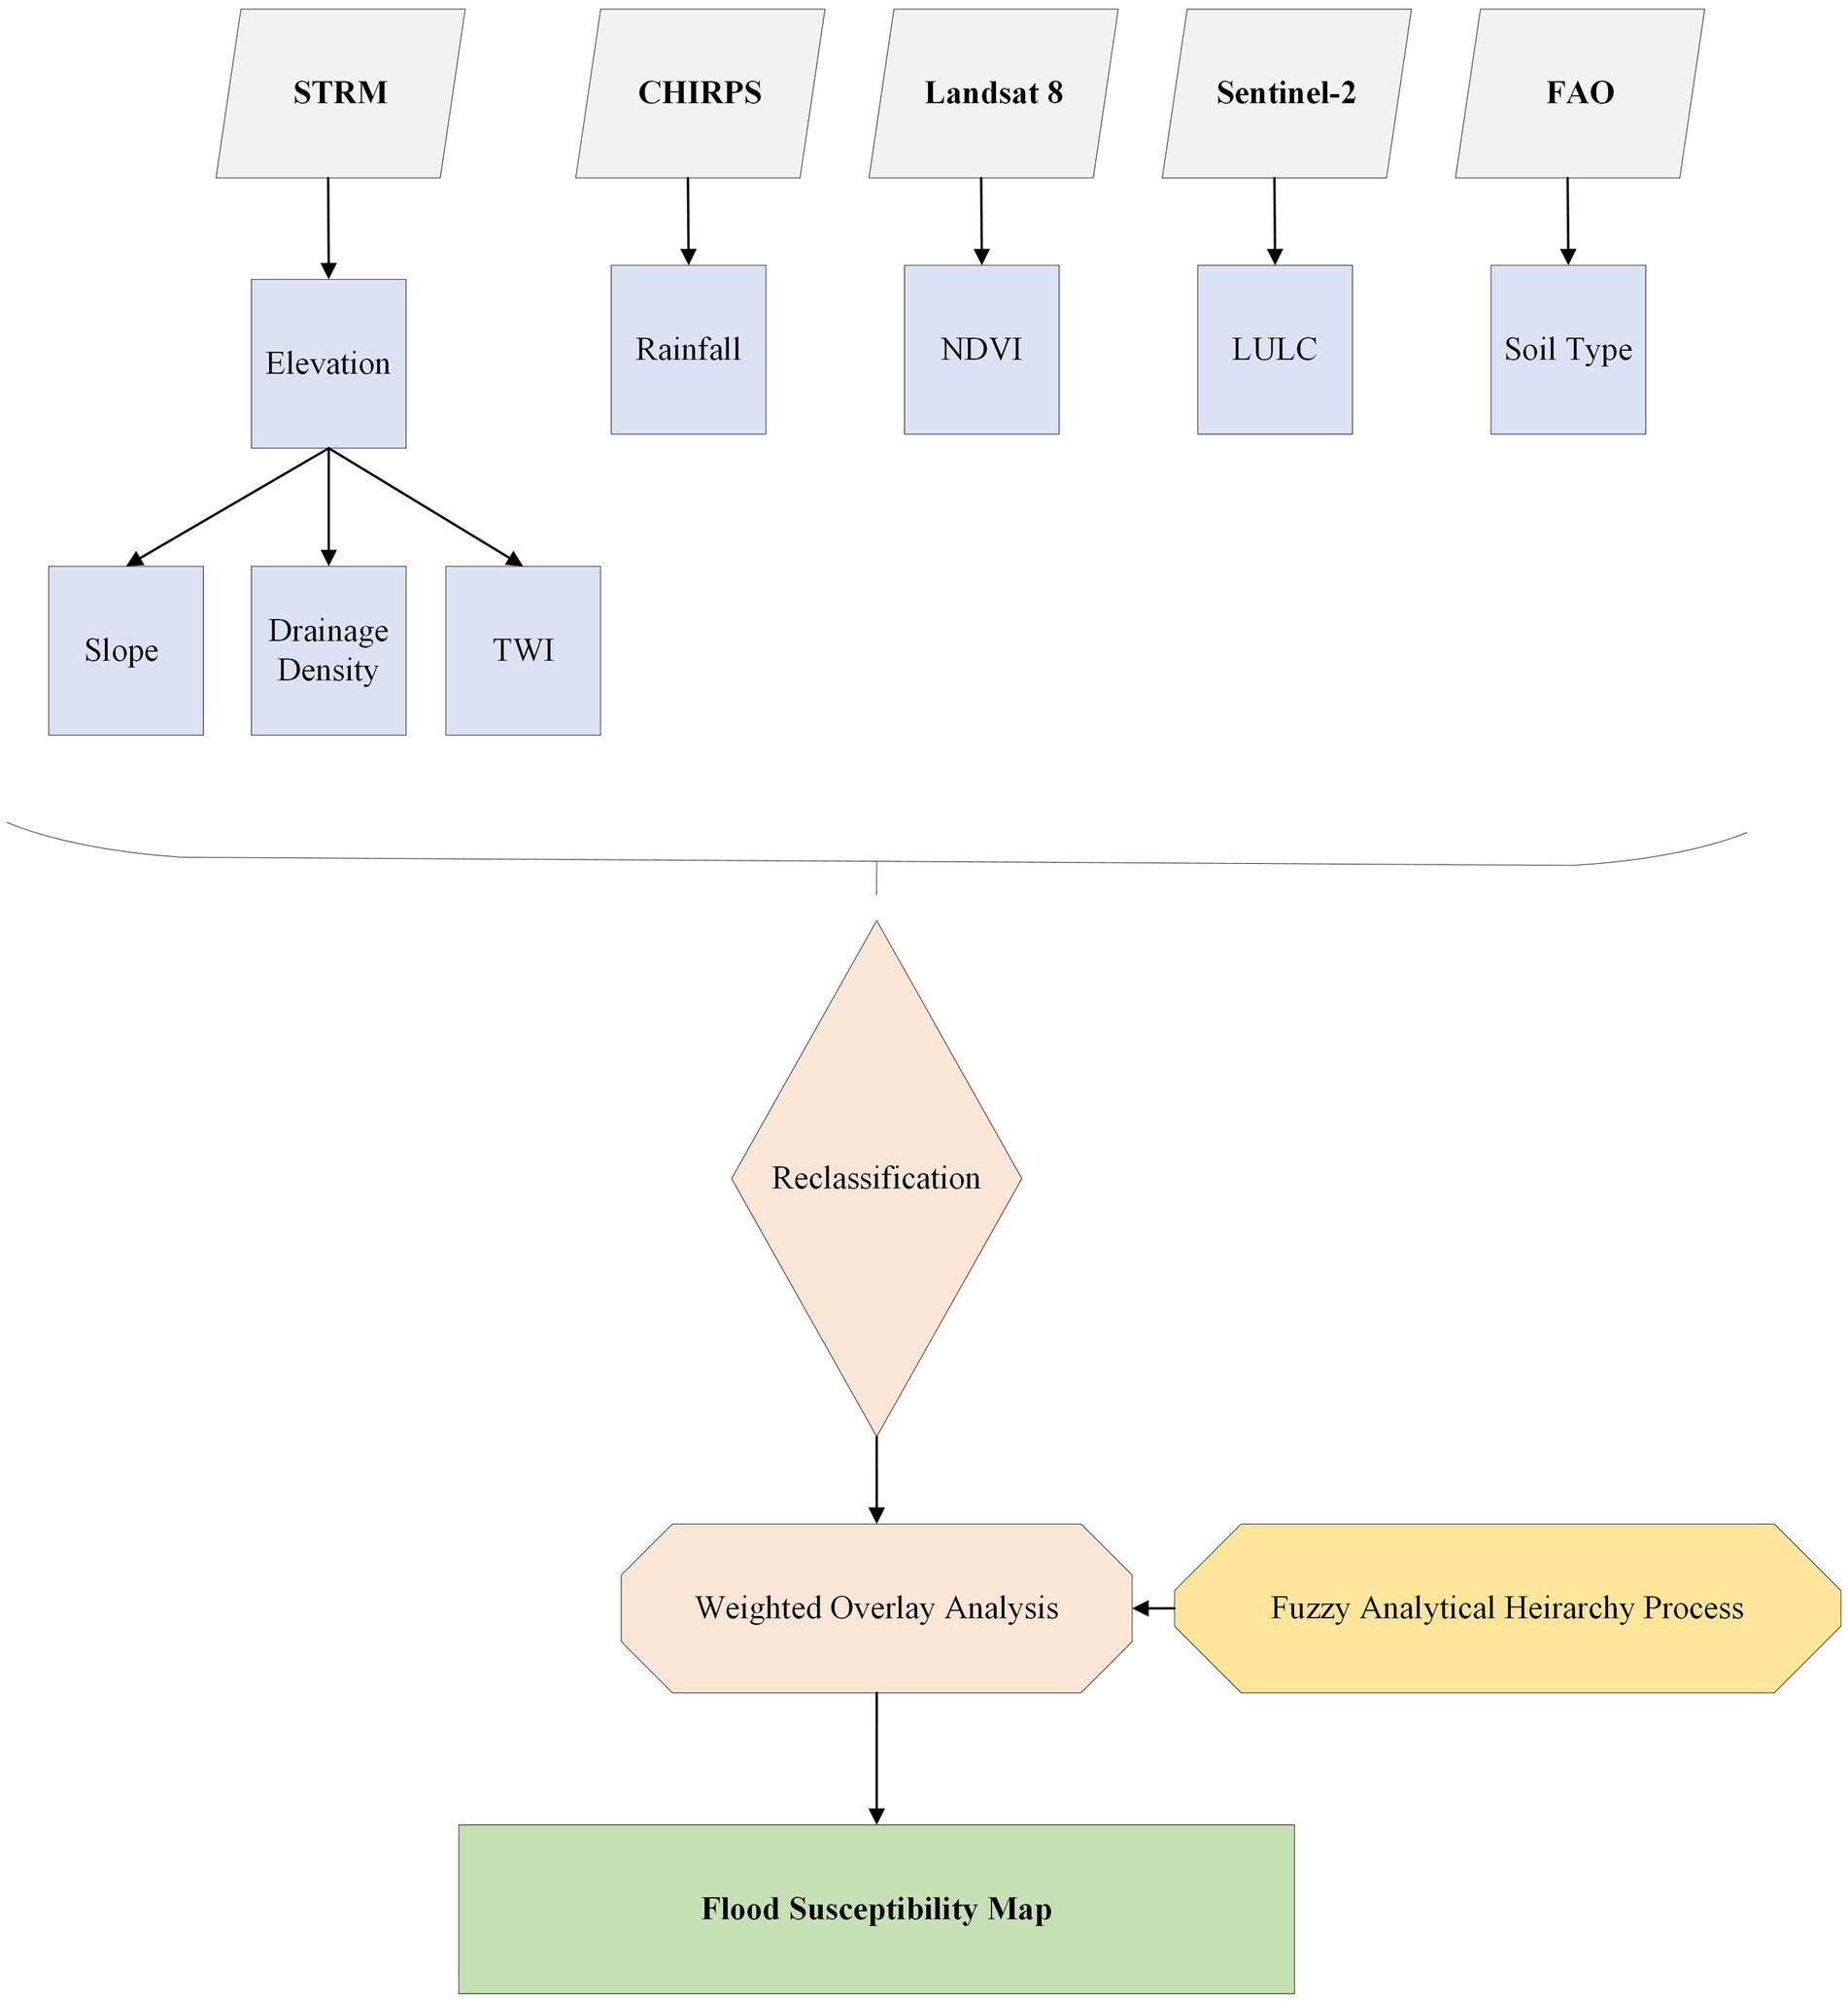
Figure 2. Stepwise methodology for FAHP.
3 Results and discussion
3.1 Spatial criteria
Eight spatial criteria have been applied in this study in order to map flood susceptibility in NEOM. Drainage Density ranged from 0.001 to 196.827 m/km2. The elevation ranged from 0 to 2,496 m asl with a corresponding slope that ranges from 0 to 74 degrees. Annual Accumulated rainfall ranged from 4 to 113 mm. Nine Landcover classifications are present in the study area in addition to three soil types. Finally, NDVI ranged from −0.4 to 0.86 while TWI ranged from −9.3 to 38.5. The results of the spatial analysis are summarized in Table 3 while the thematic layers are presented in Figure 3.
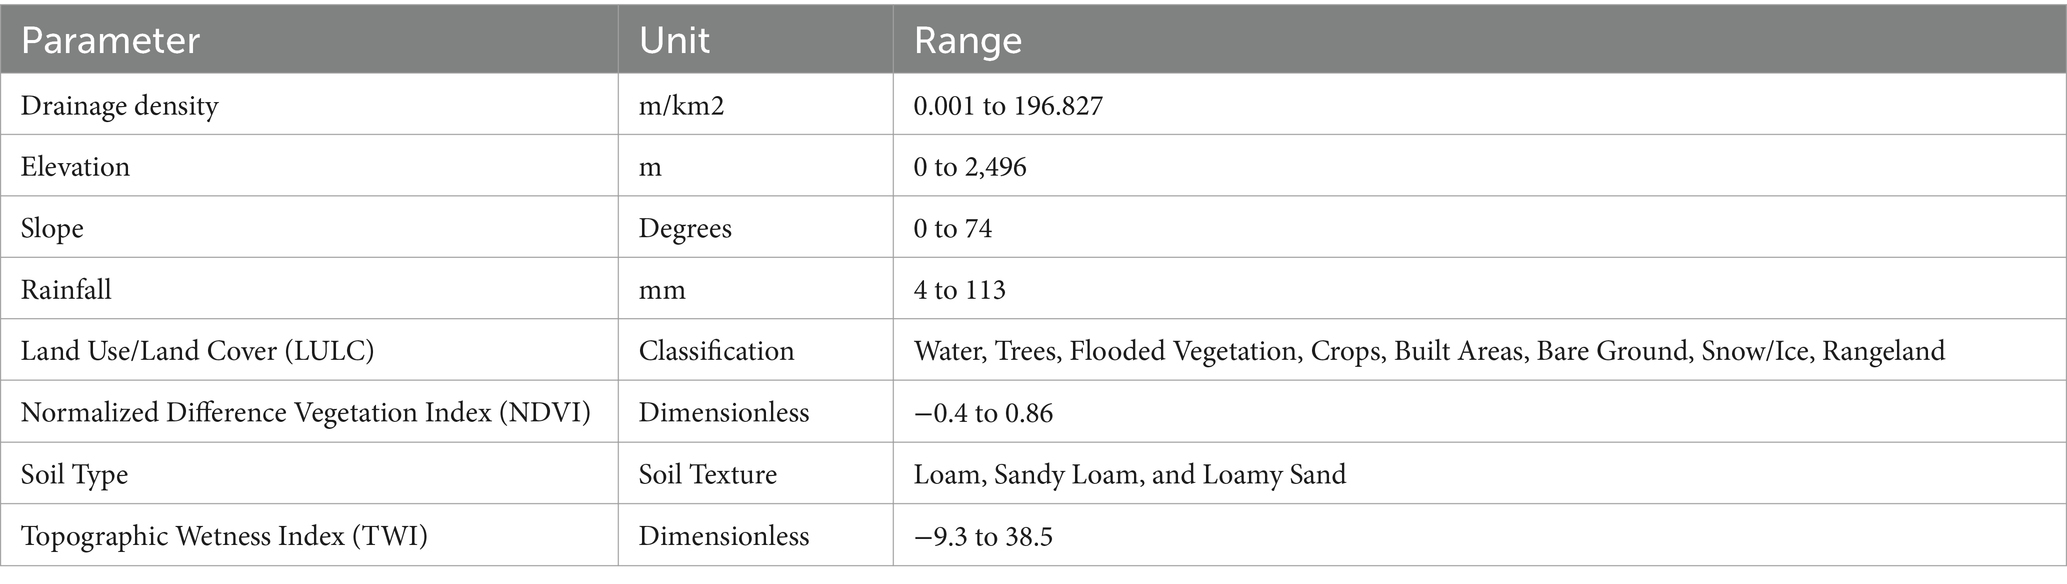
Table 3. Summarized results of spatial analysis.
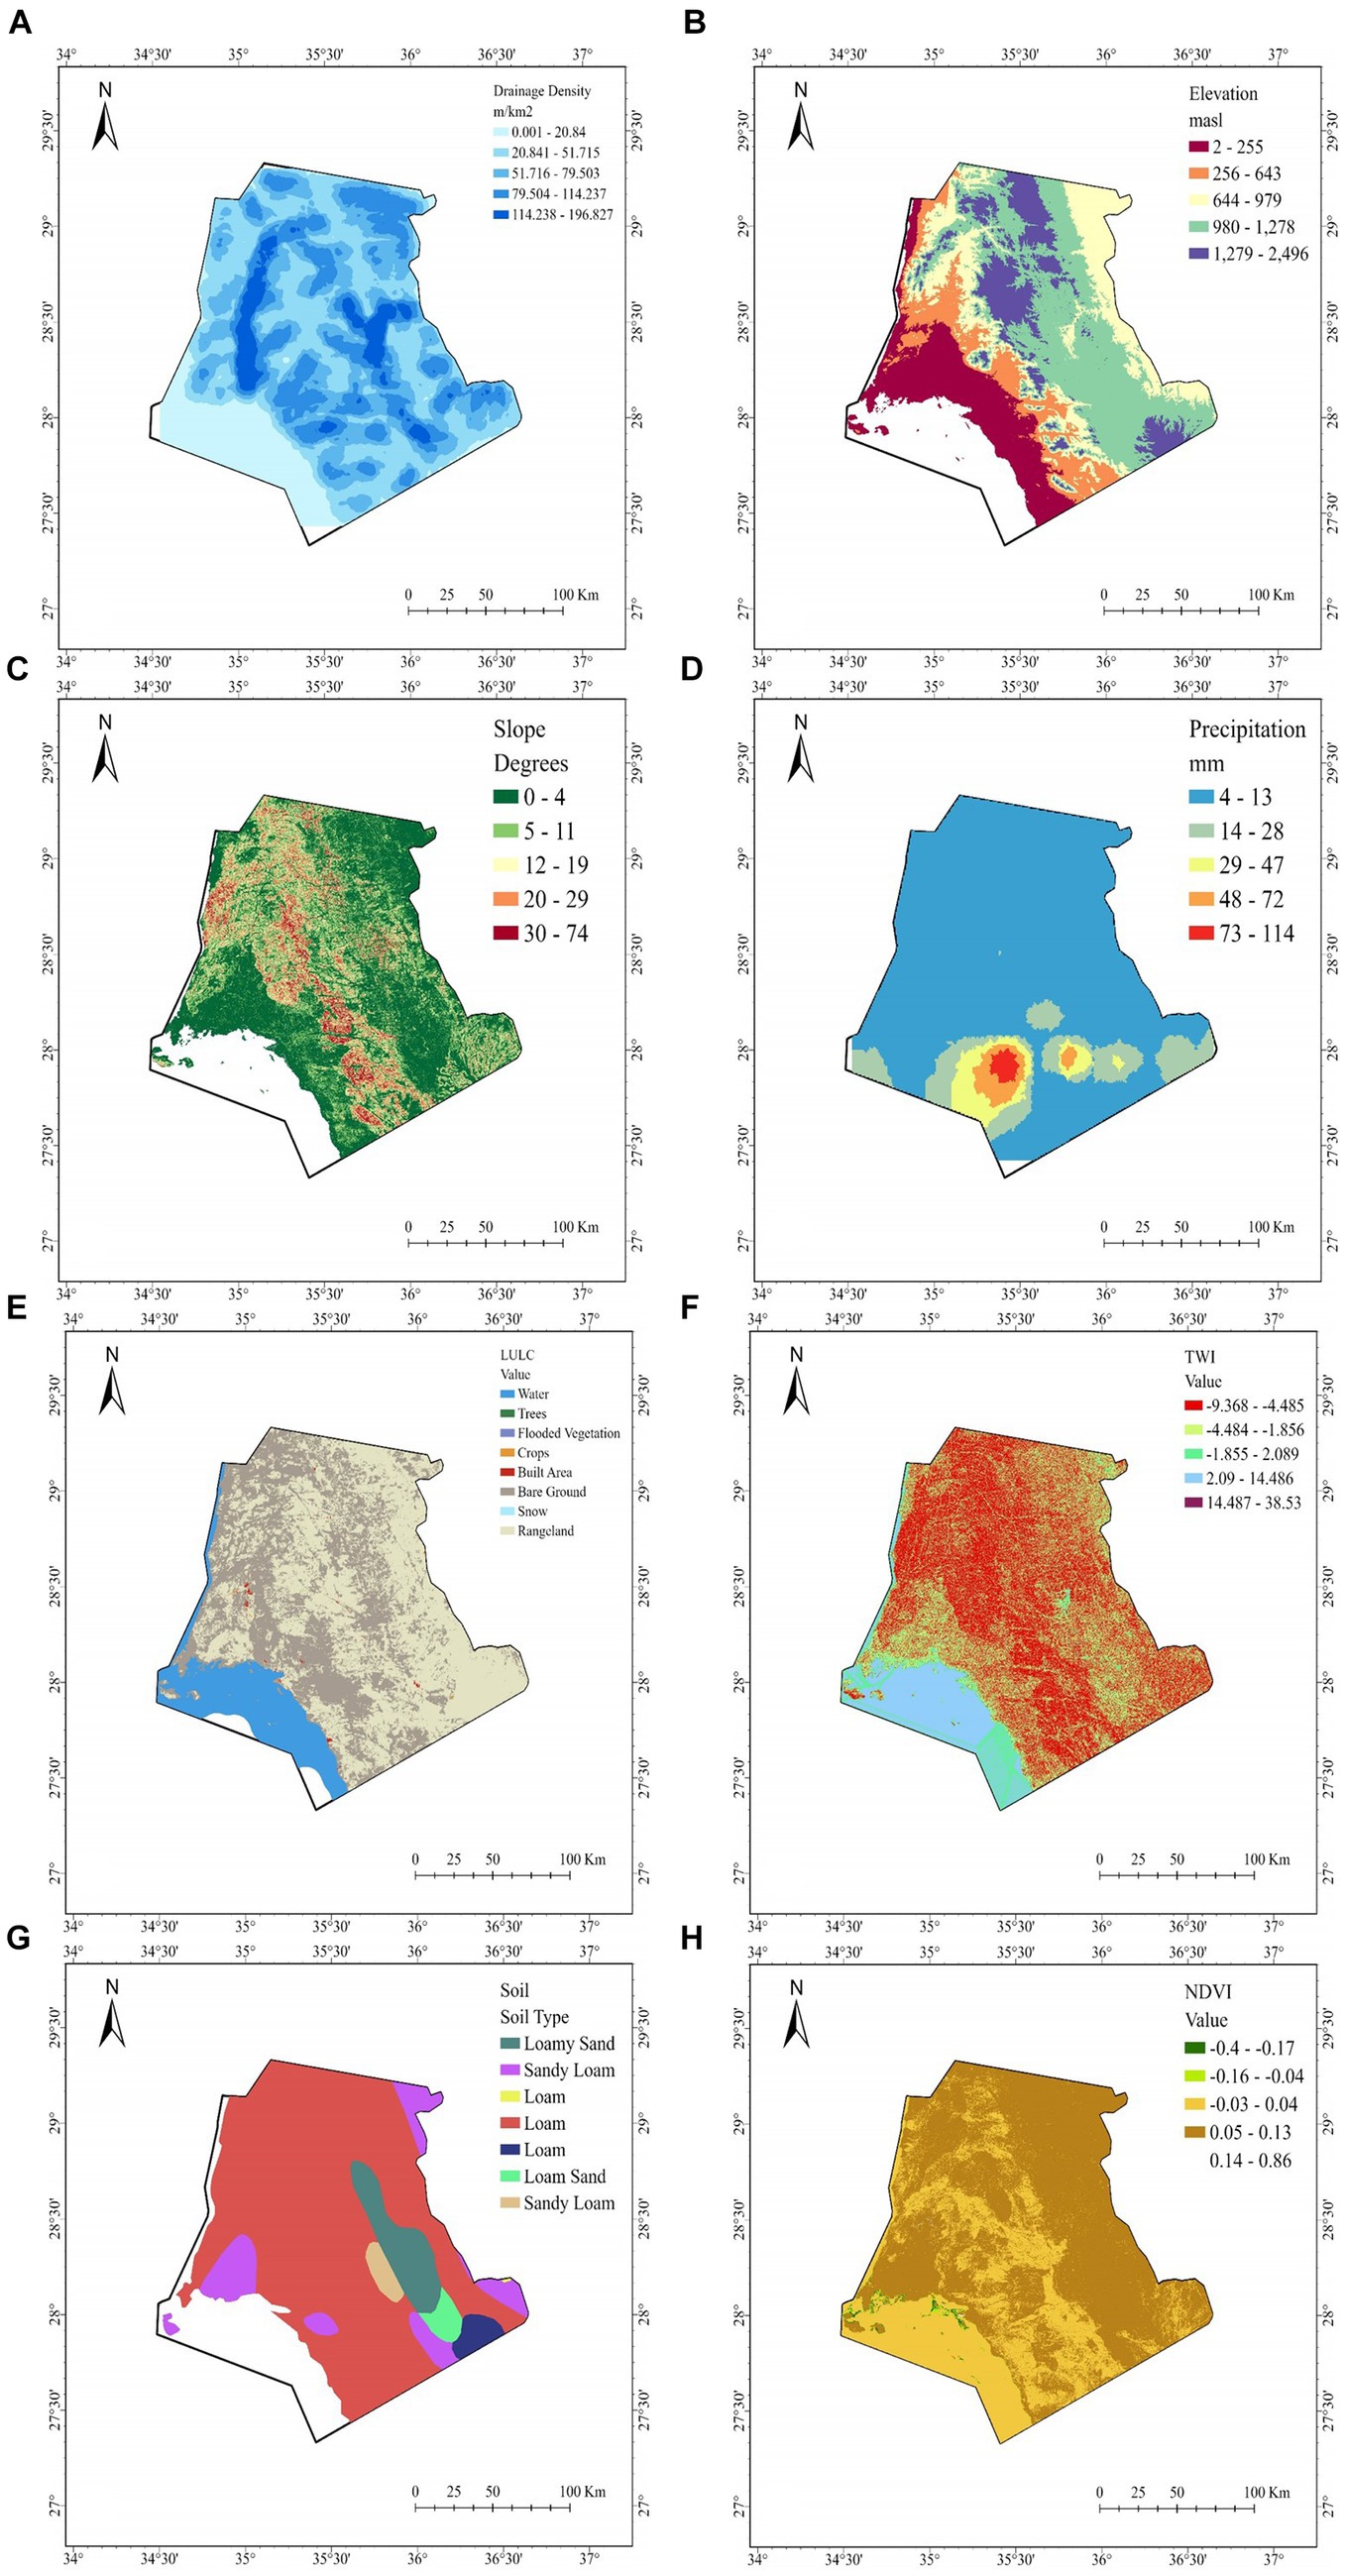
Figure 3. (A) Drainage Density, (B) Elevation, (C) Slope, (D) Precipitation, (E) Landcover, (F) Topographic Wetness Index. (G) Soil Type, (H) Normalized Difference Vegetation Index.
3.2 Fuzzy analytical hierarchy process analysis
As highlighted in Section 2.3.1., the tool developed by (Goepel, 2013) was utilized for creating a pairwise comparison matrix (Table 4) modified after the criteria used by Abdulalim and El Damaty (2022), Alharbi (2023), and Bashir and Alsalman (2023). In general, they have generally deemed that Drainage density, elevation, slope, and rainfall were the most important factors contributing to flood hazard. LULC, TWI, NDVI, and soil type were also found to be important factors, but to a lesser extent. Each element was then divided by the sum of its column in order to normalize the pairwise comparison matrix followed by averaging the value of each row to calculate the final weight value of the corresponding parameter using the tool developed by Goepel (2013) (Table 5). Finally, the consistency ratio (CR) was calculated using the same tool and resulted in a CR of 7.7% which is considered acceptable.
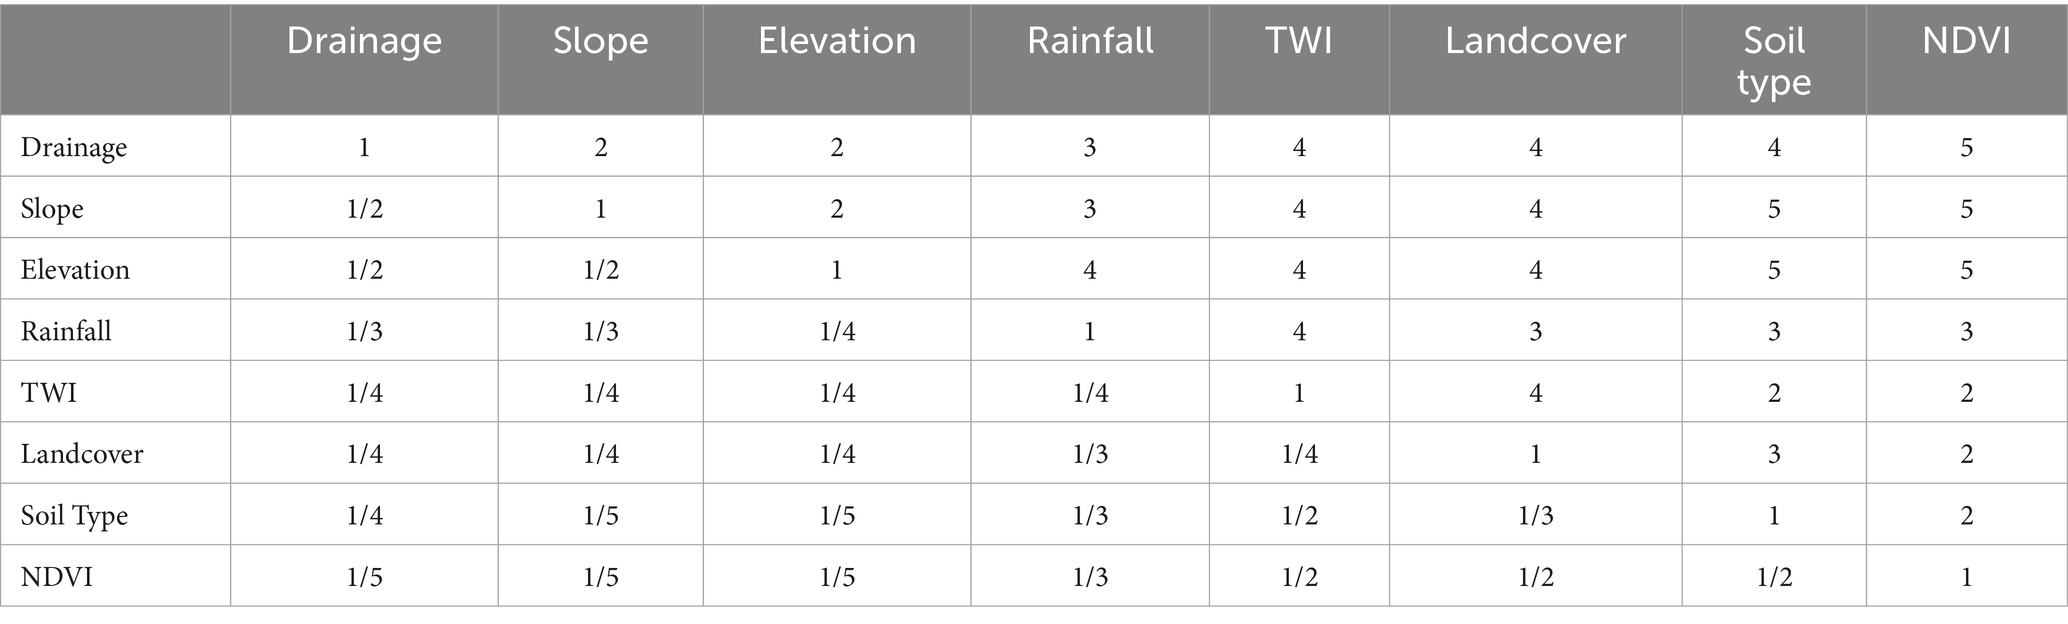
Table 4. AHP pairwise matrix for flood contributing factors.
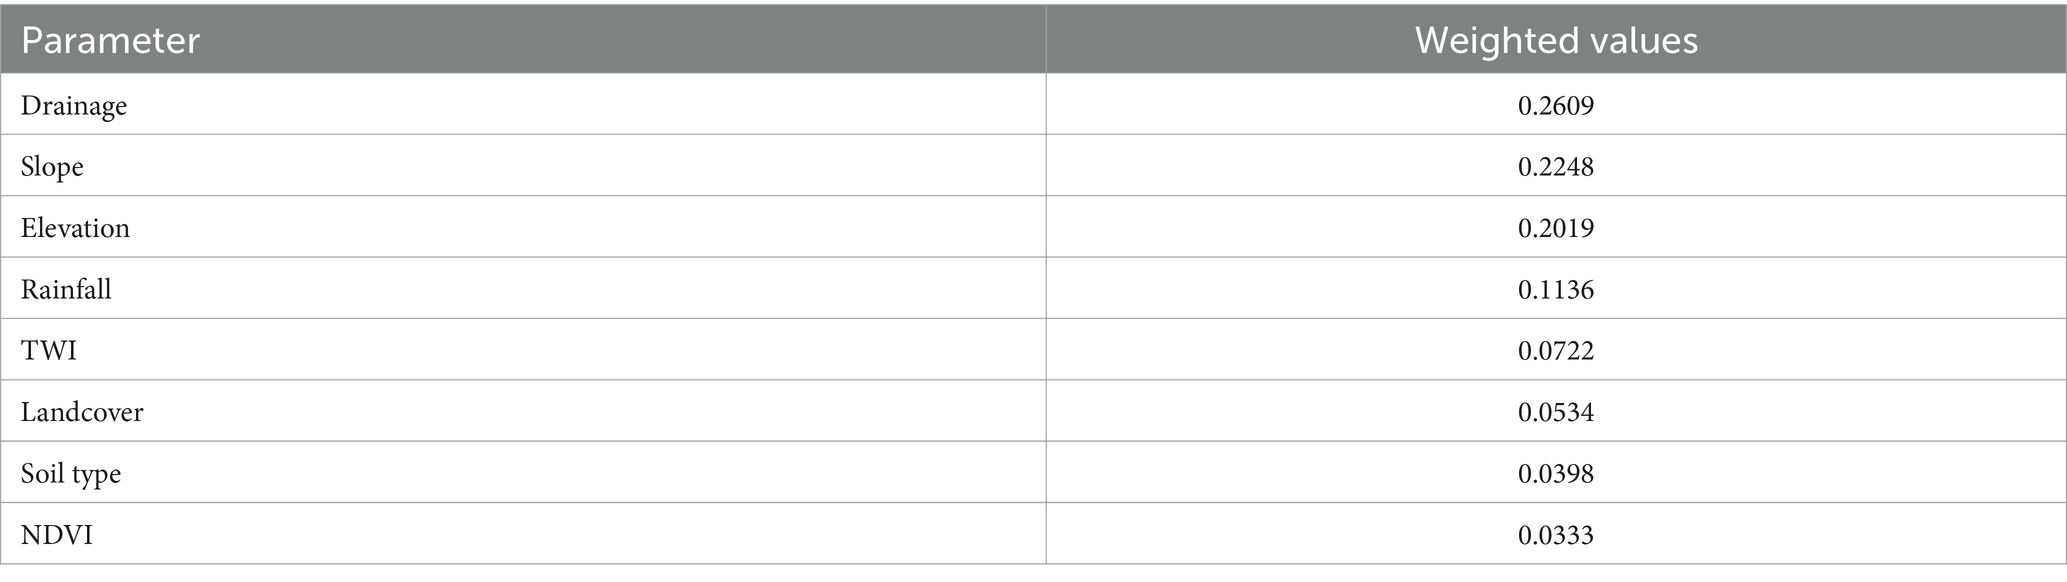
Table 5. AHP weighted values.
Following the methodology detailed in Section 2.3.2, The pairwise matrix values were converted to triangular fuzzy numbers (Table 6). Then the geometric mean was calculated for each criterion and the fuzzy weights were computed. Finally, those Fuzzy weights were converted to non-fuzzy weights and normalized (Table 7).
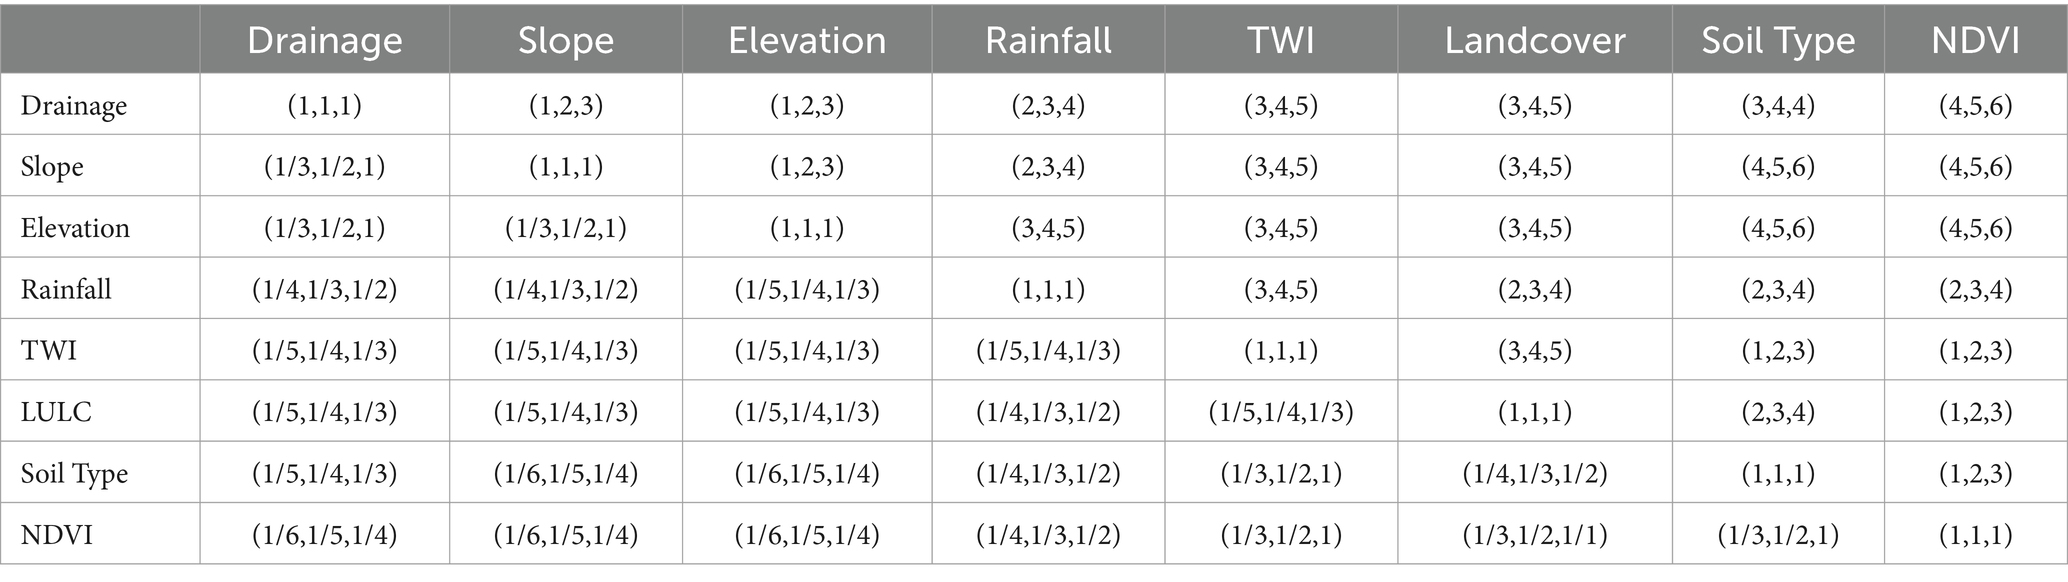
Table 6. Triangular fuzzy numbers.

Table 7. FAHP normalized weights.
3.3 Flood susceptibility
The flood susceptibility map was created by combining the results of the spatial analysis and the normalized values of each parameter from the FAHP process. Similar to the study by (Franci et al., 2016), the map was divided into seven categories to provide a more readable map. These categories were ‘very low’, ‘low’, ‘low to moderate’, ‘moderate’, ‘moderate to high’, ‘high’, and ‘very high’. The resulting map visually represents the varying degrees of flood susceptibility across the study area and is presented in Figure 4. This visual representation serves as a powerful tool for decision-makers, emergency responders, and urban planners in strategizing effective flood risk mitigation and adaptation measures.
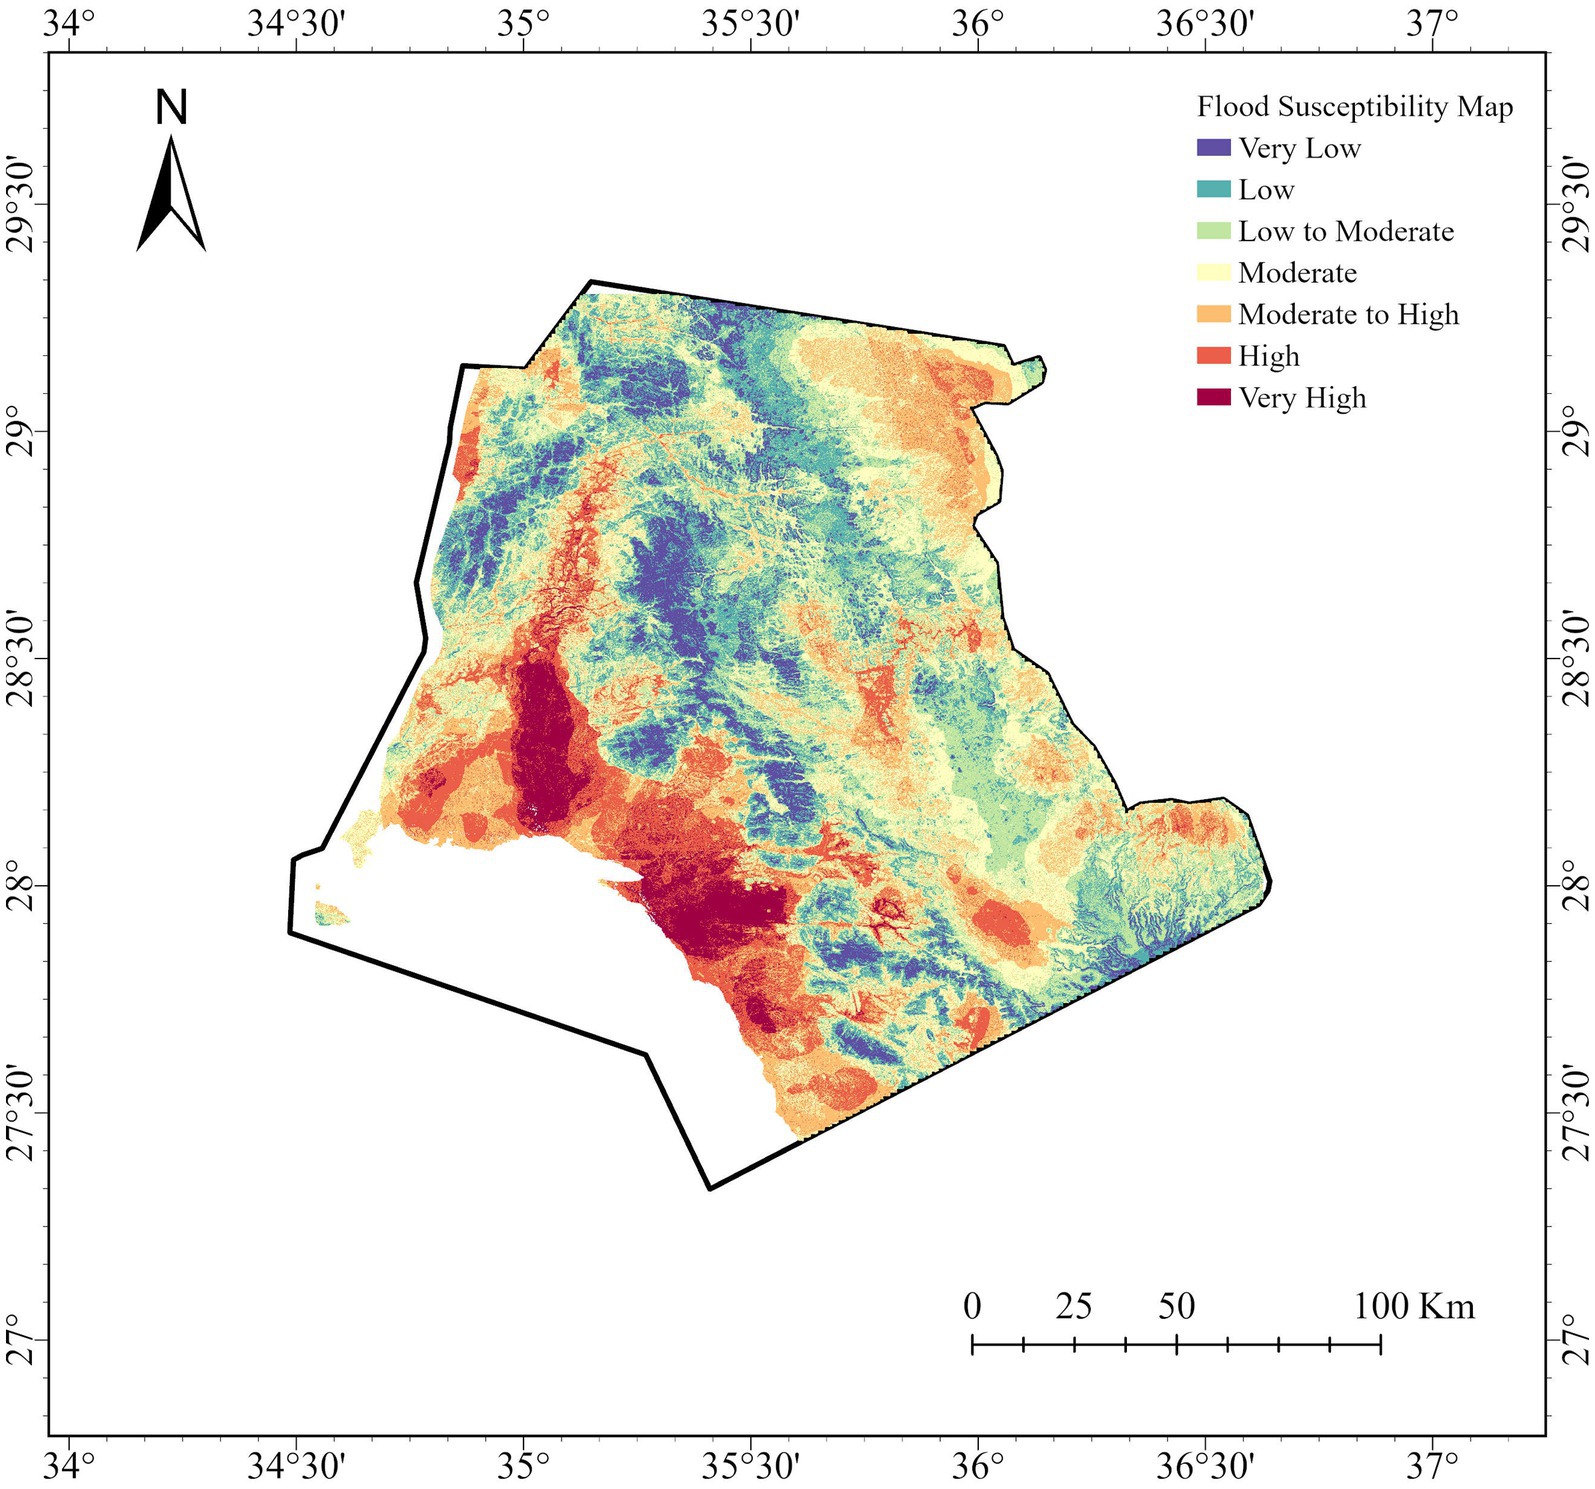
Figure 4. Flood susceptibility map of NEOM.
The flood susceptibility map was further quantified and summarized through an analysis of the spatial distribution of different susceptibility classes. The total area that is prone to ‘very low’ flooding is around 1,618.25 km2, areas with ‘low’ susceptibility is 3,591.13 km2, areas with ‘low to moderate’ susceptibility is 4,322.8 km2, areas with ‘moderate’ susceptibility is 5,109.69 km2, areas with ‘moderate to high’ is 4.081.39 km2, areas with ‘high’ susceptibility is 2,581.97 km2 and areas with ‘very high’ susceptibility is 1,121.96 km2.
Table 8 provides a summary, breaking down the study area into distinct classes and the associated area per class.
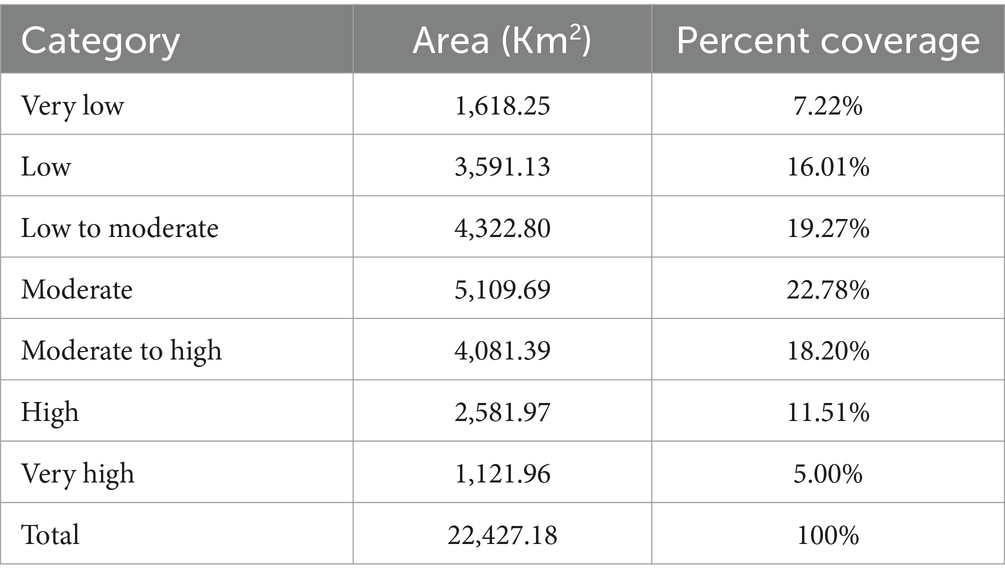
Table 8. Summary of area per category.
The table highlights the proportional distribution of areas within each susceptibility class, offering a quantitative understanding of the extent of flood susceptibility within the NEOM region. It also shows that NEOM largely falls under areas with various levels of moderate susceptibility while extremes, mainly “very low” and “very high” are not very prevalent. Moreover, comparing the findings of this study with a recent one by Alharbi (2023), it is evident that there is a general alignment that NEOM falls largely within the moderate flood susceptibility zone albeit in our study there are varying degrees of moderate susceptibility.
Observing Figure 3 along with the watershed delineation map developed by Abdulalim and El Damaty (2022) (Figure 5), it is evident that Wadi Efal, Wadi Ghurr and Wadi Sadar present the highest levels of potential flooding and hence urban planners need to take into consideration flood-management practices and when designing urban layouts in said areas.
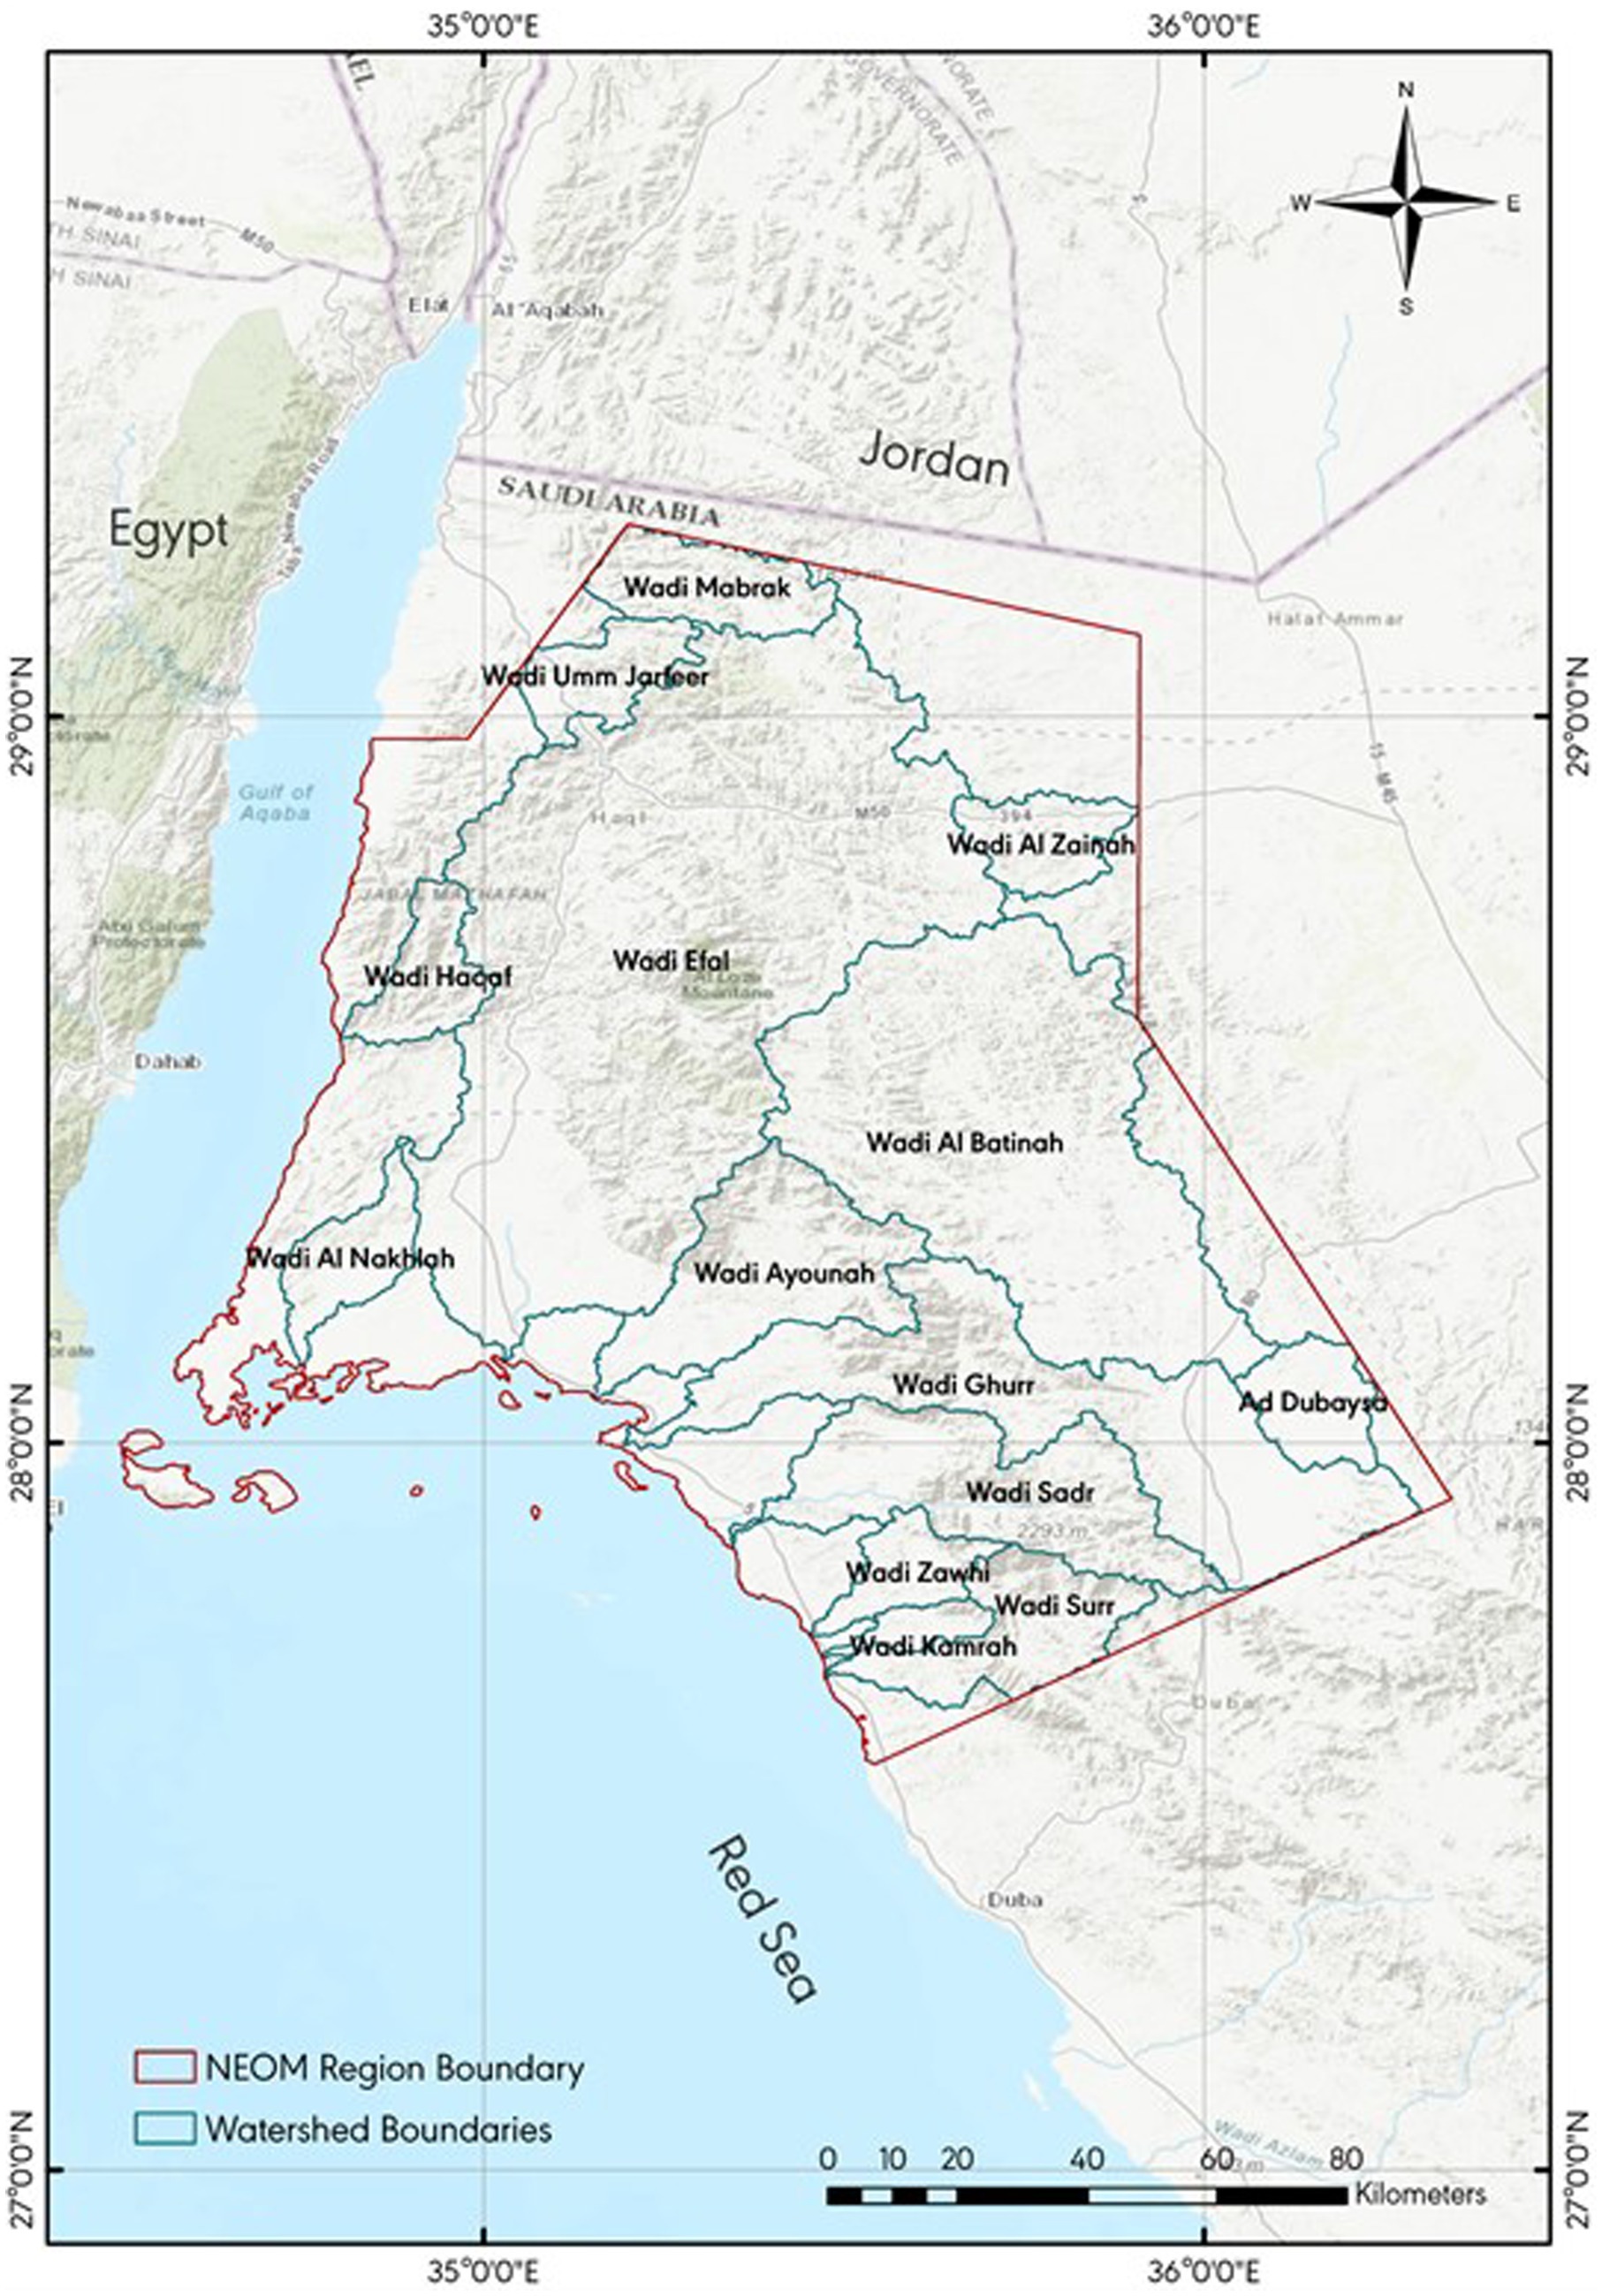
Figure 5. Neom Watersheds. Source: (Abdulalim and El Damaty, 2022), CC BY 4.0.
With this visual representation into consideration for master planning (Figures 3, 4), it is essential to also take note of the potential impact that planned urbanization as well as climate change might have. There is a general consensus that climate change is leading to increased weather events both in terms of frequency and magnitude (Wang et al., 2023). In addition, rapid urbanization, which affects surface characteristics of the landscape, thereby leading to changes in LULC, necessitates that these aspects be considered together. Thus, future urban modification plans become a necessary prerequisite for assessing future flooding (Wang et al., 2023). If action is not taken, urban flooding has the potential to cause 20 times the damage by the end of the 21st century as a result of climate change (Winsemius et al., 2016).
The potential impact global warming might have on precipitation levels in various regions of Saudi Arabia was investigated by Tarawneh and Chowdhury (2018) with Tabuk region being among them. In their study, the authors developed three scenarios and used a linear and Mann–Kendall analysis to determine trends and provide potential projections for both temperature and precipitation increase in the future. In two of the three scenarios developed, the projections showed an increase in precipitation between the years 2025–2044, 2045–2064, and 2065–2084. Additionally, Wang et al. (2023) developed a model to investigate the potential socio-economic impact of urban flooding under climate change scenarios. In their study, the authors used information sourced from climate change models, urbanization models, historical socioeconomic records, climatic data, land utilization patterns, and factors associated with flooding.
Despite one scenario from the study by Tarawneh and Chowdhury (2018) showing a decrease in precipitation, research in the future could be expanded to try and map the potential flood susceptibility under various scenarios as a consequence of climate change while incorporating potential socio-economic impacts. With current plans to develop NEOM into an economic and Tourism hub, it is imperative that socio-economic aspects that are tied in with flood vulnerability be assessed. Flood-prone areas have special considerations when it comes to urban design such as proper allocation and placement of stormwater collection points.
4 Conclusion
The present study employed the FAHP methodology in GIS to produce a flood susceptibility map for the NEOM region. This methodology is extensively employed on a global scale and is commonly regarded as one of the most effective methods for this objective due to its ability to integrate spatial data from numerous sources at a consistent scale. To date, there have been no prior investigations that have employed this particular methodology to evaluate floods within the designated study area. The FAHP methodology was employed to integrate the existing criteria into a weighted overlay model implemented in ArcGIS Pro. The findings of the investigation indicate that NEOM, in general, is dominated by areas with varying degrees of moderate susceptibility to flooding. In general, areas with lower elevation and a steeper slope, commonly referred to as lowlands, exhibit the highest susceptibility to flooding. Conversely, regions characterized by higher elevation and a steep slope, known as highlands, demonstrate the lowest levels of flood hazard. A notable limitation of this study is the unavailability of in-situ and historical flood inventory data for the sake of validation. Another limitation is that this study did not incorporate existing flood-mitigation measures already available within the study area (i.e., culverts). Future research could be refined by incorporating in-situ data whenever it becomes available. Moreover, research can be expanded to model future climate change scenarios and incorporate future LULC to predict the associated socio-economic impact.
Data availability statement
The original contributions presented in the study are included in the article/Supplementary material, further inquiries can be directed to the corresponding author.
Author contributions
BB: Conceptualization, Formal analysis, Methodology, Writing – original draft, Writing – review & editing. BT: Writing – review & editing, Conceptualization, Supervision. HB: Methodology, Writing – review & editing, Conceptualization, Investigation, Supervision.
Funding
The author(s) declare that no financial support was received for the research, authorship, and/or publication of this article.
Conflict of interest
The authors declare that the research was conducted in the absence of any commercial or financial relationships that could be construed as a potential conflict of interest.
Publisher’s note
All claims expressed in this article are solely those of the authors and do not necessarily represent those of their affiliated organizations, or those of the publisher, the editors and the reviewers. Any product that may be evaluated in this article, or claim that may be made by its manufacturer, is not guaranteed or endorsed by the publisher.
Supplementary material
The Supplementary material for this article can be found online at: https://www.frontiersin.org/articles/10.3389/frwa.2024.1388003/full#supplementary-material
References
Abdulalim, A. A., and El Damaty, T. A. (2022). Implementation of remote sensing and GIS techniques to study the flash flood risk at NEOM Mega-City, Saudi Arabia. Adv. Remote Sens. 11, 121–157. doi: 10.4236/ars.2022.114008
Alam, A., Ahmed, B., and Sammonds, P. (2021). Flash flood susceptibility assessment using the parameters of drainage basin morphometry in SE Bangladesh. Quat. Int. 575-576, 295–307. doi: 10.1016/j.quaint.2020.04.047
Al-Areeq, A. M., Saleh, R. A. A., Ghaleb, M., Abba, S. I., and Yaseen, Z. M. (2024). Implication of novel hybrid machine learning model for flood subsidence susceptibility mapping: a representative case study in Saudi Arabia. J. Hydrol. (Amst) 630:130692. doi: 10.1016/j.jhydrol.2024.130692
Alharbi, T. (2023). Mapping of groundwater, flood, and drought potential zones in Neom, Saudi Arabia, using GIS and remote sensing techniques. Water (Basel) 15:966. doi: 10.3390/w15050966
Althuwaynee, O. F., Pradhan, B., Park, H. J., and Lee, J. H. (2014). A novel ensemble bivariate statistical evidential belief function with knowledge-based analytical hierarchy process and multivariate statistical logistic regression for landslide susceptibility mapping. Catena (Amst) 114, 21–36. doi: 10.1016/j.catena.2013.10.011
Apollonio, C., Balacco, G., Novelli, A., Tarantino, E., and Piccinni, A. F. (2016). Land use change impact on flooding areas: the case study of Cervaro Basin (Italy). Sustainability (Switzerland) 8:996. doi: 10.3390/su8100996
Arkema, K. K., Guannel, G., Verutes, G., Wood, S. A., Guerry, A., Ruckelshaus, M., et al. (2013). Coastal habitats shield people and property from sea-level rise and storms. Nat. Clim. Chang. 3, 913–918. doi: 10.1038/nclimate1944
Arnell, N. W., and Gosling, S. N. (2016). The impacts of climate change on river flood risk at the global scale. Clim. Chang. 134, 387–401. doi: 10.1007/s10584-014-1084-5
Ayalew, L., and Yamagishi, H. (2005). The application of GIS-based logistic regression for landslide susceptibility mapping in the Kakuda-Yahiko Mountains, Central Japan. Geomorphology 65, 15–31. doi: 10.1016/j.geomorph.2004.06.010
Baalousha, H. M., Younes, A., Yassin, M. A., and Fahs, M. (2023). Comparison of the fuzzy analytic hierarchy process (F-AHP) and fuzzy logic for flood exposure risk assessment in arid regions. Hydrology 10:136. doi: 10.3390/hydrology10070136
Bashir, B., and Alsalman, A. (2023). Morpho-hydrological analysis and preliminary flash flood Hazard mapping of Neom City, northwestern Saudi Arabia, using geospatial techniques. Sustain. For. 16:23. doi: 10.3390/su16010023
Büyüközkan, G., Çifçi, G., and Güleryüz, S. (2011). Strategic analysis of healthcare service quality using fuzzy AHP methodology. Expert Syst. Appl. 38, 9407–9424. doi: 10.1016/j.eswa.2011.01.103
Chapi, K., Singh, V. P., Shirzadi, A., Shahabi, H., Bui, D. T., Pham, B. T., et al. (2017). A novel hybrid artificial intelligence approach for flood susceptibility assessment. Environ. Model Softw. 95, 229–245. doi: 10.1016/j.envsoft.2017.06.012
Chen, Y., Barrett, D., Liu, R., Gao, L., Zhou, M., Renzullo, L., et al. (2014). A spatial framework for regional-scale flooding risk assessment. Available at: http://www.iemss.org/society/index.php/iemss-2014-proceedings.
Cheng, C., Li, G., Li, Q., Auld, H., and Maclver, D. (2007). Climate change and extreme rainfall-related flooding and surface runoff risks in Ontario. J. Water Resour. Prot. 4:7. doi: 10.4236/jwarp.2012.42007
Cikmaz, B. A., Yildirim, E., and Demir, I. (2023). Flood susceptibility mapping using fuzzy analytical hierarchy process for Cedar Rapids, Iowa. Int. J. River Basin Manag. 1–13, 1–13. doi: 10.1080/15715124.2023.2216936
Croneborg, L., Saito, K., Matera, M., McKeown, D., and Van Aardt, J. (2020). Digital Elevation Models. Washington, DC: World Bank.
Dano, U. L. (2022). An AHP-based assessment of flood triggering factors to enhance resiliency in Dammam, Saudi Arabia. GeoJournal 87, 1945–1960. doi: 10.1007/s10708-020-10363-5
Darwish, K. (2023). GIS-based multi-criteria decision analysis for flash flood Hazard and risk assessment: a case study of the eastern Minya watershed, Egypt. In: The 7th international electronic conference on water sciences, (Basel Switzerland: MDPI), No. 87.
Das, S. (2018). Geographic information system and AHP-based flood hazard zonation of Vaitarna basin, Maharashtra, India. Arab. J. Geosci. 11:576. doi: 10.1007/s12517-018-3933-4
Das, S. (2019). Geospatial mapping of flood susceptibility and hydro-geomorphic response to the floods in Ulhas basin, India. Remote Sens Appl. 14, 60–74. doi: 10.1016/j.rsase.2019.02.006
De Roo, A., Schmuck, G., Perdigao, V., and Thielen, J. (2003). The influence of historic land use changes and future planned land use scenarios on floods in the Oder catchment. Phys. Chem. Earth Parts 28, 1291–1300. doi: 10.1016/j.pce.2003.09.005
DeFries, R. S., Anser, G. P., and Houghton, R. A. (2004) in Ecosystems and land use change. eds. R. S. DeFries, G. P. Asner, and R. A. Houghton (Washington, DC: American Geophysical Union).
Dodgson, J. S., Spackman, M., Pearman, A., and Phillips, L. D. (2009). Multi-criteria analysis: A manual. London: Department for Communities and Local Government Publication.
Elsebaie, I. H., Kawara, A. Q., and Alnahit, A. O. (2023). Mapping and assessment of flood risk in the Wadi Al-Lith Basin, Saudi Arabia. Water (Basel) 15:902. doi: 10.3390/w15050902
Franci, F., Bitelli, G., Mandanici, E., Hadjimitsis, D., and Agapiou, A. (2016). Satellite remote sensing and GIS-based multi-criteria analysis for flood hazard mapping. Nat. Hazards 83, 31–51. doi: 10.1007/s11069-016-2504-9
Ghalkhani, H., Golian, S., Saghafian, B., Farokhnia, A., and Shamseldin, A. (2013). Application of surrogate artificial intelligent models for real-time flood routing. Water Environ. J. 27, 535–548. doi: 10.1111/j.1747-6593.2012.00344.x
Ghoneim, E., and Foody, G. M. (2013). Assessing flash flood hazard in an arid mountainous region. Arab. J. Geosci. 6, 1191–1202. doi: 10.1007/s12517-011-0411-7
Goepel, K. D. (2013). Implementing the analytic hierarchy process as a standard method for multi-criteria decision making in corporate enterprises – a new AHP excel template with multiple inputs. Conference: International symposium on the analytic hierarchy process: Kuala Lumpur.
Hagos, Y. G., Andualem, T. G., Yibeltal, M., and Mengie, M. A. (2022). Flood hazard assessment and mapping using GIS integrated with multi-criteria decision analysis in upper Awash River basin, Ethiopia. Appl Water Sci 12:674. doi: 10.1007/s13201-022-01674-8
Hartemink, A. E., and Bockheim, J. G. (2013). Soil genesis and classification. Catena (Amst) 104, 251–256. doi: 10.1016/j.catena.2012.12.001
Jovčić, S., Průša, P., Samson, J., and Lazarević, D. (2019). A fuzzy- AHP approach to evaluate the criteria of third -party logistics (3Pl) service provider. Int. J. Traffic Transport Eng. 9:2. doi: 10.7708/ijtte.2019.9(3).02
Kazakis, N., Kougias, I., and Patsialis, T. (2015). Assessment of flood hazard areas at a regional scale using an index-based approach and analytical hierarchy process: application in Rhodope–Evros region, Greece. Sci. Total Environ. 538, 555–563. doi: 10.1016/j.scitotenv.2015.08.055
Kerkez, M., Gajović, V., and Puzić, G. (2017). Flood risk assessment model using the fuzzy analytic hierarchy process. Prog. Econ. Sci. 1, 271–282. doi: 10.14595/PES/04/019
Khosravi, K., Pourghasemi, H. R., Chapi, K., and Bahri, M. (2016). Flash flood susceptibility analysis and its mapping using different bivariate models in Iran: a comparison between Shannon’s entropy, statistical index, and weighting factor models. Environ. Monit. Assess. 188:656. doi: 10.1007/s10661-016-5665-9
Kilincci, O., and Onal, S. A. (2011). Fuzzy AHP approach for supplier selection in a washing machine company. Expert Syst. Appl. 38, 9656–9664. doi: 10.1016/j.eswa.2011.01.159
Kusler, J. (2016). Association of State Wetland Managers Legal Issue in upgrading flood maps, 2016. Available at: https://digitalcommons.library.umaine.edu/maine_env_organizations/40.
Lin, J. M., and Billa, L. (2021). Spatial prediction of flood-prone areas using geographically weighted regression. Environ. Adv. 6:100118. doi: 10.1016/j.envadv.2021.100118
Maier, H. R., and Dandy, G. C. (2000). Neural networks for the prediction and forecasting of water resources variables: a review of modelling issues and applications. Environ. Model Softw. 15, 101–124. doi: 10.1016/S1364-8152(99)00007-9
Ouma, Y., and Tateishi, R. (2014). Urban flood vulnerability and risk mapping using integrated multi-parametric AHP and GIS: methodological overview and case study assessment. Water (Basel) 6, 1515–1545. doi: 10.3390/w6061515
Owrangi, A. M., Lannigan, R., and Simonovic, S. P. (2014). Interaction between land-use change, flooding and human health in metro Vancouver, Canada. Nat. Hazards 72, 1219–1230. doi: 10.1007/s11069-014-1064-0
Pallard, B., Castellarin, A., and Montanari, A. (2009). A look at the links between drainage density and flood statistics. Hydrol. Earth Syst. Sci. 13, 1019–1029. doi: 10.5194/hess-13-1019-2009
Parry, M. (2007). Climate change 2007 - impacts, adaptation and vulnerability: Working group II contribution to the fourth assessment report of the IPCC. Cambridge, UK: Cambridge University Press.
Parsian, S., Amani, M., Moghimi, A., Ghorbanian, A., and Mahdavi, S. (2021). Flood Hazard mapping using fuzzy logic, analytical hierarchy process, and multi-source geospatial datasets. Remote Sens. 13:4761. doi: 10.3390/rs13234761
Parvaiz, M., Tali, A., and Kanth, A. (2011). Land use/land cover change and its impact on flood occurrence: a case study of upper Jhelum floodplain NAAC accredited grade “a.” Available at: https://core.ac.uk/download/pdf/159343729.pdf (Accessed December 09, 2023).
Paul, G. C., Saha, S., and Hembram, T. K. (2019). Application of the GIS-based probabilistic models for mapping the flood susceptibility in Bansloi sub-basin of ganga-Bhagirathi River and their comparison. Remote Sens. Earth Syst. Sci. 2, 120–146. doi: 10.1007/s41976-019-00018-6
Pourali, S. H., Arrowsmith, C., Chrisman, N., Matkan, A. A., and Mitchell, D. (2016). Topography wetness index application in flood-risk-based land use planning. Appl. Spat. Anal. Policy 9, 39–54. doi: 10.1007/s12061-014-9130-2
Riazi, M., Khosravi, K., Shahedi, K., Ahmad, S., Jun, C., Bateni, S. M., et al. (2023). Enhancing flood susceptibility modeling using multi-temporal SAR images, CHIRPS data, and hybrid machine learning algorithms. Sci. Total Environ. 871:162066. doi: 10.1016/j.scitotenv.2023.162066
Rotunno, R., and Houze, R. A. (2007). Lessons on orographic precipitation from the mesoscale alpine Programme. Q. J. R. Meteorol. Soc. 133, 811–830. doi: 10.1002/qj.67
Saaty, T. L. (1977). A scaling method for priorities in hierarchical structures. J. Math. Psychol. 15, 234–281. doi: 10.1016/0022-2496(77)90033-5
Saaty, T. L. (1988). “What is the analytic hierarchy process?” in Mathematical models for decision support (Berlin, Heidelberg: Springer Berlin Heidelberg), 109–121.
Sanyal, J., Densmore, A. L., and Carbonneau, P. (2014). Analysing the effect of land-use/cover changes at sub-catchment levels on downstream flood peaks: a semi-distributed modelling approach with sparse data. Catena (Amst) 118, 28–40. doi: 10.1016/j.catena.2014.01.015
Shafapour Tehrany, M., Kumar, L., Neamah Jebur, M., and Shabani, F. (2019). Evaluating the application of the statistical index method in flood susceptibility mapping and its comparison with frequency ratio and logistic regression methods. Geomat. Nat. Haz. Risk 10, 79–101. doi: 10.1080/19475705.2018.1506509
Shen, L., Zhang, Y., Ullah, S., Pepin, N., and Ma, Q. (2021). Changes in snow depth under elevation-dependent warming over the Tibetan plateau. Atmos. Sci. Lett. 22:1041. doi: 10.1002/asl.1041
Subraelu, P., Ahmed, A., Ebraheem, A. A., Sherif, M., Mirza, S. B., Ridouane, F. L., et al. (2023). Risk assessment and mapping of flash flood vulnerable zones in arid region, Fujairah City, UAE-using remote sensing and GIS-based analysis. Water (Basel) 15:2802. doi: 10.3390/w15152802
Tarawneh, Q., and Chowdhury, S. (2018). Trends of climate change in Saudi Arabia: implications on water resources. Climate 6:8. doi: 10.3390/cli6010008
Tarboton, D. G. (1997). A new method for the determination of flow directions and upslope areas in grid digital elevation models. Water Resour. Res. 33, 309–319. doi: 10.1029/96WR03137
Tellman, B., Sullivan, J. A., Kuhn, C., Kettner, A. J., Doyle, C. S., Brakenridge, G. R., et al. (2021). Satellite imaging reveals increased proportion of population exposed to floods. Nature 596, 80–86. doi: 10.1038/s41586-021-03695-w
Theilen-Willige, B., and Wenzel, H. (2019). “Natural Hazard assessment in Western Saudi Arabia using remote sensing and GIS methods” in Proceedings of 2nd international electronic conference on geosciences (Basel, Switzerland: MDPI), 6218.
Tomaszewski, B., Judex, M., Szarzynski, J., Radestock, C., and Wirkus, L. (2015). Geographic information Systems for Disaster Response: a review. J. Homel Secur. Emerg. Manage. 12:82. doi: 10.1515/jhsem-2014-0082
Vaghefi, S. A., Keykhai, M., Jahanbakhshi, F., Sheikholeslami, J., Ahmadi, A., Yang, H., et al. (2019). The future of extreme climate in Iran. Sci. Rep. 9:1464. doi: 10.1038/s41598-018-38071-8
Vinod Kumar, N., and Ganesh, L. S. (1996). An empirical analysis of the use of the analytic hierarchy process for estimating membership values in a fuzzy set. Fuzzy Sets Syst. 82, 1–16. doi: 10.1016/0165-0114(95)00227-8
Wang, M., Fu, X., Zhang, D., Chen, F., Liu, M., Zhou, S., et al. (2023). Assessing urban flooding risk in response to climate change and urbanization based on shared socio-economic pathways. Sci. Total Environ. 880:163470. doi: 10.1016/j.scitotenv.2023.163470
Wang, Y., Sun, D., Wen, H., Zhang, H., and Zhang, F. (2020). Comparison of random Forest model and frequency ratio model for landslide susceptibility mapping (LSM) in Yunyang County (Chongqing, China). Int. J. Environ. Res. Public Health 17:4206. doi: 10.3390/ijerph17124206
Ward, R. C., and Robinson, M. (1990). Principles of hydrology. New York: McGraw-Hill Publishing Company.
Winsemius, H. C., Aerts, J. C. J. H., van Beek, L. P. H., Bierkens, M. F. P., Bouwman, A., Jongman, B., et al. (2016). Global drivers of future river flood risk. Nat. Clim. Chang. 6, 381–385. doi: 10.1038/nclimate2893
Wondium, Y. K. (2016). Flood Hazard and risk assessment using GIS and remote sensing in lower awash sub-basin, Ethiopia. J. Environ. Earth Sci. 6, 69–86.
Xafoulis, N., Kontos, Y., Farsirotou, E., Kotsopoulos, S., Perifanos, K., Alamanis, N., et al. (2023). Evaluation of various resolution DEMs in flood risk assessment and practical rules for flood mapping in data-scarce geospatial areas: a case study in Thessaly, Greece. Hydrology 10:91. doi: 10.3390/hydrology10040091
Yang, S.-Y., Chang, C.-H., Hsu, C.-T., and Wu, S.-J. (2022). Variation of uncertainty of drainage density in flood hazard mapping assessment with coupled 1D–2D hydrodynamics model. Nat. Hazards 111, 2297–2315. doi: 10.1007/s11069-021-05138-1
Youssef, A. M., Sefry, S. A., Pradhan, B., and Alfadail, E. A. (2016). Analysis on causes of flash flood in Jeddah city (Kingdom of Saudi Arabia) of 2009 and 2011 using multi-sensor remote sensing data and GIS. Geomat. Nat. Haz. Risk 7, 1018–1042. doi: 10.1080/19475705.2015.1012750
Yousuf Gazi, M. D., Ashraful Islam, M. D., and Hossain, S. (2019). Flood-hazard mapping in a regional scale–way FORWARD to the future hazard ATLAS in Bangladesh. Malays. J. Geosci. 3, 1–11. doi: 10.26480/mjg.01.2019.01.11
Zhao, B., Zhang, L., Xia, Z., Xu, W., Xia, L., Liang, Y., et al. (2019). Effects of rainfall intensity and vegetation cover on Erosion characteristics of a soil containing rock fragments slope. Adv. Civil Eng. 2019, 1–14. doi: 10.1155/2019/7043428
Ziwei, L., Xiangling, T., Liju, L., Yanqi, C., Xingming, W., and Dishan, Y. (2023). GIS-based risk assessment of flood disaster in the Lijiang River basin. Sci. Rep. 13:6160. doi: 10.1038/s41598-023-32829-5
Keywords: flood susceptibility, fuzzy analytical hierarchy process, fuzzification, NEOM, Saudi Arabia
Citation: Bokhari BF, Tawabini B and Baalousha HM (2024) A fuzzy analytical hierarchy process -GIS approach to flood susceptibility mapping in NEOM, Saudi Arabia. Front. Water. 6:1388003. doi: 10.3389/frwa.2024.1388003
Edited by:
Akhouri Pramod Krishna, Birla Institute of Technology, IndiaReviewed by:
Quoc Bao Pham, University of Silesia in Katowice, PolandZerouali Bilel, University of Chlef, Algeria
Safi Ullah, King Abdullah University of Science and Technology, Saudi Arabia
Copyright © 2024 Bokhari, Tawabini and Baalousha. This is an open-access article distributed under the terms of the Creative Commons Attribution License (CC BY). The use, distribution or reproduction in other forums is permitted, provided the original author(s) and the copyright owner(s) are credited and that the original publication in this journal is cited, in accordance with accepted academic practice. No use, distribution or reproduction is permitted which does not comply with these terms.
*Correspondence: Barra Faisal Bokhari, baraabokhari@gmail.com