 Ravindra Dwivedi1*
 Joel A. Biederman1
 Patrick D. Broxton2
 Jessie K. Pearl3Kangsan Lee4Bohumil M. Svoma5Willem J. D. van Leeuwen2,4Marcos D. Robles3
- 1USDA-ARS, Tucson, AZ, United States
- 2School of Natural Resources and the Environment, The University of Arizona, Tucson, AZ, United States
- 3The Nature Conservancy, Tucson, AZ, United States
- 4School of Geography, Development and Environment, The University of Arizona, Tucson, AZ, United States
- 5Salt River Project, Phoenix, AZ, United States
Across the western United States, forests are changing rapidly, with uncertain impacts on snowmelt water resources. Snow partitioning is controlled by forest effects on interception, radiation, and sublimation. Yet, models often lack snow measurements with sufficiently high spatial and temporal resolution across gradients of forest structure to accurately represent these fine-scale processes. Here, we utilize four Snowtography stations in Arizona, in the lower Colorado River Basin, with daily measurements over 3–5 years at ~110 positions distributed across gradients of forest structure resulting from wildfires and mechanical thinning. We combine Snowtography with lidar snapshots of forest and snow to train a high-resolution snow model and run it for 6 years to quantify how forest structure regulates snowpack and snowmelt. These study sites represent a climate gradient from lower/warmer ephemeral snowpack (~2,100 m asl) to higher/colder seasonal snowpack (~2,800 m asl). Forest cover reduced snowpack and snowmelt through canopy sublimation. Forest advanced snowmelt timing at lower/warmer sites but delayed it at higher/colder sites. Within canopy gaps, shaded cool edges had the greatest peak snow water equivalent (SWE). Surprisingly, sunny/warm gap edges produced more snowmelt than cool edges, because high radiation melted snow quickly, reducing exposure to sublimation. Therefore, peak SWE is not an ideal proxy for snowmelt volume from ephemeral snowpacks, which are becoming more prevalent due to warming. The results imply that forest management can influence the amount and timing of snowmelt, and that there may be decision trade-offs between enhancing forest resilience through delayed snowmelt and maximizing snowmelt volumes for downstream water resources.
1 Introduction
Snowmelt from montane forests is important both for resilient forests and downstream water supplies across western North America (Viviroli and Weingartner, 2004; Barnett et al., 2005; Bales et al., 2006; Grant et al., 2013; Mountain Research Initiative EDW Working Group, 2015; Musselman et al., 2021; Zhang et al., 2021). While winter weather is the dominant control of snowpack water supplies, the amount and timing of snowmelt are strongly influenced by trees, which intercept snowfall, provide shelter from sun and wind, and emit thermal radiation (Varhola et al., 2010; Broxton et al., 2021; Roebroek et al., 2023). With rising temperatures, forests are experiencing unprecedented transformation due to drought, insect infestation, and wildfire, and land managers are applying large-scale forest treatments that generally reduce canopy cover to increase forest resilience to disturbances (Barnett et al., 2005; Robles et al., 2014; Udall and Overpeck, 2017; McCauley et al., 2019; Lopes et al., 2020; Sankey et al., 2020; Musselman et al., 2021; Dungan, 2023; Ebel et al., 2023; McDowell et al., 2023). Reduced tree cover can suppress evaporative losses and decrease subsequent soil moisture stress for trees (Frank et al., 2019; O'Donnell et al., 2021; Sankey and Tatum, 2022; Knowles et al., 2023), although exposure to sun and wind can drive counteracting increases in surface evaporation and sublimation (Biederman et al., 2014; Harpold et al., 2014a). At the basin scale, snowmelt-driven streamflow shows a wide range of responses to forest reduction including increases, decreases, and no detectable changes (Biederman et al., 2015; Goeking and Tarboton, 2020; Manning et al., 2022). Attempts to disentangle these complicated hydrologic signals have identified watershed-specific factors regulating response including topography, soil characteristics, seasonal (de)coupling of snowmelt and vegetation activity with warming climate, and the three-dimensional geometric arrangement of remaining forest canopy (i.e., clusters and gaps) (Barnhart et al., 2016; Currier and Lundquist, 2018; Sexstone et al., 2018; Robles et al., 2020; McDowell et al., 2023). This study addresses the last two factors: how mosaics of three-dimensional forest structure regulate sublimation and the amount and timing of snowmelt across a climatic gradient of field sites.
It is well-recognized that fractional forest cover is predictive of snow dynamics across a wide range of spatial scales (Troendle and Reuss, 1997; Ffolliott et al., 2000; Molotch et al., 2009; Biederman et al., 2012; Dwivedi et al., 2022). However, numerous field-based and modeling studies have also demonstrated the importance of canopy spatial arrangement; specifically, the three-dimensional forest structure creates distinct environments for snow accumulation and ablation through tree impacts on snow distribution, wind, and radiation balance (Golding and Swanson, 1986; Musselman et al., 2008; Gustafson et al., 2010; Broxton et al., 2014; Moeser et al., 2020; Dickerson-Lange et al., 2023). Recent efforts have focused on classifying the landscape into distinct snow environments created by position with respect to nearby vegetation using algorithms calibrated with high-resolution maps of snow depth and forest structure (Currier and Lundquist, 2018; Mazzotti et al., 2020b; Broxton et al., 2021). Following these efforts, here the term “under canopy” designates areas under relatively contiguous canopy and removed from edge effects. All areas not under canopy are considered “uncovered” and divided further into four classes: open areas far from forest, cool edges shaded by nearby forest to the south, warm edges exposed to sunlight and thermal radiation by nearby forest to the north, and overlapping edges, which are small gaps that have nearby canopy to the north as well as south. Snow environment classification can improve representation of forest structure impacts on snow accumulation and ablation within hydrologic or land surface models. Furthermore, when snow environments provide a useful framework for prediction of snowmelt water inputs, they can be readily translated into forest management prescription goals.
Despite the well-recognized importance of 3-D forest structure, there is insufficient quantitative understanding of the impacts of forest structure on snowpack and water that can be generalized across landscapes and climatic zones (Lundquist et al., 2021). Hydrologic models are capable of representing snow-forest interactions at high resolution temporally (hourly) and spatially (1 m) [e.g., Snow physics and lidar mapping (SnowPALM); Broxton et al., 2014, Flexible Snow model; Mazzotti et al., 2020a]. Since forest-snow mechanisms such as interception and shading vary at such fine scales, these high-resolution models are expected to improve understanding and prediction of snowmelt water supplies under changing climate and forest conditions (Barnett et al., 2005; Barnhart et al., 2016, 2020; Winchell et al., 2016; Musselman et al., 2017, 2021). However, a spatiotemporal gap in field observations often limits model training for accurate process representation. SNOTEL stations provide highly resolved temporal data at single points in open clearings but provide no data about forest canopy effects and usually have high bias compared to surrounding snowpack (Harpold et al., 2012; Broxton et al., 2019; Dwivedi et al., 2022). Highly resolved snow maps are available from airborne platforms; however, these are often infrequent and/or limited with respect to under-canopy measurement (Harpold et al., 2014b; Painter et al., 2016). Such snapshot maps provide a single target for calibrating a high-resolution model over an entire winter, limiting model training for temporal patterns of hydrologic processes regulating snow accumulation and ablation. To address this spatiotemporal gap, here multi-year lidar snow depth maps are combined with multi-year datasets of daily snow depth in many point locations across the mosaic of snow environments resulting from forest structure collected by Snowtography (Broxton et al., 2020; Payton et al., 2021; Dwivedi et al., 2022; Strickfaden et al., 2023), across a climatic gradient of sites. Since winter rainfall can be an important moisture input at the warmer sites, this analysis accounts for liquid water inputs (LWI) produced by the combination of snowmelt and rain inputs (Gordon et al., 2022), which is also sometimes referred to as the net water input (Dwivedi et al., 2022) or surface water input (Hale et al., 2023).
The literature on forest—snow interactions is extensive for seasonal snowpacks that do not have substantial ablation during the winter (Pomeroy and Schmidt, 1993; Hedstrom and Pomeroy, 1998; Pomeroy et al., 1998; Clark et al., 2011; Harder and Pomeroy, 2013; Raleigh et al., 2015; Pomeroy and Musselman, 2017; Jennings et al., 2018; Barnhart et al., 2020). However, much less is known about forest-snow-water relations at warmer sites with ephemeral snowpacks exhibiting partial or complete midwinter ablation, often with high spatial heterogeneity related to surrounding forest structure (Petersky and Harpold, 2018; Petersky et al., 2019; Dwivedi et al., 2022). Meanwhile, widespread winter warming increases the prevalence and importance of ephemeral snowpacks, especially in lower latitudes, at lower elevations, and in locations with substantial winter rain (Musselman et al., 2021; Siirila-Woodburn et al., 2021). Some traditional methods and assumptions of snow hydrology may not apply with ephemeral snowpacks (Jennings et al., 2018; Gordon et al., 2022; Strickfaden et al., 2023), such as the focus on peak snow water equivalent (peak SWE) as a proxy of snowmelt water supplies. Furthermore, ephemeral snowpack sites typically have patchy snow cover and highly variable snow cover duration (Dwivedi et al., 2022; Gordon et al., 2022). A key knowledge gap about ephemeral snowpacks is how the shortened duration of snow cover at the land surface affects the fraction of water lost to sublimation and how this varies spatially across the forest mosaic.
This study tests the following two hypotheses across a site climatic gradient from ephemeral to seasonal snowpacks at sites with important within-site variability in forest structure: (H1) Liquid water inputs will be maximized at shaded cool edges of forest gaps and minimized at warm edges, such that LWI amount rankings are cool edge > overlapping edge > open > warm edge > under canopy. We expect this ranking to be controlled by canopy interception and snowpack sublimation driven by forest structure controls on net radiation, which is presumed greatest at warm edges and least at cool edges. H1 is consistent with field observations of snow depth, SWE, and snow cover duration (Musselman et al., 2008; Currier and Lundquist, 2018). (H2) Three-dimensional forest structure will have greater impacts on peak SWE and LWI at sites and/or during winters with longer snow cover duration, due to greater integration time over which forest structure can influence spatial variability in snowpack sublimation. These hypotheses are tested using SnowPALM, a forest hydrology model operating at a spatial resolution of 1-m, which is suitable for representing individual trees and capturing the effects of 3-D forest structure on snowpack and LWI. The model is trained using a combination of SNOTEL, Snowtography daily snow depth, and lidar maps of snow depth and canopy height and density. This research is conducted at four field sites representing a climatic gradient from ephemeral to persistent seasonal snowpacks due to site differences in elevation, amounts of snowfall and rain, and temperature. The trained model is run over six winters with widely varying winter climate. Three-dimensional model estimates of LWI are compared with a previously published one-dimensional modeling approach (i.e., based on forest cover, without considering forest geometry; Dwivedi et al., 2022), as is commonly used in hydrological and ecological models (Clark et al., 2011; Ren et al., 2021). The results are interpreted in the context of snow environments created by forest structure to identify spatial arrangements most likely to conserve water availability for vegetation and downstream water supply.
2 Field sites
The four field sites are located in the headwaters of the Salt-Verde River Basin, which provides water supply and hydropower for Phoenix Metropolitan area and surrounding agricultural lands in Arizona, United States (Larson et al., 2005; Demaria et al., 2017) (Figure 1). The sites are located across a range of elevation and have different degrees of snow persistence, with site 1 having the least persistent snowpack (i.e., most common winter ablation), and site 4 having the most persistent snowpack (Figure 1; Supplementary Figure S1). Forest cover and structure vary among and within sites due to a variety of factors including wildfire and mechanical thinning. Sites 3 and 4 have been the subject of recent work developing Snowtography workflows and quantifying how one-dimensional forest cover predicts snowpack dynamics, liquid water inputs, root zone water stress, and deep percolation (Dwivedi et al., 2022, 2023).
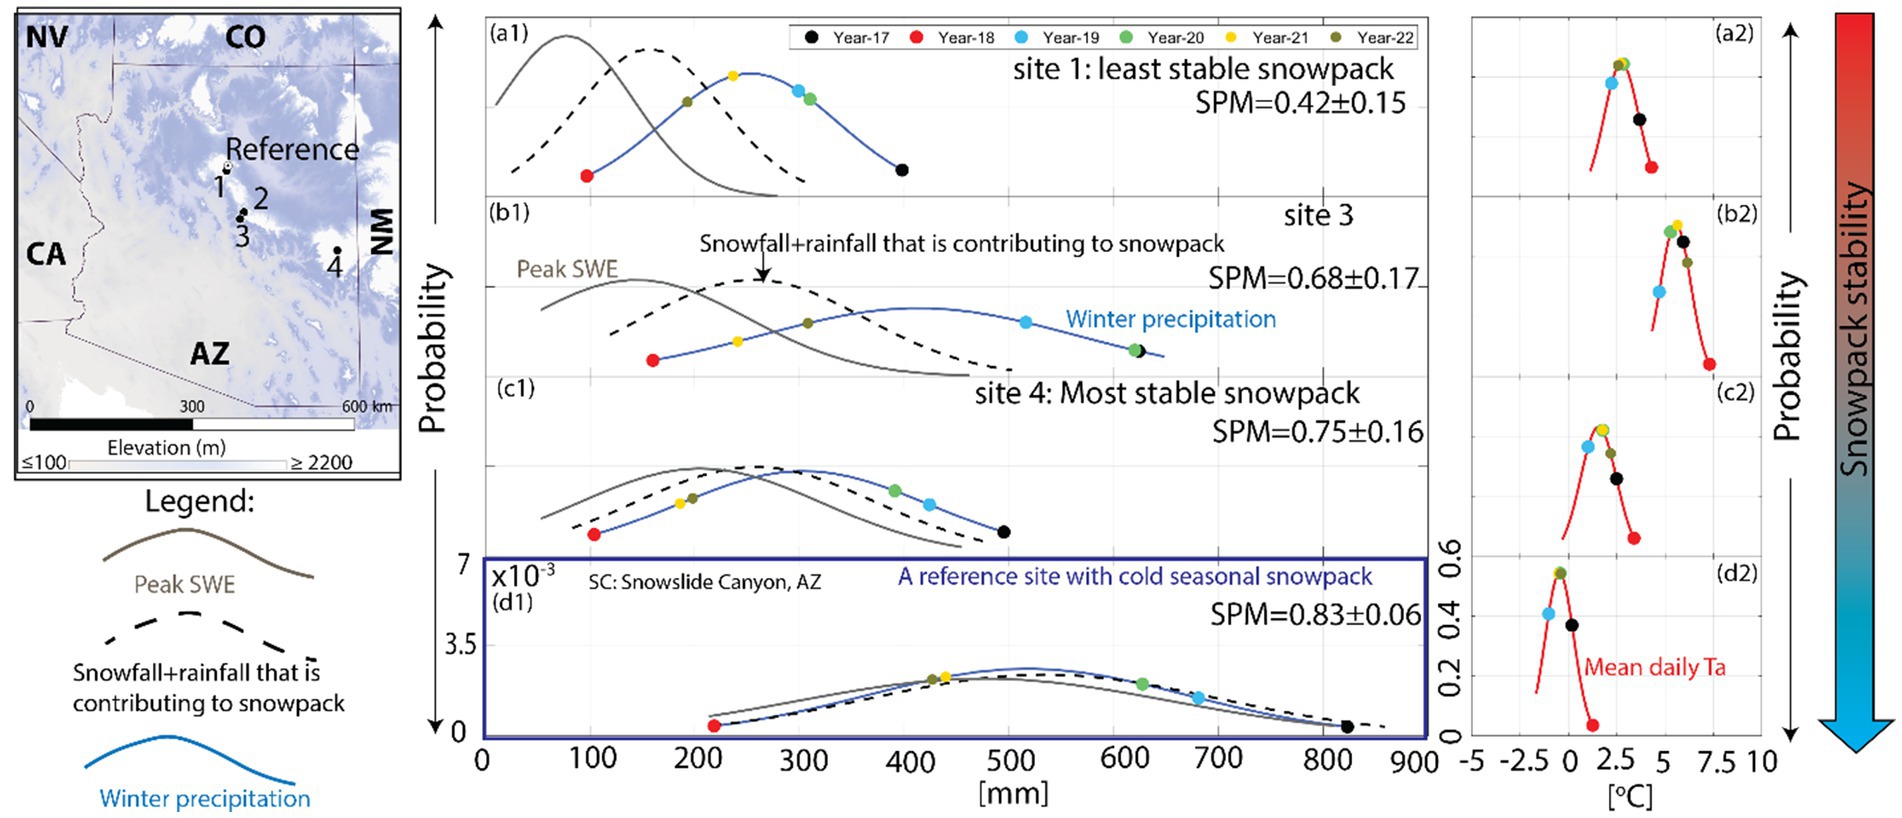
Figure 1. Location of the field sites in Arizona (left), and probability density functions (PDF) of Nov-Apr precipitation (P), positive SWE increments due to snowfall and rain absorbed by snowpack (+ΔSWE), and peak SWE for three of the four field sites (a1, b1, and c1). For reference, a nearby cold site with stable seasonal snowpack is presented (d1). Weather conditions for study years 2017–2022 are indicated on PDFs with colored dots. SPM is a snowpack persistence metric defined in Section 4.1. The right column shows the PDF of mean daily air temperature at each site (a2, b2, c2, and d2). PDFs represent SNOTEL data for 2009–2022, and site 2 (with modeled SSM = 0.62 ± 0.09; Supplementary Figure S1) is not shown due to lack of local SNOTEL.
Snow persistence increases with cooler temperatures and/or greater snowfall (Figure 1). Sites with lower persistence show a larger spread between winter precipitation and peak SWE due to greater prevalence of winter rainfall and more midwinter SWE ablation. The nearby reference site [Figure 1, (d1)] shows total winter precipitation, precipitation that contributes to snowpack, and peak SWE all nearly overlapping, indicating little to no rainfall and minimal winter ablation. This reference site illustrates winter precipitation and snow dynamics typical of historically more well-studied sites with persistent seasonal snowpacks and is shown to highlight the differing dynamics of ephemeral snowpack sites in this study.
Site 1 has a recently thinned forest (2018), consisting of mainly Ponderosa pine (Pinus ponderosa) with minor amounts of Gambel oak (Quercus gambelii) and Rocky Mountain juniper (Juniperus scopulorum) totaling 17% canopy cover or CC (canopy height > 2 m in lidar map) (Belmonte et al., 2022) (Table 1). It is also the driest of the four sites with 241 mm of mean winter precipitation (P, Nov-Apr) and 529 mm of mean potential evaporation (PET), but is also relatively cool, with a mean winter air temperature (Ta) of 3°C (Table 1). Site 1 contains two study plots spaced apart about 500 m, so they are shown separately in figures herein: 1a is entirely comprised of mechanically thinned forest with 17% canopy cover (herein, “CC”; height > 2 m in lidar map), and site 1b contains both thinned and untreated forest with canopy cover of 23% (Table 1). Site 2 has a similar climate to site 1 (winter mean Ta = 3°C and p = 284 mm) and is dominated by Ponderosa pine (CC = 31%). The northern ~50% of site 2 was mechanically thinned in 2017, while the southern half has no recorded disturbance. These areas are adjacent to one another, so site 2 is treated as a single, contiguous study plot.
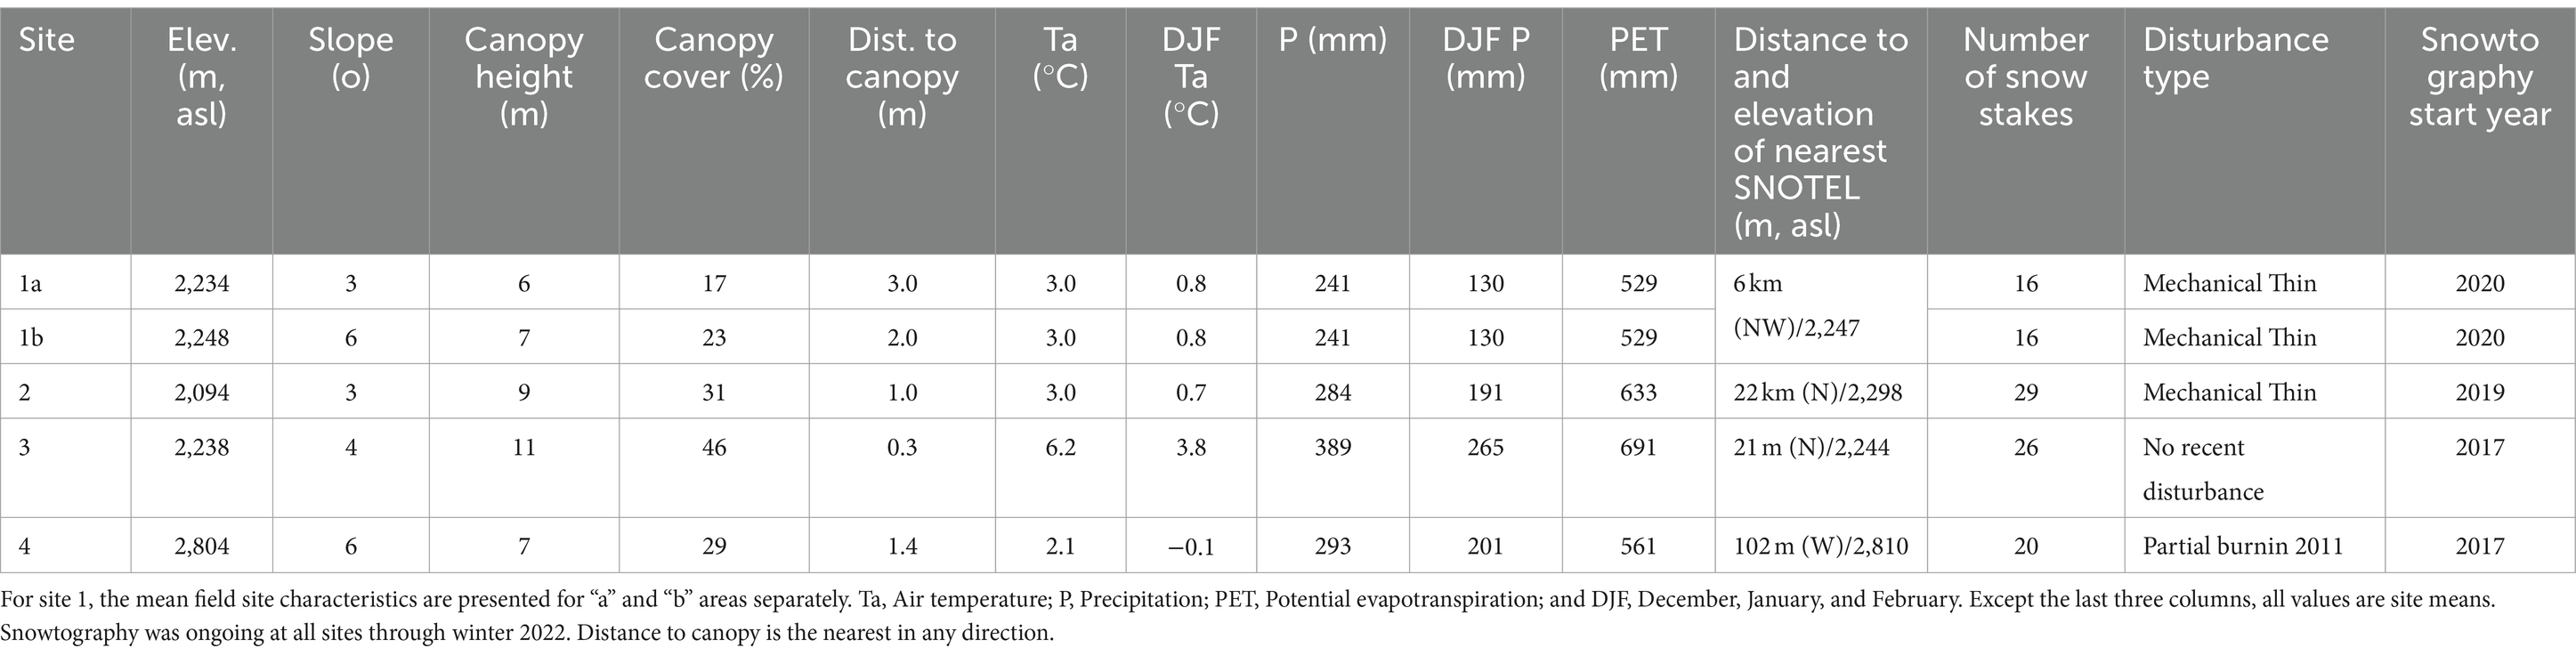
Table 1. Mean climatic, topographic, and forest characteristics for the November through April period from years 2017 through 2022.
Site 3 is the warmest of the four study sites (winter mean Ta = 6.2°C), but since it has the greatest average winter precipitation (389 mm), it has a more persistent snowpack than sites 1 and 2 (Figure 1; Table 1). Site 3 has CC = 49% consisting of mostly ponderosa pine with a few Douglas fir (Pseudotsuga menziesii) and Gambel oak (Broxton et al., 2020). Site 4 is the highest and coldest site with mean winter Ta = 2.1°C, giving it the most persistent snowpack despite its receiving ~100 mm less winter precipitation than site 3. Canopy cover averages 29% at site 4 and is composed of dry mixed conifer forest interspersed with mountain meadows (Broxton et al., 2020).
3 Data
3.1 Meteorological forcing
Meteorological data come from SNOTEL stations and NLDAS Phase-2 (Xia et al., 2012; NLDAS project, 2021) downscaled spatially and to account for local topography and forest structure using built-in routines in SnowPALM (Broxton et al., 2014). Sites 3 and 4 are collocated with SNOTEL stations 308 and 617, respectively, which provide local air temperature and precipitation. For sites 1 and 2, air temperature and precipitation forcing data are developed using nearby SNOTEL measurements (Table 1) adjusted using regression relationships with locally-measured values of precipitation and air temperature made over 1–2 years (Geonor T200B wind-fenced weighing precipitation gage, radiation-shielded Type T thermocouple). At all sites, relative humidity, barometric pressure, wind speed, wind direction, downward shortwave and longwave radiation, and potential evapotranspiration come from the downscaled NLDAS data. While site-level weather forcing data are generally preferred, NLDAS data downscaled within SnowPALM agreed well with the available ground measurements of air temperature, humidity, and precipitation. Furthermore, model calibration to Snowtography-observed snow depths showed that NLDAS-data can be useful as model forcing to simulate snowpack dynamics at the high spatial resolution required to diagnose forest structural effects (see results below).
3.2 Snowtography snow depth
At each site, a network of automated trail cameras is maintained (Moultrie model M-999i, Campark model T180, and Wasoda Trail Camera model G300, all with time-lapse programmability) collecting photographs of snow depth measurement stakes (Snowtography) to generate daily time series of snow depth (Broxton et al., 2019, 2020; Payton et al., 2021; Dwivedi et al., 2022). Snowtography stakes (n = 16–29 per site) are spaced 5 m apart along transects that span forest stand and gaps in cardinal directions to capture spatiotemporal differences of snow accumulation and ablation due to differences in shading (along north–south transects) and wind (along east–west transects). Snow depth at each stake is measured using repeat photography that is interpreted manually. Snow stakes are marked with alternating red and white bandsone inch tall (~2.5 cm), and the estimated uncertainty of the measurement is ±1 cm. During 1–2 days after snowstorms, small snowdrifts (1–3 cm) can occur against the snow stakes, while during prolonged dry periods, small depressions (1–3 cm) can form around each stake, presumably due to altered radiation balance. In such cases, technicians are directed to interpret the snow depth of the neighborhood (~1 m radius, congruent with the resolution of SnowPALM modeling). Snowtography measurements began between 2017 and 2020 and run through winter 2022 for this study, providing 3–6 years of daily snow depths per site (Table 1).
3.3 Lidar maps of canopy and snow depth
Airborne lidar data were mostly collected using low-altitude airplanes. Snow-off lidar data were collected by Quantum Spatial, Inc. between 2013 and 2020 (Quantum Spatial Inc., 2013, 2014, 2020). Snow-on lidar collections were conducted on February 1, 2017, March 7, 2017, and March 4, 2019 at sites 2, 3, and 4 (van Leeuwen and Quantum Spatial Inc., 2017; Quantum Spatial Inc., 2019). At Site 1, snow-on lidar was collected on February 10, 2023 using a DJI Matrice 600 Pro drone with a DJI Zenmuse L1 Lidar+RGB sensor. Following our previous studies (Broxton et al., 2019; Dwivedi et al., 2022), maps of canopy height, canopy cover, and ground elevation were prepared at 1-m spatial resolution using Fusion software (McGaughey, 2020). Snow depth maps were created by differencing the ground returns from snow-on and snow-off lidar collections. Lidar-based spatial snow depth maps were previously bias corrected using manually sampled snow depths during field campaigns (Broxton et al., 2019). On the lidar flight dates, RMSE between lidar and Snowtography depths ranged from 7 to 13 cm (Supplementary Figure S2).
4 Methods
4.1 Snow persistence and temporal definitions
Previous works suggest several metrics for classifying snowpack stability (Sturm et al., 1995; Fierz et al., 2009; Hammond et al., 2018; Petersky and Harpold, 2018; Musselman et al., 2021). Their application to the present sites was challenging due to lack of data such as snow grain size, shape, microstructure, hardness, liquid water content, and high-resolution satellite data. Here a simple snow persistence metric (SPM) was defined based on daily SWE that is the ratio of days with minimal snowpack ablation (<5 mm/day) between the first and last days with SWE > 2.5 mm (Uecker et al., 2020). High SPM indicates persistent, seasonal snowpack while low SPM indicates ephemeral snowpack. Cumulative and mean radiation values for each model pixel were calculated using days with snow cover, which varies by model pixel, to quantify the energy balance over snowpack. To assess net hydrologic impacts of forest structure, mass fluxes were computed by SnowPALM daily and then aggregated at each pixel over a winter duration computed for each site and year from the first day of snow cover ≥99% of site pixels until the last day of snow cover ≥1%, where snow cover is defined by SWE > 2.5 mm. In this paper, the traditional hydrologic year definition is applied, meaning that references to the day of year are counted from October 1.
4.2 Snow environments created by forest structure
Following Mazzotti et al. (2020a), each 1-m pixel at each study site was classified into one of five snow environments created by the structure of surrounding forest: Under canopy (UC): canopy cover >10% for canopy height > 2 m; Cool Edge (CE): uncovered but shaded by nearby canopy to the south; Warm Edge (WE): uncovered, exposed to solar radiation from the south, and near canopy to the north; Overlapping Edge (OE): small forest gaps with nearby canopy to both north and south; and Open (O): uncovered and far from canopy. This approach was refined for the present study sites using cool edge and warm edge lengths of 10 and 5 m, respectively, based on observed daily ablation rates following several significant snowstorms within our Snowtography datasets (Supplementary Figure S2). Therefore, pixels that were both within 10 m to the north of canopy and within 5 m to the south of canopy were classified as Overlapping Edge.
4.3 Snow physics and lidar mapping model
The SnowPALM model (Broxton et al., 2014) was used to represent 3-D mass and energy balance of the snowpack and canopy environment at 1 m spatially and a daily time step. SnowPALM recently assessed the impact of forest thinning and wildfire on snowpack in conifer forests (Harpold et al., 2020; Krogh et al., 2020; Moeser et al., 2020). Important features of SnowPALM include evaporation and sublimation from canopy, snowpack, and wet soils, geometrically explicit interactions of solar radiation with canopy height and density (i.e., shadowing), canopy temperature and resulting longwave radiation balance, and influences of local topography and canopy on wind distribution of snowfall, using an adaptation of the landscape wind index approach (Winstral and Marks, 2002). SnowPALM considers trees as having uniform cross-section for their full height, extending vertically from the canopy height model to the ground, with constant density (i.e., from 1 to 100% closure) determined from the canopy density map. In this sense, SnowPALM parameterizes trees based on the information available from airborne lidar, and it does not explicitly consider the 3-D canopy morphology over the full tree height, which is generally only feasible for smaller spatial extents (Russell et al., 2021; Hojatimalekshah et al., 2023). The model was calibrated using snow throughfall, snow depth, and canopy snow storage (for details see Section S1 in Supplementary material). Prior work comparing ground measurements georeferenced using differential GPS systems with airborne lidar snow depth maps suggested that the uncertainty in lateral positioning was <1 m lidar (Broxton et al., 2019, Figure 6), providing good confidence for matching lidar and snowtography data to model pixels. During ground-based field surveys at site 4, replicate samples of snow depth (n = 5) collected within a 1-m radius have an average standard deviation of 6–7 cm [among sets of five replicates indicated as black dots in Broxton et al. (2019), Figure 6]. This is considered an upper estimate of the uncertainty involved in representing a 1-m square model pixel with a single snowtography stake, because 1-m radius is larger than 1-m square and spatial variability in snow depth tends to be greatest at site 4 with the most persistent snowpack. Due to the complexity of the SnowPALM model, calibration was performed manually using the modified Kling-Gupta Efficiency (KGE’; Gupta et al., 2009) and the spatial efficiency metric (SPAEF; Koch et al., 2018) to assess model fit compared with time series measurements from Snowtography and lidar snow depth maps, respectively. Both KGE’ and SPAEF range from −∞ (for the worst fitting model) to 1 (for the best fitting model). The final trained model has a unique parameter set for each site that was held constant across all study years.
The trained models were run for winters 2017 through 2022 at all sites. For sites 1 and 2, where forest thinning occurred during the model simulation period but before the Snowtography or lidar measurements, the post-thinning forest structure from lidar was used (section 3.3). The effects of snow environment with respect to canopy were evaluated with one-way ANOVA and multiple comparison of group means (MATLAB functions anova1 and multcompare).
4.4 Liquid water input
Daily liquid water input (LWI) was computed as the sum of rainfall that does not contribute to snowpack (Dwivedi et al., 2022) and snowmelt computed by the model. LWI and other mass fluxes (e.g., canopy, snowpack, and total sublimation) were only computed for winter, defined using snow cover (see section 4.1). At sites 3 and 4, LWI was previously estimated using 1-D point runs of the Snow-17 model at each Snowtography stake using 1-D canopy cover for 2018–2020 (Dwivedi et al., 2022). Here, the results of this 1-D Snow-17 LWI modeling are extrapolated across each site using canopy cover at each 1-m snow pixel. The site mean and spatial variability of LWI were then compared for the 1-D canopy-cover based estimates vs. the spatially explicit 3-D SnowPALM model for the warm/dry year 2018 and cool/wet year 2019.
5 Results
5.1 Snow environments created by forest structure
The relative abundance of each of the five snow environments varies due to forest structure (Figure 2). Site 3 is the only site with no known disturbance for at least several decades and accordingly has the greatest fraction under canopy (78%). Much of the remaining area at site 3 is small gaps classified as overlapping edges (12%). Mechanical thinning occurred within the last 5–10 years throughout site 1a, the southwest portion of site 1b, and the northern half of site 1, which has resulted in a “clump/gap” forest structure at this site (Belmonte et al., 2019). Approximately half of sites 1 and 2 are covered by canopy, with the remaining area distributed among open area and cool, warm and overlapping edges. The southern portion of Site 4 was moderately affected by 2011 wildfire and has a similar mix of snow environments as sites 1 and 2. In the following analyses, results are summarized by snow environments for each site.
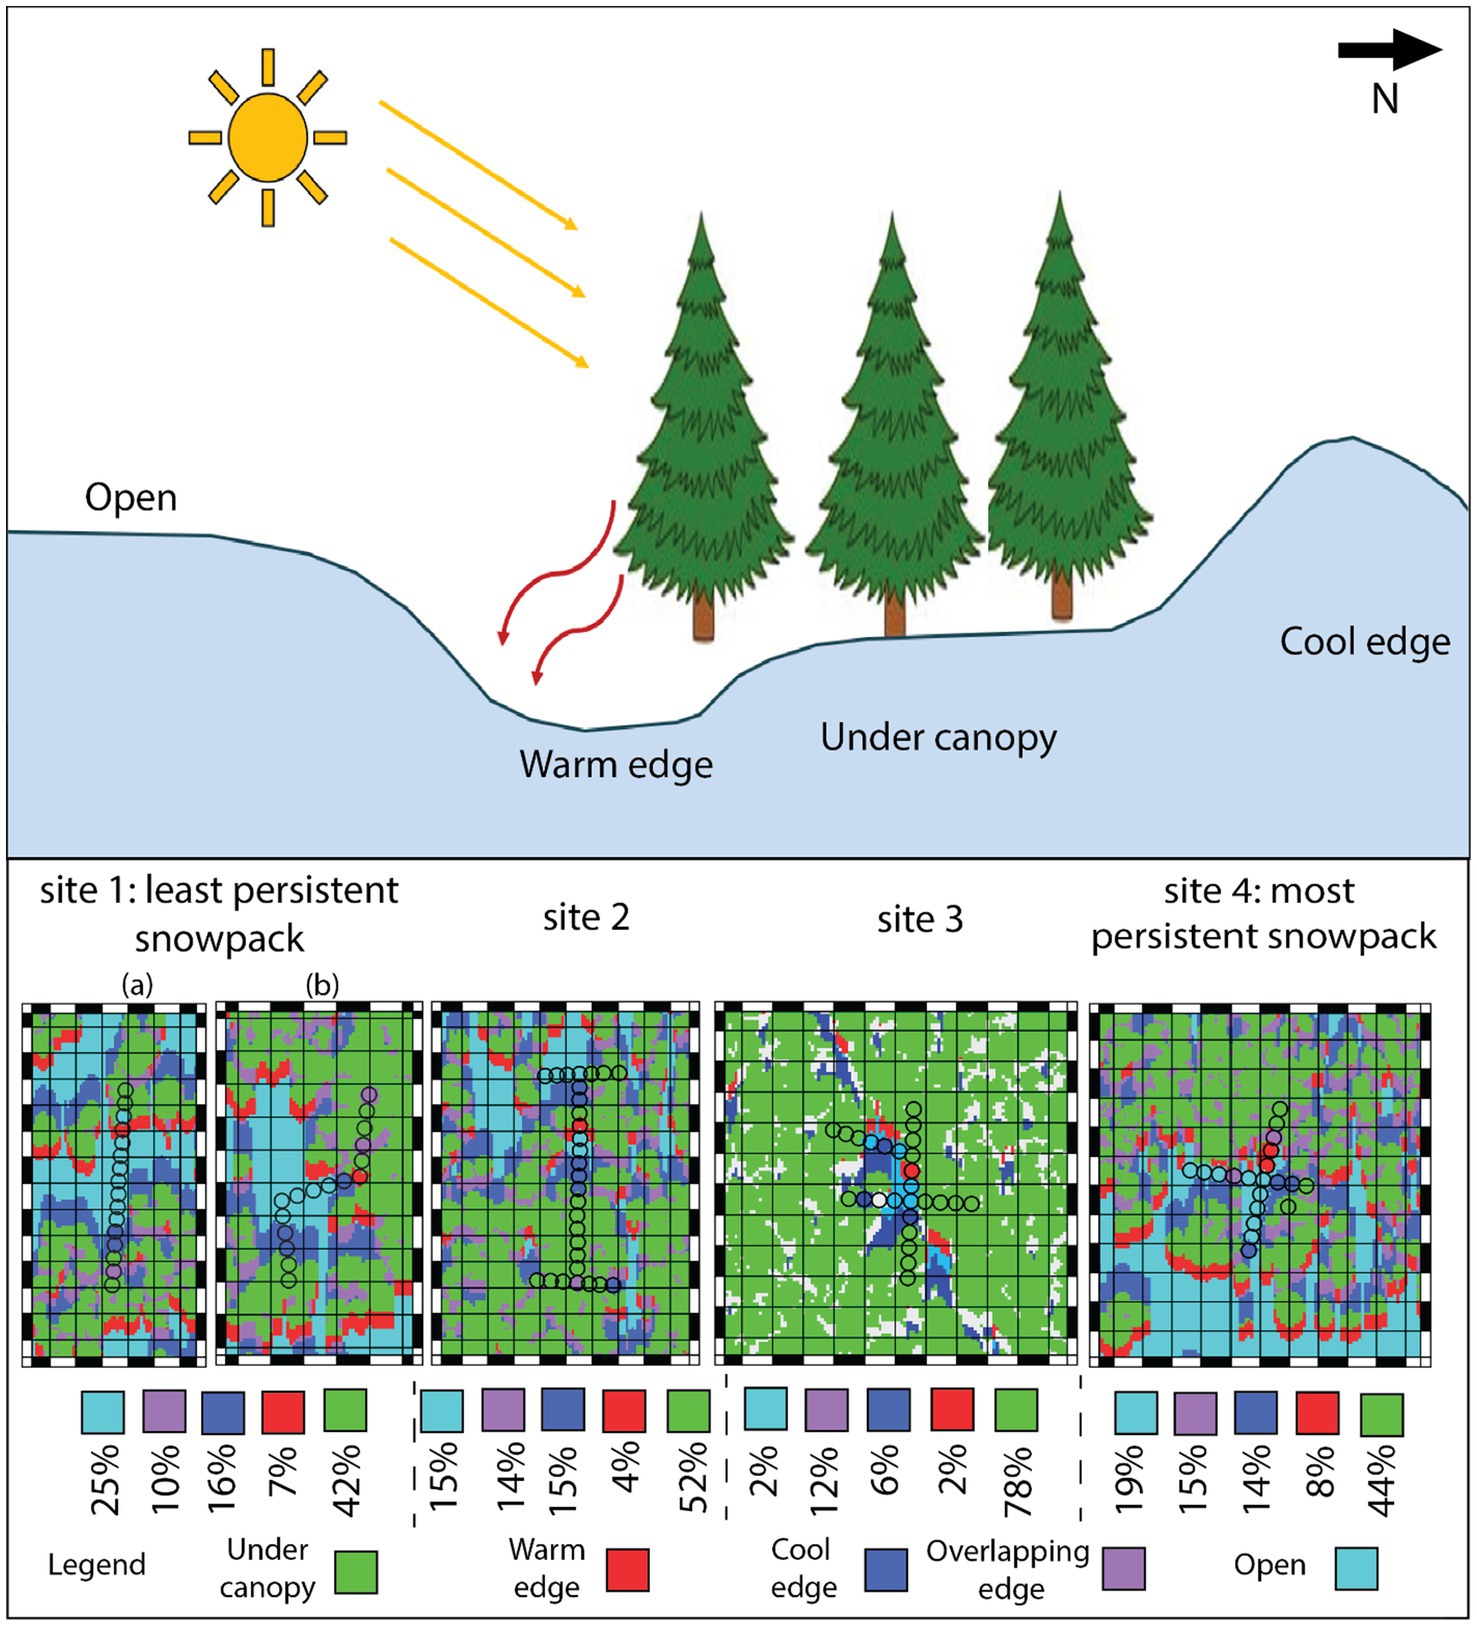
Figure 2. Spatial distribution of the snow environments related to forest structure at each field site. Snowtography stakes are shown by open circles, and percentages indicate the abundance of each snow environment. Overlapping edges are small gaps with forest nearby to both north and south. Sites are organized from left for the least persistent (1) to the most persistent (4) snowpack. In the top illustration, yellow and red lines suggest shortwave and longwave radiation, and blue area is snowpack.
5.2 SnowPALM model performance
Snow physics and lidar mapping simulates the observed daily snowpack dynamics at the Snowtography measurement locations in each snow environment. The observed and simulated snow depth patterns for an intermediate winter (Figure 1), 2020, are shown (Figure 3, see Supplementary Figures S4, S5 for other years). Snow disappearance date is generally accurate within ±2 days. For several 2020 events at sites 3 and 4, modeled snow depth increases exceed observed increases, likely due to model overestimation of snow/rain fraction and/or underestimation of snowfall density. Fortunately, the resulting small data-model residuals tend to be consistent for all snow environments across a site, and therefore the model results remain useful for quantifying the impacts of 3-D forest structure. Ablation rates are generally well-predicted.
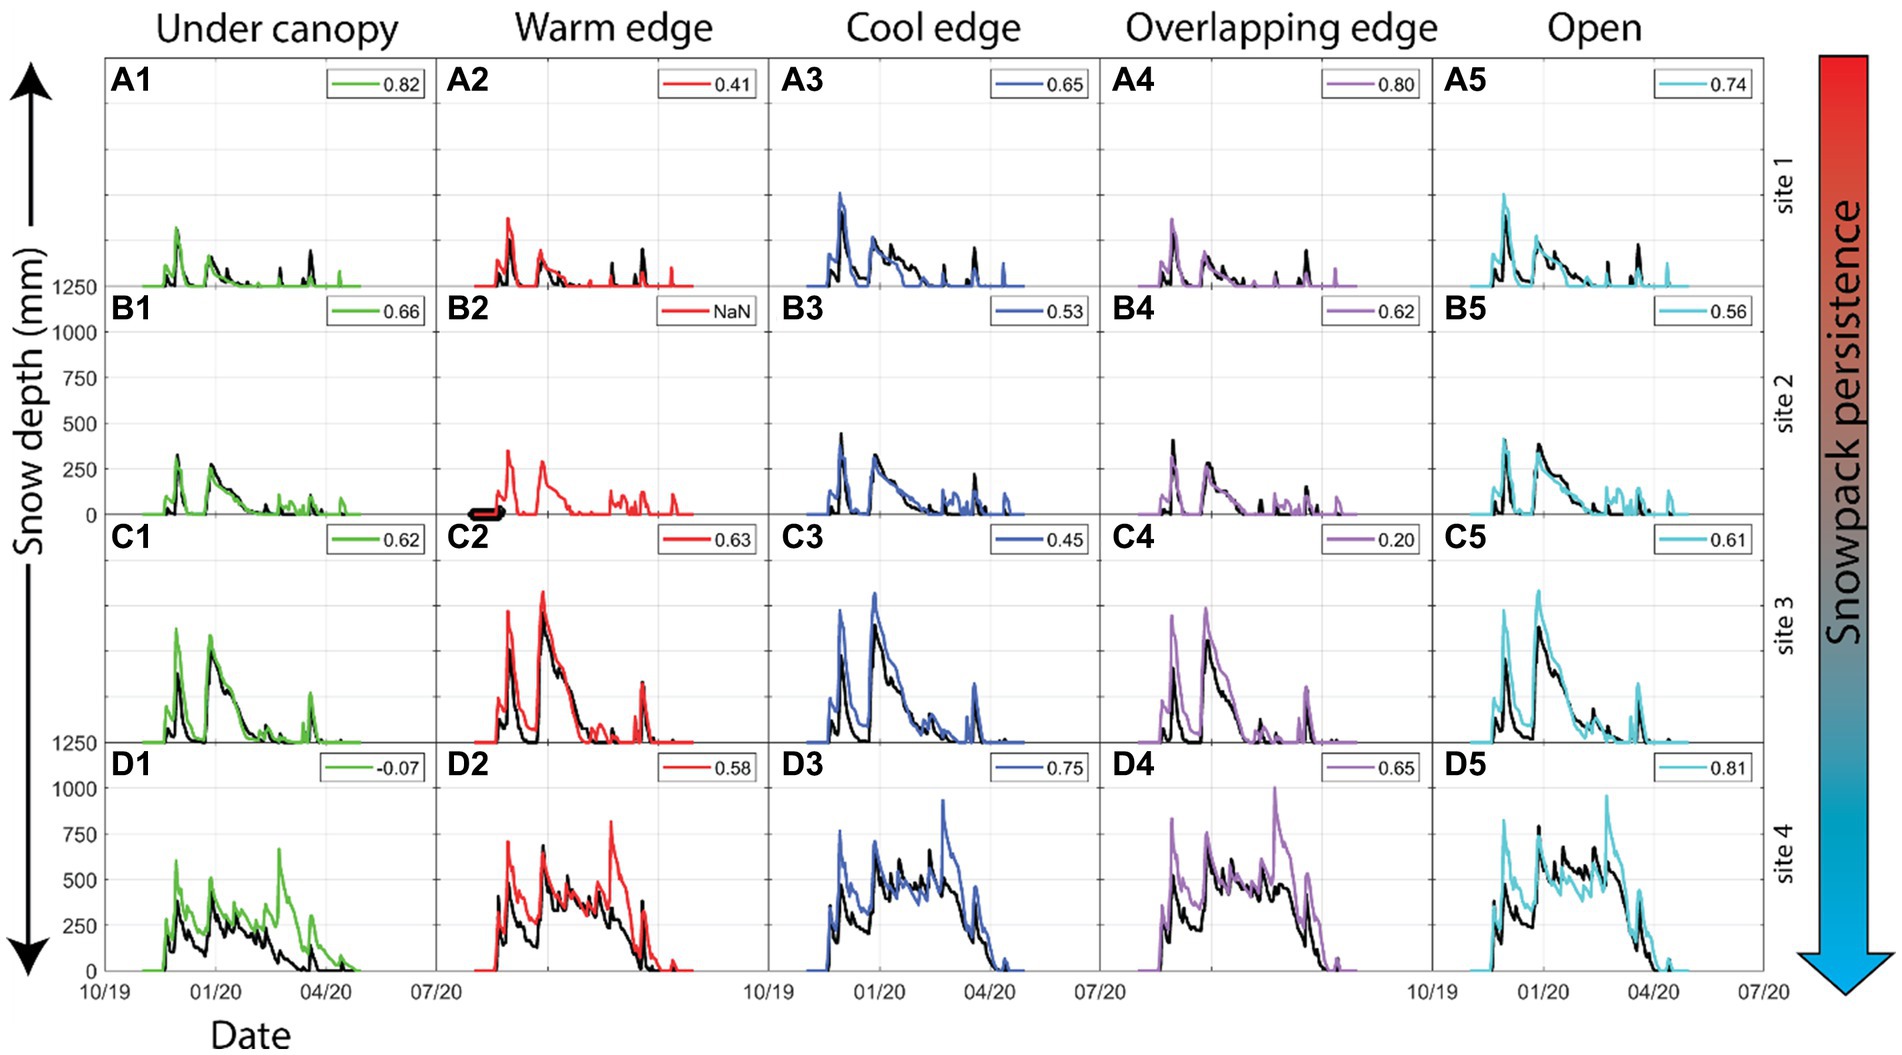
Figure 3. Observed (black line) vs. simulated snow depth for all Snowtography stakes in each snow environment at each site during winter 2020, which had intermediate weather and continuous data from all field sites. The ranges of X- and Y-axes are consistent in scale across all plots and therefore labels are only shown in plot d1. KGE’ (modified Kling-Gupta Efficiency) values are shown in the top right in each panel to quantify model-data time series agreement except for b2 (site 2 warm edge), which had insufficient observed data in 2020 due to instrument malfunctioning. See Supplementary Figures S3, S4 for other years.
The trained SnowPALM model reproduces the spatial patterns of lidar snow depth snapshots (Figure 4) with SPAEF ranging from 0.43 to 0.53 at all sites except site 2, where spatial patterns in the modeled map were generally similar to the lidar, but relative accuracy (SPAEF = 0.25) is reduced in part by low snow depths (360 mm at site 2 as compared to 560–944 mm at other sites) (Figure 4; Supplementary Figure S6; Supplementary Table S1).
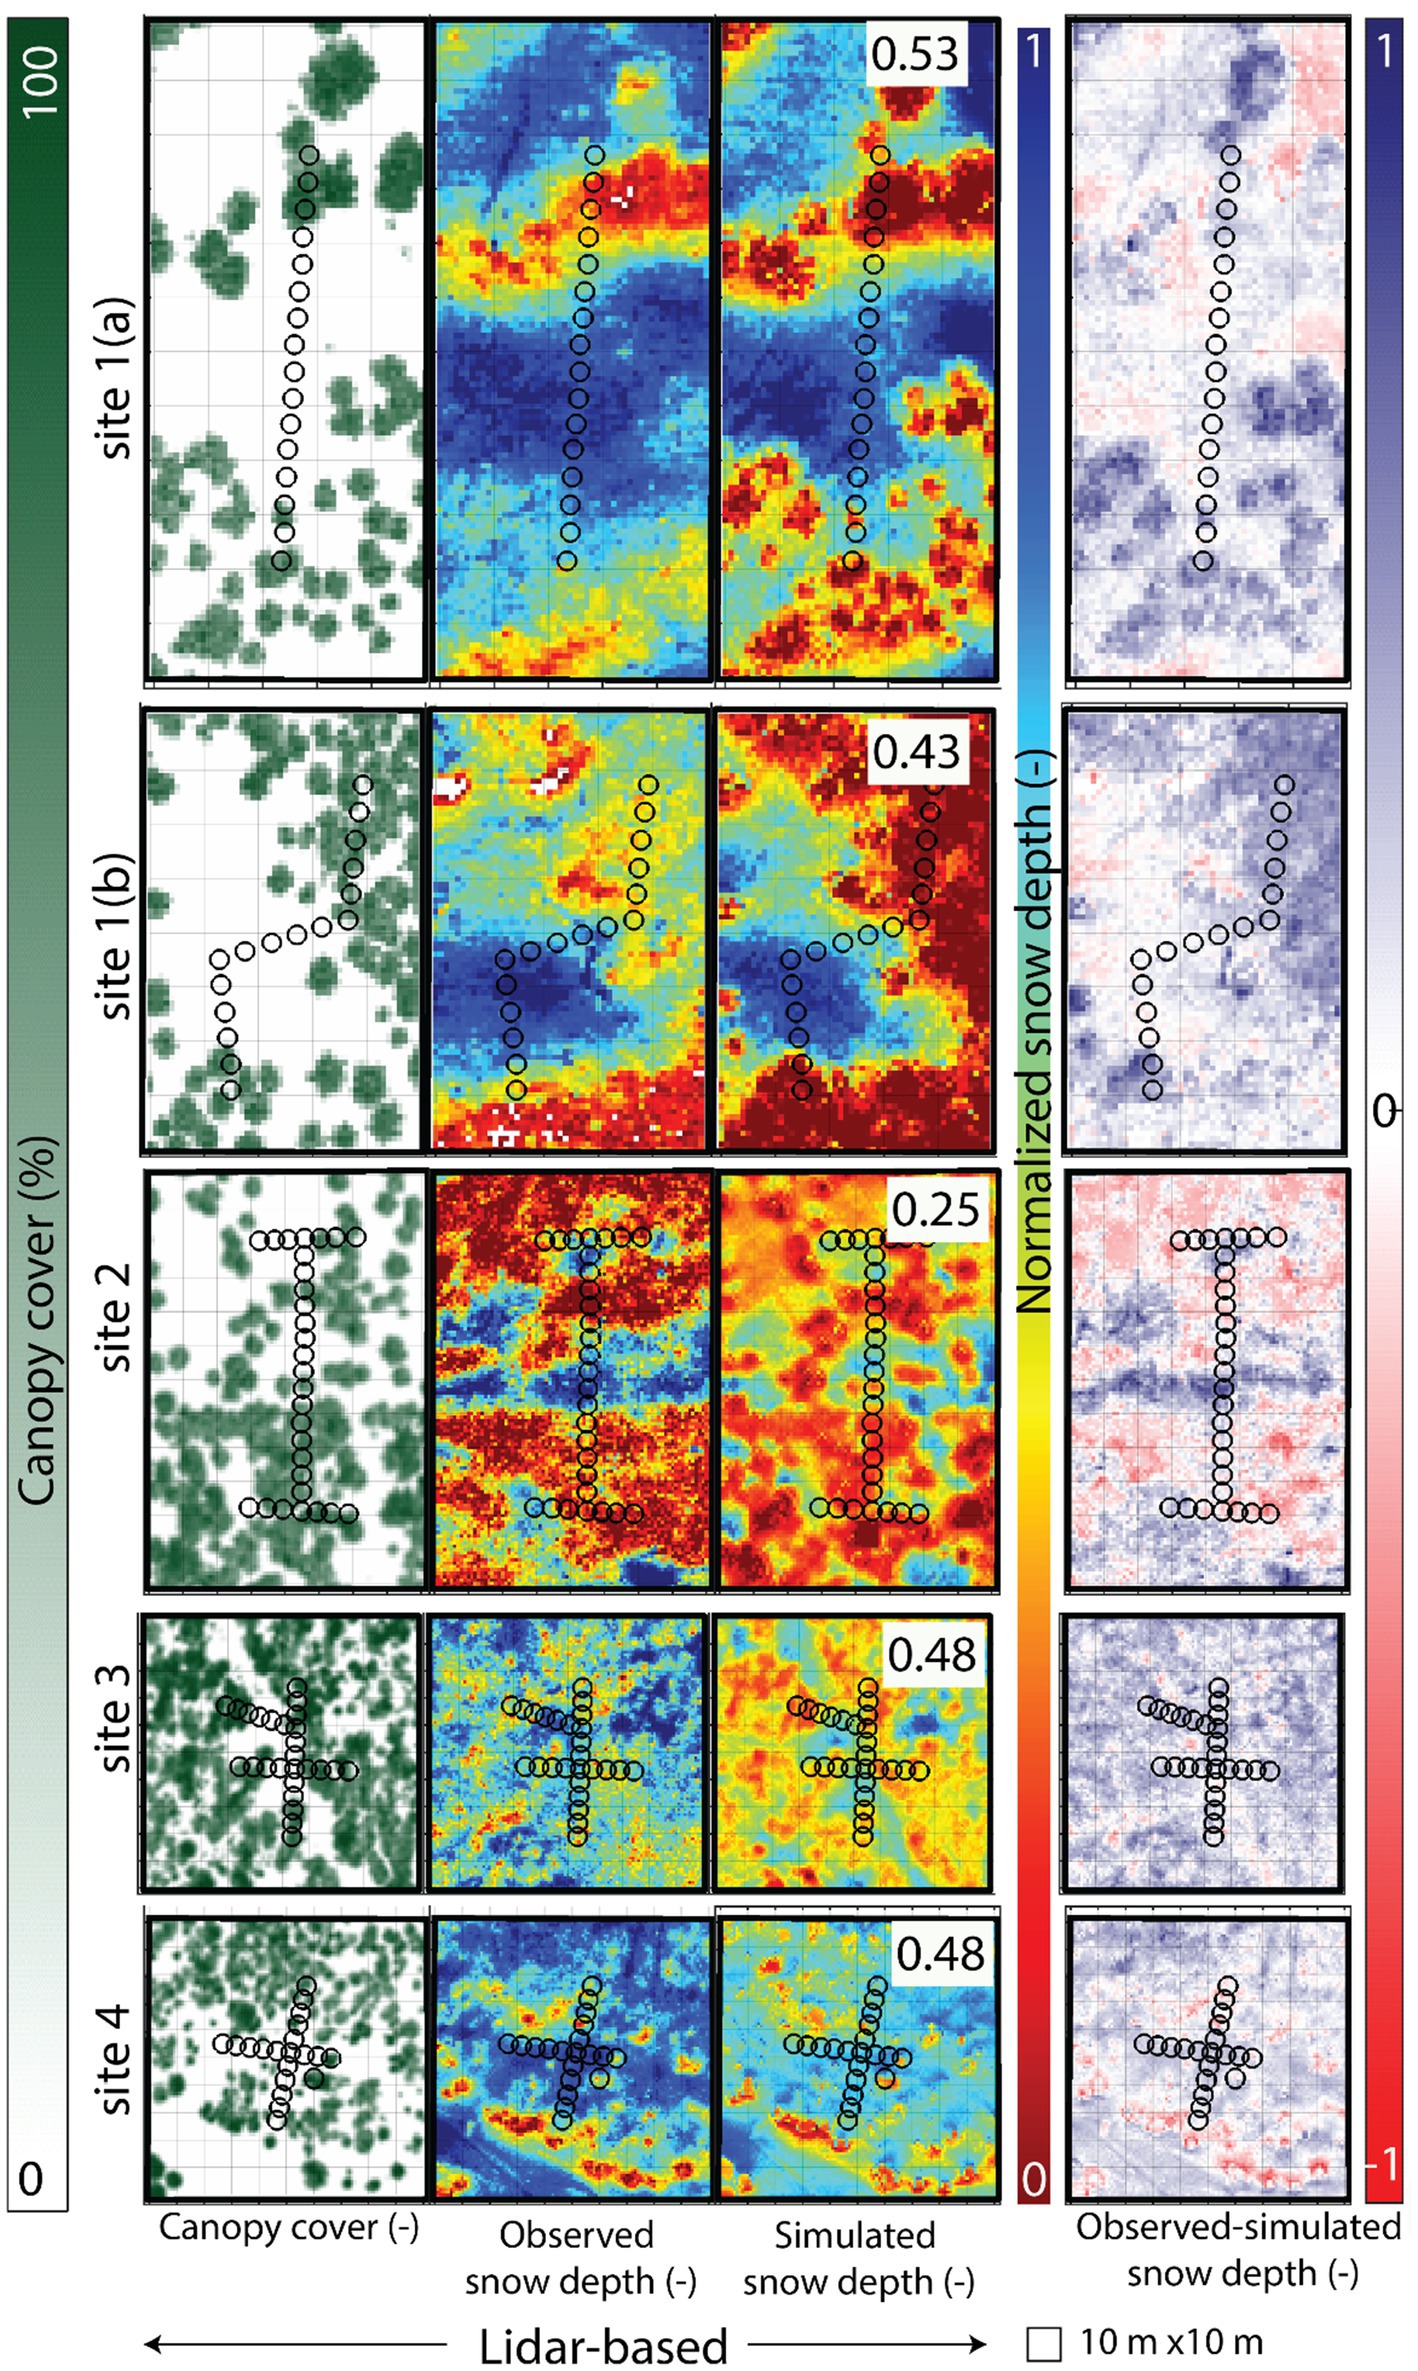
Figure 4. Spatial patterns of canopy cover, lidar-observed snow depth, SnowPALM-simulated snow depth (right), with SPAEF values quantifying agreement between observed and simulated, and the difference between the observed and simulated snow depths. Map dates are February 10, 2023, for site 1, and March 4, 2019, for sites 2–4. Snow depths and snow depth difference maps are normalized using the 98th percentile of the lidar observations (586 mm, 562, 360, 590, and 944 mm at sites 1a, 1b, 2, 3, and 4, respectively).
5.3 Cross-site differences in radiation balance, snowpack, and water fluxes
Among sites, incoming shortwave radiation at the snow surface is highest at site 1 and the northern half of site 2 (Table 2), where recent mechanical thinning has reduced canopy cover (Figure 2). Site average incoming longwave radiation at the snowpack surface varies with site air temperature (Figure 1; Table 1) and is therefore greatest at site 3 and least at site 4 (Table 2). Average net radiation generally declines from a maximum of 18 Wm−2 to a minimum of 1 Wm−2 from site 1 to site 4, although the warmer average air temperature at site 3 gives it a greater net radiation average than site 2 (11 vs. 7 Wm−2, respectively).
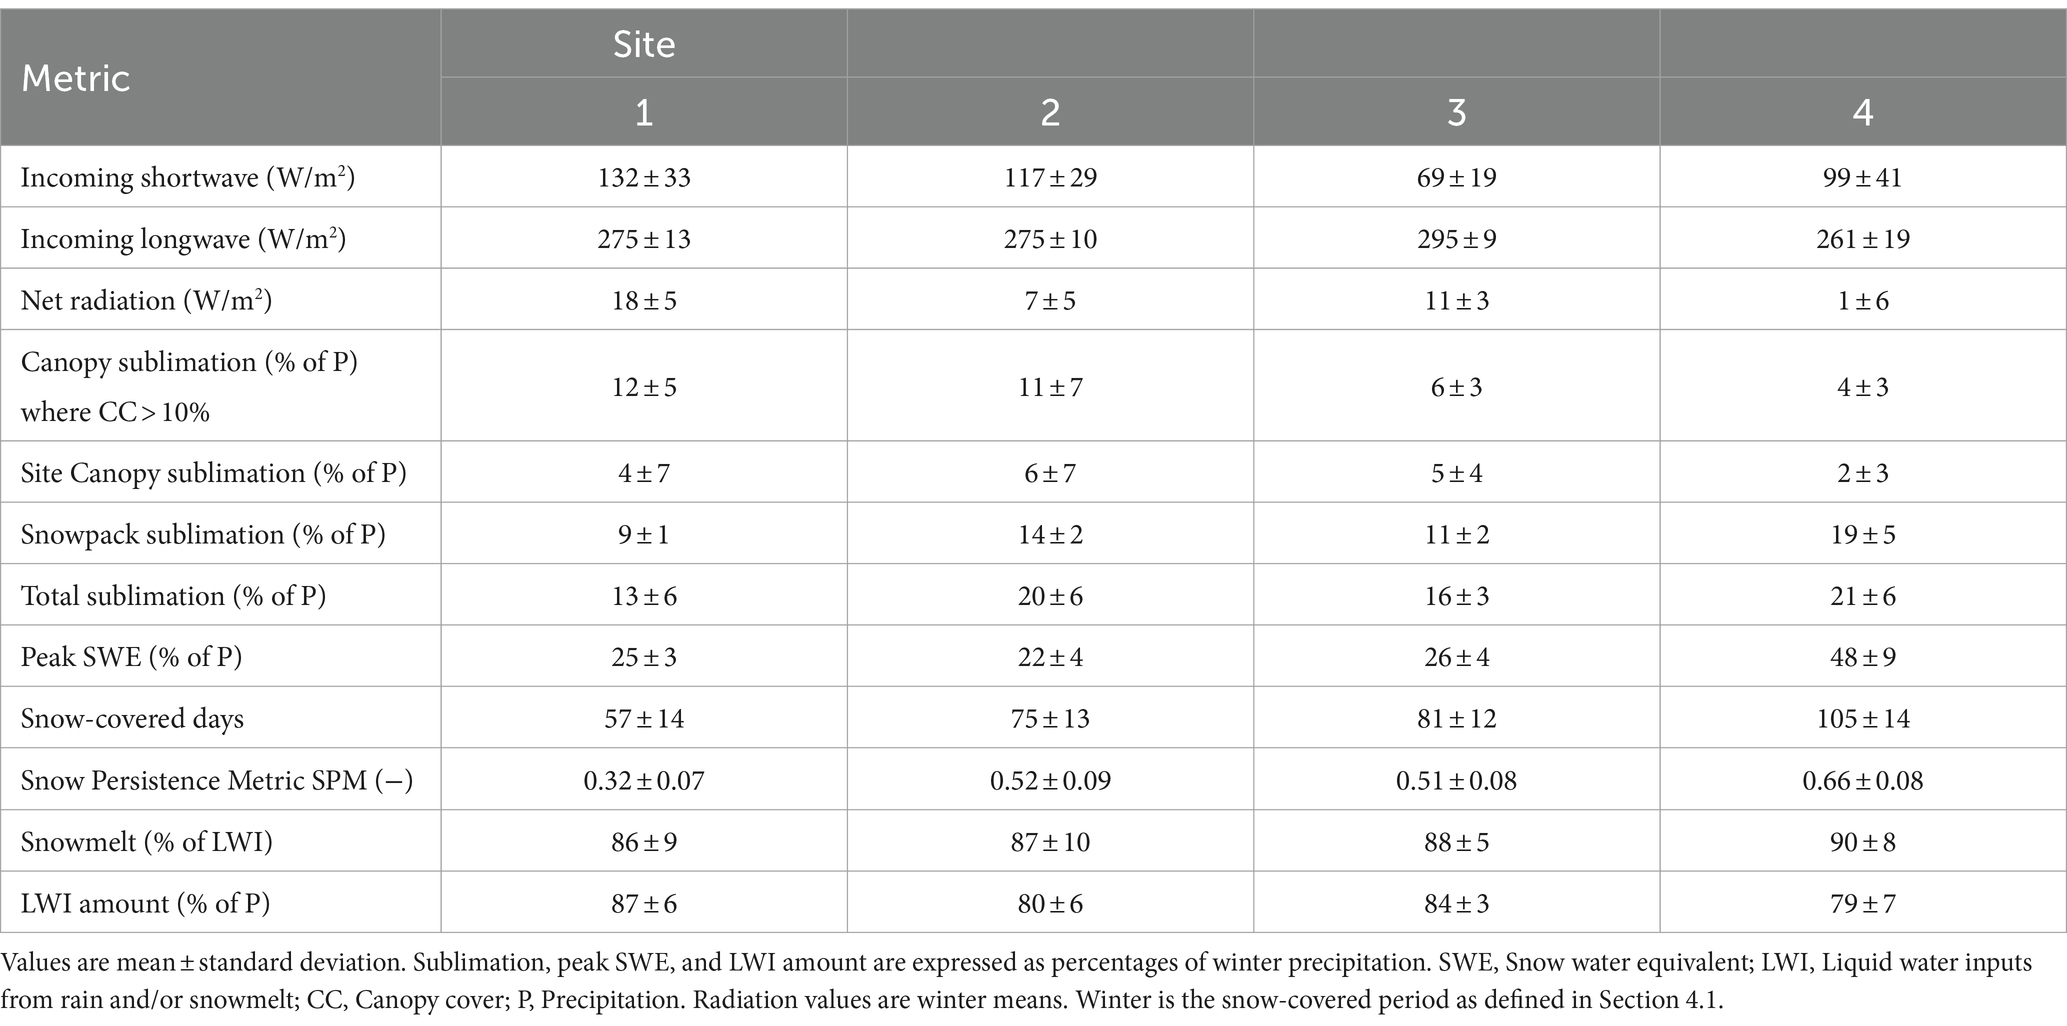
Table 2. Snowpack, radiation, and water fluxes averaged across winters 2017–2022.
Total site-average sublimation increases from 13 ±6% to 21 ± 6% across sites 1–4, suggesting greater total sublimation with increasingly persistent snowpack (Table 2). Canopy sublimation dominates at the lowest/most ephemeral site, while snowpack sublimation increasingly dominates the total loss with increasing site snow persistence. However, direct comparisons of sublimation at the site scale are complicated by differences in canopy cover (Table 1). When considering only pixels with at least 10% canopy cover, canopy sublimation consumes 12 ± 5% of winter precipitation at site 1a declining monotonically to 4 ± 3% at site 4 (Table 2). Meanwhile, snowpack sublimation increases from 9 ± 1% to 19 ± 5% across sites 1–4.
Across sites, average peak SWE increases from 22 to 26% of winter precipitation at the lower/warmer sites up to 48% at the highest/coldest site 4, consistent with increasing snow persistence from 0.32 to 0.66 (Table 2). The site-averaged snowpack persistence pattern is consistent with the SNOTEL-based pattern (Figure 1 and Section 5.1), but all peak SWE:P and SSM are lower, which is consistent with SNOTEL locations as places with most/longest snow (Molotch and Bales, 2005; Broxton et al., 2019; Dwivedi et al., 2022). However, LWI as a percentage of winter precipitation decreases across this same gradient from an average of 87–79%, contrasting with the idea that peak SWE is a good proxy for liquid water inputs in snowmelt-driven watersheds. Instead, LWI is effectively equal to winter precipitation minus total sublimation (i.e., LWI ~ Winter P – Total Sublimation, Table 2). The portion of LWI derived from snowmelt increases from 86 to 90% from site 1 to site 4 (the remaining LWI is winter rainfall). Average snow cover duration increases monotonically across the site gradient of snow persistence, nearly doubling from an average of 57 days at site 1 to 105 days at site 4.
5.4 Spatial patterns of radiation, snowpack, and water fluxes with respect to forest canopy
This section describes spatial patterns observed in site-wide maps. Statistical comparisons of these variables by snow environment will be presented in the following section.
Spatial maps of winter-integrated radiation balance and sublimation from the trained SnowPALM model (Figure 5) are consistent with our snow environment classification (Figure 2). Due to tree shading, shortwave radiation is low under canopy, especially for dense, contiguous canopy (Figure 5, e.g., most of site 3, undisturbed portions of sites 2 and 4). Within gaps, shortwave radiation is partially attenuated by tree shading at the cool edges. Incoming longwave radiation is greatest under canopy and somewhat enhanced at canopy/gap edges, consistent with thermal emission to the snowpack from canopy warmed by the sun and inhibition of nighttime thermal emission from snowpack under canopy.
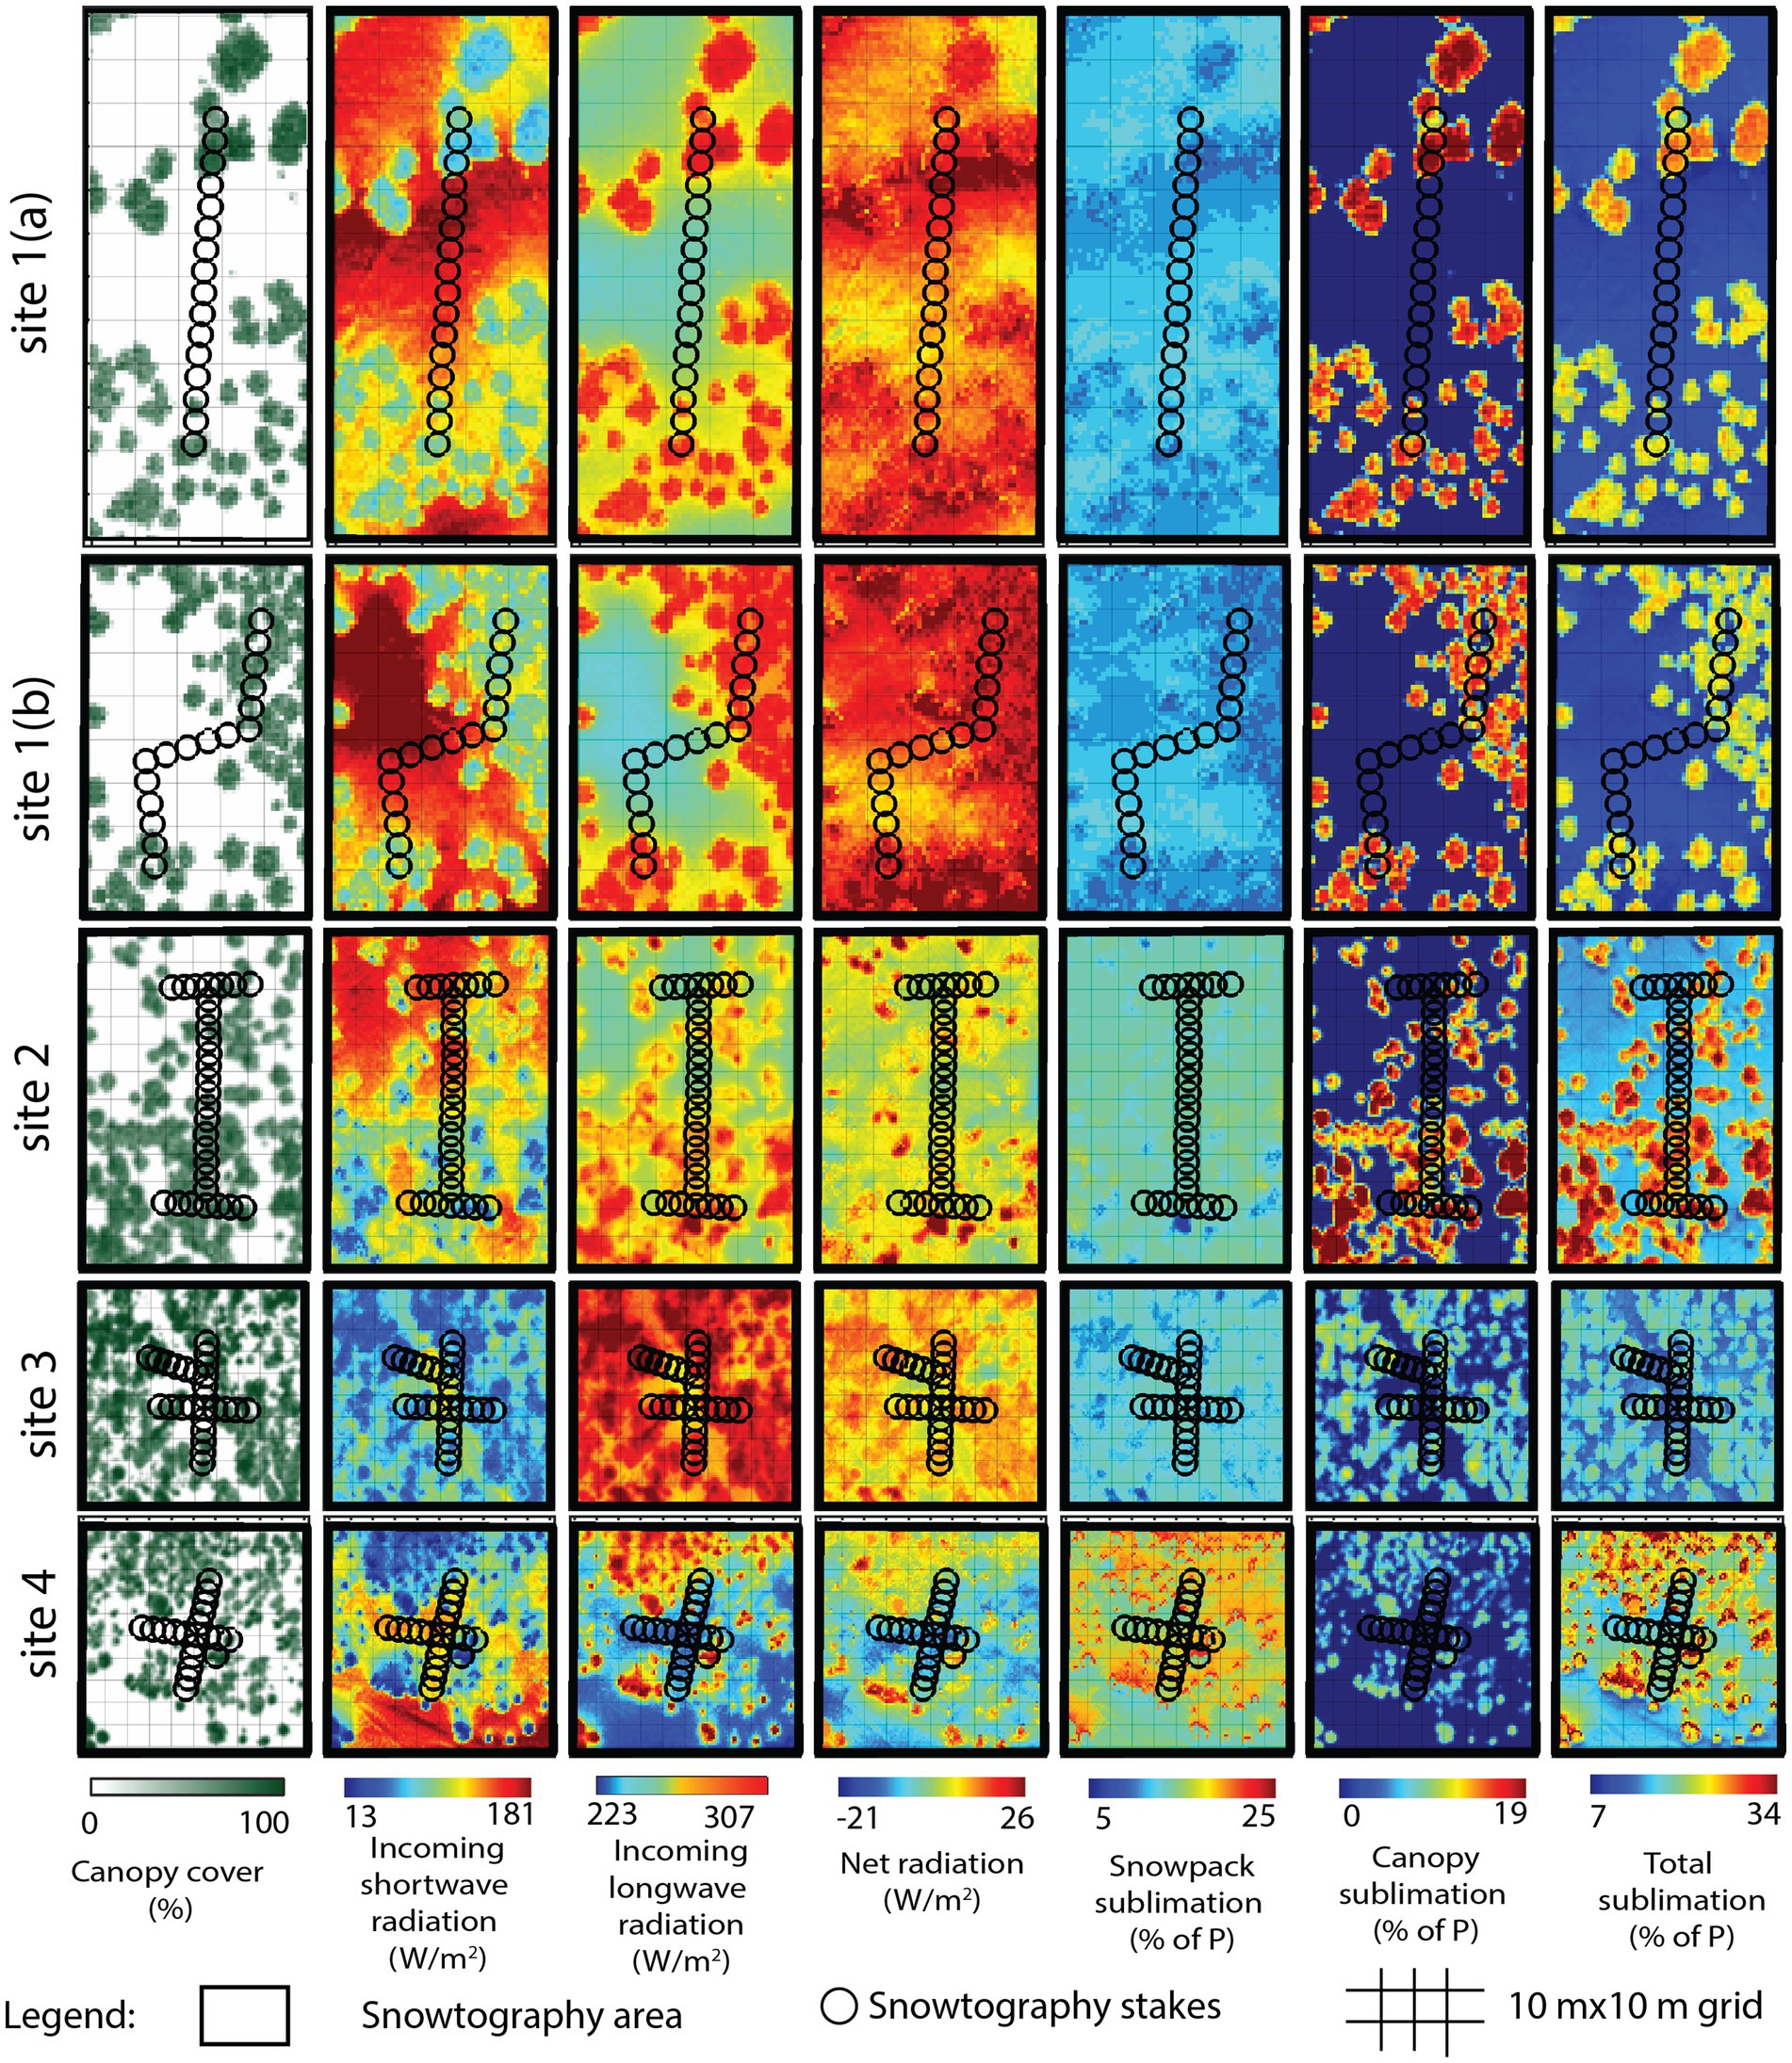
Figure 5. Spatial patterns of radiation and sublimation related to canopy at each field site averaged across winters 2017–2022. Sublimation values are integrated over the winter and expressed as percentages of winter precipitation. Radiation values are taken beneath canopy (i.e., at the snowpack surface) and averaged over the winter.
Spatial variability in net radiation shows the combined effects of shortwave shadows and longwave emission near canopy (Figure 5). At each site, the highest net radiation occurs at warm edges, where unshaded shortwave is additive with longwave from nearby canopy. Under-canopy net radiation is second-highest, followed by overlapping edges and cool edges.
To illustrate finer-scale details indicative of forest structural effects on snow processes, the end-members of snow persistence, sites 1a and 4, are the focus of Figures 6–9. Within a given site, 3-D forest structure induces large ranges of spatial variability in the number of snow-covered days, with up to 30–80 days difference across a site (Figure 6; Supplementary Figure S7). Temporally-averaged peak SWE ranges from ~10 to 45% of P at the least-persistent site (1) and from 10 to 60% at the most persistent site (4) across each site’s mosaic of snow environments. Liquid water inputs vary between ~70 and 90% of total winter precipitation. At site 1a, spatial patterns in LWI are strongly controlled by under canopy/uncovered, with relatively small effects of various uncovered environments (Figure 6), consistent with the dominant role of canopy sublimation and lesser role of snowpack sublimation at the ephemeral end of the site gradient (Table 2). At site 4, however, there are larger LWI gradients across open areas between nearby canopy (e.g., gap shown in Figure 6, bottom row, southwest corner of site 4), suggesting that spatial variability in snowpack sublimation increases with winter duration. Statistical comparisons are presented in the following section.
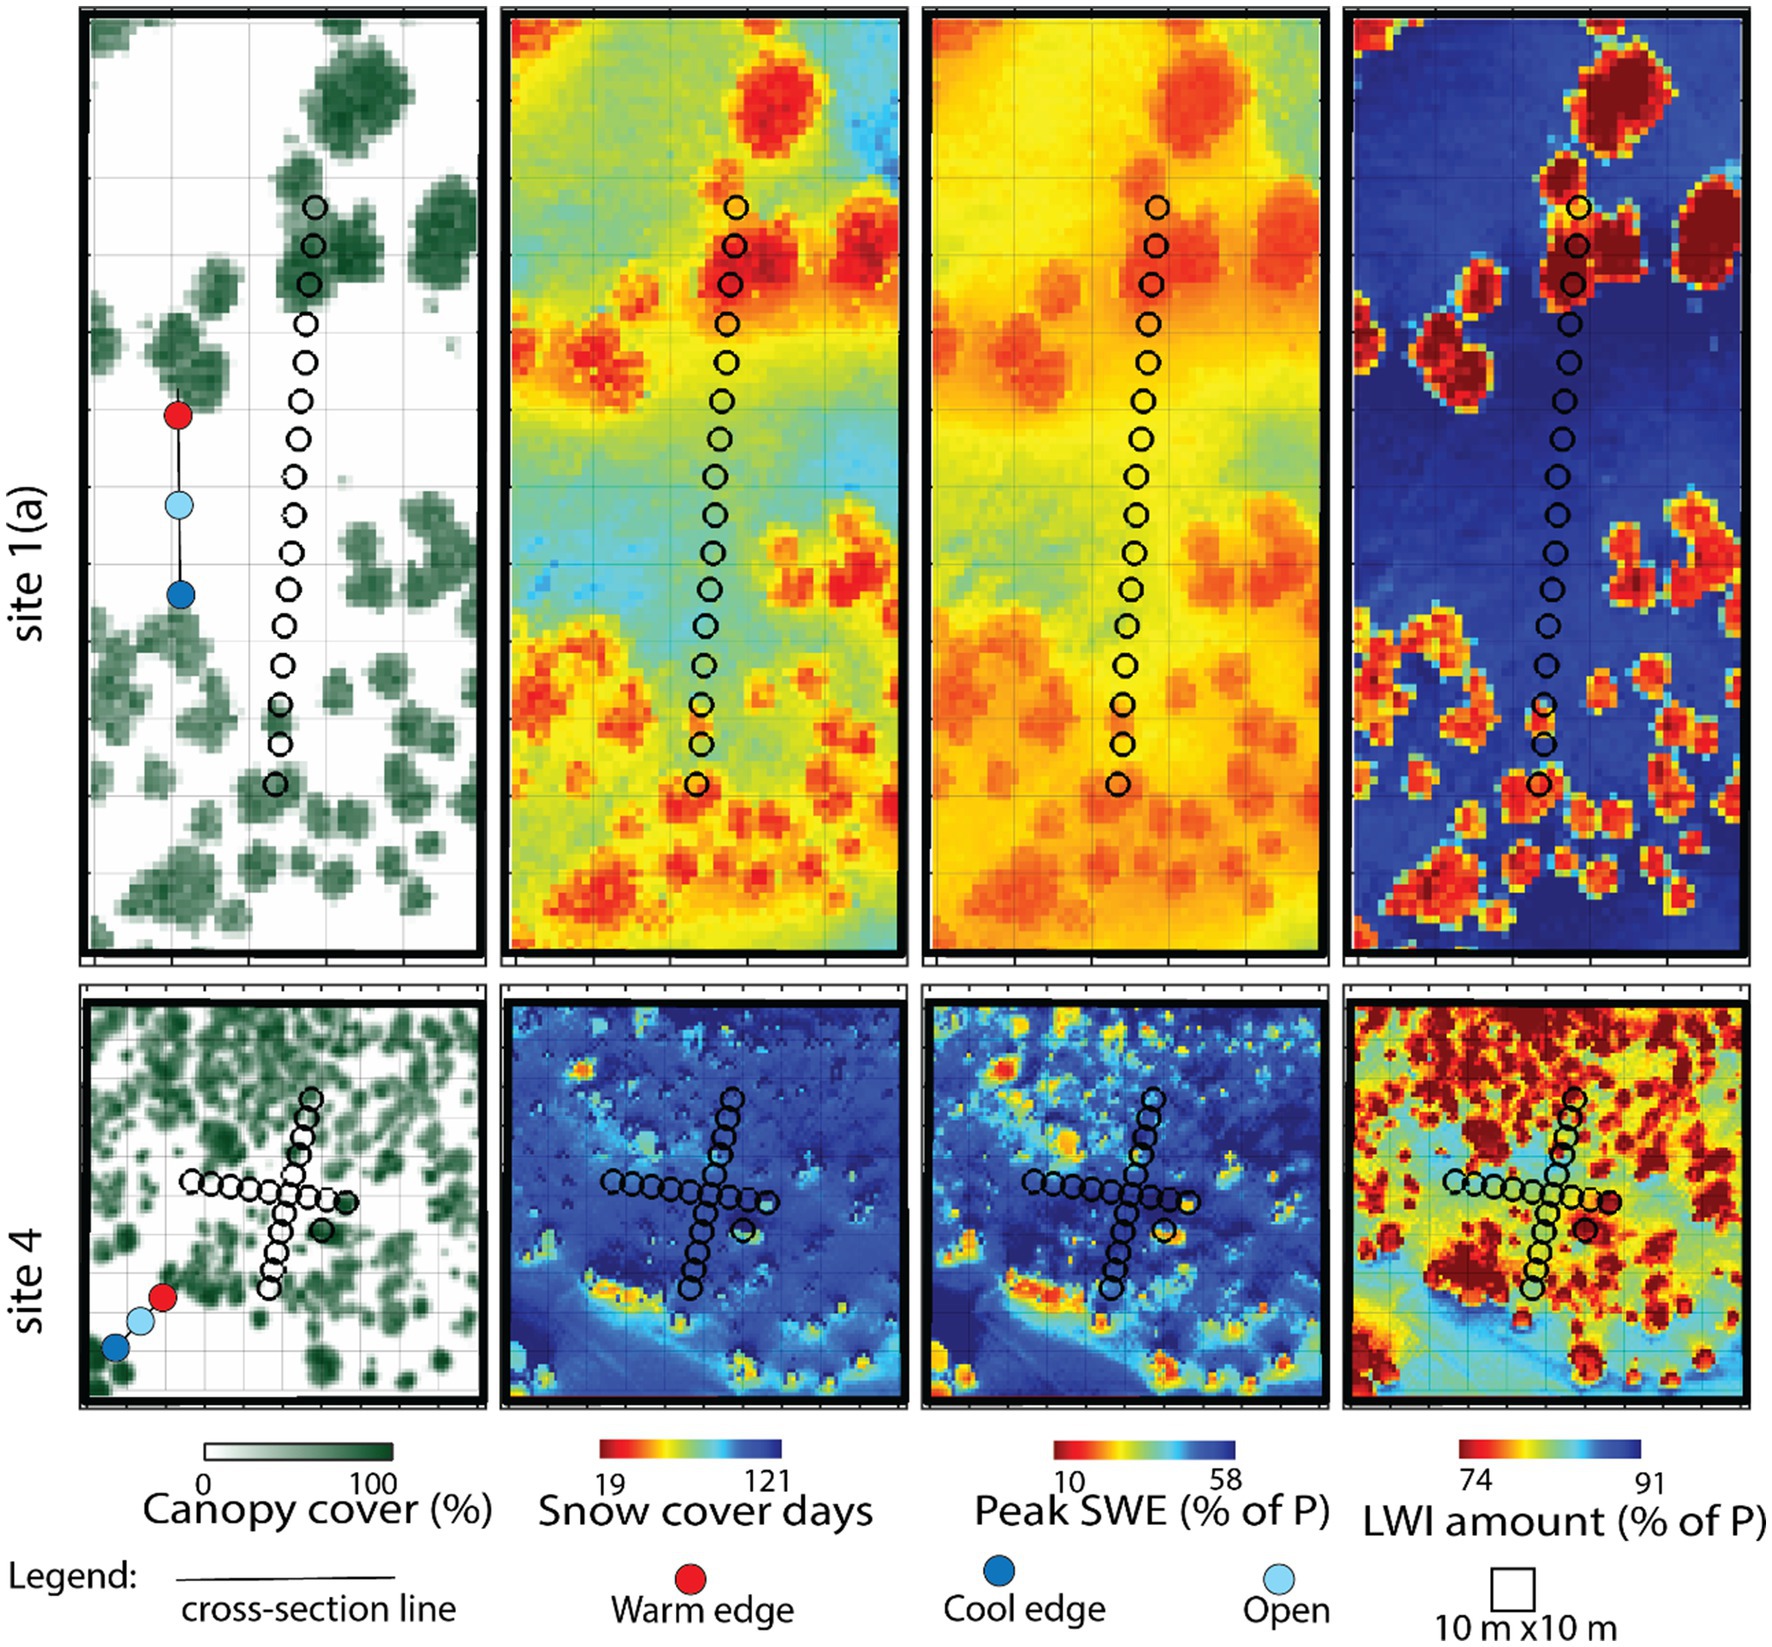
Figure 6. Spatial patterns of snowpack and liquid water input (LWI) indices at Sites 1 and 4 (least and most persistent snowpack) averaged across winters 2017–22. Peak SWE and LWI amounts are expressed as percentages of winter precipitation. Other sites shown in Supplementary Figure S7. For each site, a cross section is identified across a gap from cool edge, through an open area, to a warm edge. Detailed cross-section results are shown in Figures 7, 8.
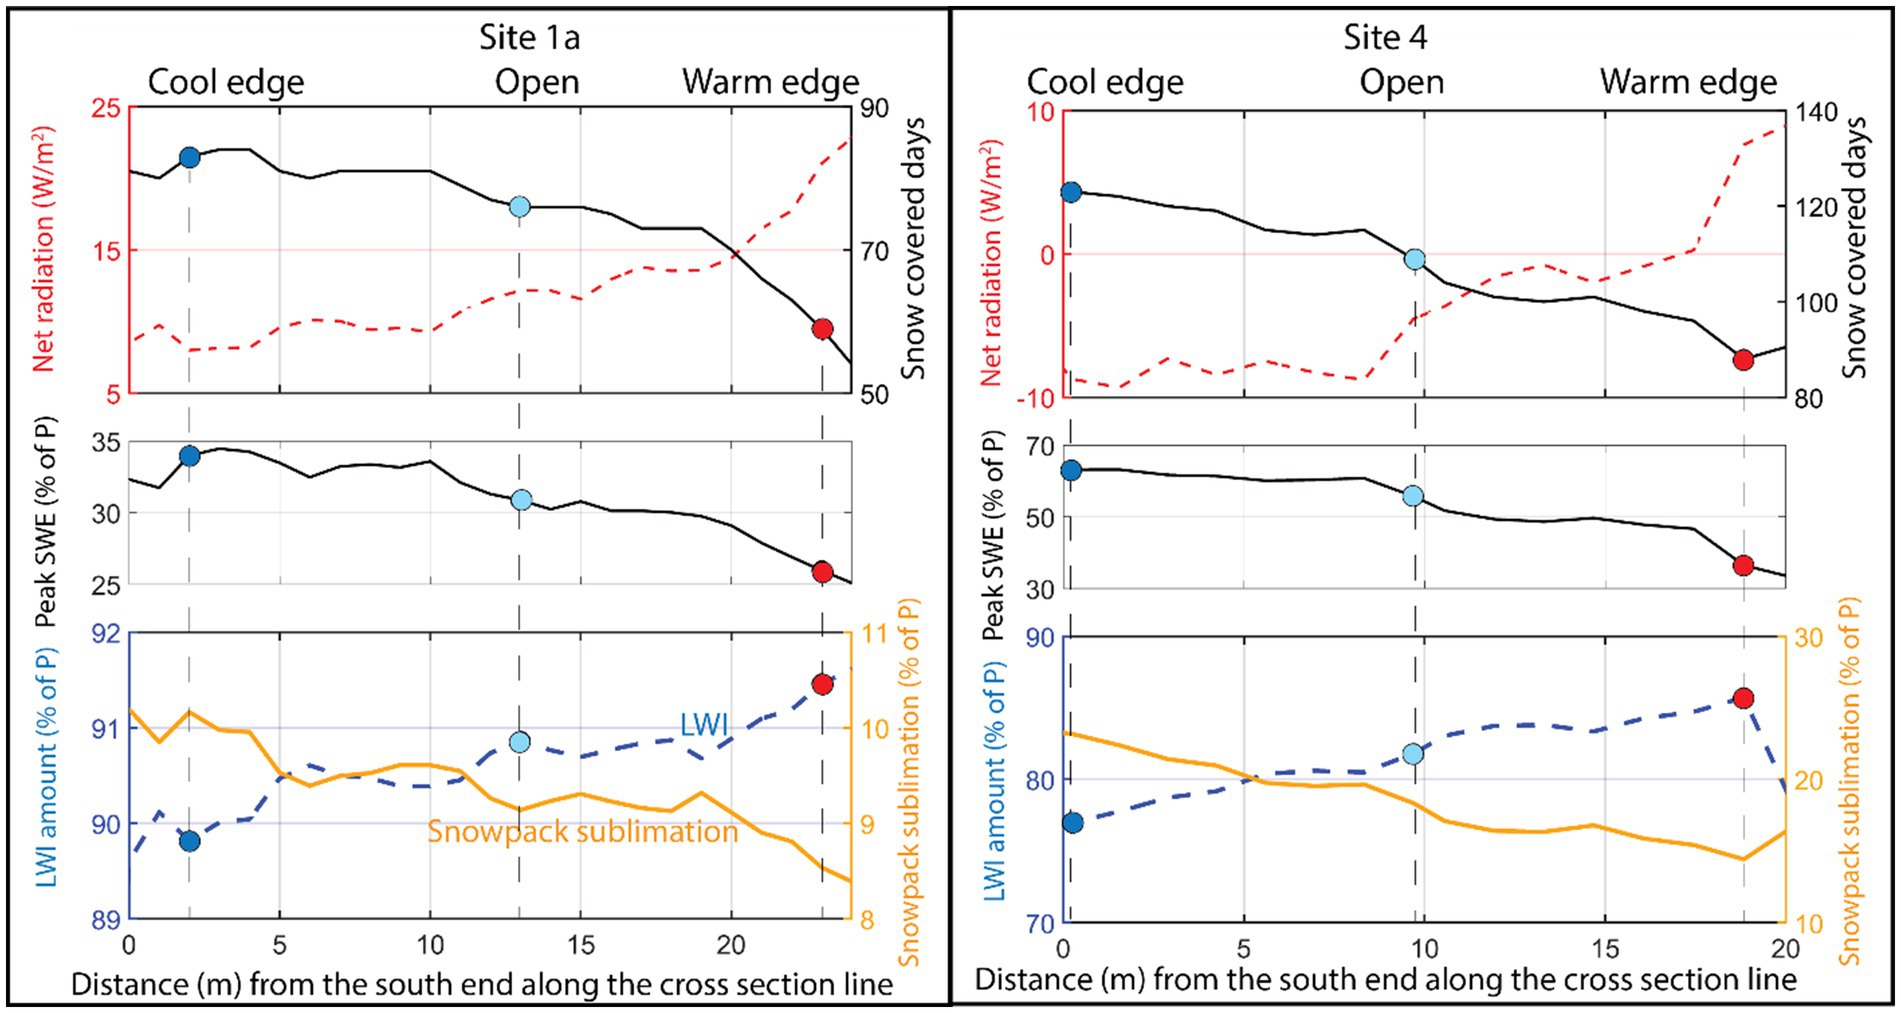
Figure 7. Net radiation, snow covered days, peak snow water equivalent (SWE), snowpack sublimation, and liquid water input (LWI) across selected transects at sites 1 and 4 as indicated in the left column of Figure 6. Colored dots correspond to locations indicated in Figure 6.
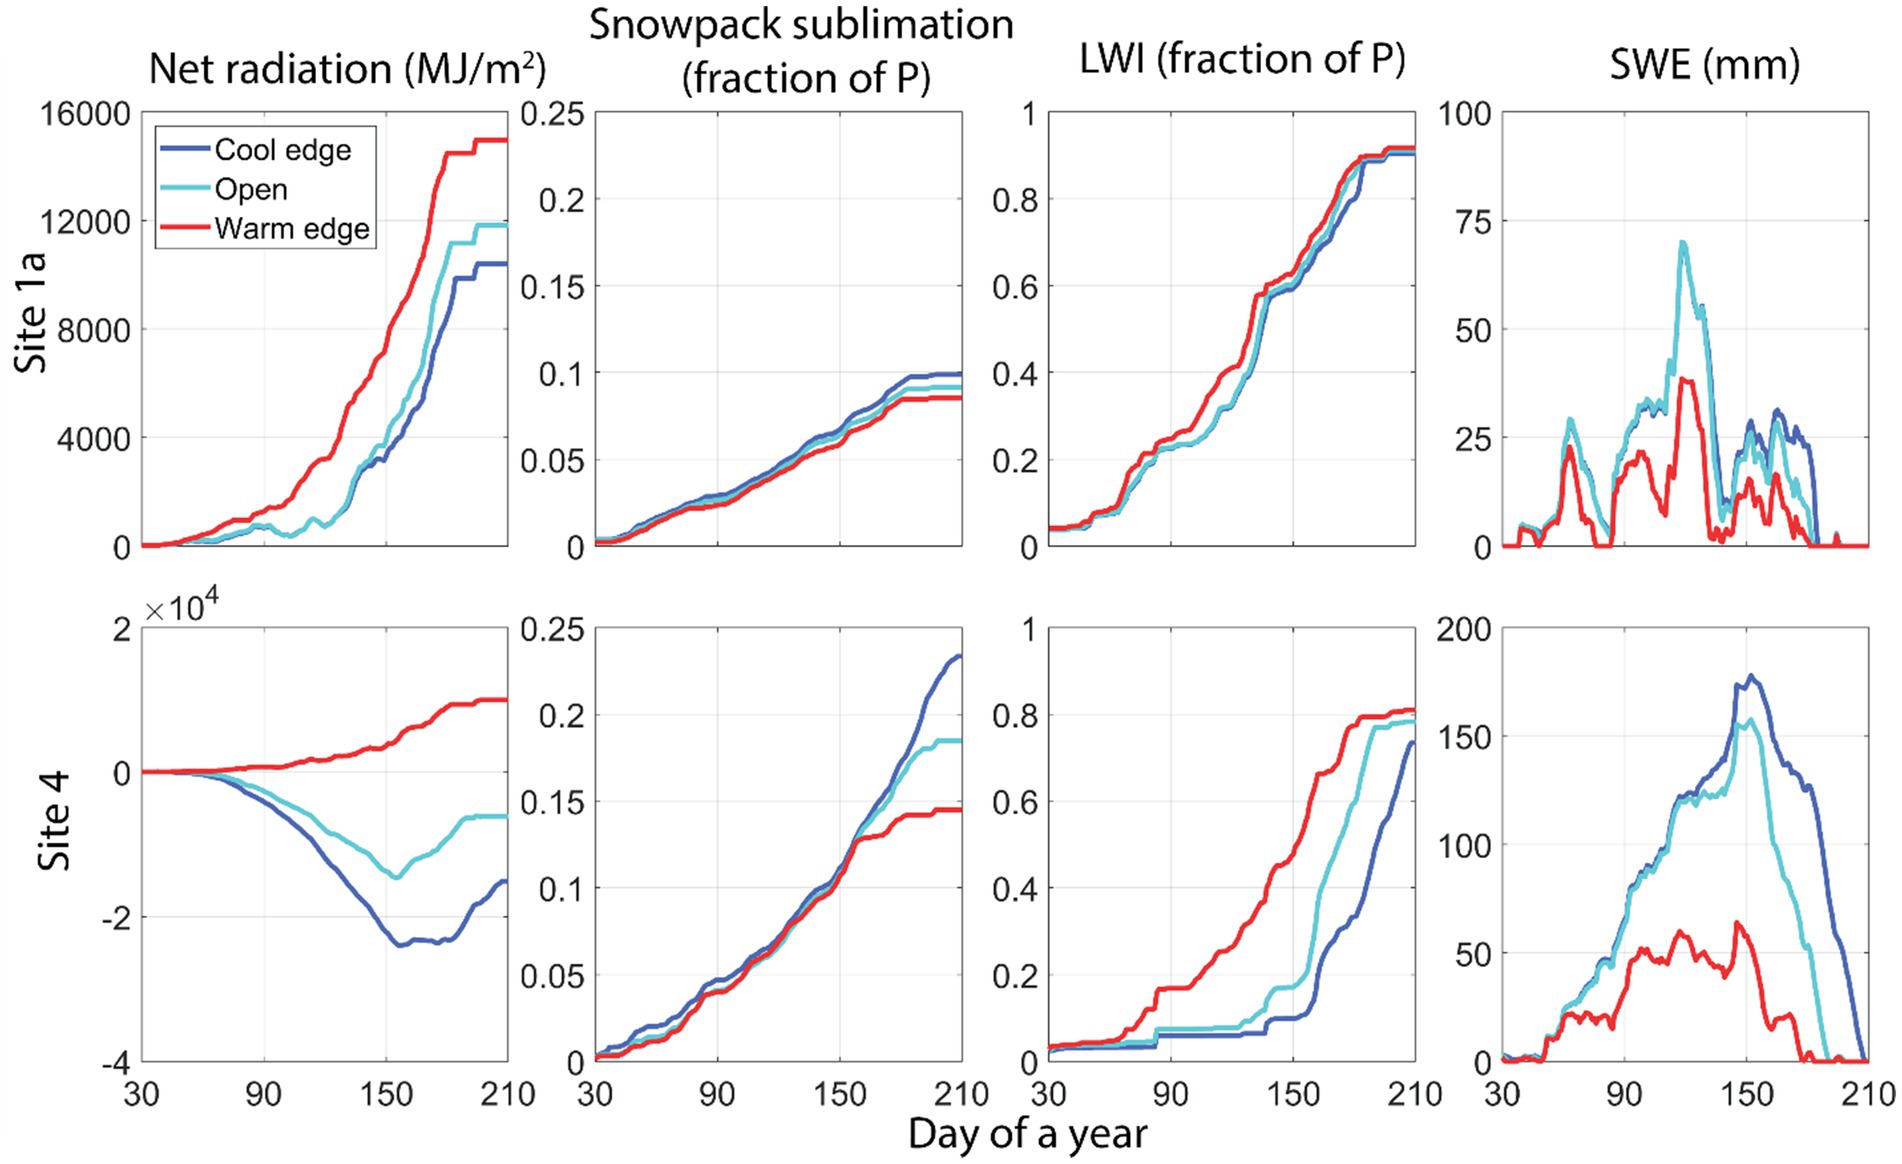
Figure 8. Cumulative winter net radiation, snowpack sublimation, LWI, and daily SWE at the point locations indicated in Figure 6, left column. Values shown are the mean of all six study years. Note sites have different scales for net radiation and SWE. Day of year is from October 1.
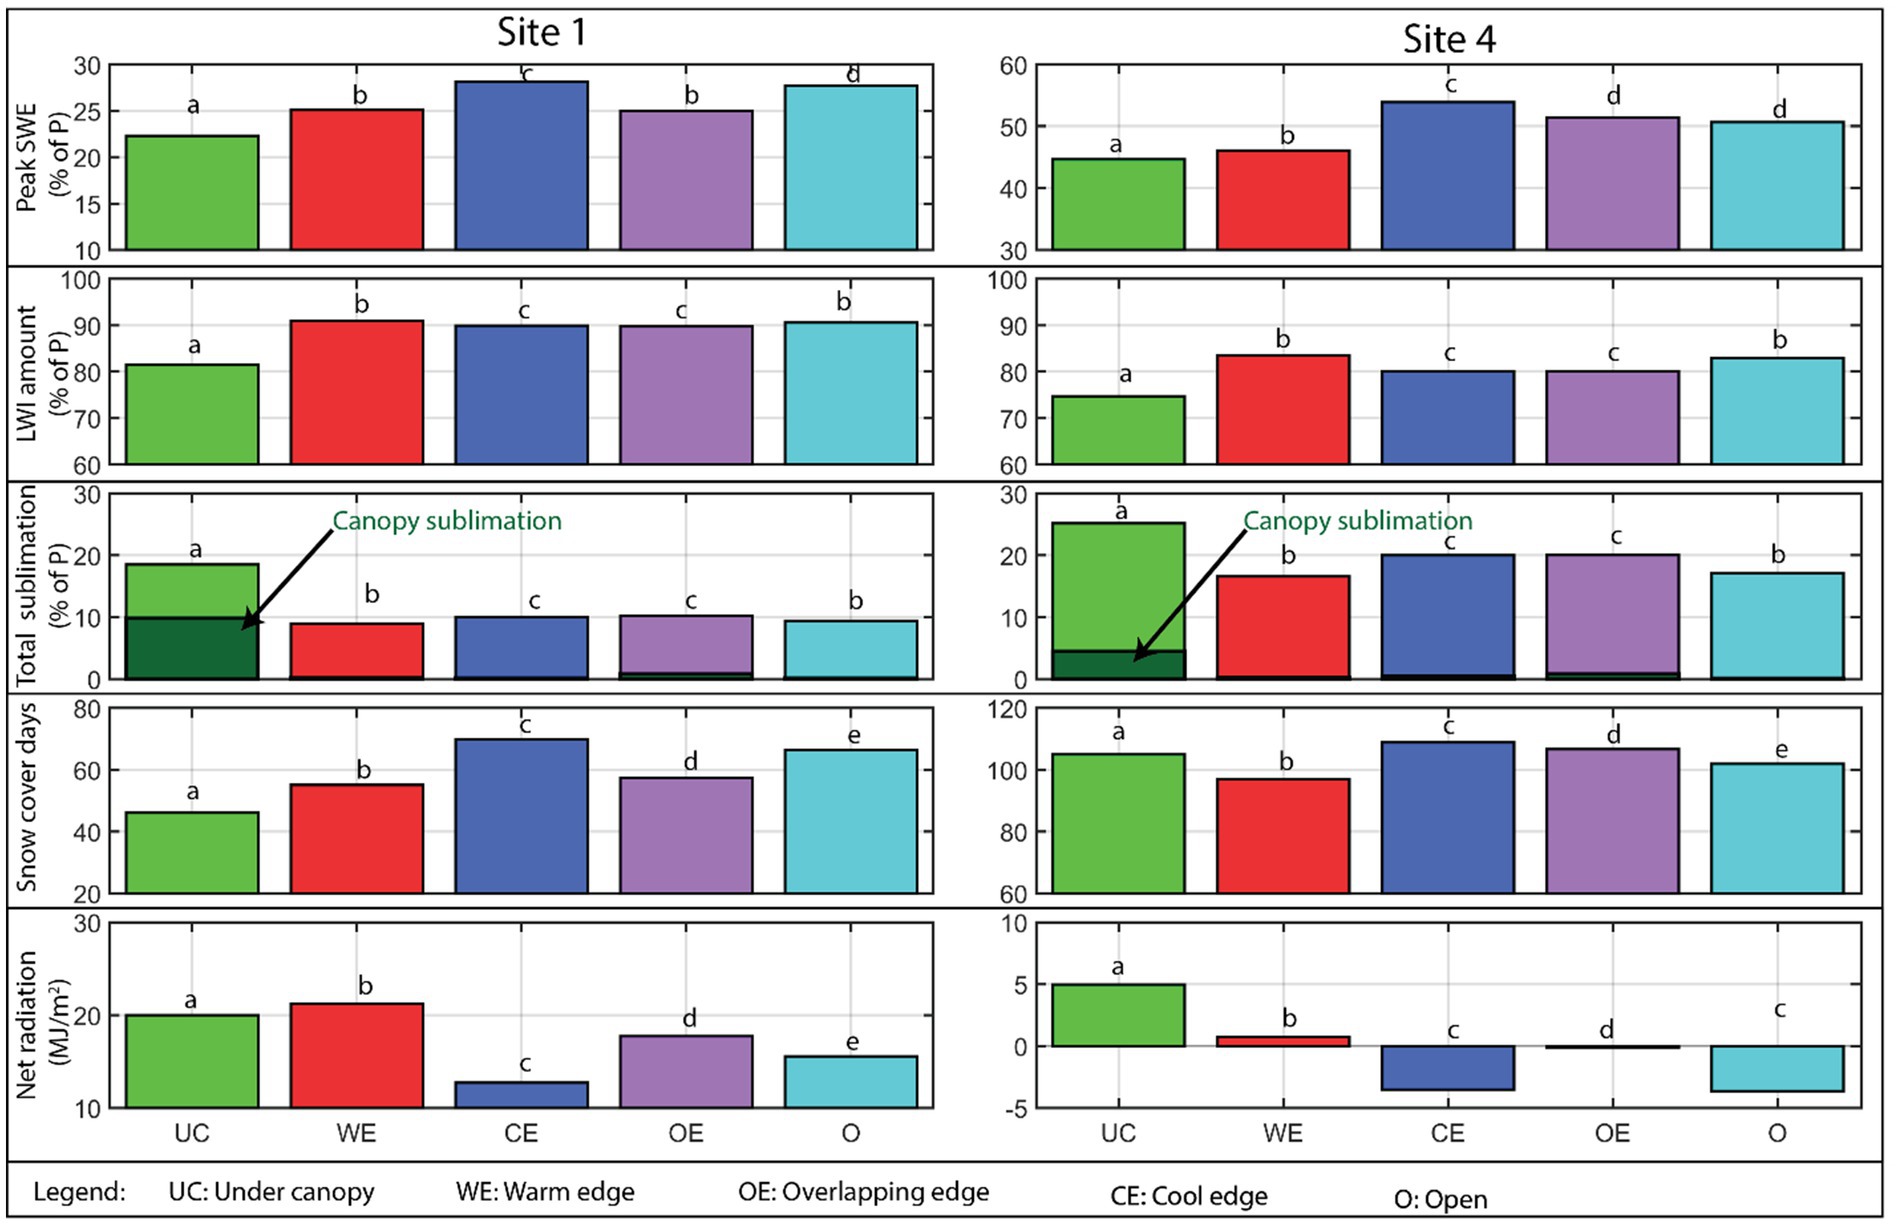
Figure 9. Spatial average values of peak SWE, LWI amount, canopy and total (canopy plus snowpack) sublimation, snow cover days, and cumulative net radiation for each snow environment at sites 1 and 4 using the mean of all study winters. Peak SWE, LWI amount, canopy sublimation, and total sublimation are expressed as percentages of winter precipitation. The two sites have different scales for peak SWE and snow cover days. Other sites and years shown in Supplementary Figures S8, S9. Within each panel, bars with different letters are different from other bars in the same panel (multiple comparison of group means, 95% confidence level). Note that for all environments not Under Canopy (UC), total sublimation = snowpack sublimation.
The spatial variability in snow dynamics and LWI created by forest structure is illustrated for sites 1a and 4 with cross sections traversing gaps from cool edges through open areas and ending at warm edges (see Figure 6, left column, for location of each cross-section). These cross sections are deliberately placed across gaps to illustrate the range of spatial variability related to nearby forest structure and are not meant to represent site-average conditions, which are summarized in a subsequent section. Surprisingly, LWI amount increases when moving northward from cool to warm edges, even though net radiation increases and peak SWE decreases (Figure 7). The magnitude of variability in LWI/P is larger at the most persistent snowpack site, increasing from 77% at the cool edge to 86% at the warm edge, as compared to a LWI/P increase of only about 2% along the transect at the ephemeral site. Snowpack sublimation, a dominant control of LWI spatial variability in gaps, increases with snow covered days (i.e., time exposure of the snowpack) but decreases with increasing net radiation, at both sites (Figure 7).
The time courses of net radiation and snow dynamics (Figure 8) illustrate mechanisms underlying the spatial variability across gaps (Figure 7). As expected, net radiation is highest at warm edges throughout the winter, due to direct shortwave exposure combining with thermal radiation from the warm, south sides of nearby trees. Net radiation differences between open areas and warm edges begin to emerge more strongly in the second half of the winter, likely because solar angles steepen, shortening tree shadows and exposing open areas to increasing direct shortwave radiation. Most of the cumulative winter snow sublimation differences between sites and among locations at site 4 occur during the ~30-day difference in snow-covered duration at the end of winter. LWI occurs frequently throughout the winter at site 1, consistent with ephemeral snowpack. At the high/cold site 4, open areas and cool edges have, on average, persistent seasonal snowpack, while warm edges tend to have snow dynamics similar to a low/warm site with ephemeral snowpack. The ephemeral snowpack characteristics of the warm edge starts around day 60 and lasts until around day 180 (Figure 8) for an average LWI rate of ~1.95 mm/day. The open and cool edge environments accumulate snow throughout winter and melt in one pulse during spring, with sustained high intensity input after day 150 and lasting to around day 200, with an average LWI rate of 3.52 mm/day during that period.
5.5 Aggregated impacts of forest structure across the site gradient of snow persistence
While Figures 5–8 highlight the range of spatial variability in snowpack, LWI, and underlying mass and energy fluxes, this section provides summaries of forest structural impacts aggregated across each site and indicates their statistical ranking. These differences are illustrated at Sites 1 and 4, the end-member sites with least and most persistent snowpack (Figure 9, see Supplementary Figure S9 for other sites).
The patterns of average peak SWE across snow environments are mostly consistent with H1 (Figure 9). At site 1, the ranking of average peak SWE was cool edge>open>overlapping edge ~ warm edge>under canopy. At site 4, the ranking was the same except that overlapping edge ~ open.
Variability of liquid water inputs across snow environments only partially supported H1. Like peak SWE, LWI was lowest in the under-canopy environment at both sites 1 and 4, due to greatest total sublimation (Figure 9; Supplementary Figures S8, S9), consistent with H1. At both sites, under-canopy locations consistently partitioned an additional 8–12% of winter P to sublimation (reducing LWI) as compared to uncovered environments. Among the uncovered environments, cool and overlapping edges showed the greatest sublimation and least LWI, opposite of the pattern in peak SWE and the order of LWI proposed in H1 (Figure 9). These differences were greater at the most persistent snowpack site (4) than the ephemeral site (1), consistent with greater spatial variability of snowpack sublimation across uncovered gaps at site 4 than site 1 (Figures 5, 7, 8).
At the ephemeral snowpack site 1, snow covered duration for the under-canopy environment was 10–24 days less than any of the four uncovered environments (Figure 9; Supplementary Table S2; Supplementary Figures S8, S9), with cool edges having the greatest snow-covered duration. At the most persistent snowpack site 4, snow-covered duration tended to be greatest for cool edges, least for warm edges, and overall similar to the total sublimation patterns for all four non-covered environments, consistent with the idea that longer integration time is an important control of spatial patterns in LWI (H2). Under-canopy snowpack at site 4 tended to persist for a similar or slightly longer duration than the open area, in contrast to reduced snow-covered duration under canopy at site 1.
5.6 LWI predicted with 3-D forest structure vs. 1-D forest cover
This section compares model predictions for the spatial distribution and site-average LWI by 1-D and 3-D approaches for sites 3 and 4, where 1-D modeling was previously conducted (Dwivedi et al., 2022). 3-D forest modeling with SnowPALM consistently predicts ~30 mm less site-averaged LWI than the 1-D forest cover approach (Figure 10), likely because the Snow17 model used in the 1-D approach does not account for snowpack sublimation or other effects such as snow redistribution due to wind or longwave enhancement due to vegetation. Fractionally, this difference is more important in a warm/dry year than a cool/wet year. Aside from this bias, histograms of LWI across the study domains show roughly similar distributions during the warm/dry year at each site. During a cool/wet year, however, the 3-D model produces a more widely spread and bimodal distribution of LWI as compared to the unimodal, densely concentrated 1-D prediction, consistent with the prediction of H2 that LWI spatial variability regulated by canopy structure would be more important in the most persistent seasonal snowpacks and cold/wet winters.
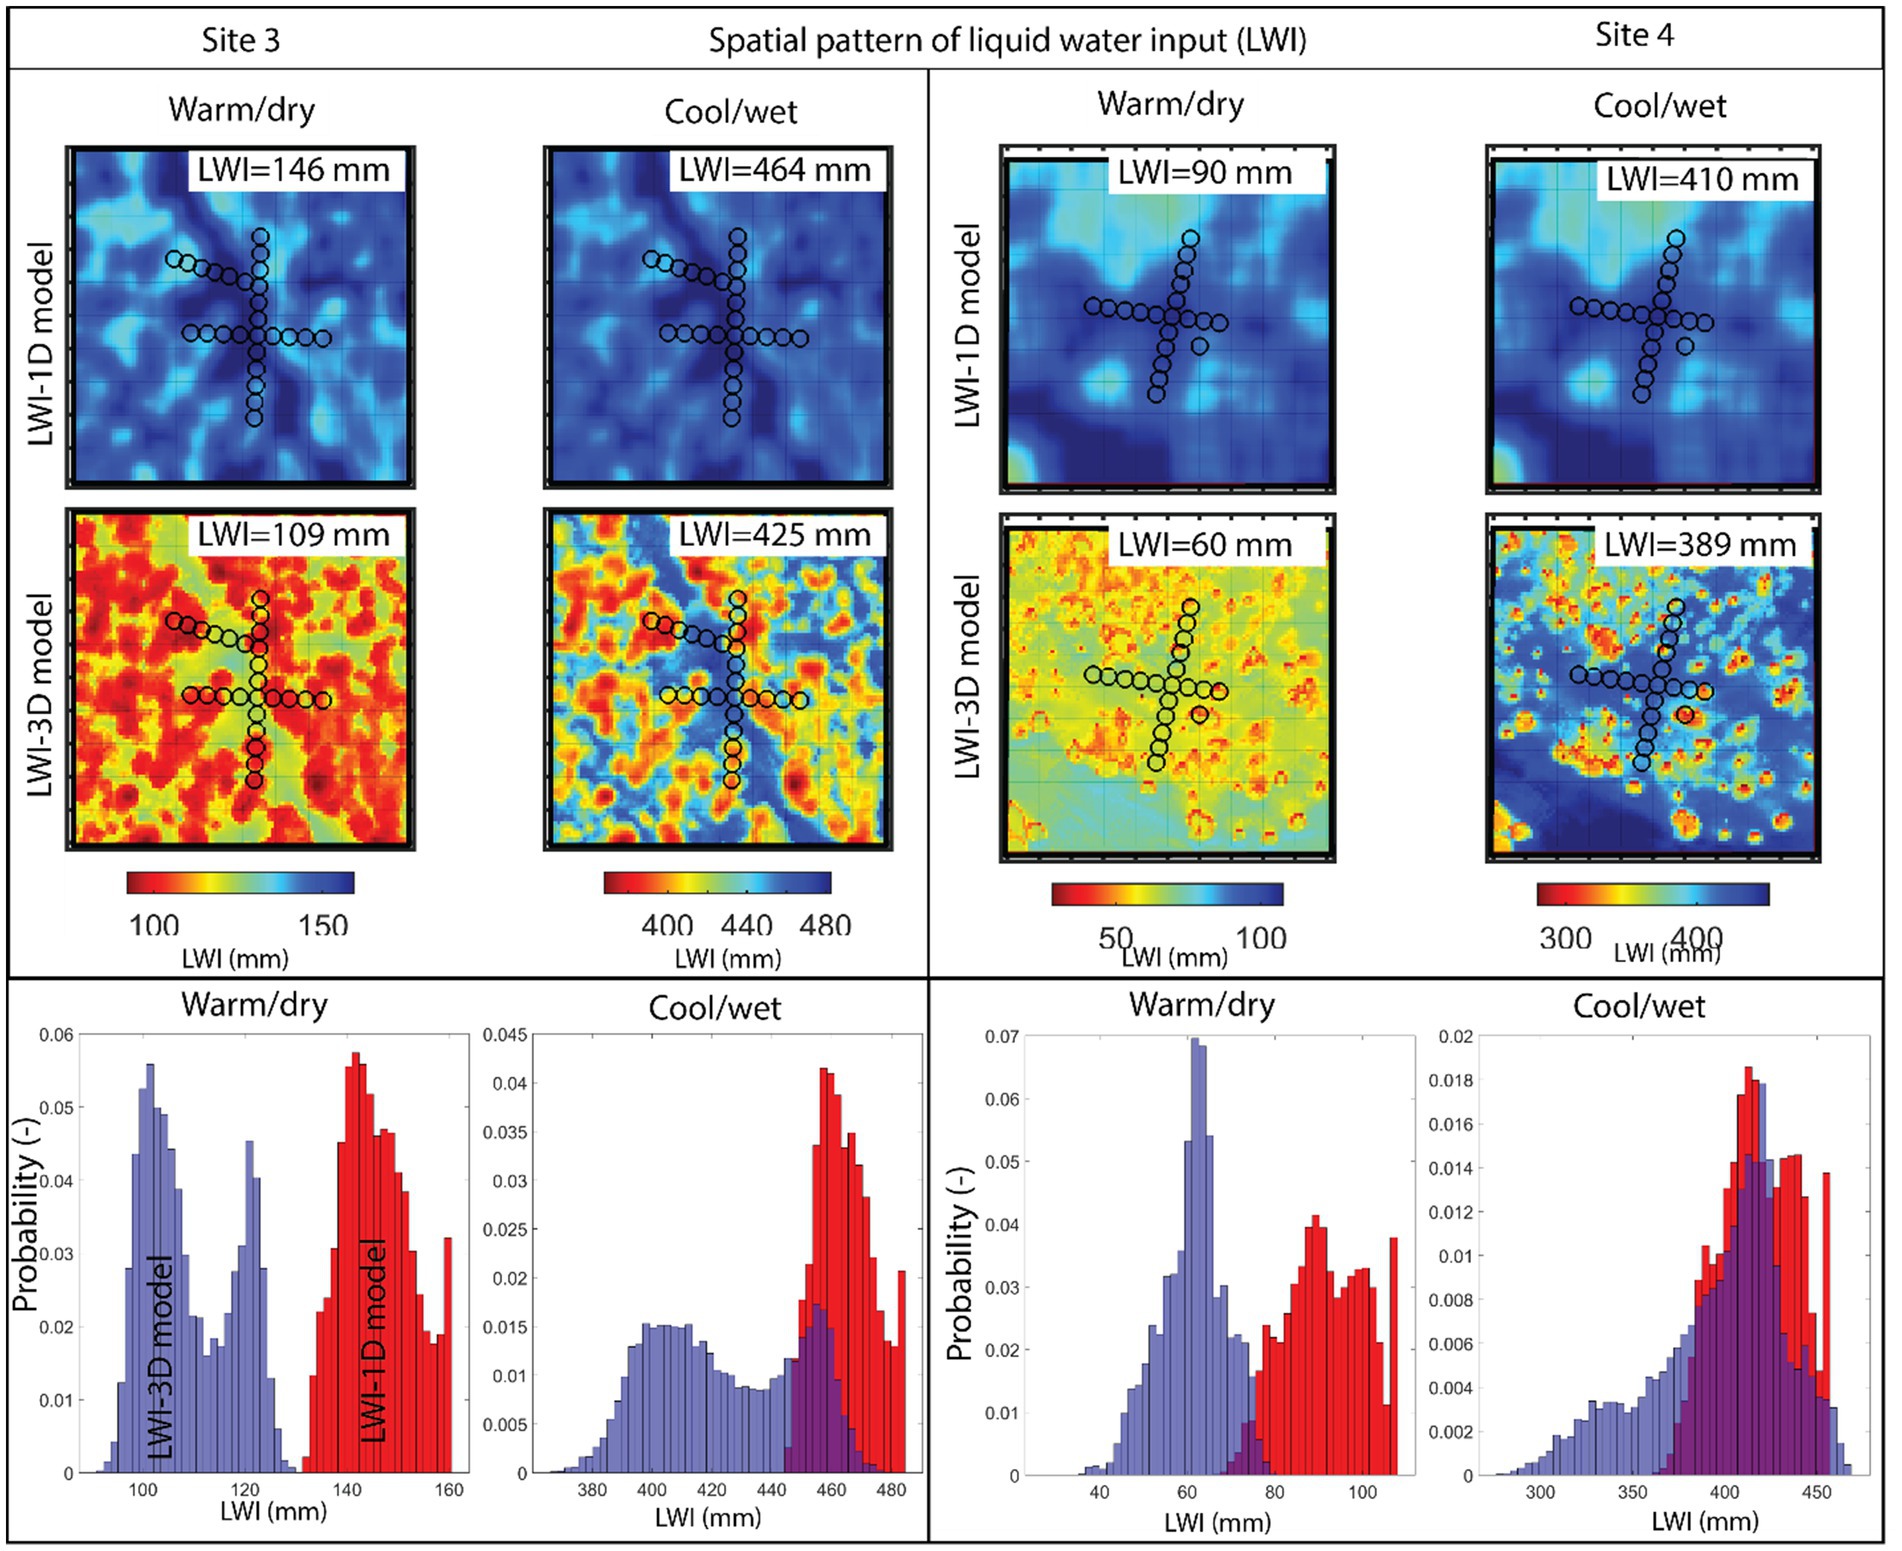
Figure 10. Comparison of liquid water input amounts (LWI) modeled for warm/dry and cool/wet years using 1-D modeling extrapolated by canopy cover vs. 3-D modeling accounting for the structure of surrounding forest. Sites 3 and 4 are compared because the 1-D modeling was previously conducted there (Dwivedi et al., 2022). In the bottom row, blue histograms show LWI from 3-D modeling, while red histograms are for the 1-D extrapolation.
6 Discussion
6.1 Evaluation of hypotheses
3-D forest structure strongly regulated both canopy sublimation and net radiation to snowpack (Figures 5, 9; Supplementary Table S2), which only partially supports Hypothesis 1. As expected, peak SWE was greatest at cool edges (Figures 6, 7, 9), which have no canopy interception and lowest net radiation (Figures 5, 7), followed by open areas or overlapping edges, further supporting H1 (Figures 6, 7, 9). Critically, magnitudes of peak SWE were low compared to winter-integrated LWI at all but the most persistent snowpack site (Table 2; Figures 6, 7, 8), illustrating that winter rainfall and midwinter snowmelt act to disconnect peak seasonal SWE from LWI at ephemeral snowpack sites. This decoupling between peak SWE and LWI undermines a key assumption of our first hypothesis that sublimation would vary positively with net radiation. Instead, we found that LWI was often maximized at warm edges (Figures 6, 7, 9), where canopy sublimation ~0 (Figure 5) and net radiation are greatest (Figures 5, 7, 8). We infer that net radiation tended to drive earlier snowmelt (shorten winter duration), decreasing snowpack sublimation through decreased exposure time of snowpack to the atmosphere (Figure 8) thereby increasing LWI (Figure 7). For most environments at ephemeral snowpack sites, and for warm edges even at a persistent snowpack site, frequent snowmelt during winter both increased total LWI and advanced its seasonal timing (Figure 8).
Our second hypothesis that 3-D forest structure would have greater impacts on LWI at the most persistent snowpack sites and/or during cold/wet winters was supported across sites and years (Figures 7–10). Greater fractions of LWI deriving from snowmelt and less from rain at the higher/colder sites (Table 2) increases the importance of canopy structure, since snowfall is intercepted at greater rates than rain, and snowpack integrates canopy structure effects through modified energy environments. When the mosaic of environments created by 3-D forest structure was simplified into five classes, the relative importance of 3-D structure for LWI (as a fraction of winter P) was indeed more important at sites and in years when snow covered duration was longer (Figures 7, 10; Supplementary Table S2), although it was LWI at warm edges, not cool edges, that was enhanced. Accordingly, the additional complexity of 3-D modeling, when compared to the simple 1-D canopy cover approach to scaling snow processes, was more warranted in a cool/wet year with longer snow-covered duration (Figure 10).
Across the elevation gradient of snow persistence represented by these Arizona sites, canopy interception is an important control of partitioning winter precipitation between sublimation losses and liquid water inputs (Table 2; Figure 9). Therefore, removing canopy is expected to increase both peak SWE and LWI. However, uncovered areas have different snow dynamics and hydrologic partitioning depending upon the three-dimensional structure of nearby forest, and this matters more when winter is longer, especially during the final days and weeks of winter, when energy fluxes are highest (Figure 7; Supplementary Table S2). While we expected the greater net radiation at warm forest edges to drive greater sublimation (H1), we found instead more rapid snowmelt, decreasing exposure to sublimation (Figure 7).
6.2 Study implications
This work has important implications for forest management in the interior United States Southwest, which is typified by thin, ephemeral snowpacks and high radiation inputs and where nearly all snowmelt occurs below tree line (Broxton et al., 2021). Our results suggest that forest management reducing canopy would benefit LWI amount by 5–11% of winter P when contrasting under-canopy with the mean of all other environments (Figure 9). As a simple thought experiment, consider the effects of reducing canopy cover from 66 to 33% in a watershed with 400 mm winter precipitation. Assuming an average 9% increase in LWI for the portion converted from canopy to any uncovered environment, LWI across the watershed is predicted to increase by 3% of winter P, or 12 mm. However, our results show that forest structure matters, at least when snow is relatively persistent, and that further LWI amount enhancements might be possible with post-thinning structure prioritizing an abundance of warm edges (Figures 8, 9). It should be noted, however, that LWI inputs on warm edges occur episodically in small pulses throughout winter, contrasting with the more concentrated and higher intensity inputs at cool and open edges at site 4 during spring. Therefore, it is unclear if the increased LWI at warm edges and warm sites enhances surface or subsurface runoff or if it is evaporated and transpired during the more frequent warm, snow-free periods. Furthermore, although the sites in this study do not have an elevational precipitation gradient, higher/colder sites with longer winters and more persistent snowpack usually have greater precipitation inputs, making them overall more important for streamflow generation.
The results of this study emphasize the potential of forest management to significantly affect snowmelt timing (Figure 9). Earlier snowmelt is expected to generate streamflow more efficiently because it occurs at a time of low evaporative demand and plant uptake (Knighton et al., 2020; Robles et al., 2020; Biederman et al., 2022; Gordon et al., 2022). Here, we found that reducing tree cover tended to delay snowmelt at warm sites with ephemeral snowpack but advance melt timing when snowpack is persistent (Figure 9). While this pattern of canopy having opposing effects on snow cover duration at warm vs. cool sites is consistent with prior frameworks, our finding that canopy prolongs snow cover at site 4, with mean DJF temperature of −0.1°C (Table 1), suggests a higher threshold for the switching behavior than previously reported (-1°C, Lundquist et al., 2013 or − 4.5°C, Safa et al., 2021). The spatial structure of the remaining forest has the potential to influence snowmelt timing, with snow cover at cool edges lasting longer than at warm edges by an average of 15 days (Figure 9) and up to 60 or more days (Figure 7). In large-scale efforts to restore forests to historically lower density and improved fire resilience through mechanical thinning and managed fire, such as the Four Forest Restoration Initiative,1 forest cover reduction goals are relatively fixed and generally driven by fire-risk reduction (Robles et al., 2014). However, the present results suggest there is an opportunity to consider how the spatial arrangement of thinning influences the amount and timing of liquid water inputs. In watersheds similar to our study sites, thinning that prioritizes cool edges is likely to delay snowmelt, enhancing the “water tower” benefits of storing water resources at high elevation, shortening the duration of summer drought stress for vegetation (Belmonte et al., 2022; Sankey and Tatum, 2022; Dwivedi et al., 2023), but exposing snowpack to additional sublimation and reducing water input volumes. Thinning that instead prioritizes warm edge creation is suggested to advance snowmelt timing, decreasing sublimation losses and potentially enhancing streamflow through increasing of LWI and decoupling of water and energy availability, although this would depend in part on the rate of snowmelt, with higher snowmelt rates (e.g., mm/day) producing greater streamflow per unit of SWE (Barnhart et al., 2016). Even if warm edges enhance LWI to the root zone, earlier conclusion of snowmelt may increase vegetation water stress (Dwivedi et al., 2023). Across large landscapes, treated areas that result in warm versus cool edge environments may be of similar magnitudes, suggesting that these impacts may counteract one another. However, we are pursuing further research to evaluate if variations in forest treatment attributes such as orientation of openings or perimeter to area ratios can result in meaningful shifts in hydrological outcomes at the landscape scale.
This snow-focused work has important implications for other ecohydrological outcomes. Coupling of these snow analyses with soil moisture measurements is important to evaluate the accuracy of the LWI time series and quantify the impacts of these moisture inputs on soil moisture. We recently conducted such research with a limited number of soil profiles and a one-dimensional soil moisture model to estimate drought stress and deep percolation (Dwivedi et al., 2023), but modeling work across hillslope at catchment scales is a vital step toward understanding hydrologic feedbacks at the hillslope scale, including plant-water relations (Tai et al., 2017, 2018; Thomas et al., 2024) and larger-scale streamflow prediction (Safeeq et al., 2013; Watts et al., 2016). Second, forest managers urgently seek assessment of how forest thinning affects successional trajectories, fuels moisture, and seedling success, all of which could be accomplished through coupled studies of snow, soil moisture, and forest ecology (Jackson Leonard, USFS Rocky Mountain Research Station, personal communication Dec 1, 2023).
6.3 Next steps
There are several important avenues for advancement of this work. First, while snow depth is generally more variable than density, density becomes an increasingly important source of uncertainty when snow depth is shallow (Raleigh and Small, 2017), and field measurements of snow density can be used with machine learning to map density (Broxton et al., 2019). Second, simplistic snow environment definitions (e.g., ≤ 10 m north of any pixel with canopy density ≥ 10% is considered a cool edge) ignore the important complexities observed on the ground. Because radiation penetrates some distance northward from a gap into the forest, the “warm edge” is most likely a transitional environment rather than being truncated at the forest edge (Supplementary Figure S3). In more windy locations, wind effects on spatial distribution of snow have been shown to occur over length scales of up to 55 and 98 m on the windward and leeward sides of forest stands (Webb et al., 2020). Snowtography stations installed since 2023 include elements to characterize the length scale of warm edges in various forest types including across north–south transitions, intended to quantify radiation length scales, and along east–west transitions, to capture wind effects along the prevailing wind direction. Third, there is a need to expand this work to colder, snowier, and windier sites at higher elevations and latitudes (we established Snowtography sites in Colorado and Wyoming, United States, in 2021–2023). It is possible that in more energy-limited environments, snowpack will be relatively persistent across the forest structural mosaic, and that instead of driving earlier melt, the increased radiation at warm edges will indeed drive greater sublimation, consistent with our Hypothesis 1. Finally, mostly level sites were selected for this study to isolate canopy effects, whereas slope and aspect are strong controls on snow processes (Broxton et al., 2014, 2021).
7 Conclusion
The powerful combination of lidar spatial snapshots and daily time series of Snowtography snow depths distributed across the mosaic of forest structure allowed us to query a high-resolution forest hydrology model about the impacts of forest structure on snow water resources. A key advance is the incorporation of daily snow depth data from many locations, which improves the ability of models to represent hydrologic processes of precipitation partitioning, snowpack accumulation, sublimation, and melt. Several relevant conclusions for forest management in the seasonally dry forests of the United States Southwest are: (1) where snowpack duration is short, tree removal is likely to increase the amount of liquid water input and delay its timing, and the spatial arrangement of trees has minimal impacts on snowmelt variability within gaps; (2) when snowpack duration is long (greater winter snowfall and/or colder sites), tree removal is likely to increase liquid water input amounts but delay its timing, and snowmelt amount and timing within gaps are strongly controlled by the spatial arrangement of surrounding forest; (3) forest management enhancing sunny, warm edges may produce earlier and larger snowmelt volumes, while shaded cool edges retain snow longer, thereby losing more snow to sublimation but shortening the duration of summer drought between snowmelt and the onset of summer rainfall.
Author’s note
USDA is an equal opportunity provider and employer.
Data availability statement
The SNOTEL data can be freely accessed from https://www.nrcs.usda.gov/wps/portal/wcc/home/aboutUs/monitoringPrograms/automatedSnowMonitoring/. The Snowtography data are available from the corresponding author upon a reasonable request. The 2013 lidar data from Four Forest Restoration Initiative (4FRI) are available from the USDA Forest Service after agreeing with its non-disclosure agreement. The 2019 lidar data can be made available by the Arizona Remote Sensing Center upon request. Finally, all modeling data (inputs and outputs) and the used version of the SnowPALM model can be accessed from Dwivedi et al. (2024).
Author contributions
RD: Conceptualization, Formal Analysis, Investigation, Visualization, Writing – original draft, Writing – review & editing. JB: Conceptualization, Funding acquisition, Methodology, Resources, Supervision, Writing – original draft, Writing – review & editing. PB: Conceptualization, Data curation, Investigation, Methodology, Resources, Software, Supervision, Writing – original draft, Writing – review & editing. JP: Writing – review & editing. KL: Data curation, Writing – review & editing. BS: Data curation, Writing – review & editing. WL: Data curation, Writing – review & editing. MR: Project administration, Writing – review & editing.
Funding
The author(s) declare that financial support was received for the research, authorship, and/or publication of this article. This project is financially supported by the Nature Conservancy and the Salt River Project. TNC’s contributions to this work were made possible, in part, by generous support from Enterprise Rent-A-Car Foundation.
Acknowledgments
We thank: (i) Paul L. Heinrich and Temuulen Sankey, Northern Arizona University, Flagstaff, for Site 1 weather station data (SEGA project); (ii) William Currier, NOAA Physical Science Laboratory, and Julia Mazzotti, WSL Institute for Snow and Avalanche Research SLF, for their help related to snow environment classification; and (iii) the Arizona Remote Sensing Center at the University of Arizona, for collecting Site 1 UAV lidar and providing the snowtography and lidar point cloud data for Arizona field sites. Finally, we would like to thank the Salt River Project and The Nature Conservancy for financially supporting this project.
Conflict of interest
The authors declare that the research was conducted in the absence of any commercial or financial relationships that could be construed as a potential conflict of interest.
Publisher’s note
All claims expressed in this article are solely those of the authors and do not necessarily represent those of their affiliated organizations, or those of the publisher, the editors and the reviewers. Any product that may be evaluated in this article, or claim that may be made by its manufacturer, is not guaranteed or endorsed by the publisher.
Supplementary material
The Supplementary material for this article can be found online at: https://www.frontiersin.org/articles/10.3389/frwa.2024.1374961/full#supplementary-material
Footnotes
References
Bales, R. C., Molotch, N. P., Painter, T. H., Dettinger, M. D., Rice, R., and Dozier, J. (2006). Mountain hydrology of the western United States. Water Resour. Res. 42, 1–13. doi: 10.1029/2005WR004387
Barnett, T. P., Adam, J. C., and Lettenmaier, D. P. (2005). Potential impacts of a warming climate on water availability in snow-dominated regions. Nature 438, 303–309. doi: 10.1038/nature04141
Barnhart, T. B., Molotch, N. P., Livneh, B., Harpold, A. A., Knowles, J. F., and Schneider, D. (2016). Snowmelt rate dictates streamflow. Geophys. Res. Lett. 43, 8006–8016. doi: 10.1002/2016GL069690
Barnhart, T. B., Tague, C. L., and Molotch, N. P. (2020). The counteracting effects of snowmelt rate and timing on runoff. Water Resour. Res. 56:e2019WR026634. doi: 10.1029/2019wr026634
Belmonte, A., Sankey, T., Biederman, J. A., Bradford, J., Goetz, S. J., Kolb, T., et al. (2019). UAV -derived estimates of forest structure to inform ponderosa pine forest restoration. Remot. Sens. Ecol. Conserv. 6, 181–197. doi: 10.1002/rse2.137
Belmonte, A., Sankey, T. T., Biederman, J., Bradford, J. B., and Kolb, T. (2022). Soil moisture response to seasonal drought conditions and post-thinning forest structure. Ecohydrology 15:e2406. doi: 10.1002/eco.2406
Biederman, J. A., Brooks, P. D., Harpold, A. A., Gochis, D. J., Gutmann, E., Reed, D. E., et al. (2012). Multiscale observations of snow accumulation and peak snowpack following widespread, insect-induced lodgepole pine mortality. Ecohydrology 7, 150–162. doi: 10.1002/eco.1342
Biederman, J. A., Harpold, A. A., Gochis, D. J., Ewers, B. E., Reed, D. E., Papuga, S. A., et al. (2014). Increased evaporation following widespread tree mortality limits streamflow response. Water Resour. Res. 50, 5395–5409. doi: 10.1002/2013WR014994
Biederman, J. A., Scott, M. D. R. R. L., and Knowles, J. F. (2022). Streamflow response to wildfire differs with season and elevation in adjacent headwaters of the lower Colorado River basin. Water Resour. Res. 58:e2021WR030687. doi: 10.1029/2021WR030687
Biederman, J. A., Somor, A. J., Harpold, A. A., Gutmann, E. D., Breshears, D. D., Troch, P. A., et al. (2015). Recent tree die-off has little effect on streamflow in contrast to expected increases from historical studies. Water Resour. Res. 51, 9775–9789. doi: 10.1002/2015WR017401
Broxton, P. D., Harpold, A. A., Biederman, J. A., Troch, P. A., Molotch, N. P., and Brooks, P. D. (2014). Quantifying the effects of vegetation structure on snow accumulation and ablation in mixed-conifer forests. Ecohydrology 8, 1073–1094. doi: 10.1002/eco.1565
Broxton, P. D., Leeuwen, W. J. D., and Biederman, J. A. (2019). Improving snow water equivalent maps with machine learning of snow survey and Lidar measurements. Water Resour. Res. 55, 3739–3757. doi: 10.1029/2018WR024146
Broxton, P. D., Leeuwen, W. J. D., and Biederman, J. A. (2020). Forest cover and topography regulate the thin, ephemeral snowpacks of the semiarid Southwest United States. Ecohydrology 13:e2202. doi: 10.1002/eco.2202
Broxton, P. D., Leeuwen, W. V., Biederman, J., and Hartfield, K. (2023). “Multitemporal Snow Water Equivalent, Thermal, and Radiation Monitoring using Drone and Ground Surveys to Inform High Resolution Snow Modelling in Arizona’s Forests” in Paper presented at Western Snow Conference, Flagstaff, AZ, April 17–20, 2023.
Broxton, P. D., Moeser, C. D., and Harpold, A. (2021). Accounting for canopy edges is necessary to model snowpack mass and energy budgets in montane forests. Water Resour. Res. 57:e2021WR029716. doi: 10.1029/2021WR029716
Clark, M. P., Hendrikx, J., Slater, A. G., Kavetski, D., Anderson, B., Cullen, N. J., et al. (2011). Representing spatial variability of snow water equivalent in hydrologic and land-surface models: a review. Water Resour. Res. 47, 1–23. doi: 10.1029/2011WR010745
Currier, W. R., and Lundquist, J. D. (2018). Snow depth variability at the Forest edge in multiple climates in the Western United States. Water Resour. Res. 54, 8756–8773. doi: 10.1029/2018WR022553
Demaria, E. M. C., Dominguez, F., Hu, H., von Glinski, G., Robles, M., Skindlov, J., et al. (2017). Observed hydrologic impacts of Landfalling atmospheric Rivers in the salt and Verde River basins of Arizona, United States. Water Resour. Res. 53, 10025–10042. doi: 10.1002/2017WR020778
Dickerson-Lange, S. E., Howe, E. R., Patrick, K., Gersonde, R., and Lundquist, J. D. (2023). Forest gap effects on snow storage in the transitional climate of the eastern Cascade Range, Washington, United States. Front. Water 5:1115264. doi: 10.3389/frwa.2023.1115264
Dungan, R. (2023). Forest thinning produces lots of wood nobody wants. SRP has a plan for it. Available at: https://kjzz.org/
Dwivedi, R., Biederman, J. A., Broxton, P. D., Lee, K., and Leeuwen, W. J. D. V. (2022). Snowtography quantifies effects of forest cover on net water input to soil at sites with ephemeral or stable seasonal snowpack in Arizona, USA. Ecohydrology 16:e2494. doi: 10.1002/eco.2494
Dwivedi, R., Biederman, J. A., Broxton, P. D., Lee, K., van Leeuwen, W. J. D., and Pearl, J. K. (2023). Forest density and snowpack stability regulate root zone water stress and percolation differently at two sites with contrasting ephemeral vs. stable seasonal snowpacks. J. Hydrol. 624:129915. doi: 10.1016/j.jhydrol.2023.129915
Dwivedi, R., Biederman, J., Broxton, P., Pearl, J. K., Lee, K., Svoma, B. M., et al. (2024). Dataset for “How three-dimensional forest structure regulates the amount and timing of snowmelt across a climatic gradient of snow persistence”. HydroShare. doi: 10.4211/hs.896aa1fdb76f4871a00362c257d3cf91
Ebel, B. A., Shephard, Z. M., Walvoord, M. A., Murphy, S. F., Partridge, T. F., and Perkins, K. S. (2023). Modeling post-wildfire hydrologic response: review and future directions for applications of physically based distributed simulation. Earth's Future 11:e2022EF003038. doi: 10.1029/2022EF003038
Ffolliott, P. F., Malchus, J., Baker, B., and Gottfried, G. J. (2000). Heavy thinning of ponderosa pine stands: An Arizona case study, U.S. Department of Agriculture, Forest Service, Rocky Mountain Research Station, Fort Collins, CO.
Fierz, C., Armstrong, R. L., Durand, Y., Etchevers, P., Greene, E., McClung, D. M., et al. (2009). The International Classification for Seasonal Snow on the Ground UNESCO-IHP. Paris: UNESCO.
Frank, J. M., Massman, W. J., Ewers, B. E., and Williams, D. G. (2019). Bayesian analyses of 17 winters of water vapor fluxes show bark beetles reduce sublimation. Water Resour. Res. 55, 1598–1623. doi: 10.1029/2018WR023054
Goeking, S. A., and Tarboton, D. G. (2020). Forests and water yield: a synthesis of disturbance effects on streamflow and snowpack in Western coniferous forests. J. For. 118, 172–192. doi: 10.1093/jofore/fvz069
Golding, D. L., and Swanson, R. H. (1986). Snow distribution patterns in clearings and adjacent forest. Water Resour. Res. 22, 1931–1940. doi: 10.1029/WR022i013p01931
Gordon, B. L., Brooks, P. D., Krogh, S. A., Boisrame, G. F. S., Carroll, R. W. H., McNamara, J. P., et al. (2022). Why does snowmelt-driven streamflow response to warming vary? A data-driven review and predictive framework. Environ. Res. Lett. 17:053004. doi: 10.1088/1748-9326/ac64b4
Grant, G. E., Tague, C. L., and Allen, C. D. (2013). Watering the forest for the trees: an emerging priority for managing water in forest landscapes. Front. Ecol. Environ. 11, 314–321. doi: 10.1890/120209
Gupta, H. V., Kling, H., Yilmaz, K. K., and Martinez, G. F. (2009). Decomposition of the mean squared error and NSE performance criteria: implications for improving hydrological modelling. J. Hydrol. 377, 80–91. doi: 10.1016/j.jhydrol.2009.08.003
Gustafson, J. R., Brooks, P. D., Molotch, N. P., and Veatch, W. C. (2010). Estimating snow sublimation using natural chemical and isotopic tracers across a gradient of solar radiation. Water Resour. Res. 46:W12511. doi: 10.1029/2009WR009060
Hale, K. E., Jennings, K. S., Musselman, K. N., Livneh, B., and Molotch, N. P. (2023). Recent decreases in snow water storage in western North America. Commun. Earth Environ. 4, 1–11. doi: 10.1038/s43247-023-00751-3
Hammond, J. C., Saavedra, F. A., and Kampf, S. K. (2018). Global snow zone maps and trends in snow persistence 2001–2016. Int. J. Climatol. 38, 4369–4383. doi: 10.1002/joc.5674
Harder, P., and Pomeroy, J. (2013). Estimating precipitation phase using a psychrometric energy balance method. Hydrol. Process. 27, 1901–1914. doi: 10.1002/hyp.9799
Harpold, A. A., Biederman, J. A., Condon, K., Merino, M., Korgaonkar, Y., Nan, T., et al. (2014a). Changes in snow accumulation and ablation following the las Conchas Forest fire, New Mexico, USA. Ecohydrology 7, 440–452. doi: 10.1002/eco.1363
Harpold, A. A., Brooks, P., Rajagopal, S., Heidbuchel, I., Jardine, A., and Stielstra, C. (2012). Changes in snowpack accumulation and ablation in the intermountain west. Water Resour. Res. 48, 1–11. doi: 10.1029/2012WR011949
Harpold, A. A., Krogh, S. A., Kohler, M., Eckberg, D., Greenberg, J., Sterle, G., et al. (2020). Increasing the efficacy of forest thinning for snow using high-resolution modeling: a proof of concept in the Lake Tahoe Basin, California, USA. Ecohydrology 13:e2203. doi: 10.1002/eco.2203
Harpold, A. A., Guo, Q., Molotch, N., Brooks, P. D., Bales, R., Fernandez-Diaz, J. C., et al. (2014b). LiDAR-derived snowpack data sets from mixed conifer forests across the Western United States. Water Resour. Res. 50, 2749–2755. doi: 10.1002/2013WR013935
Hedstrom, N. R., and Pomeroy, J. W. (1998). Measurements and modelling of snow interception in the boreal forest. Hydrol. Process. 12, 1611–1625. doi: 10.1002/(SICI)1099-1085(199808/09)12:10/11<1611::AID-HYP684>3.0.CO;2-4
Hojatimalekshah, A., Gongora, J., Enterkine, J., Glenn, N. F., Caughlin, T. T., Marshall, H. P., et al. (2023). Lidar and deep learning reveal forest structural controls on snowpack. Front. Ecol. Environ. 21, 49–54. doi: 10.1002/fee.2584
Jennings, K. S., Kittel, T. G. F., and Molotch, N. P. (2018). Observations and simulations of the seasonal evolution of snowpack cold content and its relation to snowmelt and the snowpack energy budget. Cryosphere 12, 1595–1614. doi: 10.5194/tc-12-1595-2018
Knighton, J., Vijay, V., and Palmer, M. (2020). Alignment of tree phenology and climate seasonality influences the runoff response to forest cover loss. Environ. Res. Lett. 15:104051. doi: 10.1088/1748-9326/abaad9
Knowles, J. F., Bjarke, N. R., Badger, A. M., Berkelhammer, M., Biederman, J. A., Blanken, P. D., et al. (2023). Bark beetle impacts on forest evapotranspiration and its partitioning. Sci. Total Environ. 880:163260. doi: 10.1016/j.scitotenv.2023.163260
Koch, J., Demirel, M. C., and Stisen, S. (2018). The SPAtial EFficiency metric (SPAEF): multiple-component evaluation of spatial patterns for optimization of hydrological models. Geosci. Model Dev. 11, 1873–1886. doi: 10.5194/gmd-11-1873-2018
Krogh, S. A., Broxton, P. D., Manley, P. N., and Harpold, A. A. (2020). Using process based snow modeling and Lidar to predict the effects of Forest thinning on the northern Sierra Nevada snowpack. Front. For. Glob. Change 3:21. doi: 10.3389/ffgc.2020.00021
Larson, E. K., Grimm, N. B., Gober, P., and Redman, C. L. (2005). The paradoxical ecology and management of water in the Phoenix, USA metropolitan area. Ecohydrol. Hydrobiol. 5, 287–296,
Lopes, A. R., Girona-García, A., Corticeiro, S., Martins, R., Keizer, J. J., and Vieira, D. C. S. (2020). What is wrong with post-fire soil erosion modelling? A meta-analysis on current approaches, research gaps, and future directions. Earth Surf. Process. Landf. 46, 205–219. doi: 10.1002/esp.5020
Lundquist, J. D., Dickerson-Lange, S., Gutmann, E., Jonas, T., Lumbrazo, C., and Reynolds, D. (2021). Snow interception modelling: isolated observations have led to many land surface models lacking appropriate temperature sensitivities. Hydrol. Process. 35:e14274. doi: 10.1002/hyp.14274
Lundquist, J. D., Dickerson-Lange, S. E., Lutz, J. A., and Cristea, N. C. (2013). Lower forest density enhances snow retention in regions with warmer winters: a global framework developed from plot-scale observations and modeling. Water Resour. Res. 49, 6356–6370. doi: 10.1002/wrcr.20504
Manning, A. L., Harpold, A., and Csank, A. (2022). Spruce beetle outbreak increases streamflow from snow-dominated basins in Southwest Colorado, USA. Water Resour. Res. 58:e2021WR029964. doi: 10.1029/2021WR029964
Mazzotti, G., Essery, R., Moeser, C. D., and Jonas, T. (2020a). Resolving Small-scale Forest snow patterns using an energy balance snow model with a one-layer canopy. Water Resour. Res. 56:e2019WR026129. doi: 10.1029/2019wr026129
Mazzotti, G., Essery, R., Webster, C., Malle, J., and Jonas, T. (2020b). Process-level evaluation of a hyper-resolution Forest snow model using distributed multisensor observations. Water Resour. Res. 56:e2020WR027572. doi: 10.1029/2020wr027572
McCauley, L. A., Robles, M. D., Woolley, T., Marshall, R. M., Kretchun, A., and Gori, D. F. (2019). Large-scale forest restoration stabilizes carbon under climate change in Southwest United States. Ecol. Appl. 29:e01979. doi: 10.1002/eap.1979
McDowell, N. G., Anderson-Teixeira, K., Biederman, J. A., Breshears, D. D., Fang, Y., Fernández-de-Uña, L., et al. (2023). Ecohydrological decoupling under changing disturbances and climate. One Earth 6, 251–266. doi: 10.1016/j.oneear.2023.02.007
McGaughey, R. J. (2020). FUSION/LDV: Software for LIDAR data analysis and visualization (version 4.00), 212 pp, USDA Forest Service, Seattle, WA.
Moeser, C. D., Broxton, P. D., Harpold, A., and Robertson, A. (2020). Estimating the effects of Forest structure changes from wildfire on snow water resources under varying meteorological conditions. Water Resour. Res. 56:e2020WR027071. doi: 10.1029/2020wr027071
Molotch, N. P., and Bales, R. C. (2005). Scaling snow observations from the point to the grid element: implications for observation network design. Water Resour. Res. 41. doi: 10.1029/2005wr004229
Molotch, N. P., Brooks, P. D., Burns, S. P., Litvak, M., Monson, R. K., McConnell, J. R., et al. (2009). Ecohydrological controls on snowmelt partitioning in mixed-conifer sub-alpine forests. Ecohydrology 2, 129–142. doi: 10.1002/eco.48
Mountain Research Initiative EDW Working Group (2015). Elevation-dependent warming in mountain regions of the world. Nat. Clim. Chang. 5, 424–430. doi: 10.1038/nclimate2563
Musselman, K. N., Addor, N., Vano, J. A., and Molotch, N. P. (2021). Winter melt trends portend widespread declines in snow water resources. Nat. Clim. Chang. 11, 418–424. doi: 10.1038/s41558-021-01014-9
Musselman, K. N., Clark, M. P., Liu, C., Ikeda, K., and Rasmussen, R. (2017). Slower snowmelt in a warmer world. Nat. Clim. Chang. 7, 214–219. doi: 10.1038/nclimate3225
Musselman, K. N., Molotch, N. P., and Brooks, P. D. (2008). Effects of vegetation on snow accumulation and ablation in a mid-latitude sub-alpine forest. Hydrol. Process. 22, 2767–2776. doi: 10.1002/hyp.7050
NLDAS project (2021). “NLDAS Primary Forcing Data L4 Hourly 0.125 x 0.125 degree V2.0,” in NASA/GSFC/HSL. ed. D. M. Mocko [Greenbelt, Maryland, USA: Goddard Earth Sciences Data and Information Services Center (GES DISC)] (Accessed March 4, 2021).
O'Donnell, A. J., Renton, M., Allen, K. J., and Grierson, P. F. (2021). The role of extreme rain events in driving tree growth across a continental-scale climatic range in Australia. Ecography 44, 1086–1097. doi: 10.1111/ecog.05671
Painter, T. H., Berisford, D. F., Boardman, J. W., Bormann, K. J., Deems, J. S., Gehrke, F., et al. (2016). The airborne snow observatory: Fusion of scanning lidar, imaging spectrometer, and physically-based modeling for mapping snow water equivalent and snow albedo. Remote Sens. Environ. 184, 139–152. doi: 10.1016/j.rse.2016.06.018
Payton, E., Biederman, J., and Robles, M. (2021). Snowtography: Snowpack & Soil Moisture Monitoring Handbook. University of Colorado Boulder, Boulder, CO. 55 pp.
Petersky, R. S., and Harpold, A. (2018). Now you see it, now you don't: a case study of ephemeral snowpacks and soil moisture response in the Great Basin, United States. Hydrol. Earth Syst. Sci. 22, 4891–4906. doi: 10.5194/hess-22-4891-2018
Petersky, R. S., Shoemaker, K. T., Weisberg, P. J., and Harpold, A. A. (2019). The sensitivity of snow ephemerality to warming climate across an arid to montane vegetation gradient. Ecohydrology 12:e2060. doi: 10.1002/eco.2060
Pomeroy, J. W., and Musselman, K. N. (2017). Estimation of Needleleaf canopy and trunk temperatures and longwave contribution to melting snow. J. Hydrometeorol. 18, 555–572. doi: 10.1175/JHM-D-16-0111.1
Pomeroy, J. W., Parviainen, J., Hedstrom, N., and Gray, D. M. (1998). Coupled modelling of forest snow interception and sublimation. Hydrol. Process. 12, 2317–2337. doi: 10.1002/(SICI)1099-1085(199812)12:15<2317::AID-HYP799>3.0.CO;2-X
Pomeroy, J. W., and Schmidt, R. A. (1993). The Use of Fractal Geometry in Modelling Intercepted Snow Accumulation and Sublimation, in 50th Eastern Snow Conference, edited, pp. 1–10, Quebec City.
Quantum Spatial Inc. (2013). 4FRI Lidar: Four forests restoration initiative. Corvallis, Oregon. pp. 21.
Quantum Spatial Inc. (2014). 4FRI Phase II LiDAR: Four Forests Restoration Initiative Technical Data Report. Corvalis, Oregon. pp. 24.
Quantum Spatial Inc. (2019). 4FRI Snow Analysis 2019, Arizona: LiDAR Technical Data Report. Corvallis, Oregon. 22 pp.
Raleigh, M. S., Lundquist, J. D., and Clark, M. P. (2015). Exploring the impact of forcing error characteristics on physically based snow simulations within a global sensitivity analysis framework. Hydrol. Earth Syst. Sci. 19, 3153–3179. doi: 10.5194/hess-19-3153-2015
Raleigh, M. S., and Small, E. E. (2017). Snowpack density modeling is the primary source of uncertainty when mapping basin-wide SWE with lidar. Geophys. Res. Lett. 44, 3700–3709. doi: 10.1002/2016GL071999
Ren, J., Adam, J. C., Hicke, J. A., Hanan, E. J., Tague, C. L., Liu, M., et al. (2021). How does water yield respond to mountain pine beetle infestation in a semiarid forest? Hydrol. Earth Syst. Sci. 25, 4681–4699. doi: 10.5194/hess-25-4681-2021
Robles, M. D., Hammond, J. C., Kampf, S. K., Biederman, J. A., and Demaria, E. M. C. (2020). Winter inputs buffer streamflow sensitivity to snowpack losses in the Salt River watershed in the lower Colorado River basin. WaterSA 13:3. doi: 10.3390/w13010003
Robles, M. D., Marshall, R. M., O'Donnell, F., Smith, E. B., Haney, J. A., and Gori, D. F. (2014). Effects of climate variability and accelerated forest thinning on watershed-scale runoff in southwestern USA ponderosa pine forests. PLoS One 9:e111092. doi: 10.1371/journal.pone.0111092
Roebroek, C. T. J., Duveiller, G., Seneviratne, S. I., Davin, E. L., and Cescatti, A. (2023). Releasing global forests from human management: how much more carbon could be stored? Science 380, 749–753. doi: 10.1126/science.add5878
Russell, M., Eitel, J. U. H., Link, T. E., and Silva, C. A. (2021). Important airborne Lidar metrics of canopy structure for estimating snow interception. Remote Sens. 13:4188. doi: 10.3390/rs13204188
Safa, H., Krogh, S. A., Greenberg, J., Kostadinov, T. S., and Harpold, A. A. (2021). Unraveling the controls on snow disappearance in montane conifer forests using multi-site Lidar. Water Resour. Res. 57:e2020WR027522. doi: 10.1029/2020wr027522
Safeeq, M., Grant, G. E., Lewis, S. L., and Tague, C. L. (2013). Coupling snowpack and groundwater dynamics to interpret historical streamflow trends in the western United States. Hydrol. Process. 27, 655–668. doi: 10.1002/hyp.9628
Sankey, T., Belmonte, A., Massey, R., Leonard, J., Disney, M., and Armenteras, D. (2020). Regional-scale forest restoration effects on ecosystem resiliency to drought: a synthesis of vegetation and moisture trends on Google earth engine. Remot. Sens. Ecol. Conserv. 7, 259–274. doi: 10.1002/rse2.186
Sankey, T., and Tatum, J. (2022). Thinning increases forest resiliency during unprecedented drought. Sci. Rep. 12:9041. doi: 10.1038/s41598-022-12982-z
Sexstone, G. A., Clow, D. W., Fassnacht, S. R., Liston, G. E., Hiemstra, C. A., Knowles, J. F., et al. (2018). Snow sublimation in mountain environments and its sensitivity to Forest disturbance and climate warming. Water Resour. Res. 54, 1191–1211. doi: 10.1002/2017WR021172
Siirila-Woodburn, E. R., Rhoades, A. M., Hatchett, B. J., Huning, L. S., Szinai, J., Tague, C., et al. (2021). A low-to-no snow future and its impacts on water resources in the western United States. Nat. Rev. Earth Environ. 2, 800–819. doi: 10.1038/s43017-021-00219-y
Strickfaden, K. M., Marshall, A. M., Svancara, L. K., Ausband, D. E., and Link, T. E. (2023). Understanding the spatiotemporal distribution of snow refugia in the rain-snow transition zone of north-Central Idaho. Environ. Res. Lett. 18:044014. doi: 10.1088/1748-9326/acbb90
Sturm, M., Holmgren, J., and Liston, G. E. (1995). A seasonal snow cover classification system for local to global applications. J. Clim. 8, 1261–1283. doi: 10.1175/1520-0442(1995)008<1261:ASSCCS>2.0.CO;2
Tai, X., Mackay, D. S., Anderegg, W. R., Sperry, J. S., and Brooks, P. D. (2017). Plant hydraulics improves and topography mediates prediction of aspen mortality in southwestern USA. New Phytol. 213, 113–127. doi: 10.1111/nph.14098
Tai, X., Mackay, D. S., Sperry, J. S., Brooks, P., Anderegg, W. R. L., Flanagan, L. B., et al. (2018). Distributed plant hydraulic and hydrological modeling to understand the susceptibility of riparian woodland trees to drought-induced mortality. Water Resour. Res. 54, 4901–4915. doi: 10.1029/2018WR022801
Thomas, A., Kolb, T., Biederman, J. A., Venturas, M. D., Ma, Q., Yang, D., et al. (2024). Mitigating drought mortality by incorporating topography into variable forest thinning strategies. Environ. Res. Lett. 19:034035. doi: 10.1088/1748-9326/ad29aa
Troendle, C. A., and Reuss, J. O. (1997). Effect of clear cutting on snow accumulation and water outflow at Fraser, Colorado. Hydrol. Earth Syst. Sci. 1, 325–332. doi: 10.5194/hess-1-325-1997
Udall, B., and Overpeck, J. (2017). The twenty-first century Colorado River hot drought and implications for the future. Water Resour. Res. 53, 2404–2418. doi: 10.1002/2016WR019638
Uecker, T. M., Kaspari, S. D., Musselman, K. N., and McKenzie Skiles, S. (2020). The post-wildfire impact of burn severity and age on black carbon snow deposition and implications for snow water resources, Cascade Range, Washington. J. Hydrometeorol. 21, 1777–1792. doi: 10.1175/JHM-D-20-0010.1
van Leeuwen, W.Quantum Spatial Inc. (2017). Technical Data Report—4FRI Snow Analysis LiDAR Project, Tucson, AZ. pp. 1–25.
Varhola, A., Coops, N. C., Weiler, M., and Moore, R. D. (2010). Forest canopy effects on snow accumulation and ablation: an integrative review of empirical results. J. Hydrol. 392, 219–233. doi: 10.1016/j.jhydrol.2010.08.009
Viviroli, D., and Weingartner, R. (2004). The hydrological significance of mountains: from regional to global scale. Hydrol. Earth Syst. Sci. 8, 1017–1030. doi: 10.5194/hess-8-1017-2004
Watts, A., Grant, G., and Safeeq, M. (2016). Flows of the future how will climate change affect streamflows, 5 p. pp, U.S. Department of Agriculture, Forest Service, Pacific Northwest Research Station, Portland, OR.
Webb, R. W., Raleigh, M. S., McGrath, D., Molotch, N. P., Elder, K., Hiemstra, C., et al. (2020). Within-stand boundary effects on snow water equivalent distribution in forested areas. Water Resour. Res. 56. doi: 10.1029/2019wr024905
Winchell, T. S., Barnard, D. M., Monson, R. K., Burns, S. P., and Molotch, N. P. (2016). Earlier snowmelt reduces atmospheric carbon uptake in midlatitude subalpine forests. Geophys. Res. Lett. 43, 8160–8168. doi: 10.1002/2016GL069769
Winstral, A., and Marks, D. (2002). Simulating wind fields and snow redistribution using terrain-based parameters to model snow accumulation and melt over a semi-arid mountain catchment. Hydrol. Process. 16, 3585–3603. doi: 10.1002/hyp.1238
Xia, Y., Mitchell, K., Ek, M., Sheffield, J., Cosgrove, B., Wood, E., et al. (2012). Continental-scale water and energy flux analysis and validation for the north American land data assimilation system project phase 2 (NLDAS-2): 1. Intercomparison and application of model products. J. Geophys. Res. 117, 1–27. doi: 10.1029/2011JD016048
Keywords: ephemeral snowpack, snow model, liquid water input, snow duration, snow persistence, sublimation
Citation: Dwivedi R, Biederman JA, Broxton PD, Pearl JK, Lee K, Svoma BM, van Leeuwen WJD and Robles MD (2024) How three-dimensional forest structure regulates the amount and timing of snowmelt across a climatic gradient of snow persistence. Front. Water. 6:1374961. doi: 10.3389/frwa.2024.1374961
Edited by:
Alex Furman, Technion Israel Institute of Technology, IsraelReviewed by:
Tanya Doody, Commonwealth Scientific and Industrial Research Organization (CSIRO), AustraliaRyan Webb, University of Wyoming, United States
Copyright © 2024 Dwivedi, Biederman, Broxton, Pearl, Lee, Svoma, van Leeuwen and Robles. This is an open-access article distributed under the terms of the Creative Commons Attribution License (CC BY). The use, distribution or reproduction in other forums is permitted, provided the original author(s) and the copyright owner(s) are credited and that the original publication in this journal is cited, in accordance with accepted academic practice. No use, distribution or reproduction is permitted which does not comply with these terms.
*Correspondence: Ravindra Dwivedi, cmF2aW5kcmEuZHdpdmVkaUB1c2RhLmdvdg==