- 1Centre for the Study of Regional Development, Jawaharlal Nehru University, New Delhi, India
- 2Department of Geography, Bharathidasan University, Tiruchirappalli, India
- 3Department of Environmental Studies, Ramanujan College, University of Delhi, New Delhi, India
- 4Community and Regional Planning, University of Nebraska Lincoln, Lincoln, NE, United States
Land use refers to how the surface of a designated area is utilized, encompassing both developed and vacant lands. The intricate interplay between population growth and the availability of natural resources gives rise to diverse challenges that are exhibited in the recharge of groundwater. This research was conducted in the Koraiyar Watershed, Coimbatore District, Tamil Nadu, India. The change in the land use land cover (LULC) was detected by digitizing the linear imaging self scanning sensor (LISS) III and LISS IV satellite images for the years 2000 and 2011 using the maximum likelihood classification algorithm. LANDSAT-8 OLI data were processed for the year 2020. The study area has subsequently undergone an assessment of groundwater levels to determine the impact between groundwater and land use land cover. The result of the study indicates a continuous decrease in the wet crop area, which is the effect of the gradual depletion of groundwater resources. Along with this, the narrowing of the water bodies and increased areas of dry crops, industrial areas, and quarries are also responsible for lowering groundwater table depletion and contamination. Settlements increased from 39 to 49 km2 from 2000 to 2011 and then gradually increased by 50 km2 in 2020 to meet the demand of the population. From 2000 to 2019, the groundwater level has been declining with respect to the LULC pattern. The increase in concrete platforms in the study can affect the infiltration. Thus, the study can aid in developing water management strategies and decisions for governmental and non-governmental policymakers.
Introduction
Land use refers to the various ways in which human beings utilize and exploit the land and its resources, encompassing activities such as agriculture, urban development, grazing, logging, and mining. The term land cover initially pertains to the classification and condition of vegetation, encompassing various types such as grassland or forest cover (Kidane et al., 2012; Hishe et al., 2021; Baeza et al., 2022; Cai et al., 2022), cultivated land, woodland, and marshes (Jaiswal et al., 1999; Homar et al., 2020). The spatial distribution of land use land cover (LULC) is typically influenced by many factors, including agro-climatic conditions, the potential of groundwater resources, and various other factors (Nayak and Mandal, 2019; Regasa et al., 2021). Nevertheless, its definition has broadened in its subsequent usage to include man-made constructions, such as edifices, and other components of the natural surroundings, such as soil composition, biodiversity, surface water, and groundwater. However, its meaning has expanded over time to encompass human-made structures such as buildings and other elements of the natural environment such as soil composition, biodiversity, surface water, and groundwater (Meyer and Turner, 1994; Meyer, 1995; Chen et al., 2008; Patidar and Behera, 2019).
Land resources serve as the fundamental foundation for a multitude of developmental endeavors on the planet. LULC refers to the various human activities and economic functions that are associated with a particular parcel of land. On the other hand, the term land cover pertains to the specific type of physical feature that exists on the Earth's surface (Lillesand and Kiefer, 2000; Ellis and Pontius, 2006). The rapidly growing population creates a huge pressure on the land and food resources (Hao et al., 2023; Na et al., 2023). When the land is given a particular use, the interest of other uses may be overlooked. Land that has been withdrawn from agricultural use rarely reverts to the farmer. The LULC change detection method can differentiate the land area used for several purposes. The purpose of LULC change detection is to maximize productivity. Due to climatic factors, soil, land topography, degree of erosion, supply of water, and environmental conditions, the change of LULC is inevitable (Masilamani and Aruchamy, 2017). The degradation of forests has a significant impact on catchment processes and biochemical cycles, leading to soil degradation and water scarcity in both local and distant districts (Kinattinkara et al., 2022). Nowadays, increased human activities lead to land degradation, and this changing pattern of the land can be easily detected by the LULC change detection method (de Mello et al., 2020; Chen et al., 2023).
The spatial distribution of the population and the economy of the people can be altered by converting land from one use to another, such as transforming agricultural areas into residential, industrial, commercial, or recreational zones. The landowners play a crucial role in determining the course and extent of any developments on the property; hence, their decisions have a significant impact on the direction and magnitude of changes (Ettema et al., 2009). Several studies have been conducted by researchers to investigate LULC change in the Coimbatore District (Sensing, 2014; Kalpana, 2018; Prabu and Dar, 2018; Kinattinkara et al., 2022; Anand et al., 2023). Kumaraswamy and Nandha (2015) studied the spatio-temporal analysis of LULC from 2000 to 2014 in the present study area, and Palanisamy (2014) analyzed the LULC changes from 1992 to 2009 using remote sensing and GIS.
The detection of changes in the LULC has been identified by using remote sensing (RS) and geographical information systems (GIS). Inverse distance weighting (IDW) is a type of interpolation method used in geographic information systems (GIS) to examine the values of unsampled locations based on the values of known locations. Using the IDW tool, the spatial distributions of groundwater levels were mapped. The land cover changes have a direct correlation with the change in the water resources and the groundwater level depletion along with the land cover pattern. The cropping pattern, industries, and settlement all need huge amounts of water to complete their final shape, and these anthropogenic activities deteriorate natural cover and natural resources, mainly groundwater resources, and change the land use land cover pattern day by day. LULC has emerged as a crucial component in contemporary strategies aimed at the management of natural resources.
Groundwater is the least contaminated available freshwater, and it is highly utilized in different sectors, i.e., industry, agriculture, aquaculture, and domestic uses. Population growth, industrial growth, and other developmental projects demand the excessive withdrawal of groundwater, leading to water table depletion and contamination (Priya et al., 2012). Furthermore, the anthropogenic activities of changing the land cover for their benefit pose a great threat to natural resources and mainly to water resources (Wang and Wang, 2013; Garg et al., 2019). Various researchers have studied how much urbanization caused the reduction of groundwater level and quality due to the change in time and space (Adhikari et al., 2020; Elmahdy et al., 2021; Ghimire et al., 2021).
Groundwater is replenished by rainfall recharge and surface water availability. Along with this, the terrain and the geology of the area have a great impact on the recharge capacity of rainwater and surface water. The presence of robust vegetation and a well-preserved natural cover serve as indicators of the overall health of groundwater resources. The spatial changes in vegetation and water bodies in response to the annual cycle of climate and related features are primarily responsible for some seasonal variations in LULC (Elmahdy and Mohamed, 2016; Vogelmann et al., 2016). Variations in groundwater levels and infiltration mechanisms are impacted by seasonal fluctuations (Kirimi et al., 2018). Hence, the investigation and monitoring of the effect of rapid change in the LULC on groundwater level need to be properly managed for a sustainable future. Siddik et al. (2022) identified the impact of LULC changes on groundwater recharge using the WetSpass model and the SWAT model, and Mengistu et al. (2022) evaluated the LULC dynamics on groundwater recharge and surface runoff. Beeram et al. (2023) analyzed the impact of changes in LULC and climate variables on groundwater recharge using downscaling statistics, and Dash et al. (2024) approached the LULC changes in the hydrologic response by integrating parsimonious hydrological modeling and alteration analysis. However, many studies have been carried out previously to investigate the LULC changes and assess the effect on groundwater levels, but only a few studies have focused on the regional scale.
As mentioned, various researchers have studied the LULC changes in the study area, but there has been a lack of correlation between the groundwater level and the LULC patterns. Thus, more research studies have to be conducted on critically needed domains such as water resource management. Thus, the main aim of the study is to investigate the LULC changes and their impact on groundwater levels over the Kolli Hills. To achieve the aim of the study, the main objectives are as follows:(i) to map and compare the LULC change from 2000 to 2020 using the LISS III, LISS IV, and LANDSAT-8 OLI satellite images; (ii) to prepare the spatial distribution of groundwater level using the IDW tool in ArcGIS for 2000, 2011, and 2019 consecutive years; (iii) to analyse the temporal distribution of groundwater level data for the same years; and (iv) to assess the impact of LULC changes on groundwater level. The main findings of the study will be useful for policymakers, hydrologists, and the wellbeing of society. However, this study has some limitations, such as the limited number of groundwater level sites, which may lack the realism of the study considering the relief of the area.
Study area
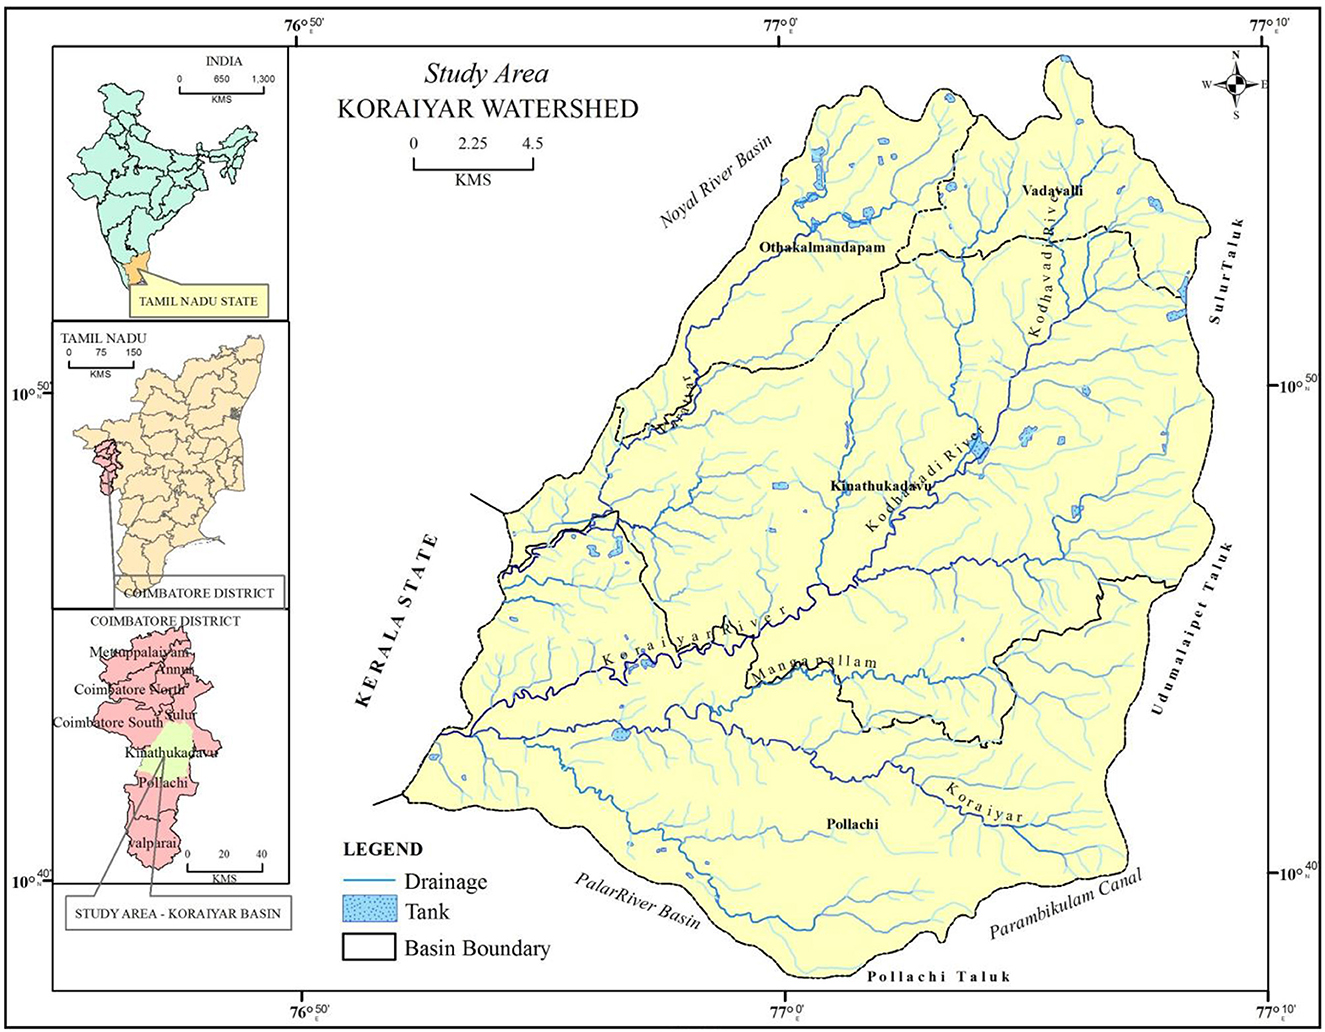
The Koraiyar watershed is situated in the southwestern region of the Coimbatore District. The geographical coordinates of the area are situated between 10° 36′N and 10° 57′N and between 76° 48′ E and 77° 09′ E (Figure 1). The total land area of this region measures approximately 659 m2. The location of origin of this watershed is in the southwestern region of Coimbatore, near Chettipalayam, situated at an elevation of 420 m above the mean sea level. The area encompasses four taluks and five blocks. The region experiences precipitation as a result of the combined impact of the southwest and northeast monsoons. The primary source of precipitation in the district is the northeast monsoon, while the amount of rainfall during the summer season is minimal (District GW brochure, CGWB, 2008). The study area exhibits a hot and humid climate. The basin is encompassed by the Noyyal River basin to the north, the Palar River basin to the south, the Valayar reserved forest in the Western Ghats to the west, and the Parambikulam canal to the east.
Geology and geomorphology
The Koraiyar watershed is characterized by the presence of calc-granulite, champion gneiss, granite, granitoid gneiss, sand, silt, and syenite. Valleys and hills are mainly composed of crystalline formations of the Quaternary Era. The rocks of the Archaean Era in this region are Charnockites (hypersthene granites), quartzite, and sillimanite–cordierite bearing garnetiferous gneiss. The five geomorphic zones of the Koraiyar watershed are as follows: inselberg, moderately buried pediplain, pediment/valley floor, pediplain canal command, and shallowly buried pediplain. Inselbergs are isolated hillocks formed as remnants of weathering and denudation processes, and this unit is present in a scattered manner in the southwestern part of the study area near Sokkanur. Alluvium and loamy soils are dominant in the study area.
Relief, drainage, and rainfall
The altitude varies from 180 m in the southeastern part of the watershed to 440 m in the northern part of the watershed, and within the watershed, two broad physiographic regions may be identified: the upland in the north and the valley in the center and southwest of the watershed. A valley formed by flowing water is usually V-shaped. There are two major rivers, namely, Varattar and Koraiyar. This forms eight major sub-watersheds in the study area. The mean annual rainfall of Podanur, which lies in the northern part of the basin, is 605 mm. However, Negamam in the south-central part gets the maximum rainfall of 913 mm. The station Aliyar Nagar, located in the southern part, receives 873 mm, whereas Vettaikaran Puthur, located in the southwestern part of the basin, receives 1,420 mm. Sulur is located in the northeastern part of the basin and receives 613 mm. Pollachi is located in the southwestern part of the basin and receives 858 mm (Masilamani and Aruchamy, 2017).
Data and methodology
Data
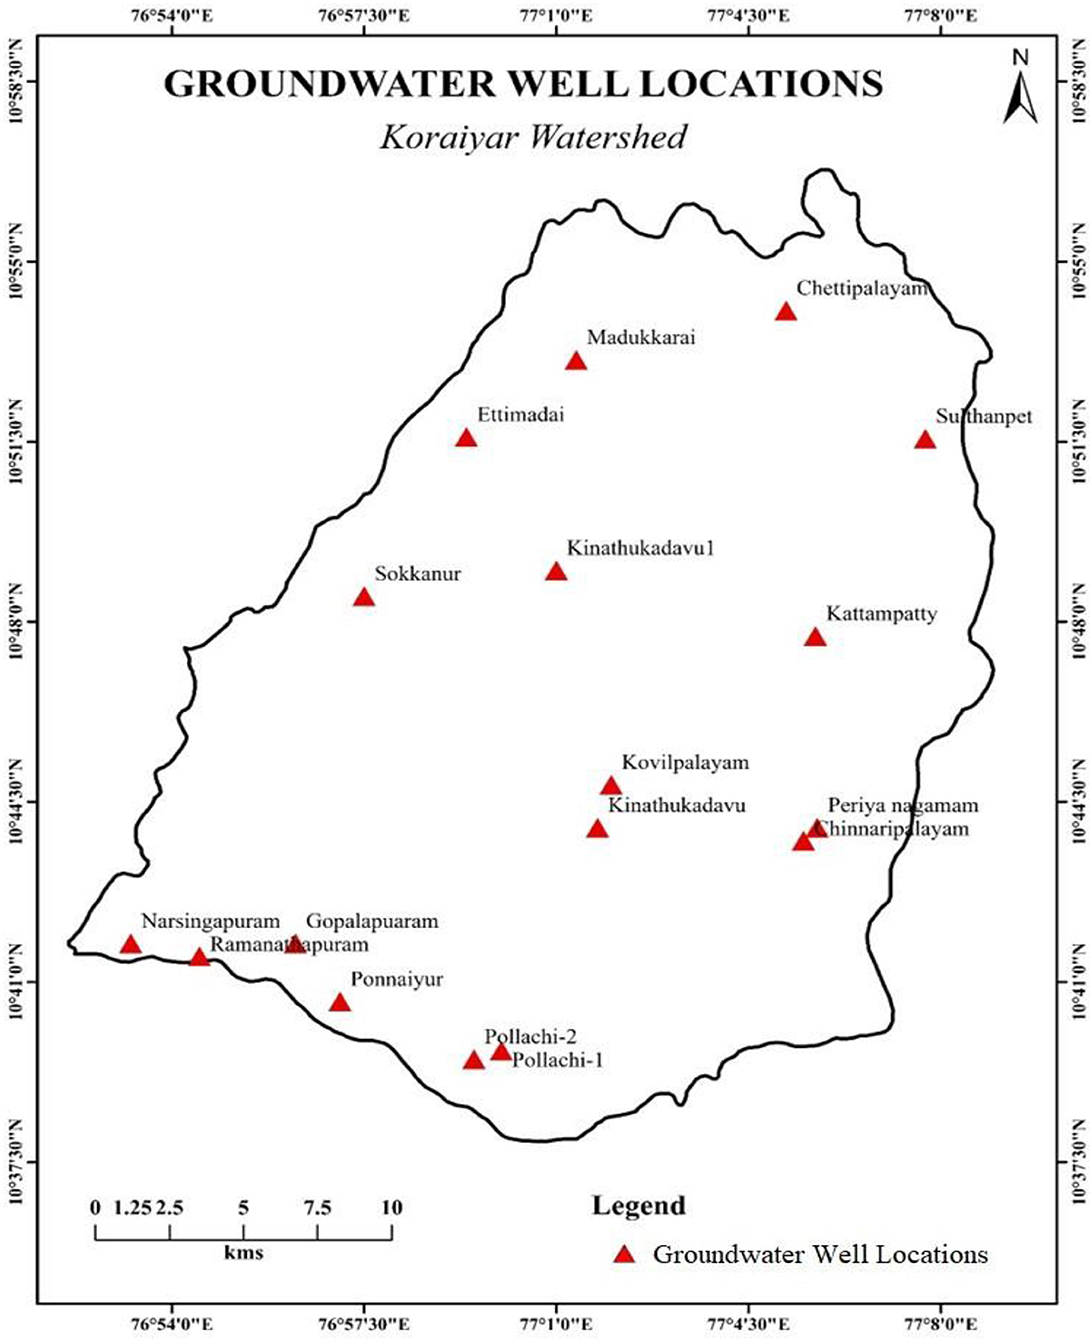
Remote sensing data were used in the present study and were used over 20 years. The LISS-III, LISS-IV, and LANDSAT-8 OLI datasets were utilized for the assessment and collected in March in the years 2000, 2011, and 2020, correspondingly. The LISS-III (Linear Imaging Self Scanning Sensor) is a multi-spectral sensor with medium-resolution capabilities. It functions in four distinct spectral bands, namely B2, B3, B4 (visible near infrared—VNIR), and B5 (short wave infrared—SWIR). The sensor offers a spatial resolution of 23.5 m. LISS-IV is a high-resolution multi-spectral sensor that operates in three spectral bands, namely, B2, B3, and B4, with a spatial resolution of 5.8 m. The LISS-III was obtained from Anna University, Chennai, and the LISS-IV satellite images were acquired from the National Remote Sensing Center in Hyderabad, India. LANDSAT-8 OLI is a global optical imagery and high-resolution multi-spectral sensor that operates in 11 spectral bands with a special resolution of 30 m. The data source for LANDSAT-8 OLI is USGS. The groundwater data were obtained from the Central Groundwater Board (CGWB) to generate the groundwater level map for 17 sites within the study area (Figure 2).
Methodology
After procuring LISS-III, LISS-IV, and LANDSAT-8 OLI data, different methods were used to create land cover maps from different satellite data (Figure 3). The similar spectral bands of satellite images were obtained, and layers stacked for LISS-III and LISS-IV geometrically matched each other. The LULC of the study area was digitized using the LISS-III and LISS-IV images, and a supervised classification method was used for the LANDSAT-8 OLI image.
During supervised classification, the signature file was generated using pixels enclosed within polygons that represent known and established classes. Maximum likelihood classification is a well-known supervised algorithm that was used to classify the LULC classification. In total, 11 land cover classes, namely barren land, dry crops, fallow land, industrial area, land with scrub, plantation, query, reservoir/lake, river/stream, settlement, and wet crop, were used in this study. The groundwater data were obtained from the Central Ground Water Board (CGWB) for the years 2000, 2011, and 2019 for pre-monsoon. Spatial variations of groundwater level were analyzed in the GIS environment by IDW interpolation. Findings indicate a rising and decreasing trend in the groundwater level of the study area from 2000 to 2019.
Results and discussion
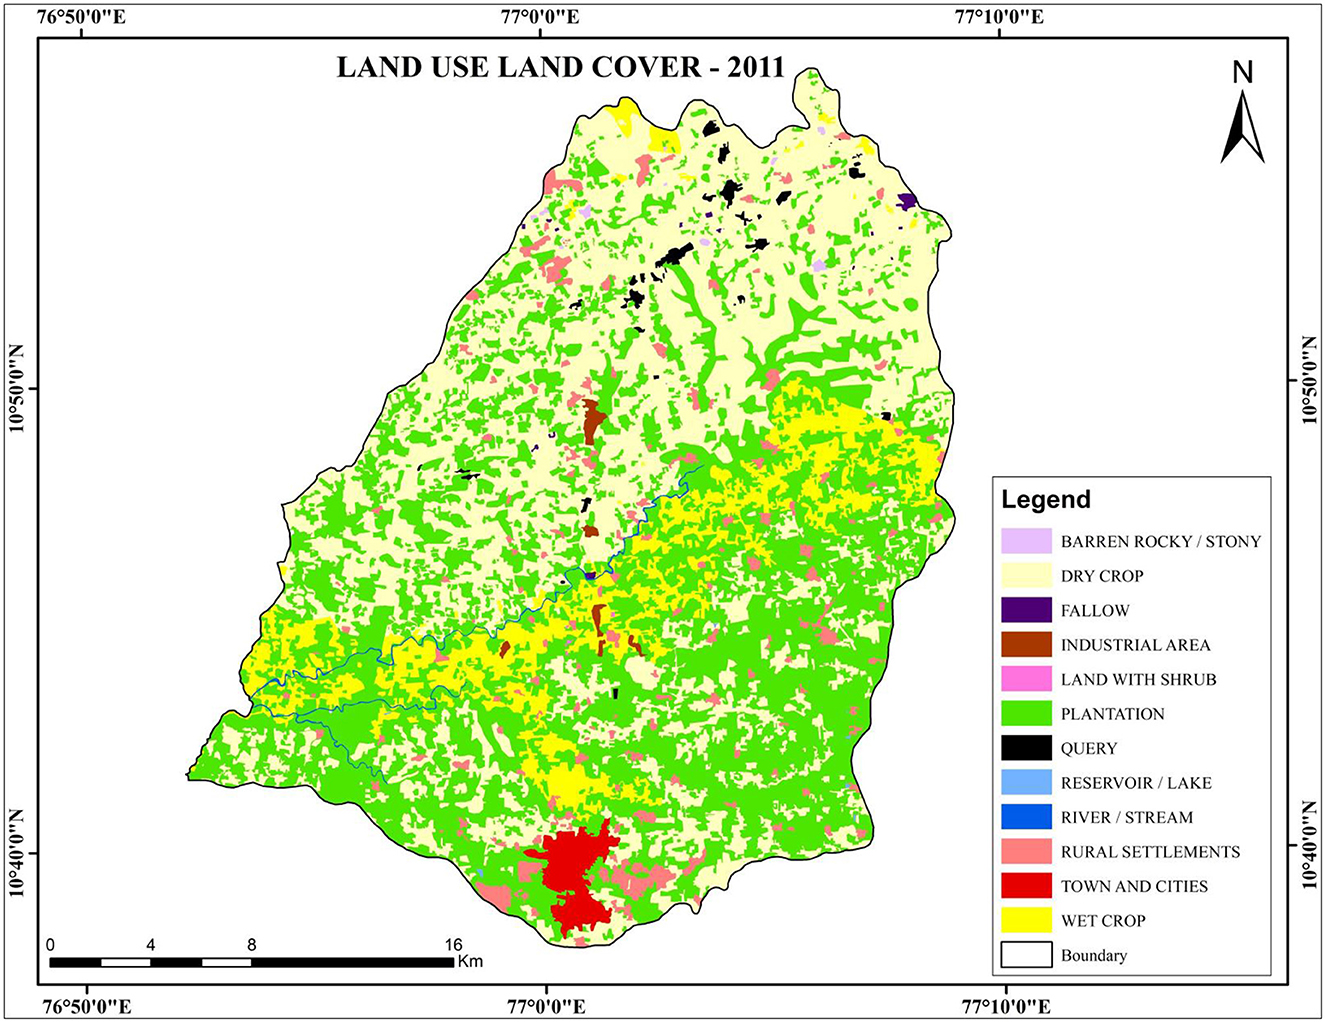
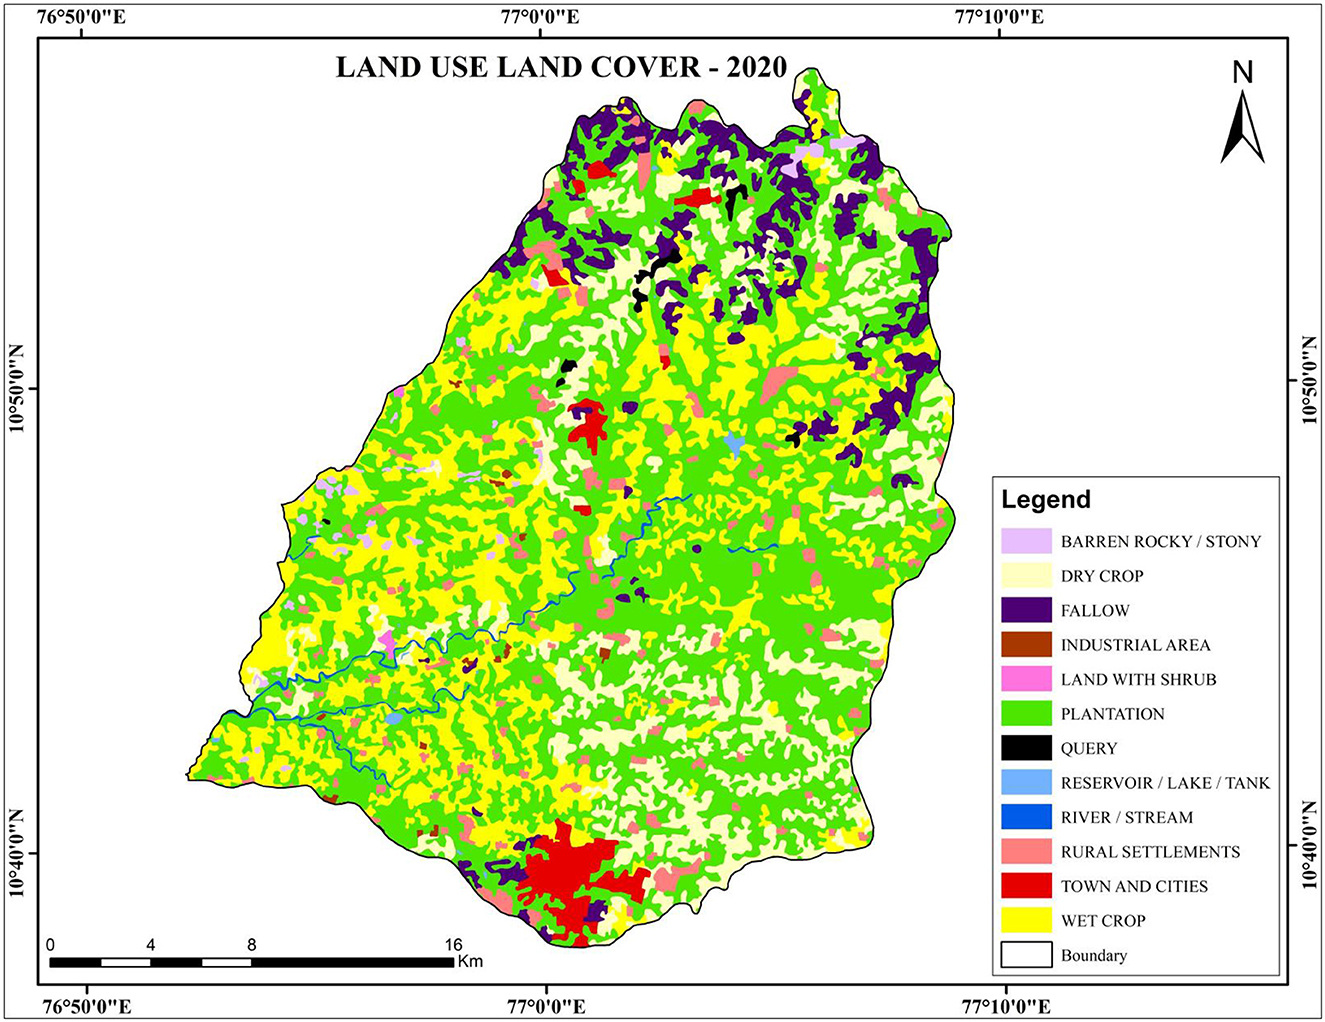
This study has shown the decreasing trend of natural land cover due to the high use of land resources from the increasing population. The study area is dominated by coconut, banana, and mango plantations and an agricultural area of dry and wet crops. Figures 4–6 depict the LULC change over 20 years. The change detection analysis is described in Table 1.
Settlement
Urban areas are regions where human settlement has been established primarily for non-agricultural purposes, characterized by the presence of buildings, transportation and communication infrastructure, utilities in conjunction with water resources, vegetation, and unoccupied land. The LULC map comprises two distinct categories within the settlement class, namely, urban, and rural areas. Urban areas are distinguished by the presence of agricultural, horticultural, and plantation spaces that coexist with built structures.
Economic development and demand for housing by households result in the “sealing of soil” and rapid changes in their structure by the extension of transport networks, and waste dumping leads to environmental degradation. The urban centers in the study area are Pollachi, Kinathukadavu, Coimbatore South, Sulur, and new urban development areas which include Malumichampatti and Chettipalayam. Furthermore, rural areas can be defined as densely populated regions that are relatively smaller in scale, primarily characterized by their focus on agricultural and related industries, as well as non-commercial endeavors. In this area of settlement, human interaction was highly improved in the Koraiyar watershed. It has been observed that the settlement increased from 2000 to 2011 from 39 to 49 km2 and then gradually increased to 50 km2 in 2020 in the study area due to population growth (Sundari, 2005) (Table 1).
Agricultural land
The aforementioned territories are predominantly allocated for agricultural purposes, serving as the main sites for cultivating crops intended for sustenance, textile production, and the cultivation of various commercial and horticultural commodities. It consists of double-crop lands or a combination of double-crop lands. The dry crops have shown an increasing trend gradually, and it has more than doubled in 2011, and a subsequent gradual decline was observed in 2020. Moreover, there was an overall increase in dry crop area from 2000 to 2011 from 96 to 210 km2 and 269 km2 in 2020 (Table 1).
The gradual decline in wet crops in 2011 was due to an increase in dry crops, whereas an increase in wet crops was observed in subsequent years. This phenomenon can also be correlated with the temporal variation of groundwater levels. The northern and southern parts had high levels of groundwater level in 2000, and hence, the wet crop pattern was high, whereas in 2011, in the southwest and eastern parts of the watershed, the groundwater level was high, and the wet crop was concentrated on those parts of the study area.
Plantations
These are the regions where agricultural tree crops have been cultivated using agricultural management techniques. The spatial distribution of these entities can vary depending on their specific geographic location, resulting in either a disseminated or contiguous pattern. The utilization of multi-season data will facilitate a more effective differentiation between them. The area encompasses various types of plantations, such as agricultural plantations and horticultural plantations, which consist of fruit trees, vegetable gardens, and specific crops such as bananas, coconuts, mangoes, and other cultivated plants. The high-cover plantation areas include Kappalankarai, Kakkadavu, and Kullakkalpalayam watershed areas. Plantation decreased from 318 to 262 km2 in 2011, and then a gradual increase was noted in 2020 from 262 to 304 km2 (Table 1). The shrubland increased in 2011 and gradually decreased in 2020.
Fallow land
These are the lands that are utilized for cultivation but are temporarily left uncultivated for one or more seasons. The agricultural system is characterized by the cyclic rotation of cultivated periods spanning several years and fallow periods. In this study, the fallow land decreased drastically in 2011 from 42 to 2 km2 and then gradually decreased in 2020 from 2 to 1 km2 (Table 1). Fallow land has changed into cropland and plantations. Wasteland follows the fluctuation in its area over time. At the same time, the industrial area shows a gradual increase in its area due to development activities. Query decreased in 2011 and then increased in 2020. The decrease in query in 2011 could be due to the region occupied by plantation query.
Water bodies
Wetlands are described as any areas that are covered or saturated with water, whether natural or artificial, permanent or temporary, stable or changing, with or without vegetation, as long as they have a boundary between land and water. In this study, the water body includes the reservoirs/lakes and rivers/streams. Rivers/streams were almost constant in 2000 and 2011, but in 2020, rivers/streams decreased to 2 km2, whereas reservoir/lake increased gradually in 2011, and then again, a gradual decrease was noted in 2020.
Groundwater level
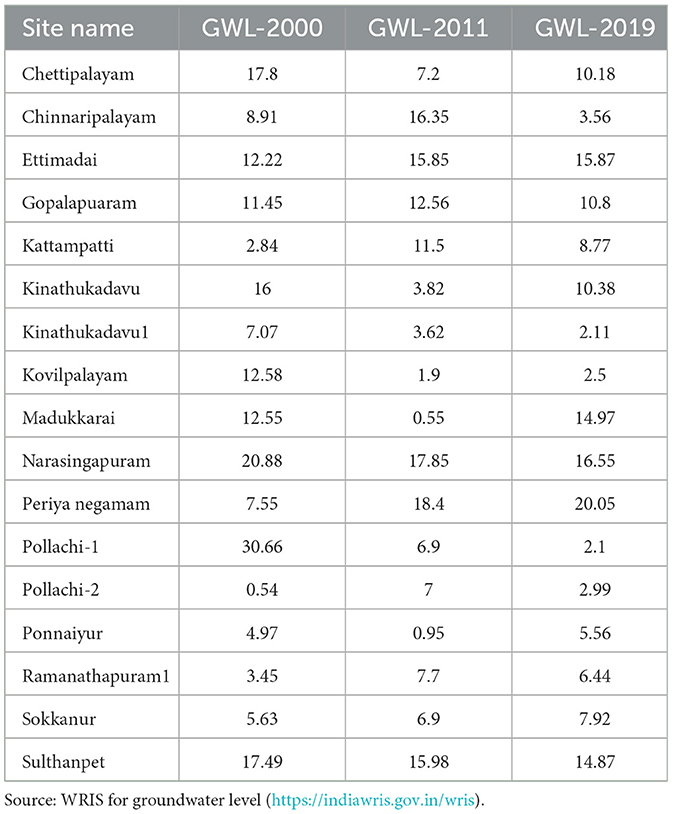
Groundwater levels can be self-sustained when the recharge and withdrawal are balanced. The recharge depends on the geology and geomorphology, rainfall pattern, and surface water bodies such as rivers, streams, reservoirs, and lakes. LULC has shown the narrowing of the water bodies (rivers/streams and reservoirs/lakes) and an increase in the cropping pattern in dry crops and plantations from 2000 to 2020, which is an indication of a lowering of the water table. In this study, 17 sites were selected from the study area for collecting the groundwater level data. The study shows replenishment of the groundwater in Chettipalayam, Chinnaripalayam, Gopalapuaram, Kinathukadavu1, Kinathukadavu, Kovilpalayam, Narasingapuram, Pollachi-1, and Sulthanpet, whereas Ettimadai, Kattampatti, Madukkarai, Periya Negamam, Pollachi-2, Ponnaiyur, Ramanathapuram, and Sokkanur areas have shown a continuous decrease of the water table (CGWB data of 2000, 2011, and 2019) (Table 2) (Figures 7–9).
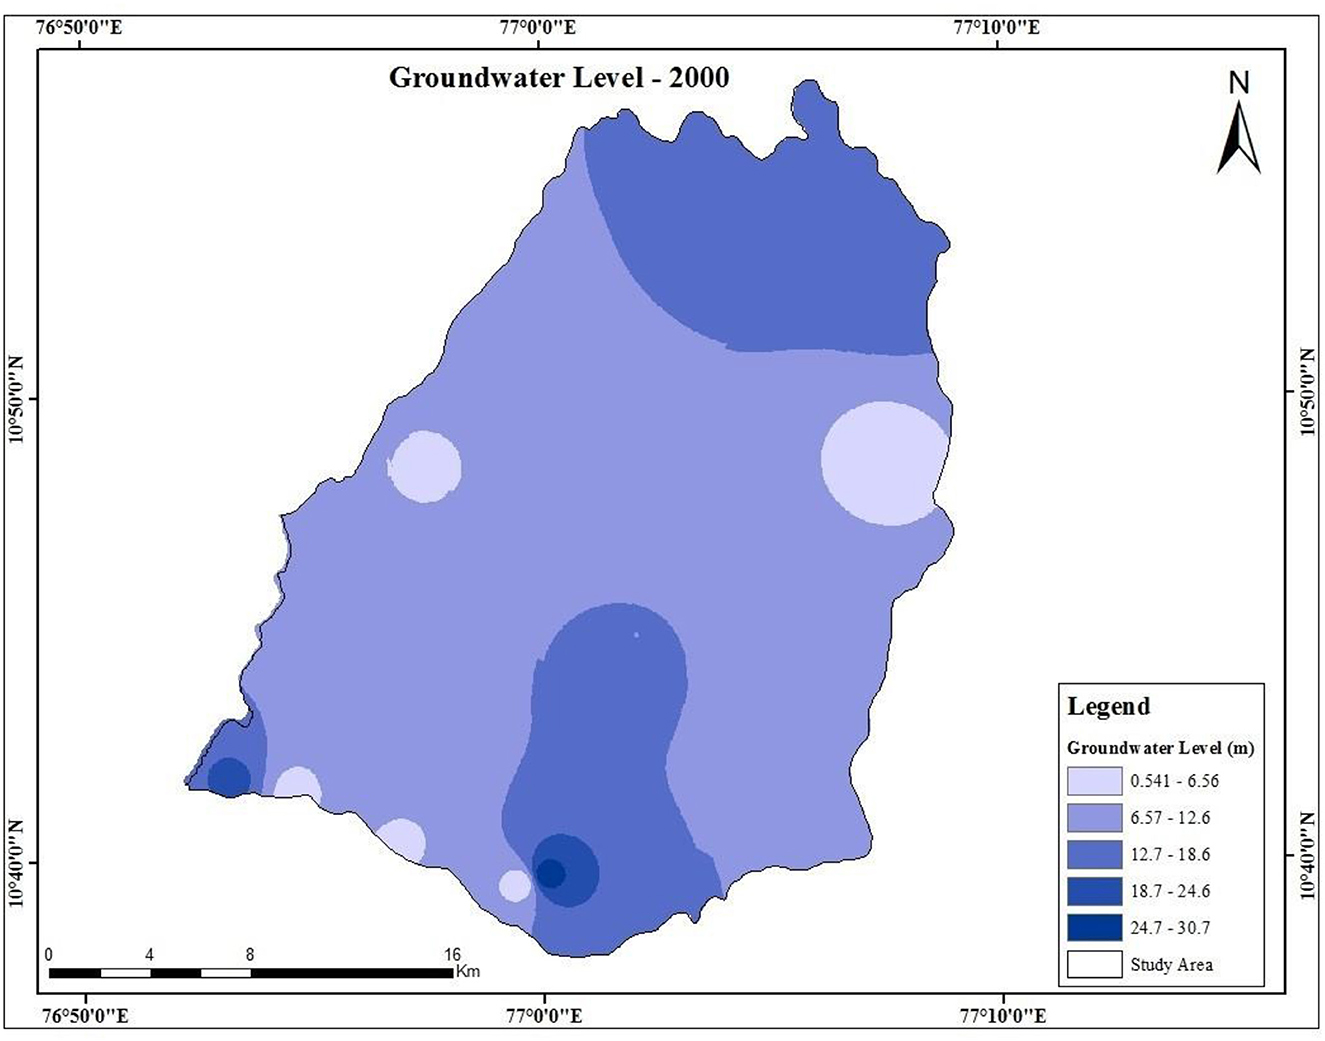
Figure 7. Spatial distribution of groundwater level (CGWB, https://indiawris.gov.in/wris/#/groundWater).
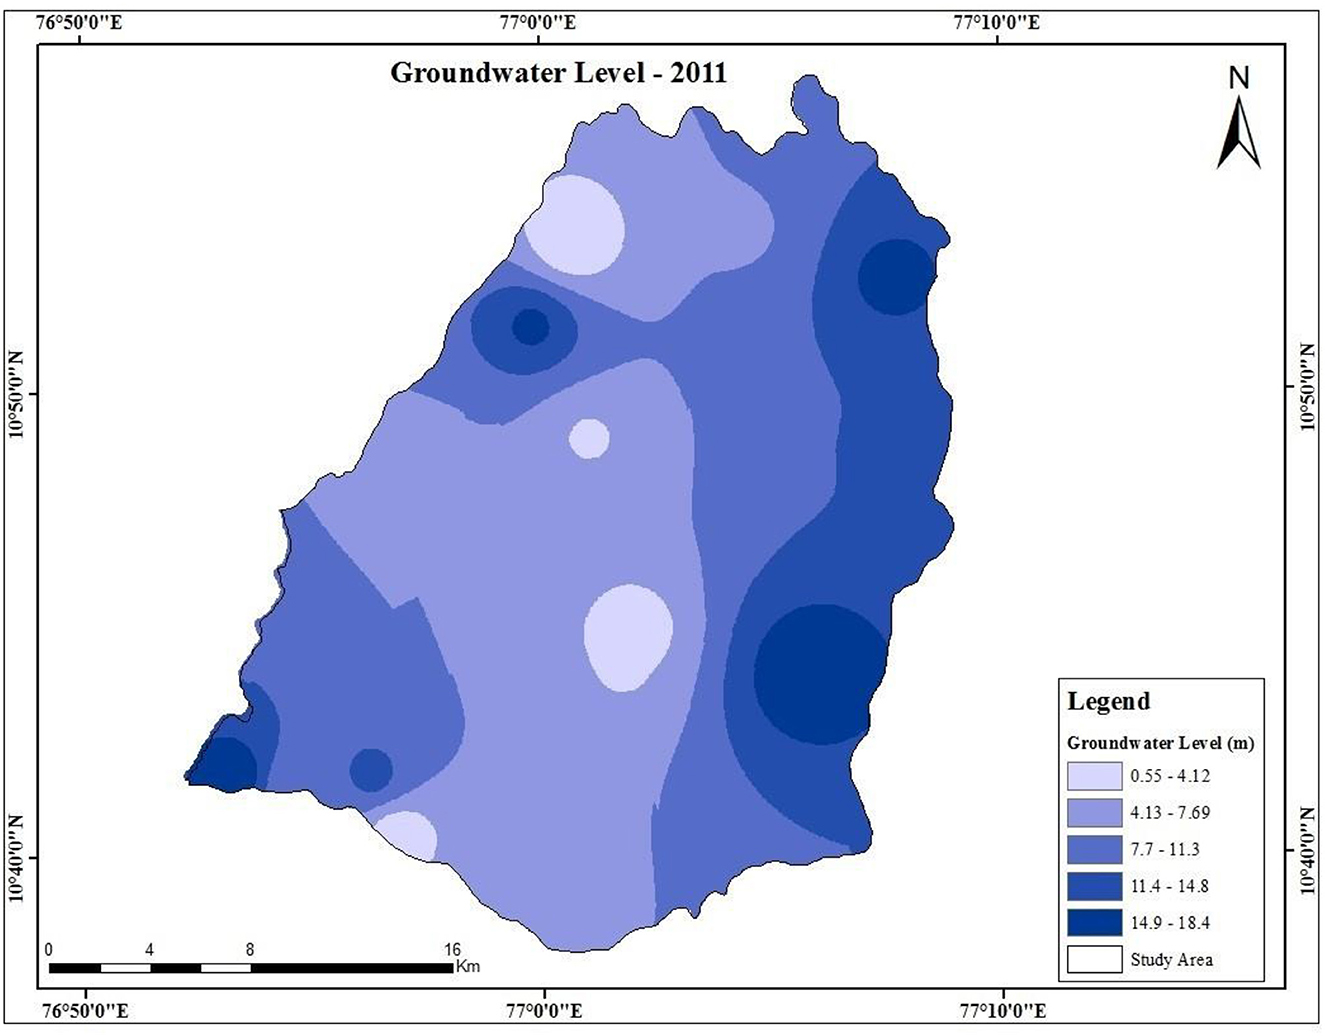
Figure 8. Spatial distribution of groundwater level (CGWB, https://indiawris.gov.in/wris/#/groundWater).

Figure 9. Spatial distribution of groundwater level (CGWB, https://indiawris.gov.in/wris/#/groundWater).
Conclusion
The LULC during the study period between the years 2000 and 2020 recorded some significant changes. The investigation uncovered significant alterations in the “cropland,” “plantation,” “fallow land,” and “settlement” categories. The features including “Dry cropland” “plantation,” “Industrial area,” “Query,” and “settlement” indicated an increasing trend, whereas the features such as “fallow land,” “Barren land,” “shrub land,” “River and reservoir,” and “wet crop” indicated a decreasing trend from 2000 to 2020. The reasons for this can be traced to changes in the agricultural activity pattern and population expansion in the settlement area. In general, the LULC data during the study period (2000–2020) indicated certain significant changes that affect the groundwater level fluctuation. The expansion of settlement, industrial areas, and query can be a reason for the declining groundwater levels by reducing the infiltration rate.
Nevertheless, it is imperative to regularly monitor these patterns to ensure the long-term sustainability of the environment. The plantation lands were identified as having the largest land area in comparison to other land use groups. Various areas within the research region exhibited a combination of urban and agricultural regions. Change detection analysis reveals the precise extent of land loss and land gain in many categories, including residential/commercial/industrial, mixed urban, cropland, plantation, and land with shrubs. Undoubtedly, the surface area of water bodies, such as rivers and lakes, experienced minimal decline between 2000 and 2011 but exhibited a substantial reduction in 2020. From 2000 to 2020, the dry cropland and plantation have seen increasing expansion. The use of fertilizers can change all characteristics of the soil, and it could affect the infiltration rate. The reduction of infiltration rate can affect the groundwater level of a particular area.
This study has succeeded in assembling and presenting facts about LULC change detection along with groundwater level fluctuation. As a result, the irrigation system must be improved from the neighboring river system. The study deciphers knowledge about the terrain characteristics, natural processes, and human environment of the area. The parameters considered in the present study include geology, geomorphology, and soil. The government prioritise their best in policy making for sustainable agriculture practices by incorporating harvesting techniques which can enhance the soil and land quality. The reason behind the mentioned changes could be attributed to government policies aimed at achieving a balance between boosting rural developments, eliminating mandatory grain crop quotas, and encouraging animal production with ecological stability. For a sustainable future, this study could add a statistical correlation between LULC and groundwater level. Furthermore, with the help of remote sensing and GIS, the future prediction of LULC change in the specific region can be made, and this could help to accomplish to find the regions with low groundwater levels, while the policymakers could make agendas for the regions that need more concentration and raise awareness in society regarding the groundwater problems.
Data availability statement
The original contributions presented in the study are included in the article/supplementary material, further inquiries can be directed to the corresponding author.
Author contributions
SN: Data curation, Methodology, Validation, Writing – review & editing. PM: Investigation, Supervision, Writing – review & editing. JK: Conceptualization, Methodology, Writing – original draft. JJ: Supervision, Visualization, Writing – review & editing.
Funding
The author(s) declare that no financial support was received for the research, authorship, and/or publication of this article.
Conflict of interest
The authors declare that the research was conducted in the absence of any commercial or financial relationships that could be construed as a potential conflict of interest.
Publisher's note
All claims expressed in this article are solely those of the authors and do not necessarily represent those of their affiliated organizations, or those of the publisher, the editors and the reviewers. Any product that may be evaluated in this article, or claim that may be made by its manufacturer, is not guaranteed or endorsed by the publisher.
References
Adhikari, S. P., Meng, S., Wu, Y.-J., Mao, Y.-P., Ye, R.-X., Wang, Q.-Z., et al. (2020). Epidemiology, causes, clinical manifestation and diagnosis, prevention and control of coronavirus disease (COVID-19) during the early outbreak period: a scoping review. Infect. Dis. Pover. 9:29. doi: 10.1186/s40249-020-00646-x
Anand, B., Rekha, R. S., Radhakrishnan, N., and Ramaswamy, K. (2023). Analysis of LULC change dynamics and its impact assessment using CA-ANN model in part of Coimbatore region, India. GeoJournal 88, 5825–5845. doi: 10.1007/s10708-023-10944-0
Baeza, S., Vélez-Martin, E., De Abelleyra, D., Banchero, S., Gallego, F., Schirmbeck, J., et al. (2022). Two decades of land cover mapping in the Río de la Plata grassland region: the MapBiomas Pampa initiative. Rem. Sensing Applic. 28:100834. doi: 10.1016/j.rsase.2022.100834
Beeram, S. N. R., Shahanas, P. V., Pramada, S. K., and Thendiyath, R. (2023). Impact of change in land use/land cover and climate variables on groundwater recharge in a tropical river basin. Environ. Dev. Sustain. 26, 14763–14786. doi: 10.1007/s10668-023-03216-x
Cai, Y., Zhang, F., Duan, P., Jim, C. Y., Chan, N. W., Shi, J., et al. (2022). Vegetation cover changes in China induced by ecological restoration-protection projects and land- use changes from 2000 to 2020. Catena 217:106530. doi: 10.1016/j.catena.2022.106530
CGWB (2008). District groundwater brochure, Coimbatore, Tamil Nadu. Available online at: https://indiawris.gov.in/wris/#/GWQuality
Chen, G., Liu, M., Tian, H., Ren, W., and Zhang Liu, J. (2008). Effects of land-use and land- cover change on evapotranspiration and water yield in China during 1900-2000. JAWR 44, 1193–1207. doi: 10.1111/j.1752-1688.2008.00243.x
Chen, T., Jiao, J., Wei, W., Li, J., Zhang, Z., Yang, H., et al. (2023). Spatiotemporal variation in the land use/cover of alluvial fans in Lhasa river basin, qinghai–tibet plateau. Agriculture 13:312. doi: 10.3390/agriculture13020312
Dash, S. S., Naik, B., and Kashyap, P. S. (2024). Assessment of land use/land cover change derived catchment hydrologic response: an integrated parsimonious hydrological modeling and alteration analysis based approach. J. Environ. Manage. 356:120637. doi: 10.1016/j.jenvman.2024.120637
de Mello, K., Taniwaki, R. H., de Paula, F. R., Valente, R. A., Randhir, T. O., Macedo, D. R., et al. (2020). Multiscale land use impacts on water quality: assessment, planning, and future perspectives in Brazil. J. Environ. Manage. 270, 110879. doi: 10.1016/j.jenvman.2020.110879
Ellis, E., and Pontius Jr, R. G. (2006). Land-use and land-cover change—encyclopedia of earth. Environ. Protect. 2, 142–153.
Elmahdy, S., Ali, T., and Mohamed, M. (2021). Regional mapping of groundwater potential in Ar Rub Al Khali, Arabian Peninsula using the classification and regression trees model. Remote Sens. 13:2300. doi: 10.3390/rs13122300
Elmahdy, S. I., and Mohamed, M. M. (2016). Land use/land cover change impact on groundwater quantity and quality: a case study of Ajman Emirate, the United Arab Emirates, using remote sensing and GIS. Arab. J. Geosci. 9, 1–13. doi: 10.1007/s12517-016-2725-y
Ettema, J., van den Broeke, M. R., van Meijgaard, E., van de Berg, W. J., Bamber, J. L., Box, J. E., et al. (2009). Higher surface mass balance of the Greenland ice sheet revealed by high- resolution climate modeling. Geophys. Res. Lett. 36:e3811. doi: 10.1029/2009GL038110
Garg, V., Nikam, B. R., Thakur, P. K., Aggarwal, S. P., Gupta, P. K., and Srivastav, S. K. (2019). Human-induced land use land cover change and its impact on hydrology. HydroResearch 1, 48–56. doi: 10.1016/j.hydres.2019.06.001
Ghimire, S., Yaseen, Z. M., Farooque, A. A., Deo, R. C., Zhang, J., and Tao, X. (2021). Streamflow prediction using an integrated methodology based on convolutional neural network and long short- term memory networks. Sci. Rep. 11:17497. doi: 10.1038/s41598-021-96751-4
Hao, J., Lin, Q., Wu, T., Chen, J., Li, W., Wu, X., et al. (2023). Spatial–temporal and driving factors of land use/cover change in mongolia from 1990 to 2021. Rem. Sensing 15:1813. doi: 10.3390/rs15071813
Hishe, H., Giday, K., Van Orshoven, J., Muys, B., Taheri, F., Azadi, H., et al. (2021). Analysis of land use land cover dynamics and driving factors in Desa'a forest in Northern Ethiopia. Land Use Policy 101:105039. doi: 10.1016/j.landusepol.2020.105039
Homar, C., Dewitz, J., Jin, S., Xian, G., Costello, C., Danielson, P., et al. (2020). Conterminous United States land cover change patterns 2001–2016 from the 2016 national land cover database. ISPRS J. Photogram. Rem. Sens. 162, 184–199. doi: 10.1016/j.isprsjprs.2020.02.019
Jaiswal, R. K., Saxena, R., and Mukherjee, S. (1999). Application of remote sensing technology for land use/land cover change analysis. J. Indian Soc. Rem. Sensing 27:123. doi: 10.1007/BF02990808
Kalpana, V. (2018). Analysis of rain fall and the temperature of Coimbatore District using land use and land cover change detection by image segmentation. Multimed. Tools Appl. 77, 30487–30504. doi: 10.1007/s11042-018-6125-z
Kidane, Y., Stahlmann, R., and Beierkuhnlein, C. (2012). Vegetation dynamics, and land use and land cover change in the Bale Mountains, Ethiopia. Environ. Monit. Assess. 184, 7473–7489. doi: 10.1007/s10661-011-2514-8
Kinattinkara, S., Arumugam, T., Kuppusamy, S., and Krishnan, M. (2022). Land use/land cover changes of Noyyal watershed in Coimbatore district, India, mapped using remote sensing techniques. Environ. Sci. Pollut. Res. 29, 86349–86361. doi: 10.1007/s11356-022-18707-z
Kirimi, F., Thiong'o, K., Gabiri, G., Diekkrüger, B., and Thonfeld, F. (2018). Assessing seasonal land cover dynamics in the tropical Kilombero floodplain of East Africa. J. Appl. Remote Sens. 12:026027. doi: 10.1117/1.JRS.12.026027
Kumaraswamy, K., and Nandha, R. (2015). Spatio-Temporal Analysis of Landuse/Land Cover Aspects Of Kolli Hills Environment, Tamil Nadu. Geogr. Anal. 4, 34–40.
Lillesand, T. M., and Kiefer, R. W. (2000). Remote Sensing and Image Interpretation. New York: Willey and Sons, 724.
Masilamani, P., and Aruchamy, S. (2017). Geoinformatics based land suitability classification for coconut cultivation in koraiyar watershed, Tamil Nadu. Goa Geographer 14, 47–56.
Mengistu, T. D., Chung, I. M., Kim, M. G., Chang, S. W., and Lee, J. E. (2022). Impacts and implications of land use land cover dynamics on groundwater recharge and surface runoff in East African Watershed. Water 14:2068. doi: 10.3390/w14132068
Meyer, W. B., and Turner, B. L. (1994). Changes in Land Use and Land Cover: A Global Perspective. Cambridge: Cambridge University Press.
Na, L., Zhao, Y., Feng, C. C., and Guo, L. (2023). Regional ecological risk assessment based on multi-scenario simulation of land use changes and ecosystem service values in Inner Mongolia, China. Ecol. Indic. 155:111013. doi: 10.1016/j.ecolind.2023.111013
Nayak, S., and Mandal, M. (2019). Impact of land use and land cover changes on temperature trends over India. Land Use Policy 89:104238. doi: 10.1016/j.landusepol.2019.104238
Palanisamy, A. (2014). “1992–2009, the land use/land cover change study using remote sensing and gis in Kolli Hill, South India,” in International Geoinformatics Research and Development Journal 4.
Patidar, N., and Behera, M. D. (2019). How significantly do land use and land cover (LULC) changes influence the water balance of a river basin? A study in Ganga river basin, India. Proc. Natl. Acad. Sci. India A 89, 353–365. doi: 10.1007/s40010-017-0426-x
Prabu, P., and Dar, M. A. (2018). Land-use/cover change in Coimbatore urban area (Tamil Nadu, India)—a remote sensing and GIS-based study. Environ. Monit. Assess. 190, 1–14. doi: 10.1007/s10661-018-6807-z
Priya, K. L., Jebastina, N., and Prince Arulraj, G. (2012). Assessment of water quality indices for groundwater in the Singanallur sub-basin, Coimbatore, India. Sci. Rep. 1:186.
Regasa, M. S., Nones, M., and Adeba, D. (2021). A review on land use and land cover change in Ethiopian basins. Land 10:585. doi: 10.3390/land10060585
Sensing, D. U. R. (2014). “Land use and land cover change detection using remote sensingand GIS in parts of Coimbatore and Tiruppur districts, Tamil Nadu, India,” in International Journal of Remote Sensing & Geoscience.
Siddik, M. S., Tulip, S. S., Rahman, A., Islam, M. N., Haghighi, A. T., and Mustafa, S. M. T. (2022). The impact of land use and land cover change on groundwater recharge in northwestern Bangladesh. J. Environ. Manage. 315:115130. doi: 10.1016/j.jenvman.2022.115130
Sundari, S. (2005). Migration as a livelihood strategy: a gender perspective. Econ. Polit. Wkly. 40, 2295–2303.
Vogelmann, J. E., Gallant, A. L., Shi, H., and Zhu, Z. (2016). Perspectives on monitoring gradual change across the continuity of Landsat sensors using time-series data. Remote Sens. Environ. 185, 258–270. doi: 10.1016/j.rse.2016.02.060
Keywords: land use, land cover, maximum likelihood classification, groundwater level, geographic information systems (GIS)
Citation: Naik SRS, Masilamani P, Kushawaha J and Jahangeer J (2024) Investigating the impact of land use land cover change on groundwater level dynamics in the Koraiyar watershed, Coimbatore District, Tamil Nadu, India. Front. Water 6:1339613. doi: 10.3389/frwa.2024.1339613
Received: 16 November 2023; Accepted: 27 May 2024;
Published: 21 November 2024.
Edited by:
Akhouri Pramod Krishna, Birla Institute of Technology, Mesra, IndiaReviewed by:
Channa Nilanga Rajanayaka, National Institute of Water and Atmospheric Research (NIWA), New ZealandAhmed Elbeltagi, Mansoura University, Egypt
Copyright © 2024 Naik, Masilamani, Kushawaha and Jahangeer. This is an open-access article distributed under the terms of the Creative Commons Attribution License (CC BY). The use, distribution or reproduction in other forums is permitted, provided the original author(s) and the copyright owner(s) are credited and that the original publication in this journal is cited, in accordance with accepted academic practice. No use, distribution or reproduction is permitted which does not comply with these terms.
*Correspondence: Jyoti Kushawaha, anlvdGkua3VzaEByYW1hbnVqYW4uZHUuYWMuaW4=
 S. R. Sreerama Naik1
 Jyoti Kushawaha
 Jahangeer Jahangeer