 Bisesh Joshi
 Eva Bacmeister
 Erin Peck2
 Marc Peipoch
 Jinjun Kan
 Shreeram Inamdar
- 1Water Science and Policy Graduate Program, University of Delaware, Newark, DE, United States
- 2Department of Plant & Soil Sciences, University of Delaware, Newark, DE, United States
- 3Stroud Water Research Center, Avondale, PA, United States
Nitrogen (N) pollution in riverine ecosystems has substantial environmental, economic, and policy consequences. Various riverine N removal processes include permanent dissimilatory sinks such as denitrification (Uden) and temporary assimilatory sink such as microbial N uptake (Uassim). Both processes have been extensively evaluated in benthic sediments but only sparsely in the water column, particularly for storm flows producing high suspended sediment (SS) concentrations. Stormflows also increase the sediment bound N (Sed-N) export, and in turn, the overall N exports from watersheds. The balance between N removal by Uden and Uassim vs. Sed-N export has not been studied and is a key knowledge gap. We assessed the magnitude of Uden and Uassim against stormflow Sed-N exports for multiple storm events of varying magnitude and across two drainage areas (750 ha and 15,330 ha) in a mixed landuse mid-Atlantic US watershed. We asked: How do the Uden and Uassim sinks compare with Sed-N exports and how do these N fluxes vary across the drainage areas for sampled storms on the rising and falling limbs of the discharge hydrograph? Mean Uden and Uassim as % of the Sed-N exports ranged between 0.1–40% and 0.6–22%, respectively. Storm event Uassim fluxes were generally slightly lower than the corresponding Uden fluxes. Similarly, comparable but slightly higher Uden fluxes were observed for the second order vs. the fourth order stream, while Uassim fluxes were slightly higher in the fourth-order stream. Both of these N sinks were higher on the falling vs. rising limbs of the hydrograph. This suggests that while the N sinks are not trivial, sediment bound N exports during large stormflows will likely overshadow any gains in N removal by SS associated denitrification. Understanding these N source-sink dynamics for storm events is critical for accurate watershed nutrient modeling and for better pollution mitigation strategies for downstream aquatic ecosystems. These results are especially important within the context of climate change as extreme hydrological events including storms are becoming more and more frequent.
Introduction
Excessive amounts of nitrogen (N) from agriculture, wastewater facilities, and chemical industries are discharged into rivers and streams resulting in N pollution in approximately 42% of US rivers and streams (Rashleigh et al., 2013; Xia et al., 2018). Excessive nitrogen in riverine ecosystems can cause many environmental problems, including eutrophication, enhanced nitrous oxide production, and hypoxia (Galloway et al., 2004; Fowler et al., 2013) with economic consequences related to purifying contaminated drinking water, treating health issues, and restoring impaired ecosystems (Xia et al., 2018; Katz, 2020). These effects of N pollution can also reach estuaries and coastal ecosystems and cause the collapse of fish and shellfish industries creating major economic and societal problems (Randall, 2004; USEPA, 2023). These challenges underscore the need for a better understanding of riverine nitrogen processes, particularly nitrogen sinks, and removal processes throughout river networks, that may help manage and mitigate nitrogen pollution in our waterways.
Denitrification is a key microbial process of N removal in riverine ecosystems that converts reactive nitrate N into inert nitrogen gas thus mitigating N pollution (Giles et al., 2012; Xia et al., 2018; Xin et al., 2019). While denitrification is a more permanent sink, N can also be temporarily retained via microbial assimilatory uptake in the water column (Reisinger et al., 2015, 2016; Wang et al., 2022). Mulholland et al. (2008) suggested that stream denitrification is more related to ecosystem respiration where nitrate in water is released as gaseous form of nitrogen in atmosphere. Similarly, total stream N uptake was related to ecosystem primary production as the process is primarily driven by photosynthesis and biotic uptake (Mulholland et al., 2008). Arango et al. (2008) reported assimilatory uptake rates higher than denitrification and nitrification rates in small streams with varying land use. Denitrification typically occurs under reducing conditions (low oxygen availability) and is affected by various factors including temperature, nitrate-N, and dissolved organic carbon (Canfield et al., 2010; Xia et al., 2018). In comparison, assimilatory uptake is affected by water temperature, algal biomass, and light availability (Rode et al., 2016).
Compared to denitrification, fewer studies have quantified the contribution of assimilatory uptake to N removal at the watershed scale. In river ecosystems, denitrification has typically been observed to be highest in reducing sediments within stream/river hyporheic and riparian zones (Lowrance et al., 1997; Merill and Tonjes, 2014; Xia et al., 2018). These interfaces are rich in organic carbon and other electron donors—energy sources required for the microbial denitrification processes (Revsbech et al., 2005; Xia et al., 2013; Kim et al., 2016). Previously, it was believed that rivers were less efficient than small streams in terms of N removal. This was because a much smaller percentage of the N originating in headwater streams reached coastal zones while the vast majority of N inputs to large rivers were delivered to the ocean (Alexander et al., 2007, 2008). However, rivers are equally efficient as small streams at removing N when considering that N entering small streams is not necessarily removed in them but throughout the entire river network (Seitzinger et al., 2002). This in turn suggests a rather constant removal per stream order (Hall et al., 2013), where stream order characterizes the size of the streams (Scheidegger, 1965). All of this work, however, is fundamentally based on the removal of N per area of a streambed during conditons in which water-column N demand is expected to be minimal due to low concentrations of suspended particles.
Recently, however, high-concentration plumes of suspended sediment in rivers have been identified as important reactive surfaces that may also enhance denitrification rates and thus nitrogen removal from the water column (Jia et al., 2016; Xia et al., 2017a,b, 2018; Wang et al., 2022). Denitrification rates were found to increase with an increase in the concentration of suspended sediment (Liu et al., 2013), sediment surface area and total organic content (Jia et al., 2016; Wang et al., 2022). High bacterial diversity, abundance, and metabolic rates occur with an increase in suspended sediment concentrations as microbes tend to attach to sediment's surface (Xia et al., 2013). Microbial processes such as ammonification (Xia et al., 2013) and nitrification (Xia et al., 2009) were also reported to be enhanced by increasing suspended sediment concentrations. Furthermore, Xia et al. (2017b) found that 1,000 mg/l of suspended sediment concentration enhanced riverine N loss via coupled nitrification-denitrification by 25–120% for Yangtze and Yellow Rivers. Wang et al. (2022) reported high denitrification rates in high order streams (third to eighth orders in China) and attributed this to an increase in suspended sediment surface area as well as larger water columns (due to deeper water depths). Wang et al. (2022) also observed that water column denitrification rates were positively correlated with dissolved inorganic N, temperature, suspended sediment concentrations, and total organic carbon. In comparison, Reisinger et al. (2015) noted that water column nutrient uptake rates (i.e., nitrate, ammonium, and soluble reactive phosphorous in first through fifth order streams) may not be significantly affected by stream size. Later, Reisinger et al. (2016) also found that N loss via denitrification can be similar or higher in rivers compared to smaller headwater streams.
Sediment-bound (particulate) N loads can be high, especially during large storms, and can exceed the dissolved loads by orders of magnitude (Meybeck, 1982; Dhillon and Inamdar, 2013, 2014). While nutrient mobilization and export by suspended sediments during stormflows are well recognized (Royer et al., 2006; Edwards and Withers, 2008; Inamdar et al., 2015; Jiang et al., 2020), the influence of high sediment loads on N removal is poorly understood. How the increased exports of N compare with the increased potential for denitrification or assimilatory N uptake in storm sediment plumes remains unknown. How assimilatory N uptake and denitrification fluxes vary across different stream orders and how the size and seasonal timing of storm events affect these fluxes is also unknown. In addition, hydrologic pathways and sediment and nutrient sources, concentrations, and composition can vary on the rising and falling limbs of the storm hydrograph (Buttle, 1994; McGlynn and McDonnell, 2003; Inamdar et al., 2013; Klaus and Mcdonnell, 2013; Johnson et al., 2018) and can alter the rates of denitrification and assimilatory N uptake and need to be investigated. Studies have also shown that microbial communities that affect N processing could also differ across and within storms (rising and falling limbs; Kan, 2018).
Here we examine some of these key questions at the watershed scale by estimating assimilatory N uptake and denitrification fluxes for individual storms at two watershed drainage locations. Specifically, we ask: What is the proportion of assimilatory N uptake (hereafter referred to as Uassim) and denitrification (Uden) loss to suspended-sediment bound nitrogen load (Sed-N) and how do they vary across drainage areas, storm sizes, and the rising and falling limbs of the storm hydrograph? We hypothesize that while Uassim and Uden amounts will increase with storm size, the mass exports of Sed-N will be higher and will outpace the Uassim and Uden amounts. Addressing these questions is important for developing more accurate and reliable mass estimates of N removal at the drainage network or watershed scales and including these processes in watershed models for N transport and fate.
Methodology
Study area and site description
This study was conducted at two drainage locations on the White Clay Creek, Pennsylvania USA (Figure 1). The upstream site was adjacent to the USGS gage station near London Grove (U.S. Geological Survey #01478100; Coordinates: 39.858 N, 75.783 W). Similarly, the downstream location is next to the USGS gage station #01478245 at Strikersville (Coordinates: 39.747 N, 75.770 W). At the upstream site, White Clay Creek is a second order stream with a drainage area of 750 ha of which 22% is cultivated crops, 43% pasture, 17% forested lands, and 7% is open space developed area (StreamStats/US Geological Survey, 2023). At the downstream location, the creek drains a fourth order watershed with a drainage area of 15,330 ha consisting of 15% cultivated crops, 26% pasture, 24% forested lands, and 30% developed area (StreamStats/US Geological Survey, 2023). Both drainage areas are located within the Piedmont region and have soil types of Glenilg channery silt loam, Worsham silt loam, Wehadkee silt loam, Guthrie silt loam, with Kaolinite clay (Sweeney, 1993), and are underlain mostly by weathered crystalline rocks, shales, schist, gneiss marbles (Pennsylvania Geological Survey, 2017). The potential anthropogenic sources of nitrogen in the watersheds include synthetic fertilizers and manures from agricultural fields and urban areas. The average values for daily discharge are 0.156 (min: 0.066, max: 0.245) m3/s for upstream site and 3.228 (min: 0.651, max: 21.209) m3/s for downstream site (USGS Water Data for the Nation, 2023a,b). The average suspended sediment concentration obtained from our sampling combined with USGS sampled data are 256.4 (min:1.5, max: 1,220) mg/l for the upstream and 1,499.8 (min: 1.6, max: 14,476.8) mg/l the downstream sites.
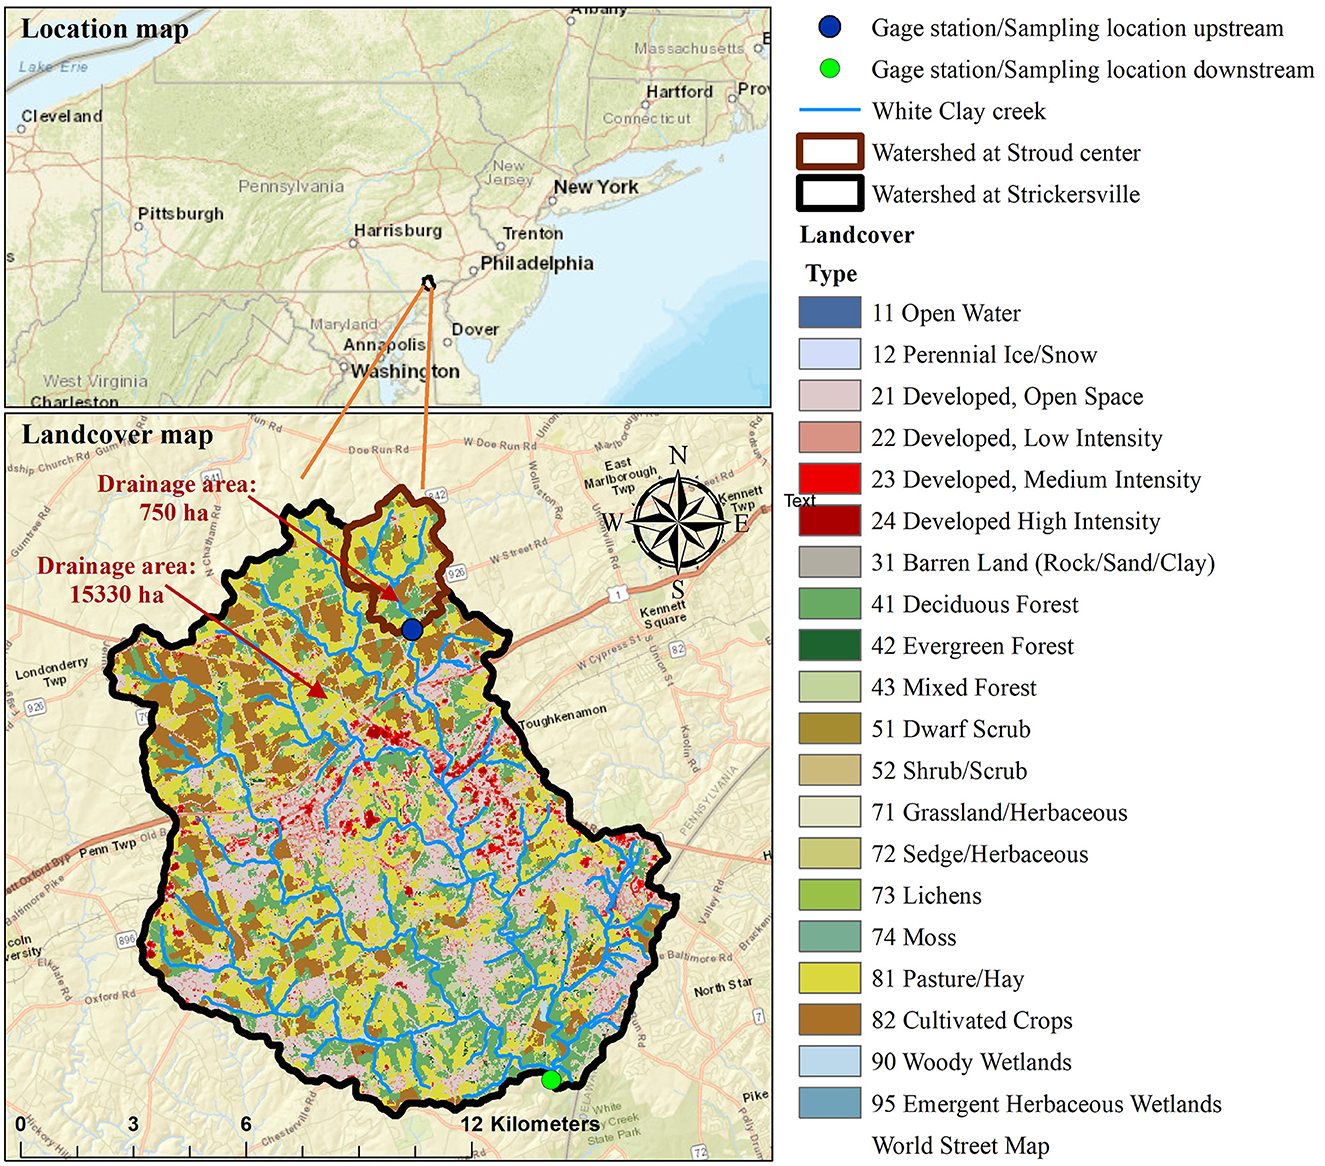
Figure 1. Location of the White Clay Creek watershed in the mid-Atlantic USA, and the drainage area and landcover map for the two sampled sites within the White Clay Creek watershed. The drainage area for the upstream site is 750 ha (second order stream) while the drainage area for the downstream site is 15,330 ha (fourth order stream).
Data collection and analysis
We collected data on stream water chemistry and N process rates (Uassim and Uden) from selected storms at two drainage locations between September 2020 and December 2021. A total of 33 stream water samples were analyzed for water chemistry and N process rates across the two study sites (20 samples for one April and four September-October events at the downstream site, and 13 samples were used for three September-October events at the upstream site). We used a combination of passive sampling and grab sampling methods to collect stream water on the rising and falling limb of storm events. We built passive samplers following Diehl's design for a modified siphon sampler tower (Diehl, 2008) to collect water on the rising limb. Each sampler tower was built to contain three vertically stacked 1-L HDPE sample bottles inside half of a PVC pipe. Flexible vinyl intake and air tubing were installed through the bottle caps to create a siphon allowing water and SS to flow into the sample bottles once the water level reached the intake tube. We installed metal T-posts to hold the passive samplers near the streambank at each site, which remained at the same location for the duration of the study period. Before storm events, we deployed three passive sampler towers equaling nine total sample bottles at each site with intake tubing facing the stream channel at the same height so that three replicate samples would be collected at a given stage height. At the time of passive sampler deployment at each site, stage height and the distance from the water level to each intake tube were also recorded. This made it possible to calculate the stage height when each sample bottle was filled and determine the sample collection time and discharge values using USGS gage data from each site. On the falling limb of the storm, we removed the passive samplers from the T-posts and collected three replicate grab samples from the water column at each site using a 1-L HDPE bottle attached to a swing sampler (e.g., Nasco 3.65 m Swing Sampler). All samples were then transported to lab facilities in a chilled cooler.
To process samples for collecting water chemistry data, we pooled replicate samples at each stage height from the rising limb and falling limb. We collected subsamples for dissolved organic carbon (DOC) and nitrate-N (NO3-N) and vacuum-filtered the subsamples through 0.45-μm and 0.7-μm borosilicate fiber filters, respectively. Subsamples for DOC were then analyzed using an Aurora 1,030 W TOC Analyzer (Oceanographic Int., College Station, Texas, United States) and chemical oxidation (Menzel and Vaccaro, 1964). Analysis of -N was performed via discrete colorimetric analysis using an AQ300 discrete analyzer (SEAL Analytical, Wisconsin, United States) following standard procedures (APHA, 2017). We collected an additional subsample of each pooled sample and vacuum-filtered this through a pre-weighed 0.7-μm borosilicate fiber filter, repeating this step to generate two filters per pooled sample. One set of filter samples we oven-dried at 60°C for 72 hours, weighed on a Sartorius (Goettingen, Germany) MC1 analytical balance, combusted at 500°C for 5 to 6 h (Steinman et al., 2006), and reweighed for calculation of dry mass and ash-free dry mass (e.g., OM). We repeated only the first two drying and weighing steps for the second set of filters and then collected a one-cm subsample from each filter which we weighed and packaged in an aluminum tin capsule. For these subsamples, organic C and N content on SS (as a percentage of dry mass) was determined via combustion using an Elemental Analyzer (University of Maryland, Center for Environmental Science).
We measured ambient denitrification and assimilatory uptake rates for stream water using microcosm experiments. We took three 250-ml aliquots from each pooled sample, generating three replicates per stage height. We poured each aliquot into a microcosm chamber (Kimble 250 ml wide-mouth media bottle) and then enriched all chambers with 1 ml of a 796 mg/l solution of Na15NO3. We placed a magnetic stir bar in each chamber, and closed chambers with a screw cap in which septa had been installed. We placed all chambers on a magnetic stir plate and then evacuated (3 min) and flushed with He gas (one min) by inserting tubing with syringe needles attached into the septa of each microcosm chamber (Dodds et al., 2017). The evacuating and flushing cycle was repeated three times before incubation began. We then moved all microcosms to magnetic stir plates inside an incubator set to 25°C. We set stir plates to 360 rpm to ensure particles remained in suspension during the incubation period (Jia et al., 2016). Then, we incubated the microcosms for a period of 24 h in the dark. We collected gas samples at 4 and 24 h after the start of incubation using a gas-tight syringe (Hamilton 25 ml Model 1025TLL) to sample 12 ml of gas from each chamber into 12 ml pre-evacuated Exetainers (Labco Ltd., High Wycombe, United Kingdom). Each gas sample was analyzed for δ15N of N2 and N2O via continuous flow isotope ratio mass spectrometry (IRMS, ThermoScientific Delta V Plus) at the University of California-Davis Stable Isotope Facility. Denitrification rates on SS were measured from a production rate of 29N2 and 30N2 following Nielsen (1992). Similarly, assimilatory uptake rates were determined by measuring the increase in the 15N to 14N ratio of suspended organic matter at the end of incubation and the tracer 15N: 14N ratio in the microcosm NO3- following Mulholland et al. (2000). Further details of these denitrification and assimilatory uptake calculations are described in Bacmeister et al. (2022).
We obtained additional information on manual and high frequency (15-min) discharge (Q), Turbidity (Td), and SS concentrations from the USGS stations at the selected drainage locations for the study time period of September 2020 to December 2021 (USGS Water Data for the Nation, 2023a,b). We used this information to develop regression models and compute event mass fluxes for water, SS, and N described below. Additionally, we obtained seven-day average antecedent temperatures of water prior to sampled events at both upstream and downstream sites from the USGS (USGS Water Data for the Nation, 2023a,b) at respective USGS gage stations, and the closest precipitation and 7-day antecedent rainfall data was obtained from “Ag farm weather station” at Newark (National Weather Service, 2023a).
Regression models for estimation of storm-event suspended sediment
We combined our manually sampled SS data with USGS discharge, turbidity, and SS concentrations to increase sample size and develop stronger regression models. The combined data set included 106 data points for the downstream site (67 on falling limb, 39 on rising limb) and 31 data for the upstream site (25 on falling limb, six on rising limb). We separated rising and falling limbs by the discharge peak, and the end of a storm was identified as the time point when recession discharge was within 10% of the starting storm event discharge (Inamdar et al., 2015). The start of the storm was identified as the point where streamflow discharge exceeded by 10% following the start of rainfall (Inamdar et al., 2015). Separate regression models were developed using a Python programming language for each site and for rising and falling limbs. Rising limb and falling limb datasets were standardized using the natural logarithmic function for developing and testing different statistical models to predict SS concentrations with better r-squared values (R2). We applied simple regression models that are preferable for a relatively small dataset (Trevor et al., 2008; Montgomery et al., 2012). Equations (1)–(4) represent the regression models developed for rising and falling limbs of upstream and downstream sites respectively.
Where SS is suspended sediment concentration (mg/l), Q is discharge (cfs), and Td is turbidity (FNU). Subscripts rv, fv, rd, and fd represent rising limbs and falling limbs for the downstream and upstream sites, respectively.
Events selection and their hydrologic parameter assessment
Three summer/fall storms (Sep-Oct) were available for the upstream site and five storms were sampled at the downstream site across a broader season (Apr-Oct, Table 1). Hydro-meteorological parameters were determined to characterize the events (Table 1). Seven-day average antecedent temperature was determined by determining the average of the daily mean water temperature at the USGS gage stations, and 7-day cumulative antecedent precipitation and event day precipitation were obtained by summing the precipitation data for these time periods. Similarly, we computed the percentage exceedance of peak discharge of storm events based on 2 years of the daily maximum flows (Acharya and Joshi, 2020) at the study sites from 2021 through 2022. Storm discharge for each site was normalized to the drainage area to allow for comparative analysis between the two study sites.
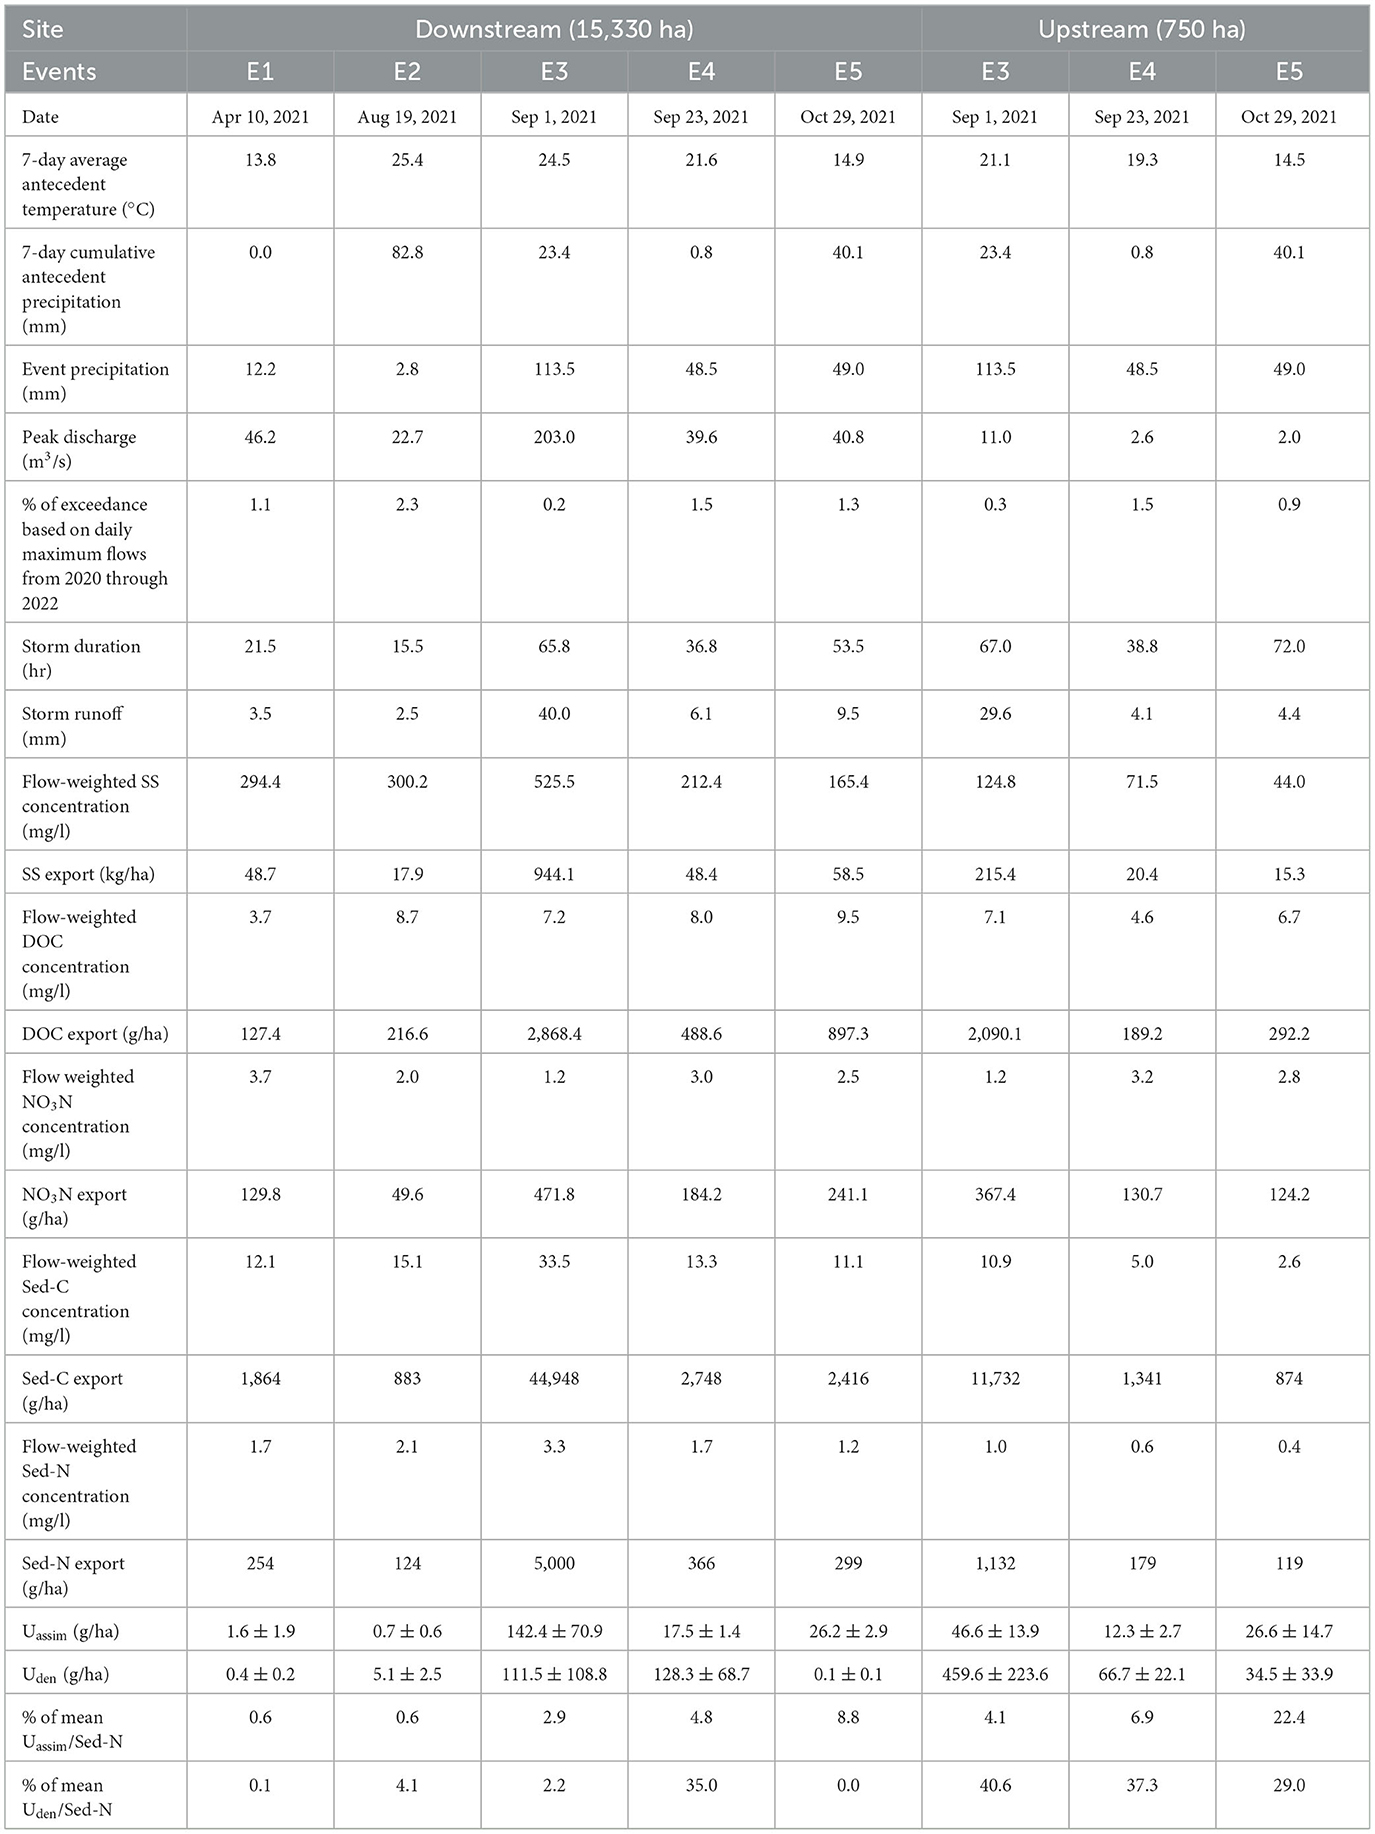
Table 1. Hydrologic, sediment, nutrient parameters, and N process rates for sampled storm events at the downstream and upstream study sites on White Clay Creek.
Flux computation and analysis of Uassim and Uden
Fluxes for SS were computed by multiplying the flow-weighted average modeled concentration for SS on the rising and falling limbs with the discharge amounts for these periods. The total event SS flux was the sum of the SS fluxes for the rising and falling limbs. We scaled up the Uassim and Uden rates measured in the microcosm experiments to the watershed-level (g/ha) by multiplying microcosm-level rates (g N/kg of sediment/hr) by the duration (hr) and SS flux (kg/ha) of each period (rising and falling limbs) and storm event. Similarly, fluxes for sediment-bound N and C (Sed-N, and Sed-C) were computed in g/ha by multiplying the weighted average %N and %C with the corresponding sediment loads. Other fluxes such as NO3-N and DOC were calculated based on their weighted average concentration (obtained from grab and passive sampling) and volume of stormflow on rising and falling limbs. The N uptake computed from both study sites were then compared and analyzed against each other, and other similar studies.
Results
Selected storms and their hydrologic variables across the two drainage sites
Three storm events, E3 (Sep 1), E4 (Sep 23), and E5 (Oct 29) (Table 1), were sampled at both upstream and downstream sites including E3 which is associated with tropical storm Ida (National Weather Service, 2023b). Among the three storms analyzed for the upstream site, storm E4 contributed the smallest runoff (4.1 mm) with a peak discharge of 2.6 m3/s while tropical storm Ida produced a storm runoff of 29.6 mm with a peak discharge of 11 m3/s. The exceedance levels for peak discharges for these events ranged between 1.48–0.28%. For the downstream site, storm runoff, and peak discharge were lowest for E2 (2.5 mm and 22.7 m3/s) and highest for Ida (E3: 40 mm and 203 m3/s). For both sites, antecedent 7-days average stream water temperatures for the Sep-Oct events ranged from 14.5 to 25.4 C and antecedent 7-days accumulated precipitation ranged from 0.80 to 40.1 mm. The spring/April event (E1) had the lowest water temperature (13.8°C) and no antecedent precipitation. Storm flows lasted from 38.8 h (E4) to 72.0 h (E5) at the upstream site, and from 15.5 h (E2) to 65.8 h (E3) for the downstream site. Not surprisingly, tropical storm Ida yielded the largest sediment export (944.1 kg/ha for the downstream site and 215.4 kg/ha for the upstream site) compared to other events (Table 1). This difference is also indicated by the average SS concentrations during storm events—for Ida, they were 525 mg/l and 124.8 mg/l for downstream and upstream sites, respectively, while for other events they ranged from 165.4 to 300.2 mg/l (downstream) and from 44.0 to 71.5 mg/l (upstream).
Biogeochemical fluxes across both sites
Carbon exports (DOC and Sed-C) were greater than corresponding nitrogen exports (NO3-N and Sed-N) for all Sep-Oct storms, however, NO3-N was slightly higher than DOC for E1. Nutrient fluxes increased with storm size and stream order with tropical storm Ida (E3) yielding the highest fluxes (Table 1). Flow-weighted stream water DOC concentrations were highest for the August-Oct storms, but NO3-N concentrations were highest for the April (spring) event at the downstream site.
Comparison of Uden, Uassim, and Sed-N with storm events
Fluxes of Uassim, and Sed-N increased with size of storm events for both the upstream and downstream sites (Figure 2, Table 1). The increase in these fluxes, were however, not directly proportional to the magnitude of the events. Flux values for Uden were more variable than Uassim with respect to storm event magnitude, especially for the downstream site (Figure 2). Importantly, storm event Sed-N exports were 1–2 orders of magnitude greater than the corresponding Uden and Uassim fluxes (Table 1). As a % of the Sed-N exports, Uassim fluxes were consistently less than Uden for the upstream site and ranged from 4.1–22.4%. A mixed response was observed for the downstream sites with Uassim fluxes ranging between 0.6–8.8%. Uden varied between 0.1–40.6% for the study sites (Table 1). The April event (E1) measured at the downstream site yielded the lowest process fluxes.
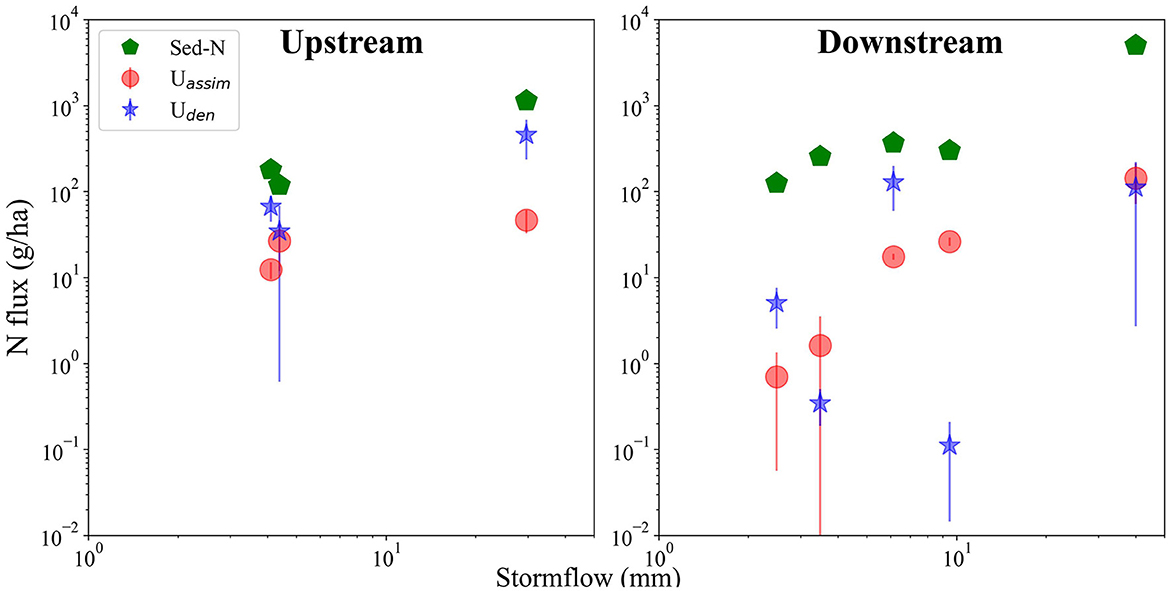
Figure 2. Comparison of Sed-N, Uden, and Uassim fluxes for the upstream and downstream sites with stormflow amounts (mm). Vertical bars indicate standard errors associated with the fluxes.
Comparison of Uden, Uassim, and Sed-N with drainage area
Storm event Sed-N exports at the downstream site were 2–4 times the values measured at the upstream location (Figure 3). In comparison, the responses for N process fluxes (Uden and Uassim) were mixed (Table 1, Figure 3). Assimilatory N (Uassim) fluxes were greater at the downstream vs. the upstream site for events E3 (three times greater) and E4 (1.4 times greater), but similar for E5. In contrast, Uden flux was greater at the upstream site for two (E3 and E5) of the three common events. Tropical storm Ida in particular, produced a denitrification flux that was four times greater at the upstream vs. the downstream site (Table 1, Figure 3). Uden flux for the downstream site for E5 was unexpectedly very low (close to zero; Table 1), with low Uden rates in the rising limb and non-detectable denitrification during the falling limb of the storm.
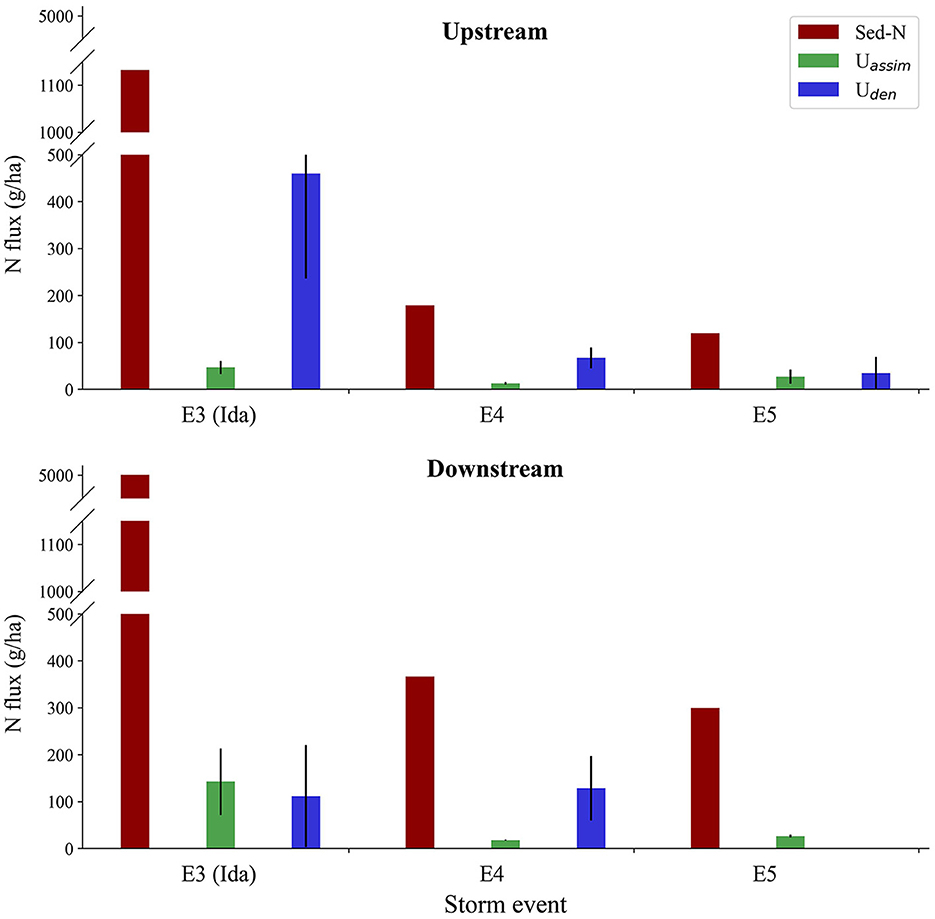
Figure 3. Comparison of Sed-N, Uassim, and Uden fluxes with drainage location (upstream vs. downstream) for the three common events (E3-E5). Vertical bars indicate standard errors attached to corresponding fluxes.
Differences in Uden, Uassim, and Sed-N between the rising and falling limbs of the storm hydrographs
N process fluxes were consistently higher on the hydrograph falling limbs vs. the rising limbs regardless of storm size and drainage location (Figure 4). While Sed-N exports were also higher on falling limbs except for the tropical storm Ida at the upstream site, the differences between rising and falling for Uden and Uassim are much greater than for Sed-N. At the downstream site, Uden, and Uassim fluxes before peak flow were on average 71.4–99.8% and 98.6–99.8% smaller than those observed during the falling limb, respectively (Figure 4, Upstream). Similarly, rising limb values for Uden and Uassim fluxes at the upstream site were on average 95.3–99.8% and 96.9–99.9% smaller than mean fluxes in the falling limb (Figure 4, Downstream).
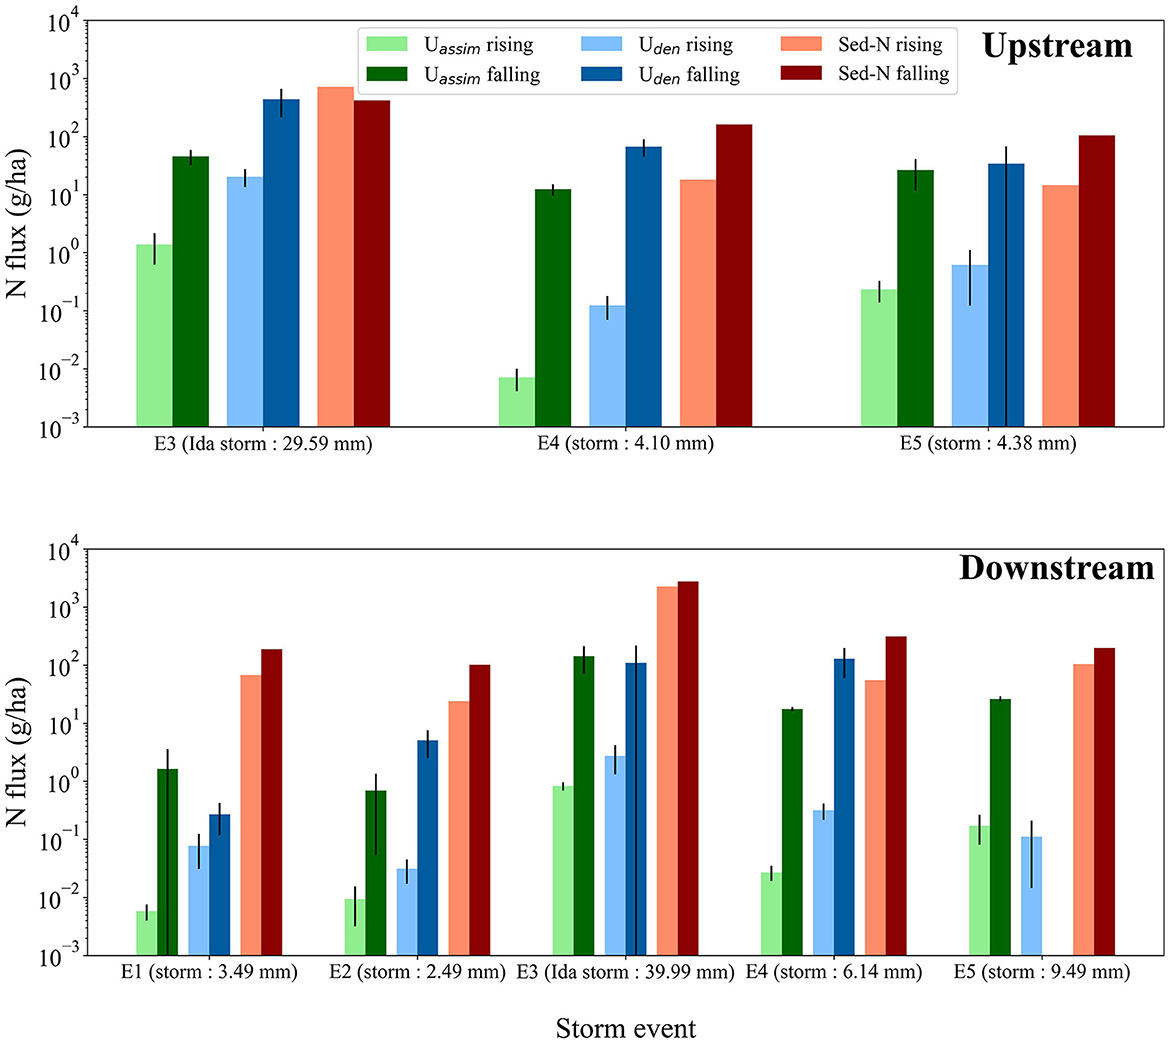
Figure 4. Uden, Uassim, and Sed-N fluxes for the rising and falling limbs of the storm hydrographs at the upstream site and at the downstream site. The black bars indicate errors in fluxes of Uden and Uassim.
Discussion
This study provided the first important comparisons of storm-event fluxes of Sed-N and Uassim and Uden, with Sed-N fluxes substantially exceeding the Uassim and Uden values. Assimilatory N uptake and denitrification fluxes were also found to vary differentially with drainage area, storm magnitude, and rising and falling hydrograph limbs. We elaborate on these results further in the discussion below. We also discuss the implications of these results for watershed N modeling, budgets, and watershed management.
Variation of water column N uptake with drainage areas
We found that while the storm-event Sed-N exports were consistently greater at the downstream site, the same was not true for Uden and Uassim fluxes. Uassim fluxes were higher for downstream site for two events and similar for the third one. However, Uden (for two of the three events) were greater for the upstream drainage location. Previous studies have typically reported the rates, rather than watershed-scale fluxes [in M L2] for denitrification (Christensen and Sørensen, 1988; Royer et al., 2004; Arango et al., 2008; Reisinger et al., 2015; Xia et al., 2017b; Wang et al., 2022). To allow for comparative analysis and evaluation with previous studies, we computed areal rates of Uden for our sites (Table 2). This was done by multiplying our volumetric rates with the average high flow depth estimated empirically from measured depths from USGS gage stations at those sites (we estimated high flow depth for the upstream site to be ~1.3 m and ~1.15 m for the downstream site). Our Uassim rates (0 to 5.82 mg m−3 hr−1 for the downstream site, and 0 to 2.32 mg m−3 hr−1 for the upstream site) were within the range of rates (0.001–363 mg m−3 hr−1) reported by Reisinger et al. (2015) across first to fifth order watersheds with contrasting landscapes in mid-West US.
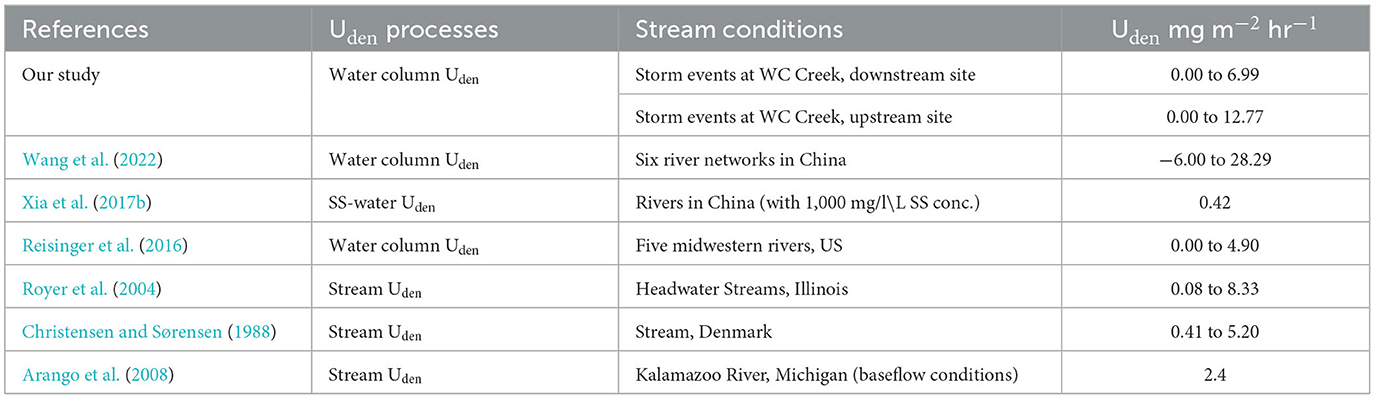
Table 2. Comparison of denitrification rates from this study against those reported previously in the literature.
Our water column Uden rates for both sites (0.00 to 6.08 mg m−3 hr−1 for the downstream site and 0.00 to 9.82 mg m−3 hr−1 for the upstream site) were within the broad range (−3.20 to 22.80 mg m−3 hr−1) of those reported by Wang et al. (2022) for third to eighth order rivers in China. Wang et al. (2022) found that denitrification fluxes increased with stream order or drainage area and attributed it to increase in suspended sediment, total organic carbon, and water column depth. Reduced dissolved oxygen and increased microbial communities associated with the suspended sediments have also been identified as key factors in enhancing water column denitrification removal (Jia et al., 2016; Xia et al., 2018; Wang et al., 2022). In another study in China on the Yellow River, Xia et al. (2021) found that N2 and N2O fluxes from the river were highest in the middle reaches but lower in the upper and lower reaches (specific stream orders corresponding to “upper” and “lower” reaches were not provided). Xia et al. (2021) attributed the elevated N2 and N2O fluxes in the middle reach to the increased suspended sediment concentrations in this reach. Reisinger et al. (2016) also reported variable denitrification rates (range: 0.00 to 4.90 mg m−3 hr−1) among five mid-Western rivers in the US.
Our denitrification rates were closer to the rates obtained by Reisinger et al. (2016) and did not increase with an increase in stream order (the upstream site had higher Uden rates compared to the downstream site). This was surprising given that suspended sediment and DOC concentrations were greater at the downstream vs. the upstream site while dissolved NO3-N concentrations were comparable (Table 1). We speculate that greater fraction of agricultural land use providing more labile organic carbon and nitrogen in the upper watershed coupled with finer sediments could have played a potential role in the elevated denitrification rates/fluxes measured for the upstream site. Grain size distribution, was however, not available in our study. We also recognize here that these drainage scale comparisons were based on limited data from only three storm events (all in Sep-Oct time frame; Figure 3) and additional events across multiple years and multiple drainage locations are needed to make a robust assessment for the influence of drainage size on denitrification fluxes. Contrary to Uden, Uassim fluxes were however higher at the downstream site (Figure 3) and might be due to factors such as increased light, temperature, and algal biomass in the wider, downstream reaches (Rode et al., 2016). Indeed, mean stream water temperature was consistently higher at the downstream vs. the upstream site (Table 1).
Variation of sediment N and water column N uptake with storm events
Sed-N and assimilatory uptake fluxes displayed a pronounced increase with storm event magnitude (Figure 2), although the increase in Sed-N was greater than Uassim. The sharp increases in sediment bound N were not surprising given that the mobilization of suspended sediments and associated particulate N in storms is well recognized (Royer et al., 2006; Edwards and Withers, 2008; Inamdar et al., 2015; Jiang et al., 2020). The elevated values of Uassim and Uden during storms suggest that these fluxes are not trivial and need to be accounted for in reach and watershed scale N budgets and assessments. What was surprising though was that while Uden increased with storm magnitude at the upstream site, the same pattern was not repeated for the downstream site (Figure 2). Previous studies have typically observed Uden to increase with runoff amounts/depths and suspended sediment concentrations that provide valuable sediment surface area for microbial habitat and reactions that may facilitate denitrification and assimilatory processes (Xia et al., 2017b; Wang et al., 2022). Increased suspended sediment concentrations have also been found to enhance anoxic microsites that may support increasing denitrification loss (Beaulieu et al., 2009; Yu et al., 2013; Xia et al., 2021). Thus, the variable storm response at the downstream site suggests that additional unknown factors could influence the Uden process in the water column.
Temperature is also an important control that could influence the microbial growth processes responsible for water column assimilatory and denitrification fluxes (Xia et al., 2021; Wang et al., 2022). Elevated temperatures could also decrease the amount of dissolved oxygen in the water column making the environment more suitable for low oxygen nitrate reduction processes. Xia et al. (2021) reported higher N2 and N2O fluxes for summer vs. spring for the river network. While we did not specifically focus on seasonality and temperature differences across storms, our observations for the downstream site (Table 1) indicated that the Uden fluxes for the April/spring (E1) event were lower than those measured for most of the summer storms (except E5). Our sample size is however very small and additional storms across seasons need to be measured for a more thorough assessment.
This study provided important new insights on within-event patterns of (rising vs. falling hydrograph limb) Uden and Uassim fluxes which have not been reported before. Both N fluxes were greater on the falling limb of the discharge hydrograph as opposed to the rising limb (Figure 4). Duration and runoff volumes were both greater during the falling limbs of the storm hydrographs (Table 1) and likely contributed to the larger fluxes for this period. Previous studies have shown that hydrologic flow paths, sediment sources and characteristics, and nutrient concentrations could differ on the rising vs. falling limbs of the hydrograph (Buttle, 1994; McGlynn and McDonnell, 2003; Inamdar et al., 2013; Klaus and Mcdonnell, 2013; Johnson et al., 2018). Rainfall input and high erosive energy of runoff on the rising limb typically sustain greater grain size for suspended sediments vs. the falling limb (Walling et al., 2000). The flow turbulence on the rising limb could also facilitate well-mixed and more oxygenated conditions in the water column vs. the less turbulent flow on the recession limb of the hydrograph (Tabarestani and Zarrati, 2015). DOC, which is important energy source for heterotrophic denitrification, has also been typically reported to peak following the discharge peak (Inamdar et al., 2011; Dhillon and Inamdar, 2014). In a previous study in our upstream watershed in White Clay Creek (Kan, 2018), microbial communities involved in N processes were observed to vary across the storm hydrograph. Kan (2018) reported different microbial compositions as well as greater abundances of nitrification and denitrification genes on the recession limb vs. the rising limb of the discharge hydrograph. Terrestrial microbes flushing into a stream during storm flow might need time to adapt and thrive, showing up on the falling limb. We hypothesize that all or some of these factors likely contributed to the higher amounts of N fluxes that we observed on the falling limb of the discharge hydrograph. Future studies are needed to explicitly determine the influences of these factors on the N fluxes.
Implications for N flux modeling and assessment and watershed management
Our results show that while the sediment bound N exports were much greater than Uassim and Uden during the large storms, the amounts of Uassim and Uden were not trivial and watershed N budgets and models would benefit from incorporating water column removal processes. Currently, most watershed-scale models for nutrient budgeting and management, including the more popular ones like the Soil Water Assessment Tool (SWAT; Arnold et al., 2012), and Storm Water Management Model (SWMM; Rossman and Huber, 2015) do not include water column denitrification processes (assimilatory uptake is simulated to various extent; Arnold et al., 2012; Rossman and Huber, 2015). This is an important knowledge gap. Models like SWAT and SWMM incorporate erosion and sediment transport algorithms that can describe sediment and sediment bound nutrient exports from the land surface into the stream (Arnold et al., 2012). The SWAT model already characterizes (via the In-channel module)—stream/river water depth and travel time for simulated reaches, dissolved oxygen, and suspended sediment concentration, transport, and particle size distribution. The model also has limited algorithms to characterize bacterial biomass (but not type) associated with channel sediments. These algorithms and sediment parameters can be leveraged and simplified equations linking water column denitrification to parameters such as water temperature, dissolved inorganic N, organic C, and suspended concentrations can be included. Such equations based on empirical data have already been developed by Xia et al. (2017b), Pang et al. (2022), and Wang et al. (2022) for various rivers in China. However, regression parameters for these equations likely vary with physiographic regions and climate and so region/climate specific values may be needed. For example, a comparison of our measured values (and fitted regression equations) against predicted estimates based on equations developed by Xia et al. (2017b) indicate that our measured fluxes were under predicted (Figure 5). Thus, accurate estimates of water column denitrification may be needed if we want to develop a robust estimate of these processes at the reach and watershed scales.
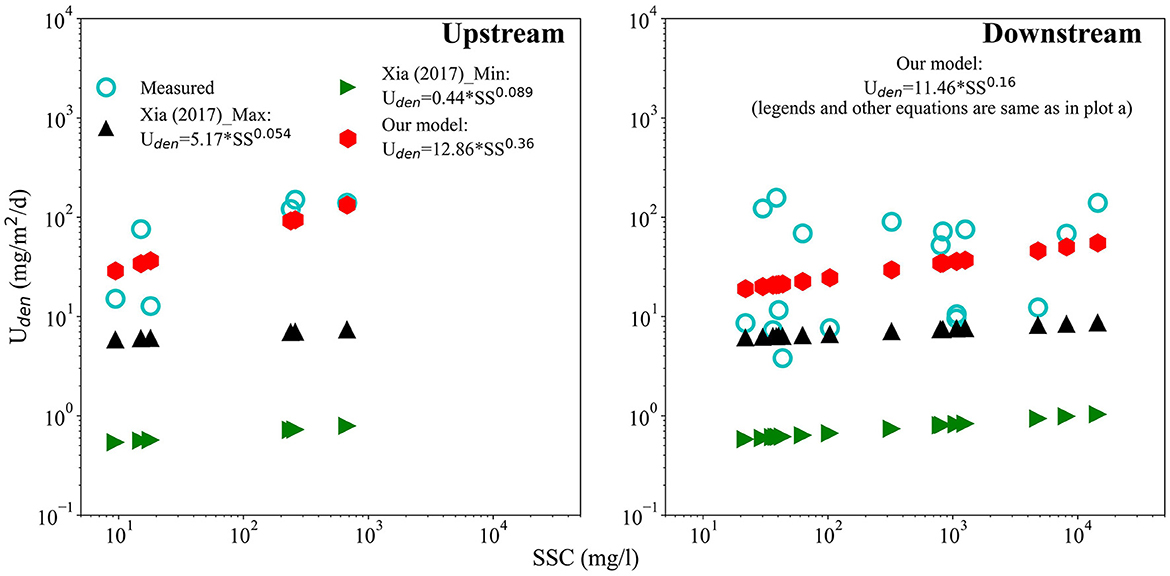
Figure 5. Comparison of measured Uden rates for White Clay Creek (Piedmont region watershed; empty circles) at the upstream site and the downstream site against values estimated from equations developed by other studies. Equations developed in other studies and fitted equations to our data are reported. The Xia (2017)_Max and Xia (2017)_Min indicate maximum and minimum estimates from Xia et al. (2017b).
We also recognize that N process rates may vary with reach and watershed scales and algorithms and equations developed at the small mesocosm/microcosm scales may not necessarily apply as is at the larger scales. Addressing scaling issues for processes and their parameters has been an ongoing challenge across multiple disciplines (e.g., Blöschl and Sivapalan, 1995). This challenge stems from the inability to measure process rates and parameters at large scales. This applies here too given the practical challenges with measuring Uden and Uassim at the scale of the full stream reach. Currently, the best strategy in such situations is to collect as many N process measurements as possible and for a wide range of conditions (including discharges, suspended sediment concentrations, water temperatures, and dissolved oxygen) and assume that the relationships provide some representation of processes at the larger scales.
Additionally, climate change could further increase the frequency and intensity of the largest storms (Wuebbles et al., 2017). Increased intensity of storms is expected to increase sediments and sediment-bound nutrients from watersheds (Dhillon and Inamdar, 2013). This could increase the potential for water column denitrification losses as well as assimilatory uptake, particularly in combination with increasing air and water temperatures, thereby adding additional urgency to improving N fluxes in watershed budgets and models.
Conclusion
This study revealed that sediment bound N exports during storms exceeded the water column assimilatory and denitrification fluxes by a significant amount. This suggests that while the N sinks are not trivial, N removal by suspended sediment associated denitrification will likely be outpaced by sediment bound N exports during large stormflows. Our observations also revealed that the magnitude of the N fluxes varied with storm events and catchment drainage area. While it is challenging to sample storm events, future research should be targeted toward sampling multiple storm events of varying magnitudes, across seasons, and on the rising and falling limbs of the hydrograph. Ideally, in-situ measurements of water column N fluxes (e.g., Wang et al., 2022) with simultaneous measurements of suspended sediment size, concentrations, and nutrient (N, DOC) availability should be performed. Such measurements will further our ability to model water column N fluxes and better constrain the N cycle budgets for watersheds.
Data availability statement
The datasets presented in this study can be found in online repositories. The names of the repository/repositories and accession number(s) can be found below: https://github.com/BiseshJoshi/Storm-N-uptakes-data.
Author contributions
BJ: Data curation, Writing—original draft, Formal analysis, Investigation, Methodology, Visualization. EB: Methodology, Writing—review & editing, Data curation. EP: Writing—review & editing, Data curation. MP: Conceptualization, Funding acquisition, Supervision, Writing—review & editing, Resources. JK: Funding acquisition, Writing—review & editing. SI: Conceptualization, Funding acquisition, Supervision, Writing—review & editing, Resources.
Funding
The author(s) declare financial support was received for the research, authorship, and/or publication of this article. This research was financially supported by the US Department of Agriculture grant NIFA-12912936 to MP, SI, and JK.
Conflict of interest
The authors declare that the research was conducted in the absence of any commercial or financial relationships that could be construed as a potential conflict of interest.
Publisher's note
All claims expressed in this article are solely those of the authors and do not necessarily represent those of their affiliated organizations, or those of the publisher, the editors and the reviewers. Any product that may be evaluated in this article, or claim that may be made by its manufacturer, is not guaranteed or endorsed by the publisher.
Supplementary material
The Supplementary Material for this article can be found online at: https://www.frontiersin.org/articles/10.3389/frwa.2023.1254225/full#supplementary-material
Supplementary Figure 1. Upstream flood hydrograph for storm event E3 and sampling locations on rising and falling limbs.
Supplementary Figure 2. Upstream flood hydrograph for storm event E4 and sampling locations on rising and falling limbs.
Supplementary Figure 3. Upstream flood hydrograph for storm event E5 and sampling locations on rising and falling limbs.
Supplementary Figure 4. Downstream flood hydrograph for storm event E1 and sampling locations on rising and falling limbs.
Supplementary Figure 5. Downstream flood hydrograph for storm event E2 and sampling locations on rising and falling limbs.
Supplementary Figure 6. Downstream flood hydrograph for storm event E3 and sampling locations on rising and falling limbs.
Supplementary Figure 7. Downstream flood hydrograph for storm event E4 and sampling locations on rising and falling limbs.
Supplementary Figure 8. Downstream flood hydrograph for storm event E5 and sampling locations on rising and falling limbs.
References
Acharya, B., and Joshi, B. (2020). Flood frequency analysis for an ungauged Himalayan river basin using different methods: a case study of Modi Khola, Parbat, Nepal. Meteorol. Hydrol. Water Manag. 8, 46–51. doi: 10.26491/mhwm/131092
Alexander, R. B., Boyer, E. W., Smith, R. A., Schwarz, G. E., and Moore, R. B. (2007). The role of headwater streams in downstream water quality. J. Am. Water Resour. Assoc. 43, 41–59. doi: 10.1111/j.1752-1688.2007.00005.x
Alexander, R. B., Smith, R. A., Schwarz, G. E., Boyer, E. W., Nolan, J. V., and Brakebill, J. W. (2008). Differences in phosphorus and nitrogen delivery to the Gulf of Mexico from the Mississippi River Basin. Environ. Sci. Technol. 42, 822–830. doi: 10.1021/es0716103
APHA (2017). Standard Methods for the Examination of Water and Wastewater. 23rd Edition. Washington DC: American Public Health Association.
Arango, C.P., Tank, J. L., Johnson, L. T., and Hamilton, S. K. (2008). Assimilatory uptake rather than nitrification and denitrification determines nitrogen removal patterns in streams of varying land use. Limnol. Oceanogr. 53, 2558–2572. doi: 10.4319/lo.2008.53.6.2558
Arnold, J. G., Moriasi, D. N., Gassman, P. W., Abbaspour, K. C., White, M. J., Srinivasan, R., et al. (2012). SWAT: model use, calibration, and validation. Trans. ASABE 55, 1491–1508. doi: 10.13031/2013.42256
Bacmeister, E., Peck, E., Bernasconi, S., Inamdar, S., Kan, J., and Peipoch, M. (2022). Stream nitrogen uptake associated with suspended sediments: a microcosm study. Front. Environ. Sci. 10, 1043638. doi: 10.3389/fenvs.2022.1043638
Beaulieu, J. J., Arango, C. P., and Tank, J. L. (2009). The Effects of Season and Agriculture on Nitrous Oxide Production in Headwater Streams. J. Environ. Quality 38, 637–646. doi: 10.2134/jeq2008.0003
Blöschl, G., and Sivapalan, M. (1995). Scale issues in hydrological modelling: a review. Hydrol. Proc. 9, 251–290. doi: 10.1002/hyp.3360090305
Buttle, J. M. (1994). Isotope hydrograph separations and rapid delivery of pre-event water from drainage basins. Progr. Phys. Geogr. 18, 16–41. doi: 10.1177/030913339401800102
Canfield, D. E., Glazer, A. N., and Falkowski, P. G. (2010). The evolution and future of earth's nitrogen cycle. Science 330, 192–196. doi: 10.1126/science.1186120
Christensen, P. B., and Sørensen, J. (1988). Denitrification in sediment of lowland streams: Regional and seasonal variation in Gelbæk and Rabis Bæk, Denmark. FEMS Microbiol. Lett. 53, 335–344. doi: 10.1016/0378-1097(88)90499-5
Dhillon, G. S., and Inamdar, S. (2013). Extreme storms and changes in particulate and dissolved organic carbon in runoff: entering uncharted waters? Geophys. Res. Lett. 40, 1322–1327. doi: 10.1002/grl.50306
Dhillon, G. S., and Inamdar, S. (2014). Storm event patterns of particulate organic carbon (POC) for large storms and differences with dissolved organic carbon (DOC). Biogeochemistry. 118, 61–81. doi: 10.1007/s10533-013-9905-6
Diehl, T. H. (2008). A Modified Siphon Sampler for Shallow Water. US Geological Survey. doi: 10.3133/sir20075282
Dodds, W. K., Burgin, A. J., Marcarelli, A. M., and Strauss, E. A. (2017). Nitrogen Transformations, Methods in Stream Ecology. Third Edition. New York, NY: Elsevier Inc. doi: 10.1016/B978-0-12-813047-6.00010-3
Edwards, A. C., and Withers, P. J. A. (2008). Transport and delivery of suspended solids, nitrogen and phosphorus from various sources to freshwaters in the UK. J. Hydrol. 350, 144–153. doi: 10.1016/j.jhydrol.2007.10.053
Fowler, D., Coyle, M., Skiba, U., Sutton, M. A., Cape, J. N., Reis, S., et al. (2013). The global nitrogen cycle in the Twentyfirst century. Philos. Trans. R Soc. Lond. B Biol. Sci. 368, 368. doi: 10.1098/rstb.2013.0164
Galloway, J. N., Dentener, F. J., Capone, D. G., Boyer, E. W., Howarth, R. W., Seitzinger, S. P., et al. (2004). Nitrogen cycles: past, present, and future. Biogeochemistry 70, 153–226. doi: 10.1007/s10533-004-0370-0
Giles, M., Morley, N., Baggs, E. M., and Daniell, T. J. (2012). Soil nitrate reducing processes - Drivers, mechanisms for spatial variation, and significance for nitrous oxide production. Front. Microbiol. 3, 407. doi: 10.3389/fmicb.2012.00407
Hall, R. O., Baker, M. A., Rosi-Marshall, E. J., Tank, J. L., and Newbold, J. D. (2013). Solute-specific scaling of inorganic nitrogen and phosphorus uptake in streams. Biogeosciences 10, 7323–7331. doi: 10.5194/bg-10-7323-2013
Inamdar, S., Dhillon, G., Singh, S., Dutta, S., Levia, D., Scott, D., et al. (2013). Temporal variation in end-member chemistry and its influence on runoff mixing patterns in a forested, Piedmont catchment. Water Resources Res. 49, 1828–1844. doi: 10.1002/wrcr.20158
Inamdar, S., Dhillon, G., Singh, S., Parr, T., and Qin, Z. (2015). Particulate nitrogen exports in stream runoff exceed dissolved nitrogen forms during large tropical storms in a temperate, headwater, forested watershed. J. Geophys. Res. 120, 1548–1566. doi: 10.1002/2015JG002909
Inamdar, S., Singh, S., Dutta, S., Levia, D., Mitchell, M., Scott, D., et al. (2011). Fluorescence characteristics and sources of dissolved organic matter for stream water during storm events in a forested mid-Atlantic watershed. J. Geophys. Res. 116, 1735. doi: 10.1029/2011JG001735
Jia, Z., Liu, T., Xia, X., and Xia, N. (2016). Effect of particle size and composition of suspended sediment on denitrification in river water. Sci. Total Environ. 541, 934–940. doi: 10.1016/j.scitotenv.2015.10.012
Jiang, G., Lutgen, A., Mattern, K., Sienkiewicz, N., Kan, J., and Inamdar, S. (2020). Streambank legacy sediment contributions to suspended sediment-bound nutrient yields from a mid-atlantic, piedmont watershed. J. Am. Water Resour. Assoc. 56, 820–841. doi: 10.1111/1752-1688.12855
Johnson, E. R., Inamdar, S., Kan, J., and Vargas, R. (2018). Particulate organic matter composition in stream runoff following large storms: role of POM sources, particle size, and event characteristics. J. Geophys. Res. 123, 660–675. doi: 10.1002/2017JG004249
Kan, J. (2018). Storm events restructured bacterial community and their biogeochemical potentials. J. Geophys. Res. 123, 2257–2269. doi: 10.1029/2017JG004289
Katz, B. (2020). Exploring the widespread impacts of ongoing nitrogen pollution. Eos 101, e10654. doi: 10.1029/2020EO149413
Kim, H., Bae, H.-S., Reddy, K. R., and Ogram, A. (2016). Distributions, abundances and activities of microbes associated with the nitrogen cycle in riparian and stream sediments of a river tributary. Water Res. 106, 51–61. doi: 10.1016/j.watres.2016.09.048
Klaus, J., and Mcdonnell, J. J. (2013). Hydrograph separation using stable isotopes: Review and evaluation. J. Hydrol. 505, 47–64. doi: 10.1016/j.jhydrol.2013.09.006
Liu, T., Wang, F., Michalski, G., Xia, X., and Liu, S. (2013). Using 15N, 17O, and 18O to determine nitrate sources in the Yellow River, China. Environ. Sci. Technol. 47, 13412–13421. doi: 10.1021/es403357m
Lowrance, R., Altier, L., Newbold, J., Schnabel, R., Groffman, P., Denver, J., et al. (1997). Water quality functions of riparian forest buffers in Chesapeake Bay watersheds. Environ. Manage. 21, 687–712. doi: 10.1007/s002679900060
McGlynn, B. L., and McDonnell, J. J. (2003). Quantifying the relative contributions of riparian and hillslope zones to catchment runoff. Water Resour. Res. 39, 1310–1330. doi: 10.1029/2003WR002091
Menzel, D. W., and Vaccaro, R. F. (1964). The measurement of dissolved organic and particulate carbon in seawater. Limnol. Oceanogr. 9, 138–142. doi: 10.4319/lo.1964.9.1.0138
Merill, L., and Tonjes, D. (2014). A review of the hyporheic zone, stream restoration, and means to enhance denitrification. Taylor Francis 44, 2337–2379. doi: 10.1080/10643389.2013.829769
Meybeck, M. (1982). Carbon, nitrogen, and phosphorus transport by world rivers. Am. J. Sci. 282, 401–450. doi: 10.2475/ajs.282.4.401
Montgomery, D. C., Peck, E. A., and Vining, G. G. (2012). Introduction to Linear Regression Analysis. Fifth Edition. London: John Wiley and Sons.
Mulholland, P. J., Helton, A. M., Poole, G. C., Hall, R. O., Hamilton, S. K., Peterson, B. J., et al. (2008). Stream denitrification across biomes and its response to anthropogenic nitrate loading. Nature 452, 202–205. doi: 10.1038/nature06686
Mulholland, P. J., Tank, J. L., Sanzone, D. M., Wollheim, W. M., Peterson, B. J., Webster, J. R., et al. (2000). Nitrogen cycling in a forest stream determined by a 15N tracer addition. Ecol. Monogr. 70, 471–493. doi: 10.1890/0012-9615(2000)070[0471:NCIAFS]2.0.CO;2
National Weather Service (2023a). Available online at: https://www.weather.gov/wrh/Climate?wfo=phi (accessed May 2, 2023).
National Weather Service (2023b). Available online at: https://www.weather.gov/tae/event-200911_ida (accessed May 2, 2023).
Nielsen, L. P. (1992). Denitrification in sediment determined from nitrogen isotope pairing. FEMS Microbiol. Ecol. 86, 357–362. doi: 10.1111/j.1574-6968.1992.tb04828.x
Pang, L., Sun, Y., Yue, Y., Liu, C., An, C., Yang, T., et al. (2022). Stability of aquatic nitrogen cycle under dramatic changes of water and sediment inflows to the three gorges reservoir. GeoHealth 6, e2022GH000607. doi: 10.1029/2022GH000607
Pennsylvania Geological Survey (2017). Available online at: https://www.dcnr.pa.gov/Geology/GeologyOfPA/CountyRockMaps/Pages/default.aspx (accessed January 24, 2023).
Randall, C. W. (2004). The environmental, economic and societal consequences of inadequate nitrogen pollution controls. Water Sci. Technol. 49, 23–33. doi: 10.2166/wst.2004.0733
Rashleigh, B., Paulsen, S., Flotemersch, J., and Pelletier, M. (2013). Biological assessment of streams and rivers in the U.S.: design, methods, and analysis. J. Ecol. Environ. 36, 2288–1220. doi: 10.5141/ecoenv.2013.010
Reisinger, A. J., Tank, J. L., Hoellein, T. J., Hall, J.r., and RO. (2016). Sediment, water column, and open-channel denitrification in rivers measured using membrane-inlet mass spectrometry. J. Geophys. Res. 121, 1258–1274. doi: 10.1002/2015JG003261
Reisinger, A. J., Tank, J. L., Rosi-Marshall, E. J., Hall, J.r,. R. O, and Baker, MA (2015). The varying role of water column nutrient uptake along river continua in contrasting landscapes. Biogeochemistry 125, 115–131. doi: 10.1007/s10533-015-0118-z
Revsbech, N. P., Jacobsen, J. P., and Nielsen, L. P. (2005). Nitrogen transformations in microenvironments of river beds and riparian zones. Ecol. Eng. 24, 447–455. doi: 10.1016/j.ecoleng.2005.02.002
Rode, M., Halbedel Née Angelstein, S., Anis, M. R., Borchardt, D., and Weitere, M. (2016). Continuous In-stream assimilatory nitrate uptake from high-frequency sensor measurements. Environ. Sci. Technol. 50, 5685–5694. doi: 10.1021/acs.est.6b00943
Rossman, L. A., and Huber, W. C. (2015). Storm water management model reference manual. U.S. Environ. Protect. Ag. I, 231. Available online at: www.epa.gov/water-research (accessed June 26, 2023).
Royer, T. V., David, M. B., and Gentry, L. E. (2006). Timing of riverine export of nitrate and phosphorus from agricultural watersheds in Illinois: Implications for reducing nutrient loading to the Mississippi River. Environ. Sci. Technol. 40, 4126–4131. doi: 10.1021/es052573n
Royer, T. V., Tank, J. L., and David, M. B. (2004). Transport and fate of nitrate in headwater agricultural streams in illinois. J. Environ. Quality 33, 1296. doi: 10.2134/jeq2004.1296
Seitzinger, S. P., Styles, R. V., Boyer, E. W., Alexander, R. B., Billen, G., Howarth, R. W., et al. (2002). Nitrogen retention in rivers: model development and application to watersheds in the northeastern U.S.A. Biogeochemistry 57, 199–237. doi: 10.1023/A:1015745629794
Steinman, A. D., Lamberti, A. G., and Leavitt, P. R. (2006). “Biomass and pigments of benthic algae,” in Methods in Stream Ecology, eds. F.R. Hauer and G.A. Lamberti (Amsterdam, Boston: Elsevier Academic Press), 357–380. doi: 10.1016/B978-012332908-0.50024-3
StreamStats/US Geological Survey (2023). Available online at: https://www.usgs.gov/streamstats (accessed May 2, 2023).
Sweeney, B. W. (1993). Effects of streamside vegetation on macroinvertebrate communities of white clay creek in Eastern North America. Acad. Natur. Sci. 144, 291–340.
Tabarestani, M. K., and Zarrati, A. R. (2015). Sediment transport during flood event: a review. Int. J. Environ. Sci. Technol. 12, 775–788. doi: 10.1007/s13762-014-0689-6
Trevor, H., Robert, T., and Jerome, F. (2008). “The elements of statistical learning || linear methods for regression,” in Springer Series in Statistics 43–99. doi: 10.1007/978-0-387-84858-7_3
USEPA (2023). U.S. Environmental Protection Agency|The Effects: Economy. Available online at: https://www.epa.gov/nutrientpollution/effects-economy (accessed May 2, 2023).
USGS Water Data for the Nation (2023a). Available online at: https://waterdata.usgs.gov/monitoring-location/01478100/#parameterCode=00065&period=P7D&showMedian=true (accessed May 2, 2023).
USGS Water Data for the Nation (2023b). Available at: https://waterdata.usgs.gov/monitoring-location/01478245/#parameterCode=00065&period=P7D&showMedian=true (accessed May 2, 2023).
Walling, D., Owens, P., Waterfall, B., Leeks, G., and Wass, P. (2000). The particle size characteristics of fluvial suspended sediment in the Humber and Tweed catchments, UK. Sci. Total Environ. 251, 205–22. doi: 10.1016/S0048-9697(00)00384-3
Wang, J., Xia, X., Liu, S., Zhang, S., Zhang, L., Jiang, C., et al. (2022). The dominant role of the water column in nitrogen removal and N2O emissions in large rivers. Geophys. Res. Lett. 49, 1–12. doi: 10.1029/2022GL098955
Wuebbles, D. J., Fahey, D. W., Hibbard, K. A., Dokken, D. J., Stewart, B. C., and Maycock, T. K. (2017). Climate Science Special Report: 4 th US National Climate Assessment. Washington, DC. doi: 10.7930/J0J964J6
Xia, X., Jia, Z., Liu, T., Zhang, S., and Zhang, L. (2017a). Coupled nitrification-denitrification caused by suspended sediment (SPS) in rivers: importance of SPS size and composition. Environ. Sci. Technol. 51, 212–221. doi: 10.1021/acs.est.6b03886
Xia, X., Liu, T., Yang, Z., Michalski, G., Liu, S., Jia, Z., et al. (2017b). Enhanced nitrogen loss from rivers through coupled nitrification-denitrification caused by suspended sediment. Sci. Total Environ. 579, 47–59. doi: 10.1016/j.scitotenv.2016.10.181
Xia, X., Liu, T., Yang, Z., Zhang, X., and Yu, Z. (2013). Dissolved organic nitrogen transformation in river water: effects of suspended sediment and organic nitrogen concentration. J. Hydrol. 484, 96–104. doi: 10.1016/j.jhydrol.2013.01.012
Xia, X., Yang, Z., and Zhang, X. (2009). Effect of suspended-sediment concentration on nitrification in river water: importance of suspended sediment - Water interface. Environ. Sci. Technol. 43, 3681–3687. doi: 10.1021/es8036675
Xia, X., Zhang, L., Wang, G., Wang, J., Zhang, L., Zhang, S., et al. (2021). Nitrogen loss from a turbid river network based on N2 and N2O fluxes: importance of suspended sediment. Sci. Total Environ. 757, 143918. doi: 10.1016/j.scitotenv.2020.143918
Xia, X., Zhang, S., Li, S., Zhang, L., Wang, G., Zhang, L., et al. (2018). The cycle of nitrogen in river systems: sources, transformation, and flux. Environ. Sci. 20, 863–891. doi: 10.1039/C8EM00042E
Xin, J., Liu, Y., Chen, F., Duan, Y., Wei, G., Zheng, X., et al. (2019). The missing nitrogen pieces: A critical review on the distribution, transformation, and budget of nitrogen in the vadose zone-groundwater system. Water Res. 165, 114977. doi: 10.1016/j.watres.2019.114977
Keywords: denitrification, assimilatory, uptake, stormflow, riverine, nitrogen, sediment, export
Citation: Joshi B, Bacmeister E, Peck E, Peipoch M, Kan J and Inamdar S (2023) Sediment-Nitrogen (N) connectivity: suspended sediments in streams as N exporters and reactors for denitrification and assimilatory N uptake during storms. Front. Water 5:1254225. doi: 10.3389/frwa.2023.1254225
Received: 06 July 2023; Accepted: 16 November 2023;
Published: 06 December 2023.
Edited by:
Dipankar Dwivedi, Berkeley Lab (DOE), United StatesReviewed by:
Christina Tague, University of California, Santa Barbara, United StatesJinwoo Im, Berkeley Lab (DOE), United States
Copyright © 2023 Joshi, Bacmeister, Peck, Peipoch, Kan and Inamdar. This is an open-access article distributed under the terms of the Creative Commons Attribution License (CC BY). The use, distribution or reproduction in other forums is permitted, provided the original author(s) and the copyright owner(s) are credited and that the original publication in this journal is cited, in accordance with accepted academic practice. No use, distribution or reproduction is permitted which does not comply with these terms.
*Correspondence: Bisesh Joshi, Ympvc2hpQHVkZWwuZWR1