 Haris Uddin Qureshi1
 Syed Muzzamil Hussain Shah
 Fang Yenn Teo
- 1Department of Civil Engineering, Sir Syed University of Engineering and Technology, Karachi, Pakistan
- 2Interdisciplinary Research Center for Membranes and Water Security, King Fahd University of Petroleum and Minerals, Dhahran, Saudi Arabia
- 3Faculty of Science and Engineering, University of Nottingham Malaysia, Semenyih, Selangor, Malaysia
The agriculture sector, due to its significant dependence on climate patterns and water availability, is highly vulnerable to changing climate patterns. Pakistan is an agrarian economy with 30% of its land area under cultivation and 93% of its water resources being utilized for agricultural production. Therefore, the changing climate patterns may adversely affect the agriculture and water resources of the country. This study was conducted to assess the climate variations over the major agro-climatic zones of Sindh and Punjab, which serve as an important hub for the production of major food and cash crops in Pakistan. For this purpose, the climate data of 21 stations were analyzed using the Mann–Kendall test and Sen's slope estimator method for the period 1990–2022. The results obtained from the analysis revealed that, in Sindh, the mean annual temperature rose by ~0.1 to 1.4°C, with ~0.1 to 1.2°C in cotton-wheat Sindh and 0.8 to 1.4°C in rice-other Sindh during the study period. Similarly, in Punjab, the mean annual temperature increased by ~0.1 to 1.0°C, with 0.6 to 0.9°C in cotton-wheat Punjab and 0.2 to 0.6°C in rainfed Punjab. Seasonally, warming was found to be highest during the spring season. The precipitation analysis showed a rising annual precipitation trend in Sindh (+30 to +60 mm) and Punjab (+100 to 300 mm), while the monsoon precipitation increased by ~50 to 200 mm. For winter precipitation, an upward trend was found in mixed Punjab, while the remaining stations showed a declining pattern. Conclusively, the warming temperatures as found in the analysis may result in increased irrigation requirements, soil moisture desiccation, and wilting of crops, ultimately leading to low crop yield and threatening the livelihoods of local farmers. On the other hand, the increasing precipitation may favor national agriculture in terms of less freshwater withdrawals. However, it may also result in increased rainfall-induced floods inundating the crop fields and causing water logging and soil salinization. The study outcomes comprehensively highlighted the prevailing climate trends over the important agro-climatic zones of Pakistan, which may aid in devising an effective climate change adaptation and mitigation strategy to ensure the state of water and food security in the country.
1. Introduction
The varying climate patterns have emerged as one of the greatest challenges being faced by the world community due to its adverse impact on the environment and the ecosystem. These climate variations are widely believed to be anthropogenically driven, with the major causes including deforestation, landcover alterations, sprawling urbanization, industrial expansion, and emissions of toxic gases into the atmosphere (Adler et al., 2017). These factors consequently lead to the destabilization of global heat balance, which results in warming earth temperature, seasonal shifts, changes in wind circulation patterns, and varying precipitation (Rasul et al., 2012; Talpur et al., 2022; Khahro et al., 2023). During the last century, the adversities of climate change have been clearly observed on the global as well as on the regional climate patterns. For instance, during 1951–2012, the mean global temperature rose by ~0.72°C (Nawaz et al., 2019), while regionally, the mean temperature over South Asia rose by ~0.75°C (Tariq et al., 2022). Apart from air temperature (that strongly governs evapotranspiration), precipitation is also an important component of the water cycle and the global water balance since water in all of its forms is received on the earth's surface from the atmosphere via precipitation. Due to the rising air temperatures and shifts in the wind flow patterns, the precipitation trends have also undergone significant variations around the globe (Saini et al., 2020; Duan et al., 2022). For instance, as per the global precipitation during the last 100 years analyzed by the National Oceanographic and Atmospheric Administration (NOAA), the mean global land surface precipitation increased at the rate of ~0.04 inch/decade (Pörtner et al., 2022). However, due to the highly varying character of precipitation, and due to its high sensitivity toward the geographical features and the wind patterns in a region, some areas of the world also observed a declining trend of precipitation. For example, Merabtene et al. (2016) reported a decreasing pattern of annual and winter seasonal precipitation in Sharjah city (UAE). Similar trends were detected in a study conducted by Almazroui (2020) in Saudi Arabia, according to which the mean annual precipitation of the country declined at the rate of ~5.89 mm/decade during the period 1978–2019. Thus, a considerable spatial variation exists in the changing climate patterns around the world.
The agriculture sector is generally ranked as the most vulnerable sector to the changing climate patterns. As per the Food and Agriculture Organization (FAO), the global agricultural land consists of ~4.8 billion hectares, out of which ~33% of the area is cropland (Gennari et al., 2019). Regionally, Asia serves as the largest contributor to the global cropland area (approximately 38%) due to the relatively favorable agro-meteorological conditions, followed by America (24%), Europe (19%), and Africa (18%). For the timely and quantitatively sufficient water application on the agricultural fields to meet the crop water requirements, various irrigation methods have been adopted around the globe to refrain from solely relying on precipitation. At present, ~342 million hectares of the global land area is under irrigation with ~70% in Asia, 16% in America, and 8% in Europe. In addition, based on labor and livelihood, ~874 million people around the world are linked to the agriculture sector, with ~200 million people each in China and India. Based on water consumption, the agriculture sector is the highest water-consuming sector, as it consumes ~70% of the global freshwater withdrawals (Waaswa et al., 2022). This indicates that agricultural production heavily relies on sufficient water availability and climate patterns. Therefore, the changing climate patterns may adversely affect water availability and agricultural production, thereby threatening the state of regional and global food and water security.
Pakistan is an agrarian economy with ~25% of its Gross Domestic Product (GDP) depending on agricultural production (Khan et al., 2020). Out of the total 24 Mha of its area under cultivation, 75% of it is under irrigation, while the remaining is rainfed (Qureshi, 2020; Talpur et al., 2022). Based on groundwater extraction, Pakistan is ranked as the third largest user of groundwater for agricultural production with ~73% of its agricultural land irrigated using groundwater. Due to the scattered rainfall pattern and overall low mean annual precipitation of the country, the rainfall contribution to the national agriculture sector is only sufficient to meet ~15% of the crop water requirements, while the remaining fraction is met through irrigation (Qureshi, 2020). Geographically, Pakistan lies in the temperate zone and partially in sub-tropics, covering an area of ~796,095 km2, and is characterized by a continental type of climate with high climate variations across the country due to its diverse topography from south to north (Chaudhry, 2017). Based on the climate characteristics, Pakistan is categorized into six major climate zones as shown in Figure 1. The mean annual temperature of Pakistan is ~20.35°C, with ~24.0°C in the southern and central parts of the country and 18.0°C in its northern and northwestern belt. Similarly, the annual precipitation also varies spatially, with 60% of the country's land area receiving annual precipitation below 250 mm, 24% receiving between 250 and 500 mm, and the northern highlands receiving ~1000–1500 mm (Raza et al., 2015). For precipitation, Pakistan has two major seasons: the southwest summer monsoon (July to September), which brings ~140.8 mm of rainfall to the country every year on average and holds special importance in terms of replenishing the surface and groundwater resources and supplementing the irrigation requirements for the kharif crop production. Another is the winter precipitation, which occurs due to the formation of the western depression over the Mediterranean region and brings a good amount of snowfall over the Greater Himalayas and northern Balochistan. Pakistan receives ~72 mm of precipitation every year on average during the winter season. This winter precipitation holds significant importance for the growth of rabi crops in the country and the cryospheric mass balance over the Greater Himalayas. The western depression in Pakistan has two branches, namely, the primary and secondary western disturbances. The primary western disturbances enter into the country from Afghanistan, and bring precipitation over the northern parts of the country, whereas the secondary western disturbances infiltrate into the country from Iran, and generously cover Balochistan, Western Highlands, northern and central Punjab, and sometimes Sindh (Salma et al., 2012).
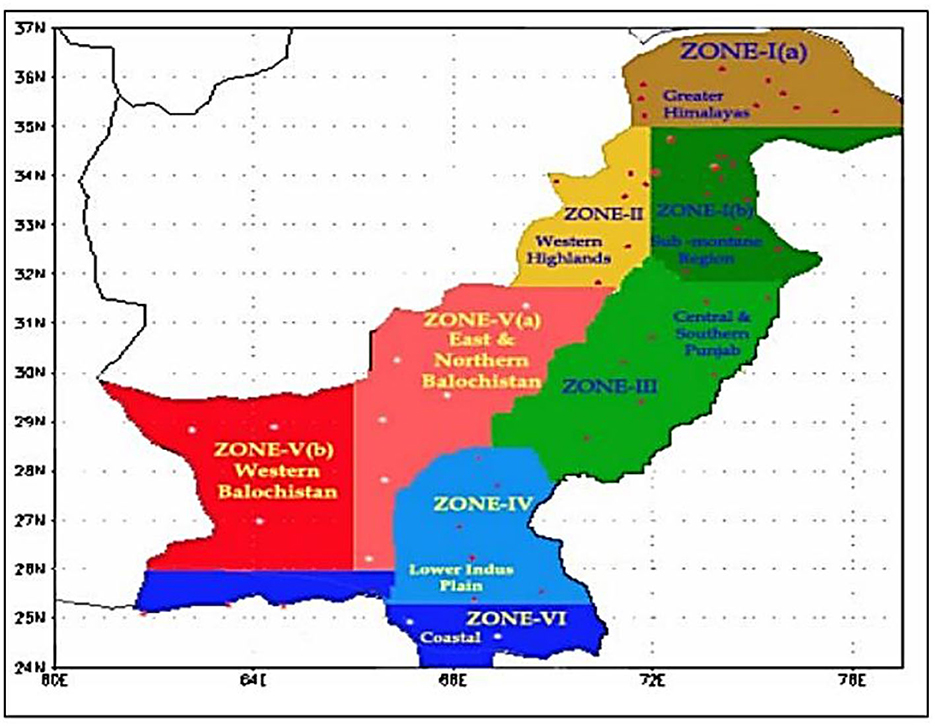
Figure 1. Six major climatic zones of Pakistan. Source: Global Change Impact Studies Center (GCISC, 2009).
Pakistan has frequently been ranked among the countries that are most susceptible to the adversities of global climate change due to its increasing population, poor resource management, and lack of economic and administrative capacity of the country for climate change adaptation (Rasul et al., 2012). During the last century, the negative effects of global climate change have been clearly noticed in the local climate patterns of the country. For instance, as per the Global Change Impact Studies Center (GCISC, 2009), the mean annual temperature of Pakistan rose by ~0.6°C during the last century at the rate of 0.06°C per decade, as shown in Figure 2 (Chaudhry, 2017). Temporally, the intensity of warming was greater during the later years of the century as compared to the earlier years, which was highlighted in a study by the World Food Program, according to which the mean annual temperature of Pakistan increased at the rate of ~0.07°C per decade between 1960 and 2018 (Ishaq et al., 2018). Similar trends were reported in a study conducted by the World Bank Group and Asian Development Bank, according to which the mean temperature of the country warmed by ~0.47°C during the period 1960 to 2007 (Asian Development Bank, World Bank Group, 2021).
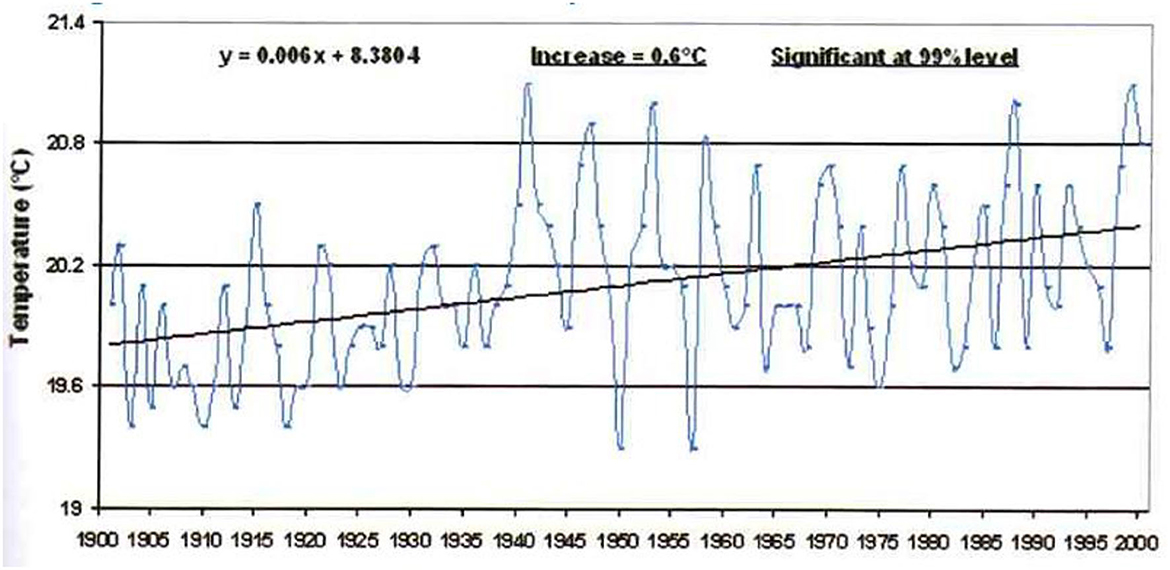
Figure 2. Mean annual temperature trend of Pakistan (1900–2000). Source: Global Change Impact Studies Center (GCISC, 2009).
Apart from temperature, the precipitation patterns across the country have also undergone significant changes during the past decades. Pakistan as a whole has witnessed a slightly increasing trend of precipitation during the last century. As per Rasul et al. (2012), the mean annual precipitation of Pakistan increased at the rate of ~0.5 mm per year during the last century. Similarly, as per the PMD annual climate report 2022, the mean annual precipitation of Pakistan increased by ~64 mm during the period 1960 to 2021, as shown in Figure 3.
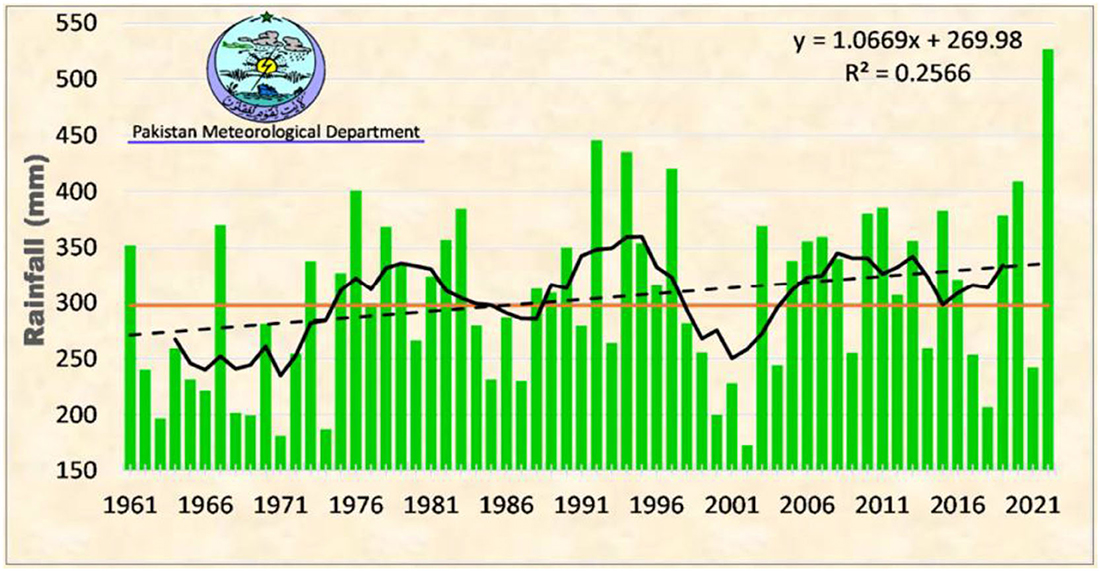
Figure 3. Pakistan's annual rainfall time series during 1960–2021, with the black line indicating the 7-year moving average and the red line showing the national annual long-term (1961–2010) average. The black dotted line shows trends during the period. Source: PMD annual climate report, 2022 (PMD, 2022).
It is important to note that agricultural and livestock production in Pakistan is mainly centered in its two provinces, namely, Sindh and Punjab (Sadiq et al., 2019). Punjab is the largest province of Pakistan in terms of population and agricultural growth, spanning an area of ~20.63 Mha, out of which ~17.6 Mha is under cultivation. Out of the total cultivated area in the province, ~15.47 Mha is under irrigation, while the remaining is rainfed (Mujtaba et al., 2022). The province is the largest grower of wheat crops in Pakistan, as ~73% of the country's wheat production takes place in Punjab. Furthermore, the province is also famous for growing export-quality basmati rice and contributes ~60% to the national rice production (Arshad et al., 2019). On the other hand, Sindh is the 2nd largest contributor to national agriculture and livestock production after Punjab, spanning an area of ~14.09 Mha, out of which ~4.87 Mha is under cultivation (Memon et al., 2021). The climate of Sindh is mainly warm and arid due to its location in the sub-tropical region, with its mean annual rainfall ranging from ~150 to 250 mm. Approximately 68% of agricultural land in Sindh is being used for growing rice, wheat, sugarcane, and cotton crops. The dominant cropping patterns in the Sindh province are rice-wheat, cotton-wheat, and mixed cropping. As per the Pakistan Council of Research in Water Resources (PCRWR), ~35% of rice, 28% of sugarcane, 12% of wheat, and 20% of cotton in Pakistan are grown in the Sindh province (PCRWR, 2018). Furthermore, the province is also an important hub for the production of horticultural crops in the country as ~73% of bananas, 34% of mangoes, and 88% of the chilies in the country are grown in the Sindh province (Haider and Ullah, 2020). This clearly indicates that food security in Pakistan is heavily dependent on the agricultural production in Sindh and Punjab, and the changing climate patterns over these two provinces may adversely affect the overall state of food security in the country.
1.1. Literature review
To investigate the varying climate patterns over an area, past studies have recommended a number of non-parametric methods including the Mann–Kendall (MK) test, Spearman's rho test, and Mann–Whitney test to investigate the changing climate patterns over an area (Ahmad et al., 2015; Hadi and Tombul, 2018; Duy et al., 2022; Huang et al., 2022; Pohl et al., 2023). The MK test has been used in numerous studies in the past and is considered to be highly reliable due to its non-restriction for the time series data to be normally distributed. For example, Das et al. (2022) employed the Mann–Kendall test for the detection of temperature and rainfall patterns in Bangladesh and found an upward trend of temperature over the country. For rainfall, a declining trend was detected. Similarly, Gadedjisso-Tossou et al. (2021) also used the MK test to study the rainfall and temperature patterns over northern Togo (Africa) and found an overall upward trend of rainfall and temperature. Apart from the determination of the nature of the trend (increasing or decreasing), the magnitude of change also yields valuable information for the climate change analysis. For this purpose, Sen's slope estimator method has been recommended and used in various studies due to its non-parametric nature (Agarwal et al., 2021; Abdullah et al., 2022). For instance, Panda and Sahu (2019) used the Sen's slope estimator method for the analysis of seasonal temperature and precipitation over the selected districts of India and reported an overall increasing trend of summer monsoon rainfall with the Sen's slope as +4.03 mm/year. For annual mean temperature, an increasing trend with the Sen's slope as +0.29°C/year was detected. Aswad et al. (2020) also used the Sen's slope estimator method to study the rainfall trends over the Sinjar district (Iraq) and reported a declining trend of rainfall with the Sen's slope as −0.916 mm/year. However, before the use of the aforementioned trend detection tests, it is essential to first test the serial or auto-correlation in the data. The presence of serial correlation in the time series data may yield a significant trend in the time series even if it was not present or vice versa, which may mislead the investigation (Latif et al., 2018). To check and remove the serial correlation from the climate data, the previous studies have suggested a number of methods, including Trend-Free Pre-Whitening (TFPW), Pre-Whitening (PW), and Variance Correction (VC) methods (Latif et al., 2018; Alashan, 2020; Gao et al., 2020). The Pre-Whitening approach has been employed in various studies to remove the serial correlation from the time series data. For example, Nawaz et al. (2019) used the Pre-Whitening method to remove the auto-correlation from the time series data. Mullick et al. (2019) also used the Pre-Whitening method to remove the serial correlation for the assessment of climate trends in Bangladesh.
Previously, numerous studies have been conducted to investigate the varying weather patterns over the high elevation areas, low hyper-arid and arid plains, and the coastal zones in Pakistan. For instance, Raza et al. (2015) studied the variations in surface temperature and precipitation over Gilgit-Baltistan for the period 1955–2010, and reported an increasing trend of temperature during winter, spring, and post-monsoon months, while the summer temperatures declined over the area. For precipitation, an overall increased trend was found in the study. Jahangir et al. (2016) investigated the daily minimum temperature trend for the period 1979–2013 over Punjab (Pakistan) and found a slight change during the spring season over the province. However, this study was specifically conducted to comprehensively investigate the annual and seasonal climate patterns over the major agro-climatic zones of Sindh and Punjab which have rich fields of major food and cash crops and serve as an important hub for the country's agricultural and livestock production. The annual and seasonal temperature and rainfall trends over the selected stations in Sindh and Punjab were investigated for the period 1990–2022 using the Mann–Kendall test and the Sen's slope estimator method. The outcomes of this study are expected to help in understanding the prevailing climate patterns over the major agro-climatic zones of the country, sustainable management and conservation of available water resources, adopting effective irrigation and drainage practices, and devising holistic climate change adaptation and mitigation strategy for ensuring the state of food and water security in the country.
2. Materials and methods
2.1. Study area
Based on the climate, land use, physiography, availability of water, and farming practices, Pakistan is categorized into 11 agro-climatic zones, namely, rice-wheat Punjab, cotton-wheat Punjab, low-intensity Punjab, Barani-rainfed Punjab, cotton-wheat Sindh, rice-other Sindh, Khyber Pakhtunkhwa, Balochistan, mixed Punjab, Gilgit-Baltistan, and Azad Jammu Kashmir (Sadiq et al., 2019), with the political map of the country shown in Figure 4. In this study, the agro-climatic zones of Sindh and Punjab were selected due to their significant contribution to the country's agricultural production. Rice-wheat Punjab mainly consists of the central and northeastern parts of Punjab province. The major food and cash crops sown in this zone include rice, wheat, and sugarcane along with jawar, bajra, mash, moong, maize, tobacco, oilseed, and mustard. Climatologically, the winters are generally mild in this zone, while late spring and early summer are hot, headed by summer monsoon that declines the pre-monsoon high temperatures over the area. Due to its spatial location, the region receives a good amount of precipitation from both summer monsoon and western disturbances, while Autumn is generally dry over the area. The cotton-wheat Punjab generally consists of the southern parts of Punjab province, with cotton, wheat, sugarcane, rice, maize, and potato are the main crops sown in the zone along with fruits and vegetables. The climate of this zone is mainly warm and arid due to its closeness to the Cholistan and Thal deserts with the maximum temperature normally exceeding 30°C during early spring, whereas the minimum temperature also remains above 30°C during summer. The region receives a very low rainfall during winter and spring due to the poor intrusion of western disturbances into the zone and receives its annual rainfall mainly from the summer monsoon. Low-intensity Punjab is geographically located along the banks of the Indus River following the contours of the Suliman range. Wheat, rice, fruits, and vegetables are the main crops grown in this zone. Climatologically, summers are normally dry and hot in this zone, while winters are relatively cooler. The zone lies outside the spatial coverage of western disturbances and thus receives very scarce rainfall during the winter and early spring months while receiving adequate rainfall from the summer monsoon (Sadiq et al., 2019).
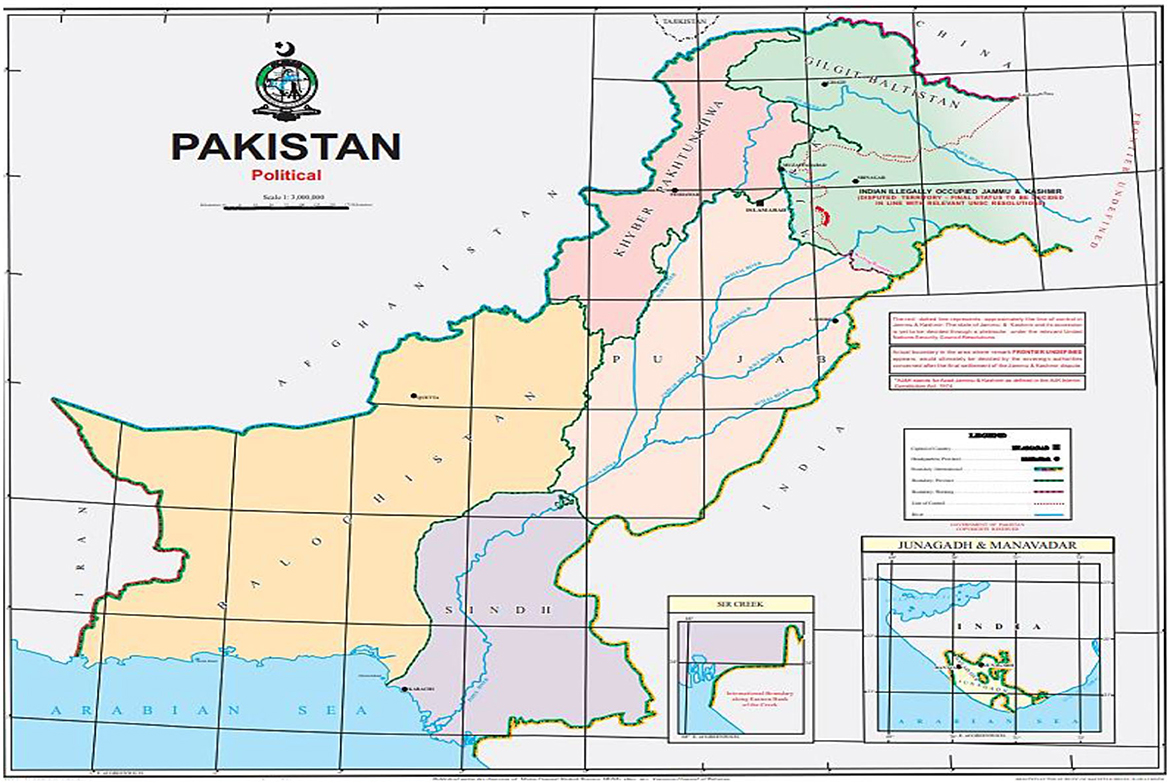
Figure 4. Political map of Pakistan. Source: survey of Pakistan.
Barani-rainfed Punjab mainly consists of the northern parts of Punjab province lying between the Jhelum and Indus rivers and is known as the Potohar plateau. The major crops grown in the zone include wheat, maize, sorghum, groundnut, mustard, sunflower, and soybean. Climatologically, winters are mildly cold in the zone, while summers are hot with maximum temperature normally exceeding 40°C during pre-monsoon. The zone receives the highest amount of summer monsoon precipitation in the country due to the good incursion of the monsoon system into the area and also receives a good amount of rainfall from the western disturbances. Mixed Punjab mainly comprises the central parts of Punjab with wheat, sugarcane, fruits, and vegetables as the main crops grown in the zone. Climatologically, the spring season months are the warmest in the year over the zone, and the area receives a majority of its annual rainfall from the summer monsoon. Cotton-wheat Sindh mainly comprises the southeastern parts of Pakistan with cotton, wheat, sugarcane, and rice being the main crops sown in this zone. Climatologically, the zone is arid and extremely hot, where maximum temperatures normally stay above 25°C, and minimum temperatures above 5°C throughout the year, with the highest warming taking place during the pre-monsoon months with the temperature often exceeding 40°C. Due to the poor incursion of western disturbances into the area, this zone seldom receives winter precipitation and relies solely on the summer monsoon for its annual precipitation. Rice-other Sindh generally consists of the southwestern and the coastal parts of the Sindh province. Due to its closeness to the Indus River, the zone is characterized by rich fertile land. The major crops sown in the area include rice, wheat, sugarcane, cotton, pulses, fruits, and vegetables. Climatologically, winters are mild in the zone, while summers are hot and the area mainly relies on the southwest summer Monsoon for its annual precipitation (Sadiq et al., 2019).
2.2. Data collection
In this study, a total of 21 climate stations were selected from Sindh and Punjab for the annual and seasonal trend assessment of temperature and rainfall patterns. The stations of Sialkot, Lahore, and Gujranwala were selected from the rice-wheat Punjab. From cotton-wheat Punjab, Multan, Bahawalnagar, and Bahawalpur were selected. From low-intensity Punjab, Mianwali and Dera Ismail Khan were selected. From Barani Punjab, Islamabad and Jhelum were selected. From mixed Punjab, Sargodha and Faisalabad were selected. From cotton-wheat Sindh, Sukkur, Naushahro Feroze, Nawabshah, Hyderabad, and Umerkot were selected. From rice-other Sindh, Jacobabad, Larkana, Dadu, and Badin were selected, as shown in Figure 5.
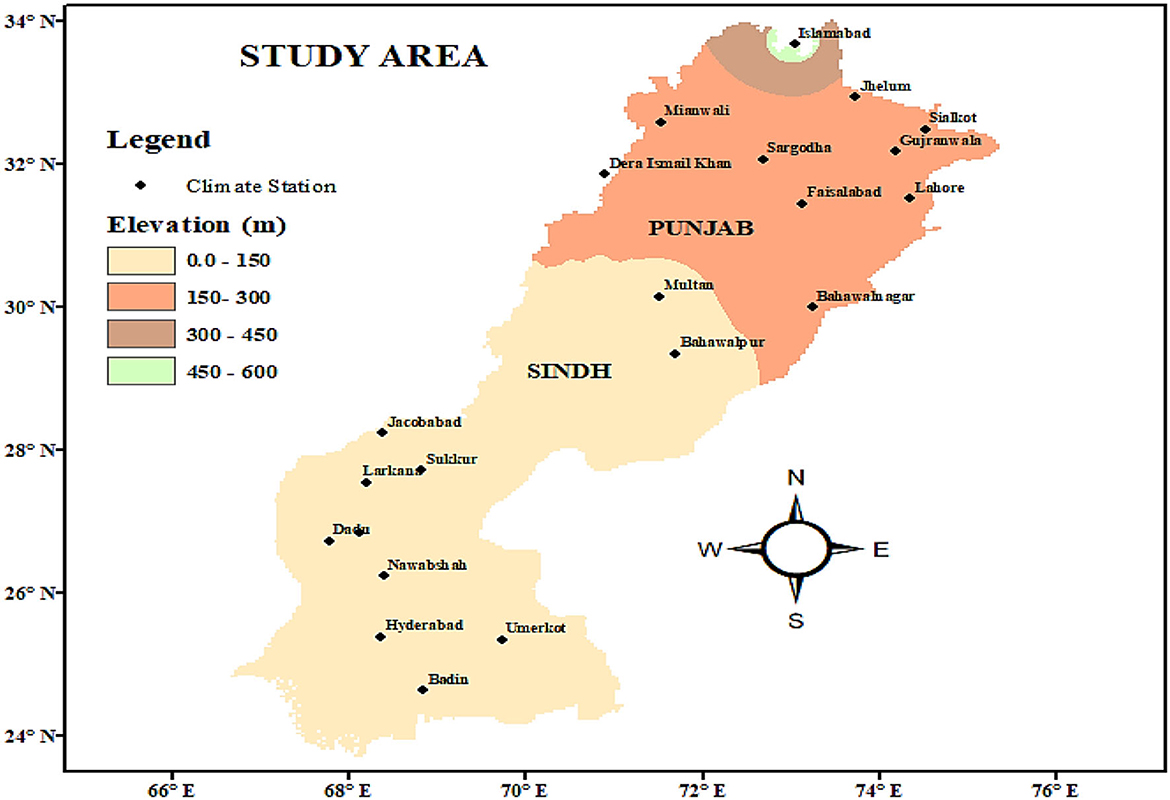
Figure 5. Description of study area showing the selected stations from the major agro-climatic zones of Sindh and Punjab.
The acquired climate data from PMD consisted of monthly maximum and minimum air temperature and rainfall for the period 1990–2022. The geographic and climate details of the selected stations are shown in Table 1.
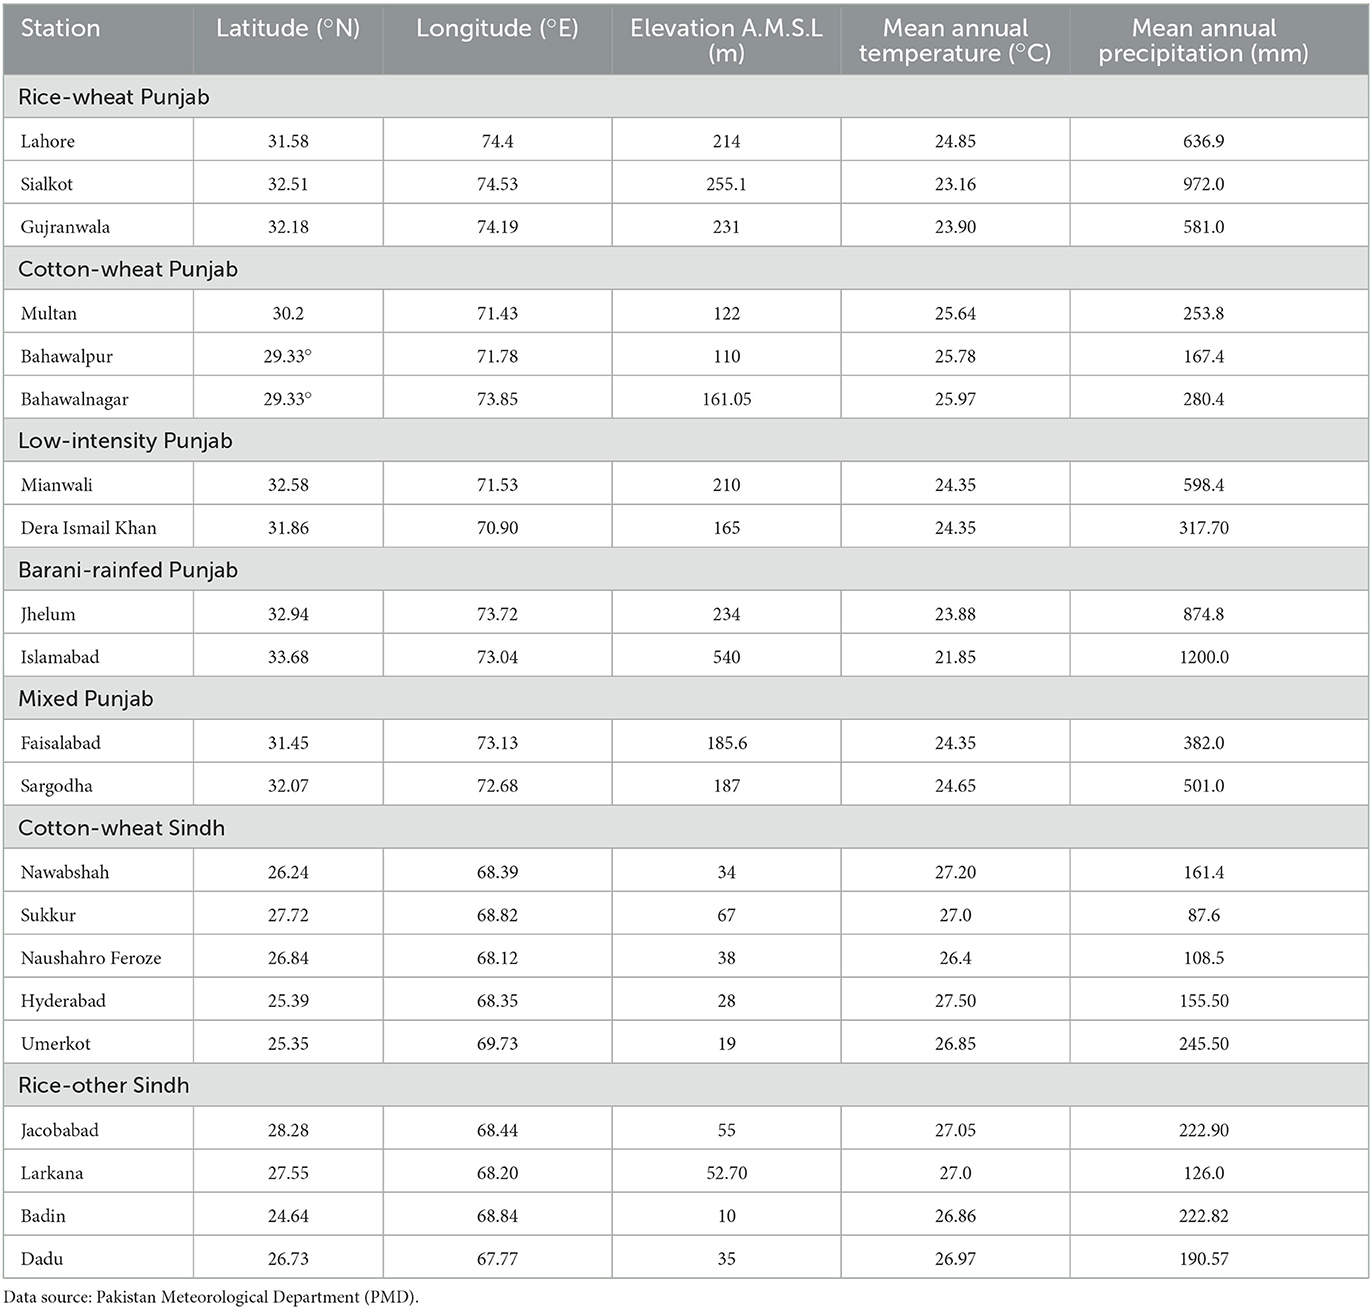
Table 1. Geographical and climate details for selected stations in the major agro-climatic zones of Sindh and Punjab.
3. Methodology
3.1. Serial correlation analysis
As discussed in the literature review, the presence of auto-correlation was to be first tested in the climate data before the trend analysis, as the time series must be serially independent and randomly ordered for the trend detection. To detect the serial correlation, the lag-1 auto-correlation coefficient (r1) was computed for all months of the given temperature and rainfall data for all selected stations using Equation 1 as follows (Gao et al., 2020):
The auto-correlation co-efficient (r1) obtained from Equation 1 was then tested at a 95% confidence interval (5% significance level) using Equation 2 as follows (Gao et al., 2020):
As per the past studies, if r1 for a time series lies within the above range as shown in Equation 2, it is assumed that the data does not possess serial interdependence and the statistical tests can be applied without any modification (Nawaz et al., 2019). However, if r1 is outside the range, then the serial correlation is considered in the data and is removed for reliable trend analysis (Gao et al., 2020). In this study, the time series with significant serial correlation found was indicated as “✓”, while the time series with no auto-correlation found was indicated as “✗”.
3.2. Pre-whitening method
In this study, the climate data having serial correlation found was first rectified by using Pre-Whitening, and the trend tests were then used on the corrected data. The corrected time series data were obtained by using the expression (T2-r1T1, T3-r1T2……, Tn-r1-Tn − 1), and the trend detection tests were then applied to the modified time series data.
3.3. Mann–Kendall test
In this study, the MK test was used to investigate the nature and significance of temperature and rainfall trends (increasing or decreasing) on the annual and seasonal scales over the selected agro-climatic zones. The mathematical expressions used to compute the MK test statistics are shown as follows (Frimpong et al., 2022):
The value of S is considered during the analysis when the number of observations (n) in data is <10. On the contrary, if the number of observations is more than 10, then the value of Z is computed for the trend investigation (Karmeshu, 2012).
Where Ti and Tj are the values in climate data at times i and j, respectively (where j > i), and n is the length of time series data. The positive value of Z shows a rising pattern, while the negative value shows a decreasing pattern. The resulting trends were assessed using two variables, namely, |Z| and p-value, computed from the test at the chosen significance level (α). As per the literature review, if α is <p and |Z| > |Zα/2|, then the trend is declared to be statistically significant at the given confidence interval, and the null hypothesis is rejected. However, if p > α and |Z| < |Zα/2|, then the trend is declared to be non-significant (Latif et al., 2018; Gao et al., 2020). In this study, the Mann–Kendall test was applied to the corrected climate data for all selected stations at a 95% confidence interval (significance level as 0.05), and the trends were termed as significant if |Z| > |Zα/2| (that is, 1.96) and p < 0.05.
3.4. Sen's slope estimator method
For the assessment of the magnitude of the trend, Sen's slope estimator method was applied in this study to compute the value of change in the annual and seasonal temperature (°C/year) and rainfall (mm/year) during the study period. The statistics for the Sen's slope method in this study were estimated using Equations 7, 8 as follows (Latif et al., 2018):
Where i = 1,2,3,4…..N, Mi is the calculated slope of N pairs of data, and Ti and Tj are the values of data pairs at times i and j, respectively. The median of Sen's slope (M) was estimated as follows (Latif et al., 2018):
4. Results and discussion
4.1. Serial correlation analysis
In this study, the presence of significant serial correlation was first tested at a 95% confidence interval in the given monthly maximum and minimum temperatures and precipitation time series data before the trend assessment. The monthly climate time series data with significant auto-correlation found at a 95% confidence interval (indicated with the symbol “✓” in Tables 2, 3) were first corrected by employing the Pre-Whitening method, and the MK test and Sen's slope estimator method were then applied on the modified time series data (free from serial correlation). The results obtained from the serial correlation analysis are shown in Tables 2, 3.

Table 2. Results of serial correlation test for monthly maximum and minimum temperature time series data for the selected stations in the study.

Table 3. Results of serial correlation test for monthly precipitation time series data for the selected stations in the study.
4.2. Annual and seasonal temperature trend analysis
The temperature trends on the seasonal and annual scale were investigated in this study over the major agro-climatic zones of Sindh and Punjab during the period 1990–2022 using the Mann–Kendall test and Sen's slope estimator method. The results obtained from the Mann–Kendall test (Z-value) and Sen's slope estimator method (°C/year) are shown in Table 4 and Figures 6–8.
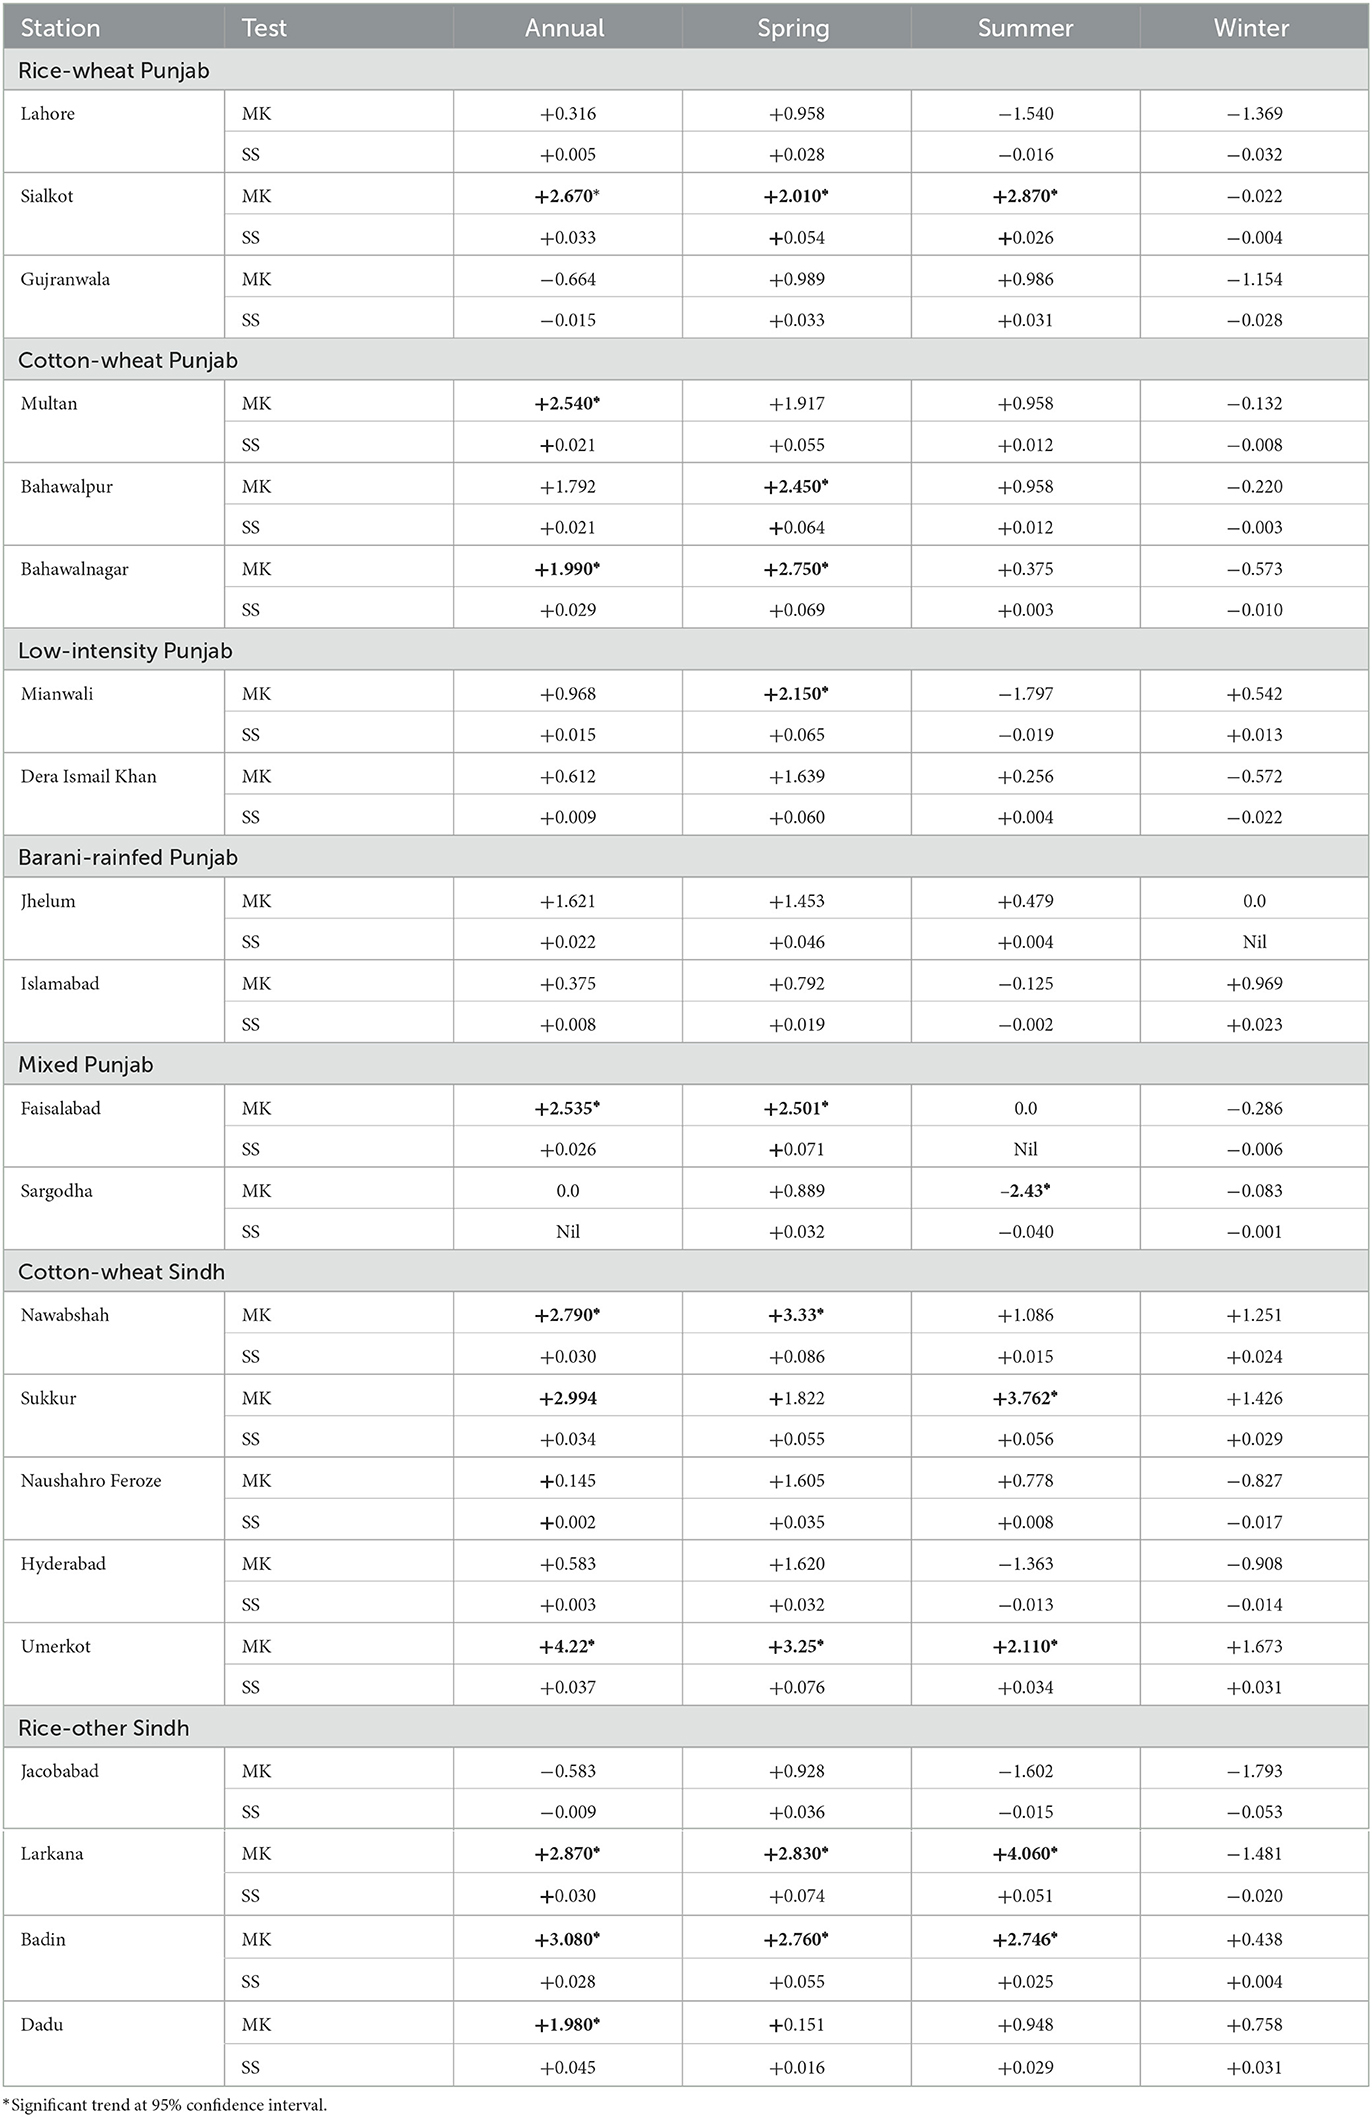
Table 4. Results of the Mann–Kendall test (MK) and Sen's slope estimator method (SS) for the annual and seasonal temperature trend analysis over the study area for the period 1990–2022.
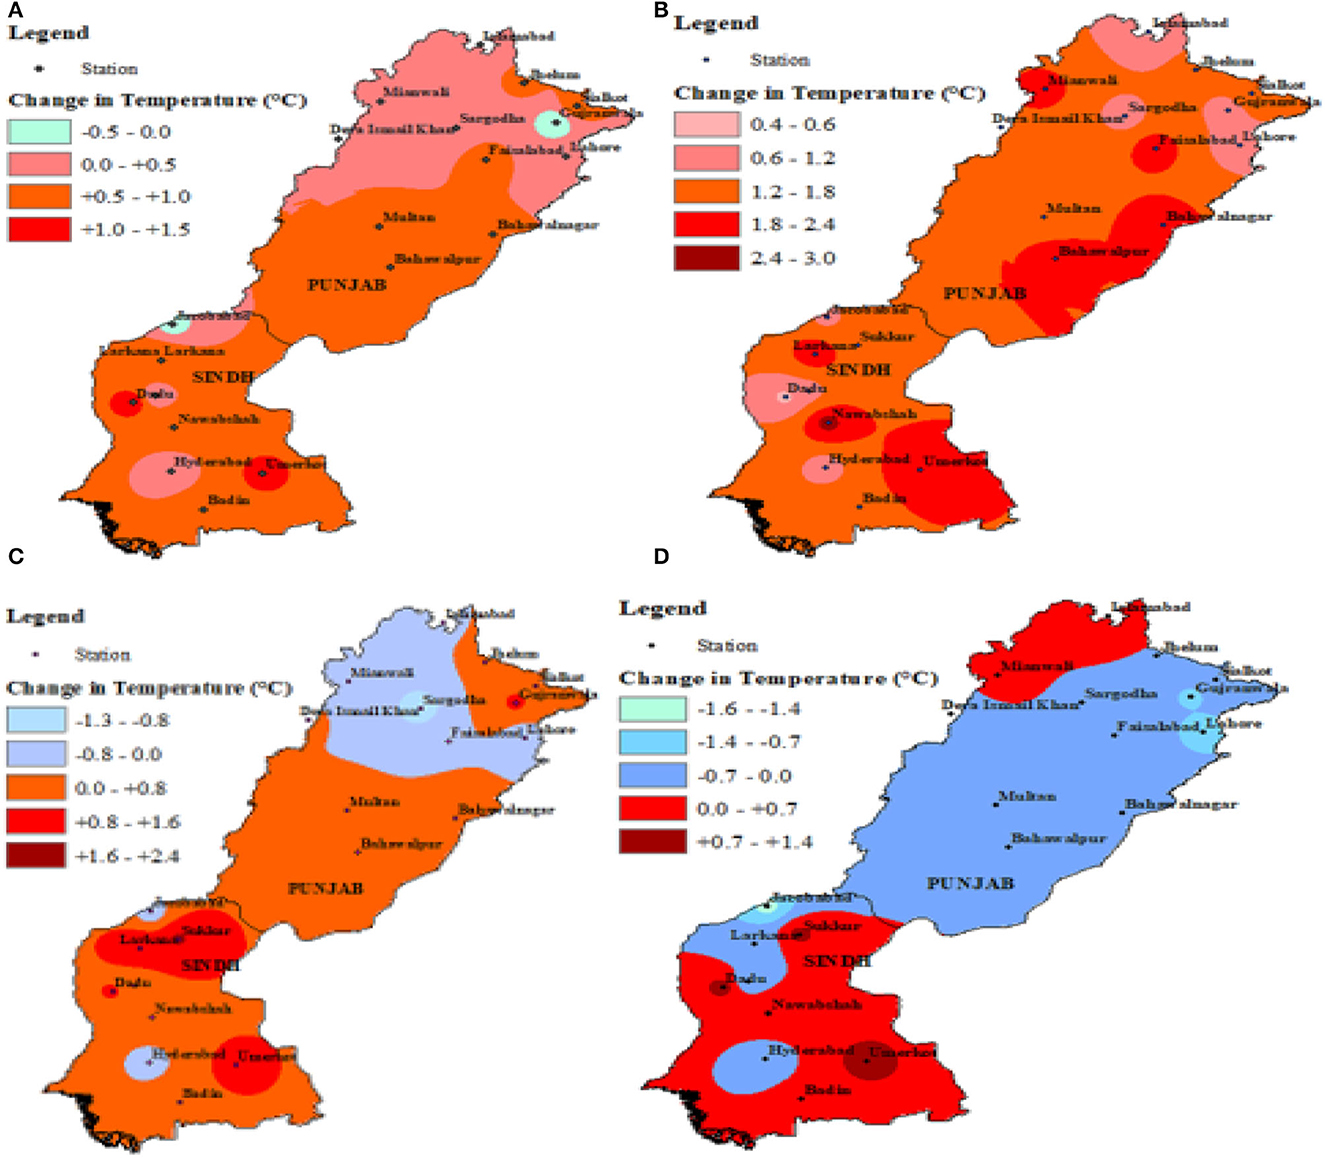
Figure 6. Magnitude of change in temperature for (A) annual, (B) spring, (C) summer, and (D) winter seasons for the period 1990–2022.
The results obtained from the analysis revealed a warming trend over the majority of selected stations in Sindh and Punjab on the annual as well as on the seasonal scale. On the annual scale, the mean annual temperature of Punjab rose by ~0.1 to 1.0°C, with ~0.6 to 0.9°C in cotton-wheat Punjab, 0.1 to 0.8°C in rice-wheat, low-intensity, and mixed Punjab, and ~0.2 to 0.6°C in Barani-rainfed Punjab during the study period, as shown in Figure 6A, where a statistically significant rising trend was found at the Sialkot, Multan, Bahawalnagar, and Faisalabad stations at 95% confidence interval with the Sen's slope as +0.033, +0.021, +0.029, and +0.026°C/year, respectively, as shown in Table 4 and Figure 7. In Sindh province, the mean annual temperature rose by ~0.1 to 1.4°C, with ~0.1 to 1.2°C in cotton-wheat Sindh and 0.8 to 1.4°C in rice-other Sindh, with a significant rising trend was found at the Nawabshah, Sukkur, Umerkot, Larkana, Badin, and Dadu stations at the rate of ~0.03, 0.034, 0.037, 0.03, 0.028, and 0.045°C/year, respectively, as shown in Figure 8.
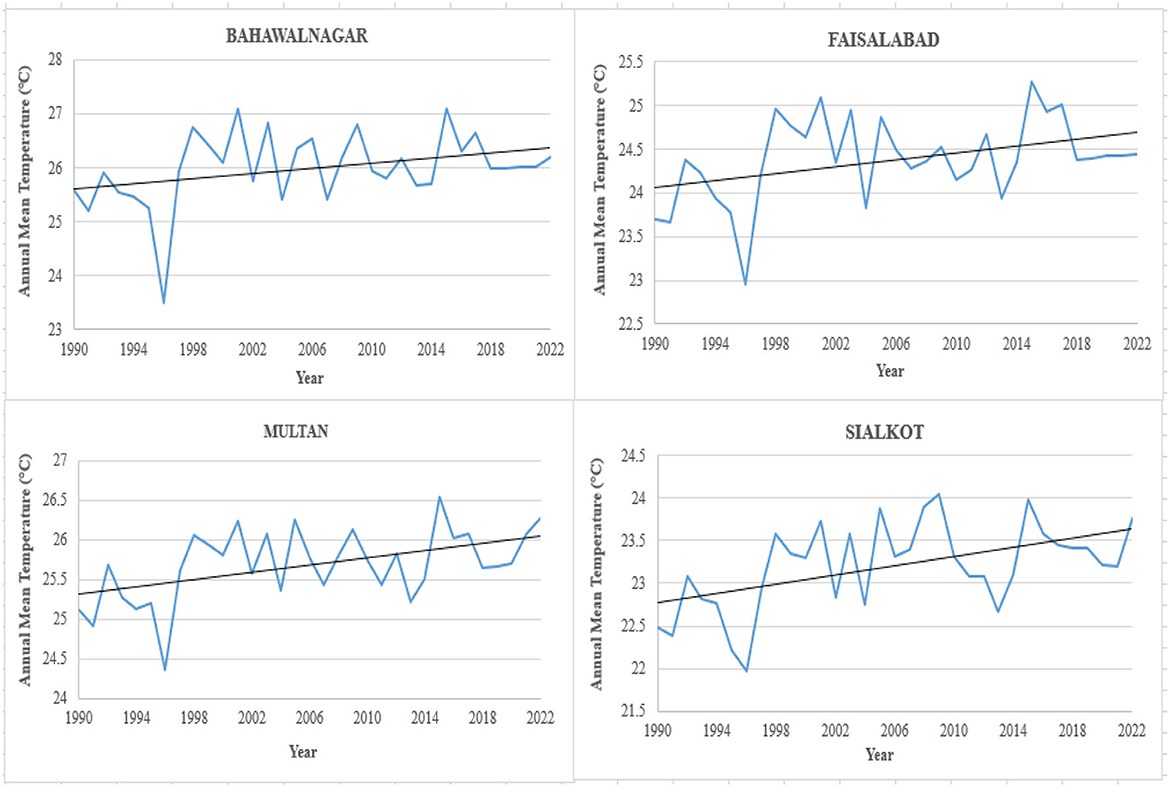
Figure 7. Climate stations in Punjab showing a significant rise in annual mean temperature (°C) at a 95% confidence interval during the study period (1990–2022).
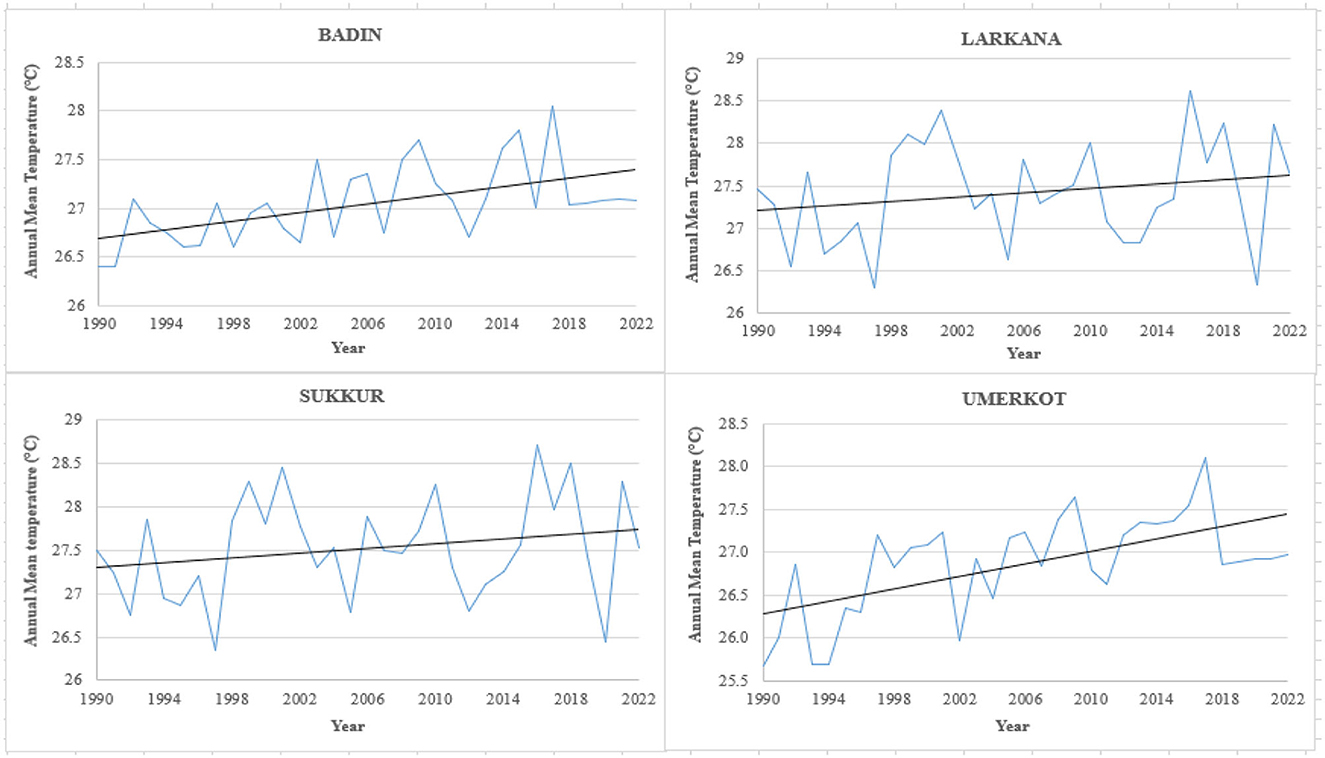
Figure 8. Climate stations in Sindh showing a significant rise in annual mean temperature (°C) at a 95% confidence interval during the study period (1990–2022).
Apart from the annual temperature, the seasonal temperatures also hold significant importance for the agricultural sector in terms of irrigation requirements, water consumption, and crop yield. For instance, the spring and summer seasonal temperatures strongly influence the crop water requirement and growth of kharif crops, while the winter seasonal temperatures strongly govern the production and water consumption by the rabi crops. In this study, a significant rising trend of spring seasonal temperature was found in Sindh and Punjab. In Punjab, the spring seasonal temperature rose by ~0.8 to 2.1°C, with ~0.84 to 1.6°C in rice-wheat Punjab, 0.6 to 1.2°C in Barani-rainfed Punjab, and 1.6 to 2.2°C in cotton-wheat, mixed, and low-intensity Punjab, as shown in Figure 6B, where a significant rising trend was found at the Sialkot, Bahawalpur, Bahawalnagar, Mianwali, and Faisalabad stations with the Sen's slope as +0.054, +0.064, +0.069, +0.065, and +0.071°C/year, respectively. On the other hand, in Sindh, the spring seasonal temperature rose by ~0.5 to 2.3°C, with ~1.0 to 2.5°C in cotton-wheat Sindh and 1.0 to 2.0°C in rice-other Sindh, where a significant rising trend was found at the Nawabshah, Umerkot, Larkana, and Badin stations with the Sen's slope as +0.086, +0.076, +0.074, and +0.055°C/year, respectively. For the summer season, the analysis showed that the seasonal temperature increased by ~0.3 to 1.7°C in Sindh, with ~0.7 to 1.6°C in rice-other Sindh and 0.3 to 1.0°C in cotton-wheat Sindh as shown in Figure 6C, where a significant rising trend was found at the Sukkur, Umerkot, Larkana, and Badin stations with the Sen's slope as +0.056, +0.034, +0.051, and +0.025°C/year, respectively. In Punjab, the summer seasonal temperature increased by ~0.1 to 0.4°C in cotton-wheat Punjab, 0.7 to 0.9°C in rice-wheat Punjab, while a declining trend was found in Barani-rainfed, low-intensity, and mixed Punjab, where a significant downward trend was found at the Sargodha station at 95% confidence interval with the Sen's slope as −0.04°C/year. For the winter season, the mean temperature rose by ~0.7 to 1.0°C in cotton-wheat Sindh, while a mixed trend was found in rice-other Sindh as shown in Figure 6D. In Punjab, an overall declining trend of winter seasonal temperature was found.
Conclusively, it was found that the annual and seasonal temperatures have significantly increased in Sindh and Punjab during the past decades. Based on the analysis, the warming winter seasonal temperatures may affect the irrigation requirements, growth, and per hectare yield of rabi crops, as the late arrival and early departure of the winter season may reduce the length of the rabi growing season, causing the early completion of the crop growth cycle and resulting in reduced production as the crop will gain early maturity without attaining the proper size and height. On the other hand, the soaring spring and summer seasonal temperatures may adversely affect the production of kharif crops in terms of increased irrigation requirements and freshwater withdrawals, high soil temperatures and soil moisture deficiency, crop water stress conditions, and wilting of crops, consequently leading to reduced crop yields and threatening the overall state of food and water security in the country.
4.3. Annual and seasonal precipitation trend analysis
Along with temperature, the annual and seasonal rainfall patterns were also investigated in this study over the major agro-climatic zones of Sindh and Punjab using the Mann–Kendall test and Sen's slope estimator method for the period 1990–2022. The results obtained from the analysis are shown in Table 5 and Figure 9.
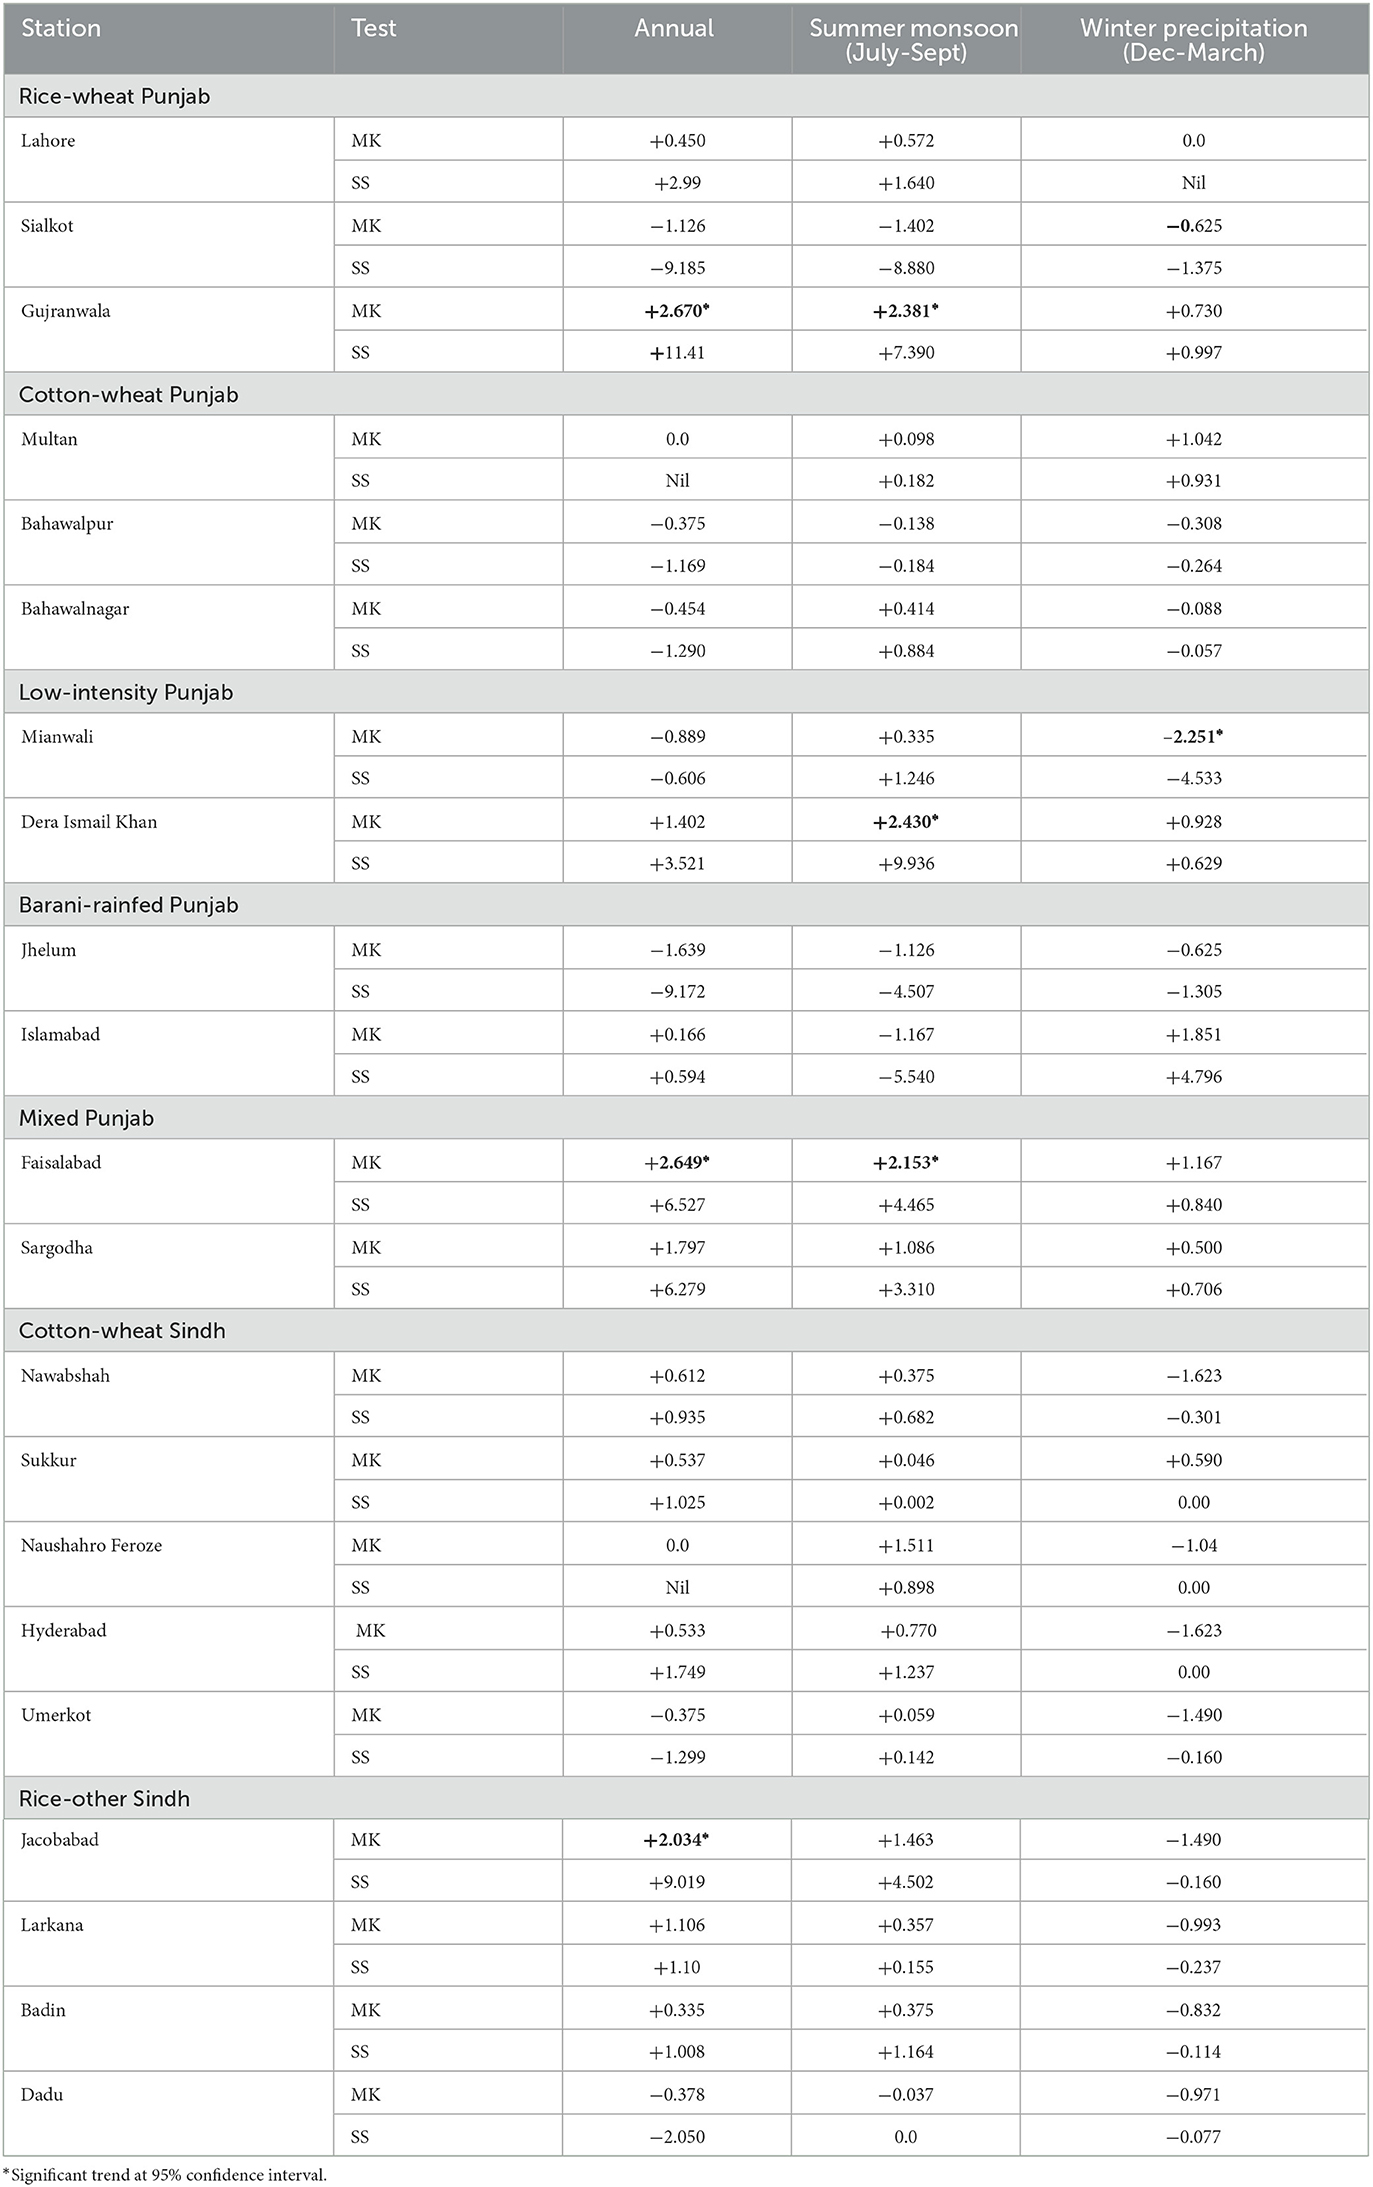
Table 5. Summary of the Mann–Kendall test (MK) and Sen's slope estimator method (SS) for the annual and seasonal precipitation trend analysis over the study area for the period 1990–2022.
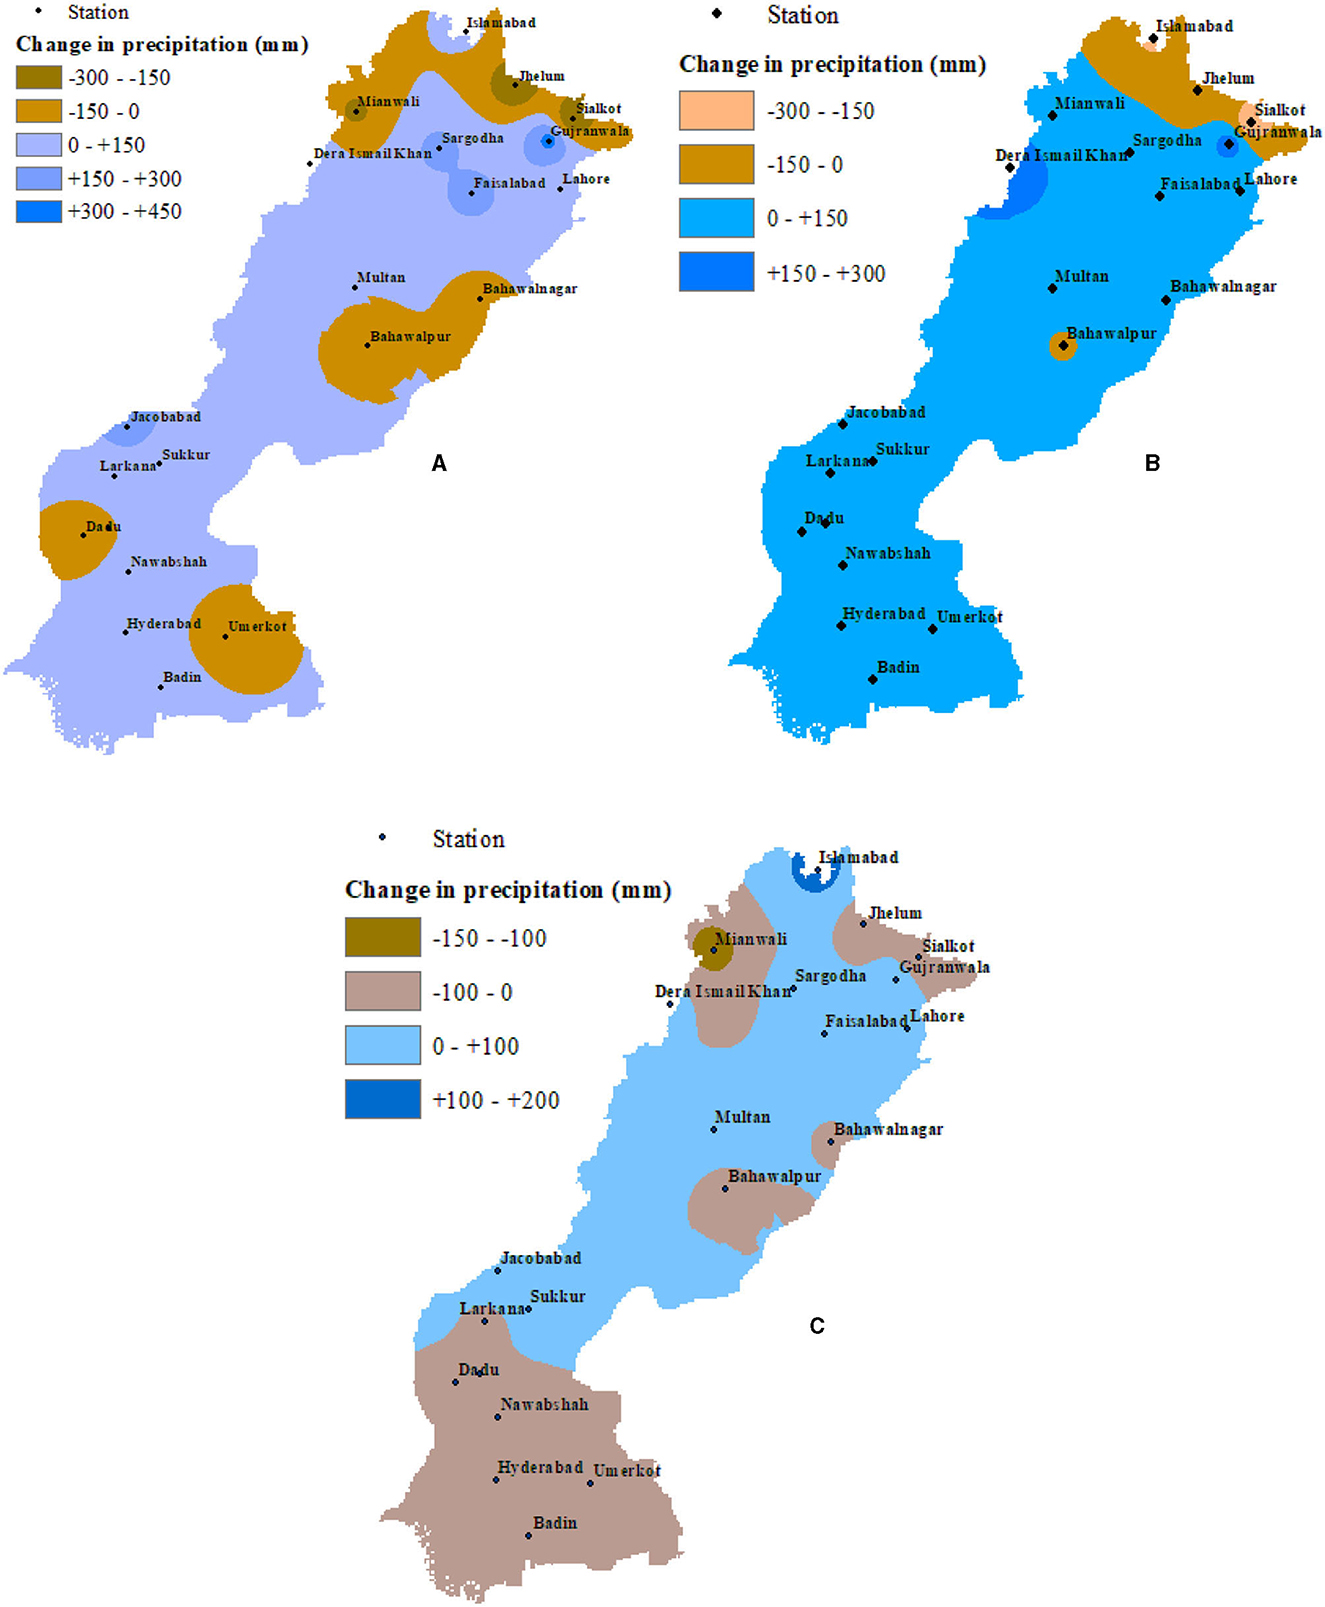
Figure 9. Magnitude of change in precipitation for (A) annual, (B) summer monsoon, and (C) winter during the period 1990–2022.
The results obtained from the analysis showed that on the annual scale, an increasing trend of precipitation was found in cotton-wheat and rice-other Sindh during the study period, where the annual precipitation increased by ~30 to 60 mm in cotton-wheat Sindh, as shown in Figure 9A. In rice-other Sindh, the highest rainfall increment was found at the Jacobabad station, with the Sen's slope as +9.019 mm/year, as shown in Table 5. In Punjab, an increasing trend of annual rainfall was found in rice-wheat and mixed Punjab, where the rainfall increased by ~100 to 350 mm during the study period, with a significant increasing trend found at Gujranwala (+11.41 mm/year) and Faisalabad stations (+6.52 mm/year). On the contrary, a downward rainfall trend was detected in cotton-wheat Punjab, where the annual precipitation declined by ~40 mm, while mixed trends were found in rainfed and low-intensity Punjab.
For the monsoon precipitation, an increasing trend was found at all selected stations in Sindh province, where the rainfall rose by ~50 to 150 mm, as shown in Figure 9B, with the highest increment noted at the Jacobabad station, where the rainfall increased at the rate of ~4.5 mm/year. In Punjab, an upward trend of monsoon precipitation was found in rice-wheat, cotton-wheat, low-intensity, and mixed Punjab, where the rainfall increased by ~50 to 200 mm in rice-wheat Punjab, and by ~30 mm in cotton-wheat Punjab, with a significant rising trend was found at Gujranwala (+7.39 mm/year), Dera Ismail Khan (+9.93 mm/year), and Faisalabad (+4.46 mm/year). However, in Barani-rainfed Punjab, a declining trend of monsoon precipitation was found. For the winter precipitation, a downward trend was found in cotton-wheat and rice-other Sindh as shown in Figure 9C. Similarly, in cotton-wheat, rice-wheat, low-intensity, and Barani-rainfed Punjab, a declining trend of winter precipitation was found, where at the Mianwali station, the winter precipitation dropped at the rate of ~4.53 mm/year. Contrarily, in mixed Punjab, an upward trend of winter precipitation was found.
In a nutshell, an overall increasing trend of rainfall was noted in Sindh and Punjab during the analysis as shown in Figure 10. Seasonally, the monsoon precipitation was found to be increasing over Sindh, southern and central parts of Punjab, while in rainfed Punjab, a declining trend was found. For winter precipitation, a negative trend was found in Sindh, whereas an upward trend was found in mixed Punjab, while the remaining stations in Punjab showed a downward pattern. The declining trend of winter precipitation in Sindh and southern and northern Punjab may result in increased irrigation withdrawals for rabi crop production. On the other hand, the rising monsoon rainfall trends in Sindh and southern and central parts of Punjab may favor the kharif crop production, in case the rainfall-generated excess runoff is well-managed and utilized efficiently. Contrarily, the increasing monsoon precipitation coupled with poor drainage infrastructure across the country may result in increased rainfall-runoff inundation, rising water tables, increased water logging, and soil salinity, thereby threatening the crop production and state of food security in the country.
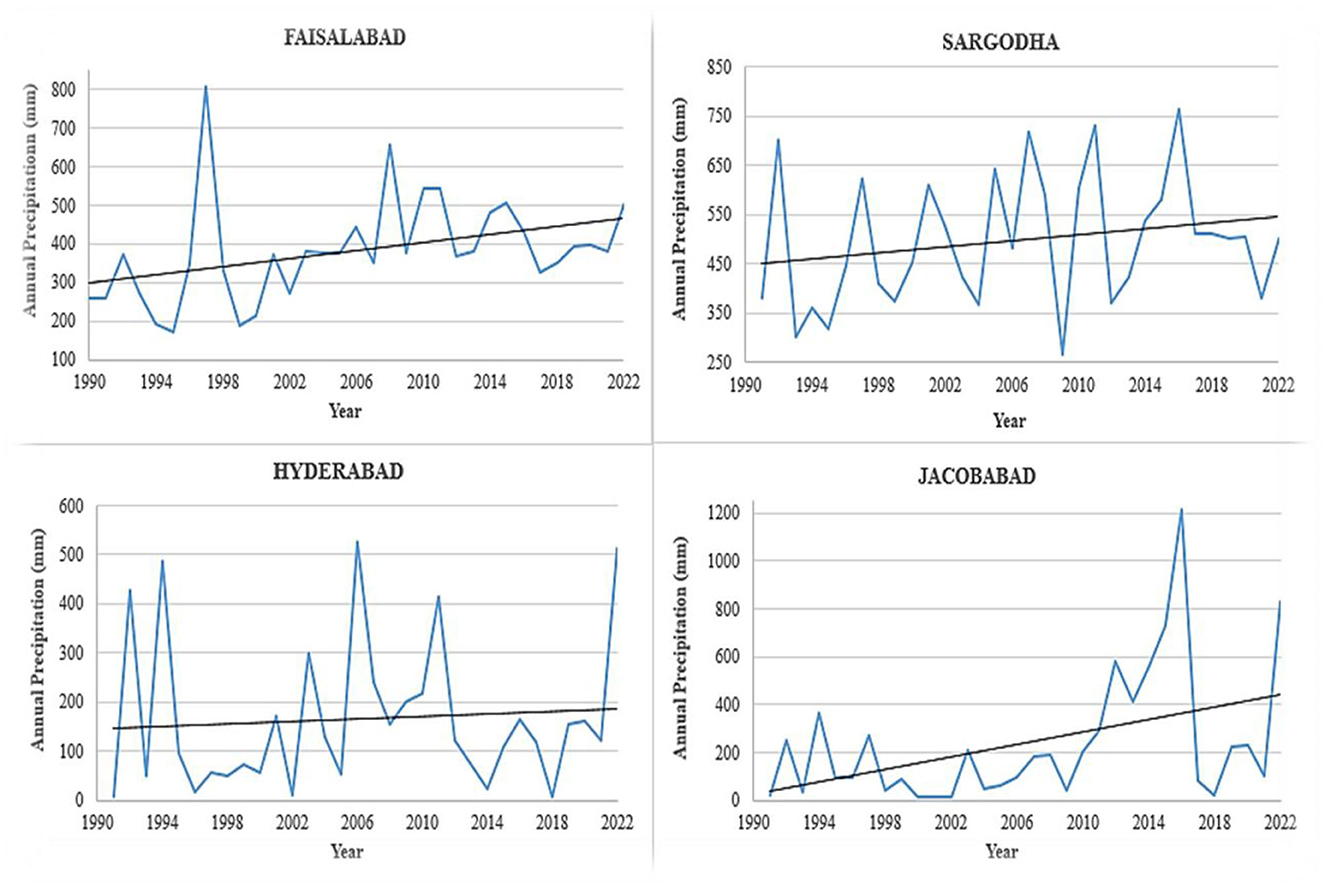
Figure 10. Climate stations in Sindh and Punjab showing a significant rise in annual precipitation (mm) at a 95% confidence interval during the study period (1990–2022).
4.4. Potential impact and study significance
This study briefly investigated the varying climate patterns over the major agro-climatic zones of Sindh and Punjab, which have rich growing fields of important food, cash, and horticultural crops of the country and serve as a significant source of livelihood for the local farmers. The study outcomes may help policymakers formulate an effective climate change adaptation and mitigation strategy for the country.
4.5. Future directions
This study briefly investigated the past climate trends over the important agricultural zones of the country. However, the assessment of future possible climate trends using the global or regional circulation models can be conducted to assess the future possible climate variations over the major agro-climatic zones of Pakistan, which may help to conserve the available freshwater resources and ensure food and water security in the country.
5. Conclusion and recommendations
Based on the results obtained from the study, the following conclusions were reached:
1. Different studies conducted in the past have highlighted noticeable climatic changes in Pakistan that may potentially threaten the national water security, human health, economy, and agriculture.
2. As per the analysis, warming has significantly increased in Sindh and Punjab during the past decades, with the temperature rise found to be higher in Sindh than in Punjab. In Sindh, the mean annual temperature rose by ~0.1 to 1.4°C, whereas in Punjab, warming increased by ~0.1 to 1.0°C. Seasonally, soaring temperature patterns were found to be more inclined toward the spring season over the study area. During the summer season, the mean temperature increased by ~0.3 to 1.6°C in Sindh, while in cotton-wheat and rice-wheat Punjab, the seasonal temperature increased by ~0.1 to 0.9°C. During the winter season, an increasing temperature trend was found in Sindh, whereas in Punjab, an overall declining temperature trend was found.
3. For precipitation, an overall increasing trend of annual rainfall was found in Sindh, rice-wheat, and mixed Punjab, while a declining trend was observed in low-intensity, cotton-wheat, and Barani Punjab. For the monsoon precipitation, an increasing trend was found in Sindh, cotton-wheat, rice-wheat, low-intensity, and mixed Punjab, while a declining pattern was found in rainfed Punjab. For winter precipitation, a negative trend was noted at all stations, except the mixed Punjab.
4. In the author's opinion, the changing climate patterns as found in the study call for the formulation and implementation of a well-integrated climate change adaptation and mitigation policy for the country at the earliest, to protect the agriculture sector and the freshwater resources of the country from the adversities of changing climate patterns.
Data availability statement
The original contributions presented in the study are included in the article/supplementary material, further inquiries can be directed to the corresponding authors.
Author contributions
HQ: writing—original draft preparation. SS: conceptualization. FT: writing—review and editing. All authors contributed to the article and approved the submitted version.
Acknowledgments
The authors would like to extend their gratitude to the Pakistan Meteorological Department for supplying the climate data required for this study.
Conflict of interest
The authors declare that the research was conducted in the absence of any commercial or financial relationships that could be construed as a potential conflict of interest.
The reviewer NK declared a shared affiliation with the author SS to the handling editor at the time of the review.
Publisher's note
All claims expressed in this article are solely those of the authors and do not necessarily represent those of their affiliated organizations, or those of the publisher, the editors and the reviewers. Any product that may be evaluated in this article, or claim that may be made by its manufacturer, is not guaranteed or endorsed by the publisher.
References
Abdullah, A. Y. M., Bhuian, M. H., Kiselev, G., Dewan, A., and Hassan, Q. K. (2022). Extreme temperature and rainfall events in Bangladesh: a comparison between coastal and inland areas. Int. J. Climatol. 42, 3253–3273. doi: 10.1002/joc.6911
Adler, R. F., Gu, G., Sapiano, M., Wang, J.-J., and Huffman, G. J. (2017). Global precipitation: Means, variations and trends during the satellite era (1979–2014). Surv. Geophys. 38, 679–699. doi: 10.1007/s10712-017-9416-4
Agarwal, S., Suchithra, A., and Singh, S. P. (2021). Analysis and interpretation of rainfall trend using mann-kendall's and sen's slope method. Indian J. Ecol. 48, 453–457. Available online at: https://indianecologicalsociety.com/wp-content/themes/ecology/fullpdfs/1619663981.pdf
Ahmad, I., Tang, D., Wang, T., Wang, M., and Wagan, B. (2015). Precipitation trends over time using Mann-Kendall and spearman's rho tests in swat river basin, Pakistan. Adv. Meteorol. 2015, 431860. doi: 10.1155/2015/431860
Alashan, S. (2020). Combination of modified Mann-Kendall method and Sen innovative trend analysis. Eng. Rep. 2, e12131. doi: 10.1002/eng2.12131
Almazroui, M. (2020). Rainfall trends and extremes in Saudi Arabia in recent decades. Atmosphere 11, 964. doi: 10.3390/atmos11090964
Arshad, A., Zhang, Z., Zhang, W., and Gujree, I. (2019). Long-term perspective changes in crop irrigation requirement caused by climate and agriculture land use changes in Rechna Doab, Pakistan. Water 11, 1567. doi: 10.3390/w11081567
Asian Development Bank, World Bank Group (2021). Climate Risk Country Profile: Pakistan. Asian Development Bank.
Aswad, F. K., Yousif, A. A., and Ibrahim, S. A. (2020). Trend analysis using Mann-Kendall and Sen's slope estimator test for annual and monthly rainfall for Sinjar district, Iraq. J. Duhok Univ. 23, 501–508. doi: 10.26682/csjuod.2020.23.2.41
Das, L. C., Islam, A. M., and Ghosh, S. (2022). Mann–Kendall trend detection for precipitation and temperature in Bangladesh. Int. J. Big Data Mining Glob. Warming 4, 2250001. doi: 10.1142/S2630534822500012
Duan, W., Zou, S., Christidis, N., Schaller, N., Chen, Y., Sahu, N., et al. (2022). Changes in temporal inequality of precipitation extremes over China due to anthropogenic forcings. NPJ Clim. Atmos. Sci. 5, 33. doi: 10.1038/s41612-022-00255-5
Duy, V. V., Ouillon, S., and Minh, H. N. (2022). Sea surface temperature trend analysis by Mann-Kendall test and sen's slope estimator: a study of the Hai Phong coastal area (Vietnam) for the period 1995-2020. Sci. Earth 44, 73–91. doi: 10.15625/2615-9783/16874
Frimpong, B. F., Koranteng, A., and Molkenthin, F. (2022). Analysis of temperature variability utilising Mann–Kendall and Sen's slope estimator tests in the Accra and Kumasi Metropolises in Ghana. Environ. Syst. Res. 11, 1–13. doi: 10.1186/s40068-022-00269-1
Gadedjisso-Tossou, A., Adjegan, K. I., and Kablan, A. K. M. (2021). Rainfall and temperature trend analysis by Mann–Kendall test and significance for Rainfed Cereal Yields in Northern Togo. Science 3, 17. doi: 10.3390/sci3010017
Gao, F., Wang, Y., Chen, X., and Yang, W. (2020). Trend analysis of rainfall time series in Shanxi Province, Northern China (1957–2019). Water 12, 2335. doi: 10.3390/w12092335
GCISC (2009). Mitigation and Climate Change Policy. Global Climate-Change Impact Studies Centre. Available online at: http://www.gcisc.org.pk/
Gennari, P., Rosero-Moncayo, J., and Tubiello, F. N. (2019). The FAO contribution to monitoring SDGs for food and agriculture. Nat. Plants 5, 1196–1197. doi: 10.1038/s41477-019-0564-z
Hadi, S. J., and Tombul, M. (2018). Long-term spatiotemporal trend analysis of precipitation and temperature over Turkey. Meteorol. Appl. 25, 445–455. doi: 10.1002/met.1712
Haider, S., and Ullah, K. (2020). Projected crop water requirement over agro-climatically diversified region of Pakistan. Agric. Forest Meteorol. 281, 107824. doi: 10.1016/j.agrformet.2019.107824
Huang, S.-C., Huang, W.-R., Wu, Y.-c., Yu, Y.-C., Chu, J.-L., and Jou, B. J.-D. (2022). Characteristics and causes of Taiwan's extreme rainfall in 2022 January and February. Weather Clim. Extr. 38, 100532. doi: 10.1016/j.wace.2022.100532
Ishaq, A., Khalid, M., and Ahmad, E. (2018). Food insecurity in Pakistan: A region-wise analysis of trends. PIDE Work. Papers 157, 1–26. Available online at: https://file.pide.org.pk/pdfpideresearch/wp-0157-food-insecurity-in-Pakistan-a-region-wise-analysis-of-trends.pdf
Jahangir, M., Ali, S. M., and Khalid, B. (2016). Annual minimum temperature variations in early 21st century in Punjab, Pakistan. J. Atmos. Solar Terres. Phys. 137, 1–9. doi: 10.1016/j.jastp.2015.10.022
Karmeshu, N. (2012). Trend detection in annual temperature & precipitation using the Mann Kendall test–a case study to assess climate change on select states in the Northeastern United States. Master's thesis submitted in partial fulfillment of requirements for Master of Environmental Studies, Department of Earth & Environmental Science, University of Pennsylvania.
Khahro, S. H., Talpur, M. A. H., Bhellar, M. G., Das, G., and Shaikh, H. (2023). GIS-based sustainable accessibility mapping of urban parks: evidence from the second largest settlement of Sindh, Pakistan. Sustainability 15, 6228. doi: 10.3390/su15076228
Khan, A. J., Koch, M., and Tahir, A. A. (2020). Impacts of climate change on the water availability, seasonality and extremes in the Upper Indus Basin (UIB). Sustainability 12, 1283. doi: 10.3390/su12041283
Latif, Y., Yaoming, M., and Yaseen, M. (2018). Spatial analysis of precipitation time series over the Upper Indus Basin. Theor. Appl. Climatol. 131, 761–775. doi: 10.1007/s00704-016-2007-3
Memon, S. A., Sheikh, I. A., Talpur, M. A., and Mangrio, M. A. (2021). Impact of deficit irrigation strategies on winter wheat in semi-arid climate of sindh. Agric. Water Manage. 243, 106389. doi: 10.1016/j.agwat.2020.106389
Merabtene, T., Siddique, M., and Shanableh, A. (2016). Assessment of seasonal and annual rainfall trends and variability in Sharjah City, UAE. Adv. Meteorol. 2016, 1–13. doi: 10.1155/2016/6206238
Mujtaba, A., Nabi, G., Masood, M., Iqbal, M., Asfahan, H. M., Sultan, M., et al. (2022). Impact of cropping pattern and climatic parameters in lower Chenab Canal system—Case study from Punjab Pakistan. Agriculture 12, 708. doi: 10.3390/agriculture12050708
Mullick, R. A., Nur, R. M., Alam, J., and Islam, K. M. A. (2019). Observed trends in temperature and rainfall in Bangladesh using pre-whitening approach. Global Planet. Change 172, 104–113. doi: 10.1016/j.gloplacha.2018.10.001
Nawaz, Z., Li, X., Chen, Y., Guo, Y., Wang, X., Nawaz, N., et al. (2019). Temporal and spatial characteristics of precipitation and temperature in Punjab, Pakistan. Water 11, 1916. doi: 10.3390/w11091916
Panda, A., and Sahu, N. (2019). Trend analysis of seasonal rainfall and temperature pattern in Kalahandi, Bolangir and Koraput districts of Odisha, India. Atmosp. Sci. Letters 20, e932. doi: 10.1002/asl.932
PCRWR (2018). Pakistan Council of Research in Water Resources Annual Report. Ministry of Water Resources. Available online at: https://pcrwr.gov.pk/
PMD (2022). Annual Climate Report. Pakistan Meteorological Department. Available online at: https://www.pmd.gov.pk/
Pohl, B., Sturman, A., Renwick, J., Quénol, H., Fauchereau, N., Lorrey, A., et al. (2023). Precipitation and temperature anomalies over Aotearoa New Zealand analysed by weather types and descriptors of atmospheric centres of action. Int. J. Climatol. 43, 331–353. doi: 10.1002/joc.7762
Pörtner, H. O., Roberts, D. C., Adams, H., Adler, C., Aldunce, P., Ali, E., et al. (2022). Climate Change 2022: Impacts, Adaptation and Vulnerability. Geneva: IPCC.
Qureshi, A. S. (2020). Groundwater governance in Pakistan: from colossal development to neglected management. Water 12, 3017. doi: 10.3390/w12113017
Rasul, G., Muhammad, A., Syed, A., and Khan, A. (2012). Climate Change in Pakistan: Focussed on Sindh Province. Sindh: Pakistan Metereological Department. Research and Development Division.
Raza, M., Hussain, D., Rasul, G., and Akbar, M. (2015). Variations of surface temperature and precipitation in Gilgit-Baltistan (GB), Pakistan from 1955 to 2010. J. Biodiversity Environ. Sci. 6, 67–73. Available online at: https://innspub.net/variations-of-surface-temperature-and-precipitation-in-gilgit-baltistan-gb-pakistan-from-1955-to-2010/
Sadiq, S., Saboor, A., Jamshaid, F., and Mohsin, A. Q. (2019). Assessment of farmers' vulnerability to climate change in agro-climatic zones of Pakistan: an index based approach. Sarhad J. Agric. 35, 734–740. doi: 10.17582/journal.sja/2019/35.3.734.740
Saini, A., Sahu, N., Kumar, P., Nayak, S., Duan, W., Avtar, R., et al. (2020). Advanced rainfall trend analysis of 117 years over West Coast Plain and Hill Agro-climatic region of India. Atmosphere 11, 1225. doi: 10.3390/atmos11111225
Salma, S., Rehman, S., and Shah, S. (2012). Rainfall trends in different climate zones of Pakistan. Pakistan J. Meteorol. 9, 17. Available online at: https://www.pmd.gov.pk/rnd/rnd_files/vol8_issue17/4.pdf
Talpur, M. A. H., Khahro, S. H., Ali, T. H., and Waseem, H. B. (2022). Computing travel impendences using trip generation regression model: A phenomenon of travel decision-making process of rural households. Environ. Dev. Sust. 5, 1–24. doi: 10.1007/s10668-022-02288-5
Tariq, G., Sun, H., Ali, I., Pasha, A. A., Khan, M. S., Rahman, M. M., et al. (2022). Influence of green technology, green energy consumption, energy efficiency, trade, economic development and FDI on climate change in South Asia. Sci. Re. 12, 16376. doi: 10.1038/s41598-022-20432-z
Keywords: climate change, agro-meteorology, food security, Mann–Kendall test, Sen's slope method, SDG13
Citation: Qureshi HU, Shah SMH and Teo FY (2023) Trend assessment of changing climate patterns over the major agro-climatic zones of Sindh and Punjab. Front. Water 5:1194540. doi: 10.3389/frwa.2023.1194540
Received: 27 March 2023; Accepted: 28 August 2023;
Published: 22 September 2023.
Edited by:
Yurui Fan, Brunel University London, United KingdomReviewed by:
Mir Aftab Hussain Talpur, Mehran University of Engineering and Technology, PakistanNur Farahah Mohd Khairuddin, King Fahd University of Petroleum and Minerals, Saudi Arabia
Mohammad Shamim, ICAR-Indian Institute of Farming Systems Research, Modipuram, India
Copyright © 2023 Qureshi, Shah and Teo. This is an open-access article distributed under the terms of the Creative Commons Attribution License (CC BY). The use, distribution or reproduction in other forums is permitted, provided the original author(s) and the copyright owner(s) are credited and that the original publication in this journal is cited, in accordance with accepted academic practice. No use, distribution or reproduction is permitted which does not comply with these terms.
*Correspondence: Syed Muzzamil Hussain Shah, c3llZC5zaGFoQGtmdXBtLmVkdS5zYQ==; Fang Yenn Teo, ZmFuZ3llbm4udGVvQG5vdHRpbmdoYW0uZWR1Lm15