- 1Integrated Water Resource Management Centre, Department of Geology, School of Mines, University of Zambia, Lusaka, Zambia
- 2Southern African Science Service Centre for Climate Change and Adaptive Land Management, National Remote Sensing Centre, Lusaka, Zambia
- 3WWF Zambia Country Office, Lusaka, Zambia
Benthic invertebrates communities are frequently used as indicators of aquatic ecosystem health since many species are sensitive to pollution and abrupt changes in their environment. Limited knowledge exists on the interlinkages of hydrological dynamics, water quality and the ecological character of groundwater-dependant ecosystems especially in developing countries. In this study we assessed the sensitivity of benthic macroinvertebrates to water quality dynamics in the Barotse Floodplain, a groundwater-dependant wetland. Benthic invertebrates were sampled in the dry season using the kick-net method at selected points upstream, mid-stream and downstream. The selection of sampled points was based on an initially conducted water quality survey that characterized the wetland into mainly two water types, NaHCO3 (upstream) and CaMgHCO3 (downstream). Canonical Correspondence Analysis (CCA) was used to investigate the influence of water quality on macroinvertebrate subclass-taxa level. Furthermore, factor analysis was used to derive the processes propagating the observed water quality variability. It was established that the composition and diversity of macroinverbrate communities at subclass-taxa level was influenced by effects of the wetland flood pulse, salinity (mineralisation) from groundwater input and biogeochemical processes during the expansion and contraction of the floodplain-river exchange. This study has demonstrated that biomonitoring was effective in capturing the natural processes/regimes of the environmental (such as flooding) and thus has potential to be used for mointoring extreme effects of phenomenon such as climate change. It is recommended that, the families, genus and species taxonomic levels are needed to improve the understanding of responses of the subclass-taxa level and the detection of specific contamination signatures, to ensure wetland conservation and protection. Integrated water resources management for wetlands thus should incorporate biomonitoring conjuctively with traditional methods to ensure vital ecosystems are not compromised at the expense of maximizing the economic and social welfare of humanity.
1. Introduction
Long regarded as wastelands, wetlands are now recognized as important features in the landscape (Nikolić et al., 2009). Wetlands are among the most productive ecosystems in the world, compared to rain forests and coral reefs (Balwan and Kour, 2021). They fulfill a variety of roles in the landscape such as providing a habitat for a range of biodiversity, modulating flow and influencing water quality (Reid et al., 2005; Nikolić et al., 2009). These roles can be classified into provisioning, regulatory, cultural and supportive ecosystem services (Reid et al., 2005). Provisioning services include products obtained from the ecosystem such as food, water, timber, fiber or genetic resources (Layke et al., 2012). Regulatory services include air quality regulation, climate regulation, water purification, disease regulation, pest regulation, pollination and natural hazard regulation (Balasubramanian, 2019). Cultural services include benefits that people obtain from the ecosystem related to spiritual enrichment, recreation, ecotourism, formal and informal education, inspiration and cultural heritage (Hernández-Morcillo et al., 2013; Csurgó and Smith, 2021). Supportive services include basic ecosystem processes of nutrient cycling and primary productivity that may in turn lead to other services (Bello et al., 2010; Mace et al., 2012). Many of these services are directly connected to the presence and activity of specific organisms, microorganisms, or metazoa (especially macroinvertebrates). Although many scientific studies such as Bird and Day (2010), Sinchembe and Ellery (2010), Lehner et al. (2021), Winton et al. (2021), have highlighted the importance of wetland ecosystems, most wetlands worldwide have suffered from extensive exploitation in the past century. The world's wetlands are hanging onto a thinning lifeline, with only 13% (Gardner and Finlayson, 2018) of their former extent remaining. Worldwide, more than 50 % of wetland resources have been lost because of human activities in river floodplains, deltas and estuaries (Bobbink et al., 2006). Examples of human activities include agriculture due to fertile soils, construction of flood control structures, drainage for agriculture, excavation of peat for fuel and the modification and straightening of river channels for navigation (Bobbink et al., 2006). In some densely populated regions in developed countries, more than 80% of the wetlands have been lost or severely degraded. Wetlands in Africa probably conform to this picture but data on trends in African Wetland extent is limited (Davidson, 2014). These habitats are rarely monitored sufficiently due to a lack of utility of cost- efficient tools especially in poorly resourced countries (Simaika et al., 2021).
Several studies have demonstrated that biological methods are valuable in determining natural and anthropogenic influences on water resources and habitats as biota responds to stressors from multiple spatial or temporal scales (Weigel and Robertson, 2007; Kurthen et al., 2020; Tampo et al., 2021). Furthermore, the use of aquatic organisms in ecological studies has shown to be more effective than using environmental variables alone, because the aquatic community integrates structural and functional characteristics that reflects the health of the studied wetland (He et al., 2020; Tampo et al., 2020). Therefore, there is an increasing awareness of the application of ecological thresholds for natural resource management (Sundermann et al., 2015; White et al., 2021). Several metrics and biotic indices have been developed and used across the world (Lowe et al., 2013; He et al., 2020; White et al., 2021). Singh and Saxena (2018) argued that the use of biotic indices as a tool for river quality assessment was more useful in evaluating river health than the conventional national water quality assessment standard practices in many countries. Macroinvertebrate responses to the change in aquatic ecosystem condition are universally recognized, and their responses are used in indices to monitor freshwater ecosystem for integrity, aiding in decision-making in management (Lunde and Resh, 2012; Lowe et al., 2013; Tampo et al., 2021; White et al., 2021).
Despite the development and application of a variety of biotic indices, scores, and metrics based on macroinvertebrates for water quality and ecosystem health assessment in developed countries, the literature provides limited information on the biological assessment and monitoring of groundwater-dependent freshwater ecosystems. Ecosystems can be defined as groundwater-dependent when the whole or part of their water demand is supplied by groundwater and, in the absence of it, the ecosystem functions are impaired, leading to fundamental alterations of the structure of the ecosystem itself (Orellana et al., 2012). Groundwater organisms live in energy-limited habitats with comparably predictable environmental conditions. Thus, they may be very sensitive to anthropogenic impacts and environmental changes. This sensitivity would make them potential candidates as bioindicators that could provide decision-makers and groundwater managers with useful information on ecosystem status (Griebler et al., 2010), as an important cultural ecosystem service. In this study, we investigate a groundwater-dependent floodplain to establish the sensitivity of benthic macroinvertebrates to the water quality dynamics. Specifically, the study investigates the effectiveness and robustness of the use of macroinvertebrates in the Barotse Floodplain in monitoring and assessment of water quality. We hypothesized that the Barotse Floodplain hosts benthic macroinvertebrates communities which are sensitive not only to the water quality dynamics but the hydrological processes facilitating surface-groundwater interactions. The outcome of this work would be useful in supporting bio-assessment programmes of the wetland.
2. Materials and methods
2.1. The Barotse Floodplain and river system
The Barotse Floodplain is a wetland located between −13.97906 to −19.31646 o S and 22.05326 to 24.77531o E in Western Zambia, approximately 597 km west of Zambia's capital city, Lusaka. The floodplain is in the Barotse sub-catchment of the upper Zambezi River Basin (Figure 1). The Barotse Floodplain stretches more than 230 km from north to south. Its width extends to about 30 km though it reaches a width of 50 km in some areas during peak flooding with an inundation area of more than 770,000 hectares (Zimba et al., 2018). The actual size of the wetland is unknown but is estimated to be 1.2 million hectares (Chomba et al., 2021).
The Barotse Floodplain is hosted on flat plateau topography with an average slope of only 0.015 %. It is generally covered by the Kalahari sands. The elevation over the floodplain ranges from 1187 m above sea level in the north-eastern part, to 993 m above sea level in the southern part. The drainage pattern is a trellis with all major rivers which include the Luanginga, Lungwebungu and Kabompo (Figure 2), being the main tributaries of the Zambezi River. Due to the floodplain's gentle slope, the Zambezi River flows in the plain with numerous meanders (Figure 2). According to Deneut et al. (2014), the Barotse Floodplain has a long-term average inflow of 845 m3/s on the Zambezi at Lukulu (Figure 2) and midstream, the Luanginga contributes an average of 63 m3/s at Kalabo. The Zambezi River flows downstream to Senanga (Figure 2) averaging 1029 m3/s. Evaporation rates for the wetland are estimated at 1,578 mm/annum (Beilfuss, 2012) and percolation to groundwater is poorly constrained. The key factors affecting utilization of the wetland are the timing and extent of the annual flooding of the Zambezi River, and the timing and consistency of the rains. The Barotse Floodplain annually floods in the rainy season peaking in April and receding by July.
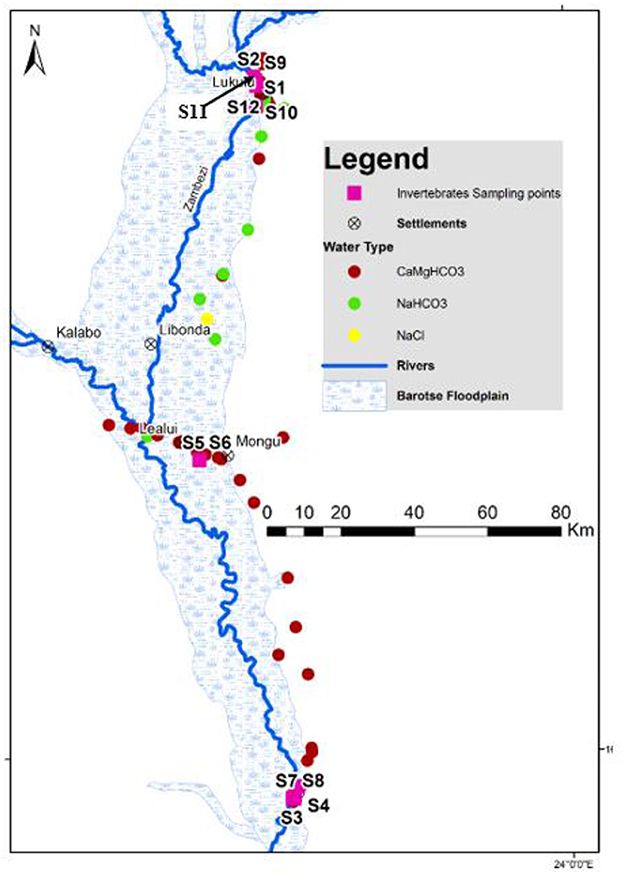
Figure 2. Spatial distribution of hydrochemical facies in the Barotse Floodplain of both surface and groundwater points in Western Zambia modified from Banda et al. (2023). Invertebrate sampling points are also shown.
2.2. Data collection and analytical procedures
2.2.1. Selection of sampling site
The selection of macroinverterbrate sampling site was based on previous water quality assessments by Nyambe et al. (2018) and Banda et al. (2023). Nyambe et al. (2018), which showed that the Barotse Floodplain had higher concentrations of total dissolved solids (TDS) in surface water between Lukulu and Mongu (upper reach) compared to Mongu to Senanga (lower reach). The distinct variation in TDS led to a sampling design that focused on the two reaches of the catchment. Banda et al. (2023) showed that the floodplain was a groundwater dependant ecosystem with the upper reaches receiving groundwater discharge, whereas, in the lower reaches, surface water was draining to the groundwater. Based on our hypothesis, macroinvertebrate sampling points were set up to cover the upper, middle and lower reaches of the floodplain as shown in Figure 2. A total of 12 sampling sites were thus selected purposively. The sites were not evenly distributed across the wetland because of safety issues attributed to hippos and the lack of appropriate suitable habitat sites for invertebrates. Sampling was done in the dry season in two phases; six stations were covered per phase. Phase one was done between 18 to 20 May, 2022 and phase two, 20 to 25 June, 2022. A sample per site was collected per site during the sampling. In the wet season, the main river channel (Zambezi) breaks banks during the wet season, which then floods most of the outlined floodplain region. The flood water alters habitats rendering invertebrate sampling during the wet season inefficient.
2.2.2. Macroinvertebrate collection and identification
Benthic macroinvertebrates were sampled using a Kick-net (square opening, 33 cm of diameter; mesh size, 320 μm) in lentic and lotic habitats. Samples were taken from both sides of the river- bank and combined into one composite sample following the protocol described by Lowe et al. (2013). Sampling was performed by placing the mesh against the current and removing the substrate upstream of the sleeve and kicking up the gravel on the bed of the river with the Kick-net. Collected samples were then placed on a white tray for sorting and screening of aquatic insects. Samples were then preserved in 10% formalin and transferred to the laboratory for species identification. Specimens were then identified at subclass-taxa level using a trinocular Stereomicroscope. The photographic guide to the aquatic macroinvertebrates of Zambia developed through the Southern African River Assessment Scheme (SAFRASS) Project (Lowe et al., 2013) was used to support the identification.
2.2.3. Ecological metrics
In this study, three categories of metrics were determined; taxonomic richness, tolerance measure and diversity indices (Tampo et al., 2021) were used. The selection of these metrics were based on their simplicity and reliability for assessing the water quality of the river as well as their suitability to detect anthropogenic disturbances as outlined by other studies (Agboola et al., 2019, 2020; Tampo et al., 2021). In this study, specifically, we used Shannon-Weiner Diversity Index (H), Zambia Invertebrate Scoring System (ZISS) and Simpson Diversity Index (D) to represent diversity, tolerance measure and taxonomic richness, respectively. The H was calculated using Equation 1:
Where:
H = Shannon-Weiner Diversity Index
s = Number of species
pi = Proportion of individuals of each species belonging to the ith species of the total number of individuals.
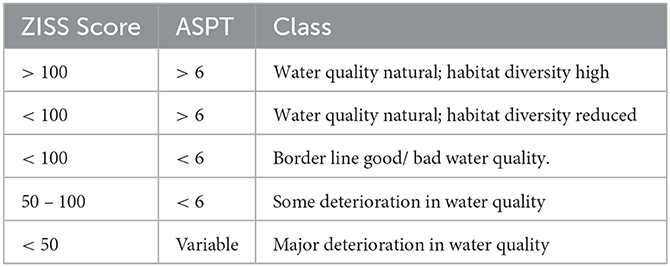
Zambia Invertebrate Scoring System (ZISS) is equivalent and adapted from the South African Sensitivity Score (SASS) as explained by Lowe et al. (2013). ZISS scores are used in combination with average score per taxon (ASPT) to derive the alteration to the aquatic environment (Table 1). ASPT is calculated as shown in Equation 2 (Lowe et al., 2013):
Where:
S = Total number of taxa in the sample
ni = Coded abundance in the ith scoring taxon
ai = Sensitivity score for the ith taxon (SASS scoring table), and
N = Total number of taxa contributing to the SASS score
Simpson's Diversity Index (D) is a measure of diversity which takes into account the number of species present, as well as the relative abundance of each species (Guajardo, 2015). As species richness and evenness increase, so diversity increases. It is calculated as shown in Equation 3.
Where:
D = Simpson's Diversity Index
n = the total number of organisms of a particular species
N = the total number of organisms of all species
The value of D ranges between 0 and 1. With this index, 1 represents infinite diversity and 0, no diversity. In this assessment, D was referenced to as Simpson's Richness (D).
2.2.4. Water quality analysis
At each site, water quality parameters such as temperature, pH, electrical conductivity (EC), dissolved oxygen (DO) and even for total dissolved solids (TDS) were measured insitu using the Wissenschaftliche Technische Werkstätten (WTW) water quality multimeter. Measurements were done once at each site After the in situ measurement, one 0.5 L of water per site was taken in a plastic bottle and stored in a refrigerator at 4°C for analysis of chemical parameters in the laboratory. Major and minor ions analysis was conducted at ITemba Lab in South Africa, using a titration method to determine Mg2+, and Cl−, Ultraviolet (UV)-spectrophotometric method for , , , and Flame Emission Spectrophotometer for K+ and Na+.
2.2.5. Statistical analysis
The canonical correspondence analysis (CCA) was applied to establish the relationship between water quality parameters and macroinvertebrate abundance; and to identify water quality parameters affecting the macroinvertebrate community. The analysis was performed with PAST software (Version 4.12, released December, 2022) with the dataset of water quality parameters and the abundance of macroinvertebrate community at the subclass-taxa level. Pearson's correlation analysis and factor analysis (FA) between macroinvertebrate data and water quality variables were used to assess the potential of macroinvertebrate taxa and metrics detected in this study to serve as bioindicators for the river's environmental condition investigated. The FA was performed using principal components as a factor extraction method and then rotated with a varimax. The factor loadings were considered for the explanation of correlations among variables and to explain underlying processes controlling the observed water quality. Pearson correlation and FA were computed using MINTAB (version 18.1) for Windows.
3. Results
3.1. Macroinvertebrate diversity
The macroinvertebrate abundance and diversity was expressed as taxonomic metrics as shown in Table 2. High Shannon-Weiner Diversity Index values were found upstream compared to the downstream, which meant there were more diverse species in the upstream habitats compared to the downstream. D has values between 0.4 and 0.7, which was interpreted as moderate to moderately high degree species heterogenity (Guajardo, 2015) from upstrean to downstream. Odonata, Mollusca, Decapoda, Hemiptera, Ephemeroptera and Coleoptera (Figure 3) are the most predominant across the sites.
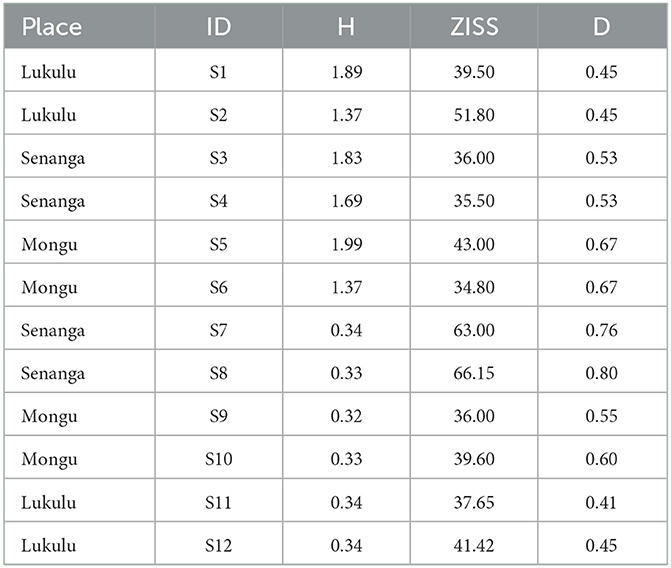
Table 2. Invertebrate taxonomic metrics results based on observations from sampled sites in the Barotse Floodplain.
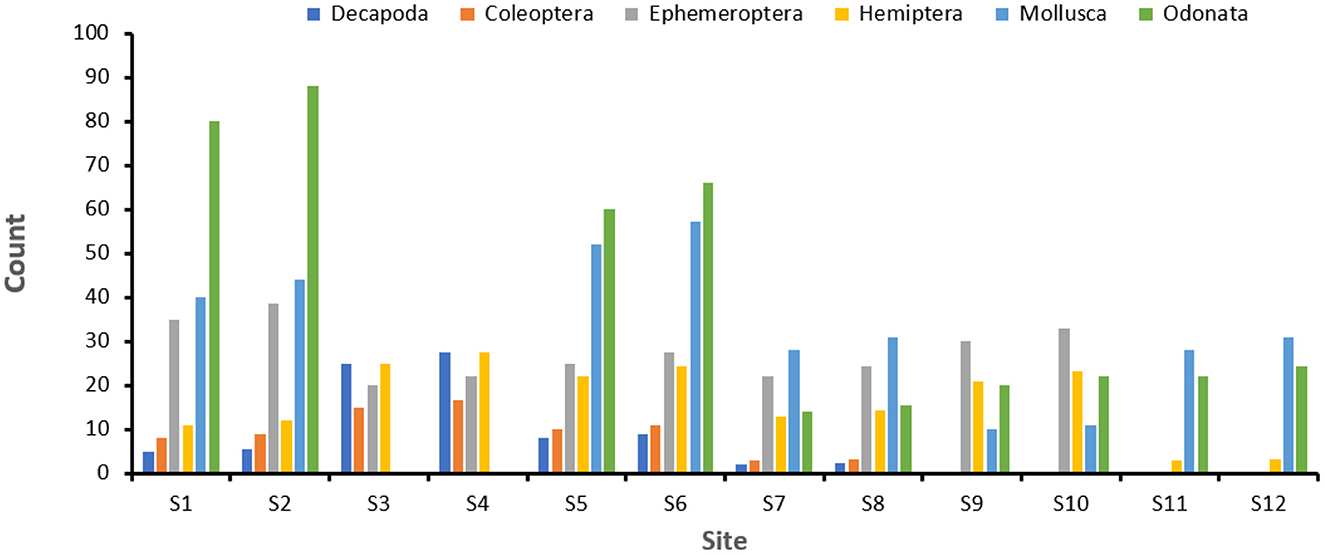
Figure 3. Abundance of predominate macroinvertebrates across the sampled site across the Barotse Floodplain.
3.2. Status of water quality
Descriptive summary statistics of the sampled points provide an overview of variations in water quality across the sampled points (Table 3). DO (dissolved oxygen) varies between 4.7 and 8.9 mg/L with a small standard deviation of 0.4. EC (electrical conductivity) varies between 47 and 200 μS/cm, with the standard deviation of 52 indicating relatively large variation of EC from upstream to downstream. pH ranged from 6.5 to 9.5 (neutral toward alkaline condition), with a mean value of 7.8. TDS (total dissolved solids) ranged from 53.9 to 82.5 mg/L with a mean value of 64.3 mg/L. The variation trends of most of major ions such as Ca2+, Mg2+, Na+, K+, are similar to EC and in the range of natural water quality. The concentration of Cl− and minor ions such as , , Fe, , and Mn2+ was below the detection limits and therefore have not been shown in Table 2.
Table 4 shows the correlation plot of water quality, macroinvertebrates and metrics from the Barotse Floodplains. The various macroinvertebrates were classified into sensitive, tolerant and resistant based on positive and significant correlation to water quality elements. Odonata; Ephemeroptera, and Arhynchobdellida were placed in the sensitive to water quality category. Odonata captures the highest variability in different water quality variables. Ephemeroptera, and Arhynchobdellida seem to be sensitive to mineralisation or salinity conditions. Several of the invertebrates can be classified as resistant as they respond to some of the water quality variables (one or two at most) and include: Coleoptera, Decapoda, Diptera, Hemiptera, Hydrophila, Tricoptera, Hirudinea. Mollusca can be classified as tolerant and does not show any significant response or relationship to the water quality variables. Furthermore, all the metrics (Shannon-Wenner diversity at subclass-taxa level (H), ZISS and D) show response to the water quality variability with H being the most sensitive of them.
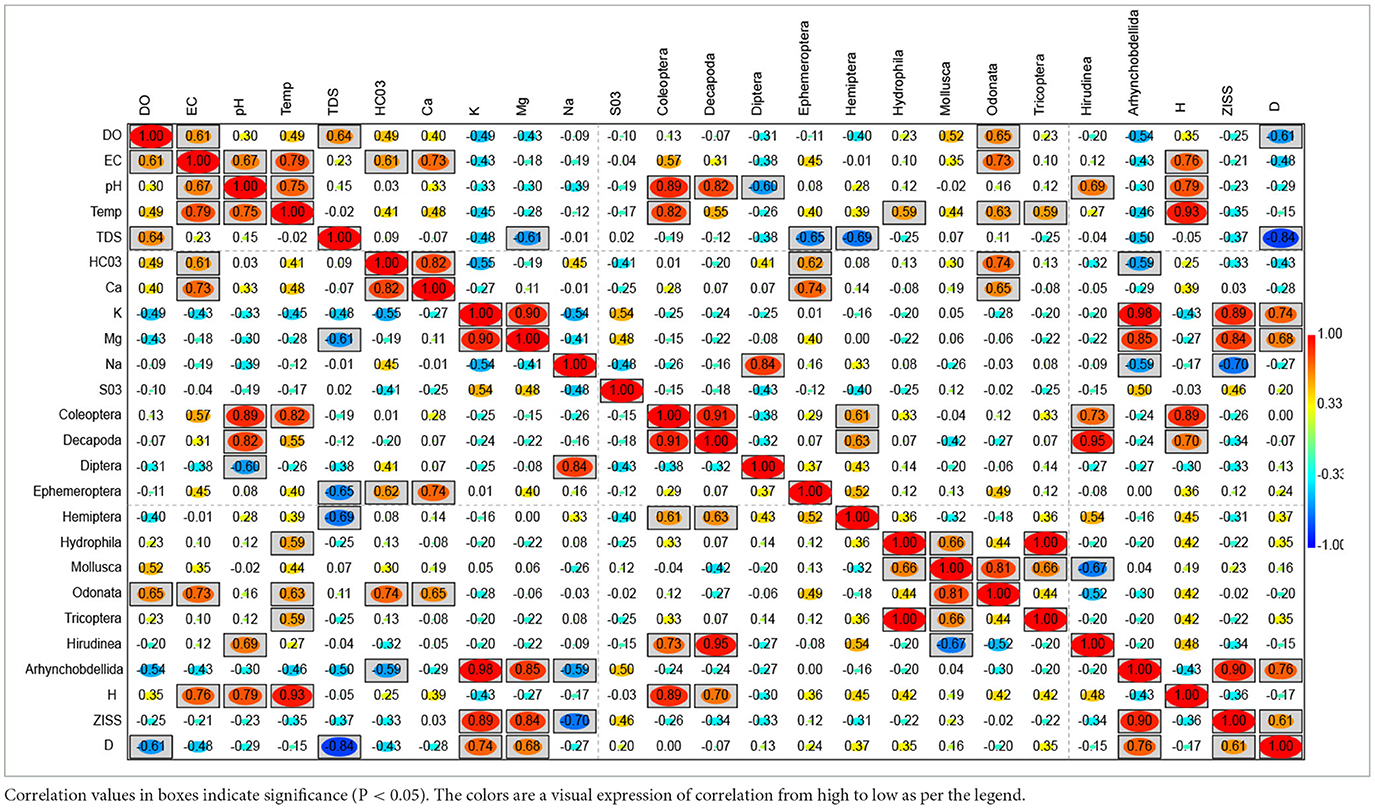
Table 4. Pearson correlation plot of water quality, macroinvertebrates and metrics from the Barotse Floodplains.
3.3. Influence of water quality on macroinvertebrate communities
CCA plots in Figures 3, 4, indicate the influence of water quality variables on metrics and macroinvertebrate communities, respectively. In Figure 4A, shows that temperature, pH, and EC are strongly correlated to the H with the DO and TDS showing weak association. The highest influence was from temperature followed by pH then EC. ZISS and D have similar properties owing to their position on the plot. D was strongly influenced negatively by TDS and DO, implying that with increased species diversity there was a reduction in TDS and DO. In Figure 4B, it can be observed that H was positively correlated to Ca2+ and HCO with a higher influence from the Ca2+. However, Mg2+, Na+, K+ were negatively correlated to H, with the largest deviation attributed to the K+. Figure 5A shows the response of macroinvertebrates to the physio-chemical elements (pH, EC, DO, TDS, and Temp). The majority of the macroinverbrates have a negative or no correlation with the water quality element except for Odonata (DO, TDS) and Coleopetra, Decapoda and Hirudinea influenced by pH, temp and EC. On the other hand, the majority of the chemicals seem to have a positive influence on the macroinvertebrates as shown in Figure 5B. Therefore, Mg2+ has a higher influence compared to K+ and Na+. Coleopetra, Decapoda and Hirudinea are sensitive to Ca2+.
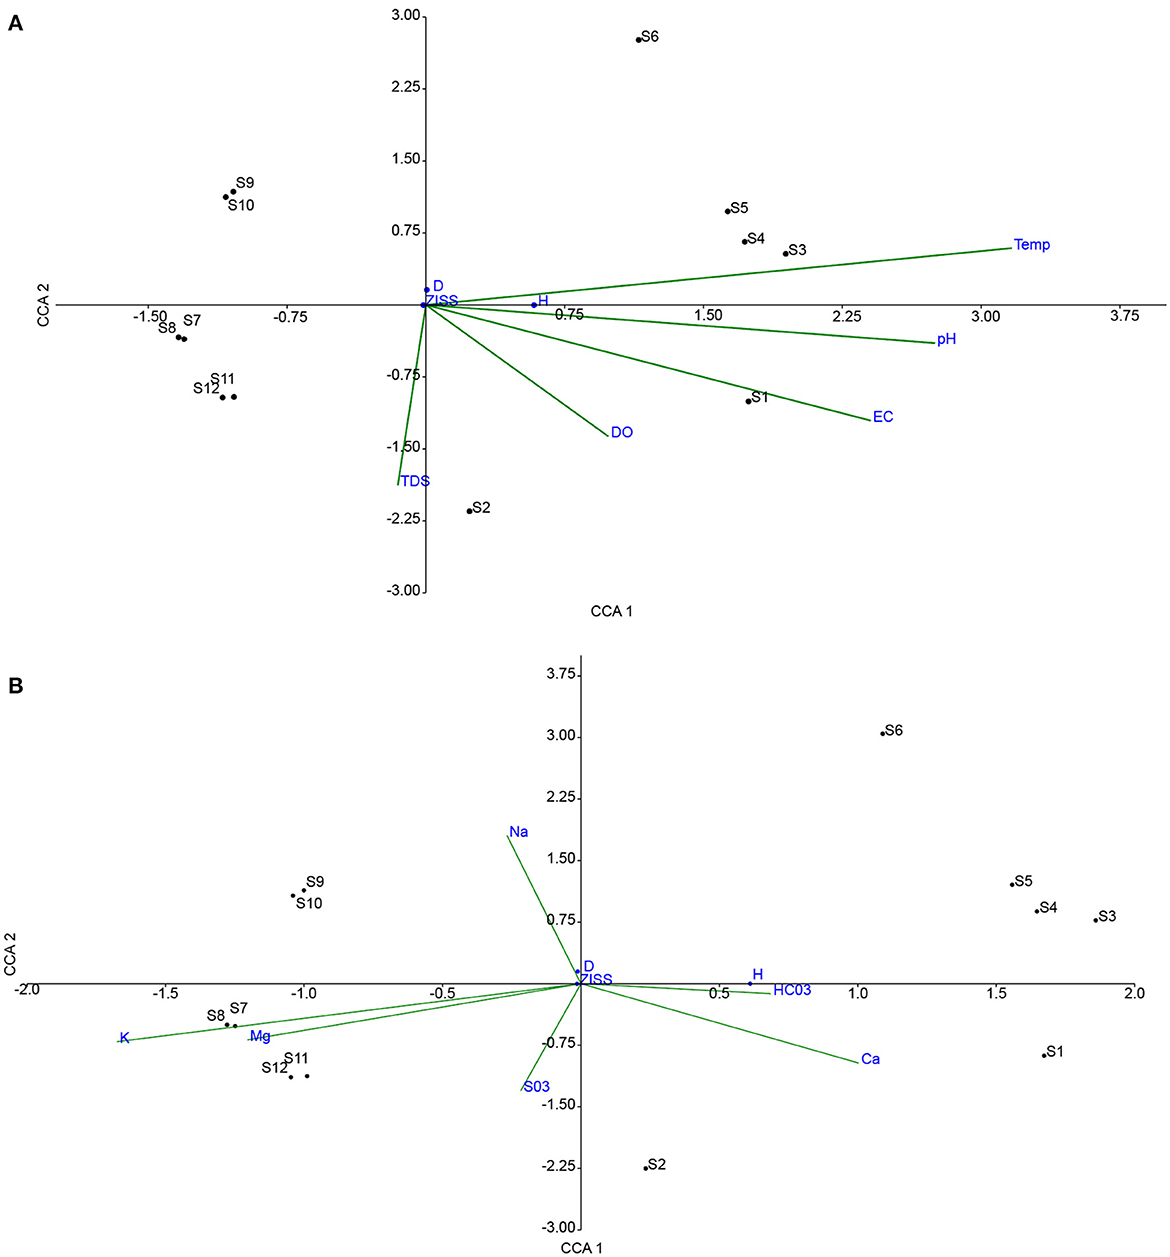
Figure 4. Shows a canonical correspondence analysis plot of ecological metrics and sampled points (S1-S12) against physiochemical variables (A) and chemical elements (B).
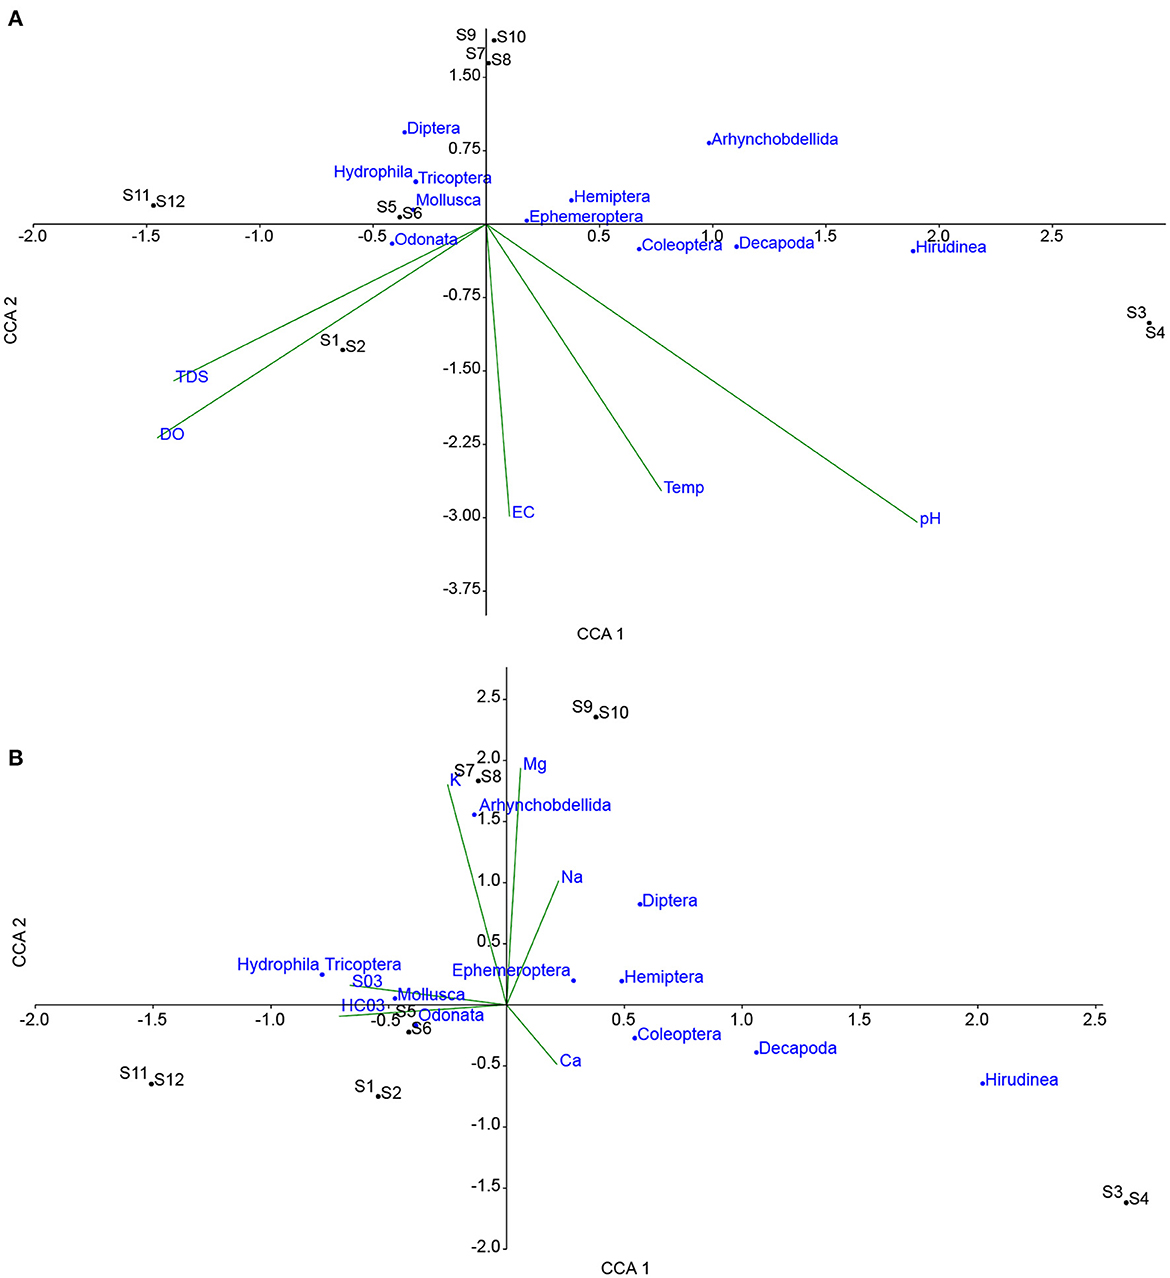
Figure 5. Shows a canonical correspondence analysis plot of macroinvertebrates and sampled points (S1-S12) against physiochemical variables (A) and chemical elements (B).
3.4. Water quality controls and processes
Factor analysis was used to investigate the underlying processes that influence the observed water quality influencing macroinvertebrate abundance and diversity. Four factors that explain 85% of the variability were extracted. Factor 1, accounted for 23% of the variability with a high factor loading from Ca2+, HCO and the EC. This was likely attributed to hydrological flow regimes (flooding) depositing large volumes of sediments into the floodplain from the upstream regions increasing turbidity and thus the chemical composition (predominantly Ca2+ and ). Factor 2, explained 22% of the variability, was likely attributed to salinity (mineralisation processes) because of the signifiant loading from K+, Mg2+, Na+, . Factor 3, explained 20% of the variability, with factor loading mainly attributed to pH, temperature and EC. This was likely related to dissolved organic matter fluxes as biogeochemical processes occurred during contraction and expansion of river-floodplain flow dynamics. Factor 4, has a high factor loading of DO and TDS attributed to peak flooding, when DO and turbidity accumulate.
4. Discussion
4.1. Benthic macroinvertebrate response to environmental variables
Based on the foregoing, the composition and structure of the macroinvertebrate communities are probably influenced by the flood pulse, salinity (mineralisation) from the groundwater input and biogeochemical processes during the expansion and contraction of the floodplain-river exchange. These processes have led to a composition of macroinvertebrates that include: Odonata, Mollusca, Ephemeroptera, Hemiptera, Decapoda, and Coleoptera (most adundant to least). CCA and FA showed that Odonata and Mollusca were influenced by TDS and DO, which was driven by the flood pulse and biogeochemical processes. Zuijdgeest et al. (2016) demonstrated that as the Barotse Floodplain undergoes hydrological expansion, that increases the oxygen, carbon dioxide and dissolved organic carbon loads as shown in Figure 6. This would increase the DO and pH that would stimulate an increase in dissolved solids. The dynamics of water quality evolve further during expansion and contraction as shown in Figure 6. Decapoda, Hemiptera, Ephemeroptera and Coleoptera were influenced by EC, temperature and pH as shown by the CCA plot in Figure 5A and the chemical analysis related to Factor 1 and 2 (Table 3). These macroinvertebrates are thus responding to salinity and the flood pulse dynamics. Salinity in this system was attributed to mineralisation due to water-rock interactions (Banda et al., 2019) in groundwater systeem which subsequently discharges to the surface water. Odonata such as some dragonflies leave just the tip of their abdomen exposed above the water surface and pump air into the internal gills hence adapting to alterations in water quality particularly, the reduction in dissolved oxygen (Thorp and Rogers, 2010). Similarly, Mollusca, Decapoda, Hemiptera, Ephemeroptera and Coleoptera have adapted their body structures to tolerate water quality, habitat and flow alterations (Asmamaw et al., 2021; Tampo et al., 2021). Several of the invertebrates can be classified as resistant as they responded only to some of the water quality variables (one or two at most) such as Coleoptera, Hemiptera and Decapoda. The authors postulate, subject to further investigation, that these invertebrates maybe responding to effects of biogeochemical processes driven by the organic matter input during expansion and contraction phases of the floodplain. This is in agreement with studies such as Mezgebu et al. (2019), who showed that Decapoda responds strongly to organic contamination.
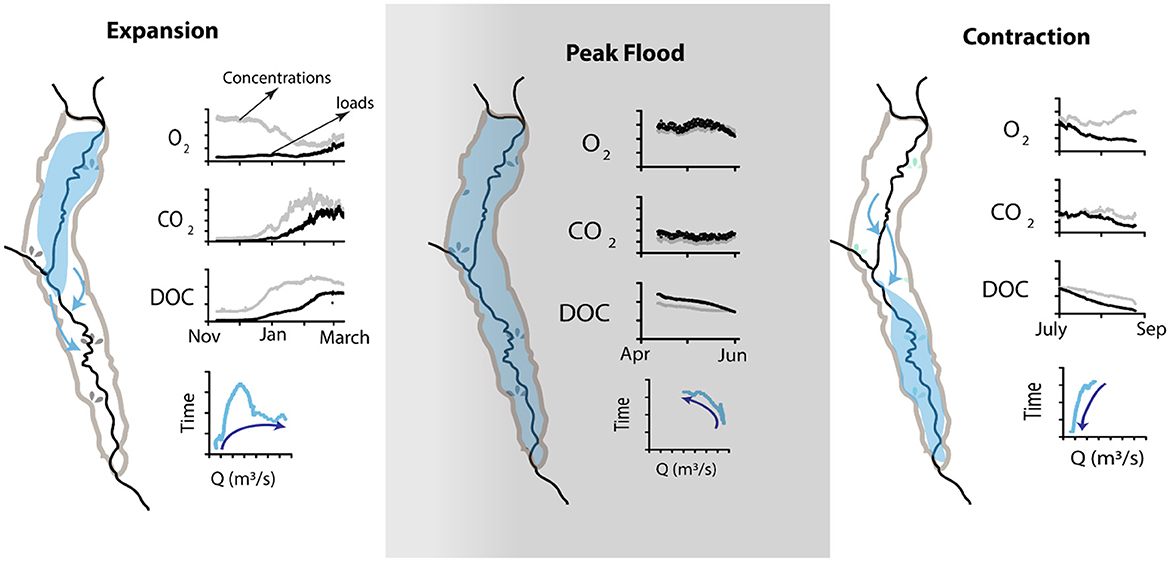
Figure 6. Conceptual summary of seasonal concentrations and loads of oxygen, carbon dioxide and dissolved organic carbon and the relationship to discharge (Q) [modified from Zuijdgeest et al. (2016)].
The observed macroinvertebrates community composition shows a unique distinct pattern in response to the complex hydrological exchange, water quality and biogeochemical processes at play in the Floodplain. Odonata, Mollusca, Ephemeroptera, Hemiptera, Decapoda, Coleoptera thus can be regarded as unqiue macroinvertebrate assemblage for this system. This is similar to a study by Wood et al. (1999) in the United Kingdom, who observed unique macroinvertebrates assembleges in groundwater-dependant water pools. However, some open questions still remain as to how much groundwater discharge was required to maintain the microinvertebrate assemblege, and the timing/frequency in which it would be required to sustain as an ecosystem. Such as evaluation would be critical, especially for the determination of environmental flow requirements of the Floodplain.
5. Conclusion and implications
This study has shown that the Barotse Floodplain has a unique assemblege of macroinvertebrates that includes: Odonata, Mollusca, Ephemeroptera, Hemiptera, Decapoda, Coleoptera. These macroinvertebrates communities are influenced by the effects of the flood pulse, salinity (mineralisation) from groundwater input and biogeochemical processes during the expansion and contraction of the floodplain-river exchange. This study demonstrated that biomonitoring was effective in capturing natural regimes of the environment (such as the flooding), thus has potential to be used for monitoring extreme effects of phenomena such as climate change. It is recommended that, the use of the families, genus and species taxonomic levels in bio-mointoring is needed to improve the understanding of responses on the subclass-taxa level and the detection of specific contamination signatures, to ensure wetland conservation and protection. Environmental flow assessments of the groundwater-dependant such as this one, thus should strive to establish the timing/frequency of groundwater discharge required to sustain the unique macroinvertebrate assemblege. ‘Blanket' management interventions such as no groundwater abstraction for commercial use may not be practical to implement.
Data availability statement
The original contributions presented in the study are included in the article/supplementary material, further inquiries can be directed to the corresponding author.
Ethics statement
This study was approved by the University of Zambia Natural and Applied Sciences Research Ethics Committee.
Author contributions
KB conceived the manuscript and wrote the paper with VN. VN, MM, IC, and KB collected and analyzed the data. IN corrected the English language. IN and MC supervised the study and contributed valuable comments to the manuscript. All authors contributed to the article and approved the submitted version.
Acknowledgments
The authors wish to thank GMES and Africa through the Wetland Mointoring and Assessment Project (WeMAST) for financial support of this work. WWF-Zambia also provided additional financial and logistical support. We thank Prof. Keith Mbata (taxonomic specialist), Mr. Allan Siamwenya, and Ms. Namakau Muyambana from the Department of Biological Sciences at the University of Zambia for the support received during the stage of macroinvertebrate identification. Futhermore, we thank all the reviewers for the constructive comments meant to improve the manuscript.
Conflict of interest
The authors declare that the research was conducted in the absence of any commercial or financial relationships that could be construed as a potential conflict of interest.
Publisher's note
All claims expressed in this article are solely those of the authors and do not necessarily represent those of their affiliated organizations, or those of the publisher, the editors and the reviewers. Any product that may be evaluated in this article, or claim that may be made by its manufacturer, is not guaranteed or endorsed by the publisher.
References
Agboola, O. A., Downs, C. T., and O'Brien, G. (2019). Macroinvertebrates as indicators of ecological conditions in the rivers of KwaZulu-Natal, South Africa. Ecol. Indic. 106, 105465. doi: 10.1016/j.ecolind.2019.105465
Agboola, O. A., Downs, C. T., and O'Brien, G. (2020). Ecological risk of water resource use to the wellbeing of macroinvertebrate communities in the rivers of KwaZulu-Natal, South Africa. Front. Water 2, 584936. doi: 10.3389/frwa.2020.584936
Asmamaw, M., Tiku Mereta, S., and Ambelu, A. (2021). Response of macroinvertebrates to changes in stream flow and habitat conditions in Dinki watershed, central highlands of Ethiopia. Ecol. Indic. 133, 108448. doi: 10.1016/j.ecolind.2021.108448
Balasubramanian, M. (2019). Economic value of regulating ecosystem services: a comprehensive at the global level review. Environ. Monitor. Assessment 191, 616. doi: 10.1007/s10661-019-7758-8
Balwan, W. K., and Kour, S. (2021). Wetland-an ecological boon for the environment. East African Scholars J. Agric. Life Sci. 4, 38–48. doi: 10.36349/easjals.2021.v04i03.001
Banda, K., Mulema, M., Chomba, I., Chomba, M., Levy, J., and Nyambe, I. (2023). Investigating groundwater and surface water interactions using remote sensing, hydrochemistry, and stable isotopes in the Barotse Floodplain, Zambia. Geol. Ecol. Landsc. 1–16. doi: 10.1080/24749508.2023.2202450
Banda, K. E., Mwandira, W., Jakobsen, R., Ogola, J., Nyambe, I., Larsen, F., et al. (2019). Mechanism of salinity change and hydrogeochemical evolution of groundwater in the Machile-Zambezi Basin, South-western Zambia. J. Afr. Earth Sci. 153, 72–82. doi: 10.1016/j.jafrearsci.2019.02.022
Beilfuss, R. (2012). A Risky Climate for Southern African Hydro: Assessing Hydrological Risks and Consequences for Zambezi River Basin Dams. 1st Edn. California: International Rivers Berkeley.
Bello, D., Lavorel, F., Díaz, S., Harrington, S., Cornelissen, R., Bardgett, J. H. C., et al. (2010). Towards an assessment of multiple ecosystem processes and services via functional traits. Biodiversity Conserv. 19, 2873–2893. doi: 10.1007/s10531-010-9850-9
Bird, M., and Day, J. (2010). Aquatic Invertebrates As Indicators of Human Impacts in South African Wetlands: 1st Edn. Pretoria: Water Research Commission.
Bobbink, R., Whigham, D. F., Beltman, B., and Verhoeven, J. T. A. (2006). Wetlands: Functioning, Biodiversity Conservation, and Restoration. Berlin, Heidelberg: Springer Berlin Heidelberg, 1–12.
Chomba, I. C., Banda, K. E., Winsemius, H. C., Chomba, M. J., Mataa, M., Ngwenya, V., et al. (2021). A review of coupled hydrologic-hydraulic models for floodplain assessments in africa: opportunities and challenges for floodplain wetland management. Hydrology 8, 44. doi: 10.3390/hydrology8010044
Csurgó, B., and Smith, M. K. (2021). The value of cultural ecosystem services in a rural landscape context. J. Rural Studies 86, 76–86. doi: 10.1016/j.jrurstud.2021.05.030
Davidson, N. C. (2014). How much wetland has the world lost? Long-term and recent trends in global wetland area. Marine Freshwater Res. 65, 934–941. doi: 10.1071/MF14173
Deneut, E., Chileya, C. K., and Nativel, C. (2014). Environmental and Social Impact Assessment for the Improved Use of Priority Canals in the Barotse Sub-Basin of the Zambezi. Lusaka: BRL Ingénierie.
Gardner, R. C., and Finlayson, C. (2018). Global Wetland Outlook: State of the World's Wetlands and Their Services to People. Ramsar Convention Secretariat. (2018). Available online at: https://ssrn.com/abstract=3261606 (accessed Febuary 17, 2023).
Griebler, C., Stein, H., Kellermann, C., Berkhoff, S., Brielmann, H., Schmidt, S., et al. (2010). Ecological assessment of groundwater ecosystems–vision or illusion? Ecol. Eng. 36, 1174–1190. doi: 10.1016/j.ecoleng.2010.01.010
Guajardo, S. A. (2015). Measuring diversity in police agencies. J. Ethnicity Crim. Justice 13, 1–15. doi: 10.1080/15377938.2014.893220
He, S., Soininen, J., Chen, K., and Wang, B. (2020). Environmental factors override dispersal-related factors in shaping diatom and macroinvertebrate communities within stream networks in China. Front. Ecol. Evol. 8, 141. doi: 10.3389/fevo.2020.00141
Hernández-Morcillo, M., Plieninger, T., and Bieling, C. (2013). An empirical review of cultural ecosystem service indicators. Ecol. Indic. 29, 434–444. doi: 10.1016/j.ecolind.2013.01.013
Kurthen, A. L., He, F., Dong, X., Maasri, A., Wu, N., Cai, Q., et al. (2020). Metacommunity structures of macroinvertebrates and diatoms in high mountain streams, Yunnan, China. Front. Ecol. Evol. 8, 571887. doi: 10.3389/fevo.2020.571887
Layke, C., Mapendembe, A., Brown, C., Walpole, M., and Winn, J. (2012). Indicators from the global and sub-global millennium ecosystem assessments: an analysis and next steps. Ecol. Indic. 17, 77–87. doi: 10.1016/j.ecolind.2011.04.025
Lehner, B., Katiyo, L., Chivava, F., Sichingabula, H. M., Nyirenda, E., Rivers-Moore, N. A., et al. (2021). Identifying priority areas for surface water protection in data scarce regions: an integrated spatial analysis for Zambia. Aquatic Conserv. Marine Freshwater Ecosyst. 31, 1998–2016. doi: 10.1002/aqc.3606
Lowe, S., Dallas, H., Kennedy, M., Taylor, J., Gibbins, C., Lang, P., et al. (2013). SAFRASS Methodology Manual. Glasgow: University of Glasgow.
Lunde, K. B., and Resh, V. H. (2012). Development and validation of a macroinvertebrate index of biotic integrity (IBI) for assessing urban impacts to Northern California freshwater wetlands. Environ. Monit. Assessment 184, 3653–3674. doi: 10.1007/s10661-011-2214-4
Mace, G. M., Norris, K., and Fitter, A. H. (2012). Biodiversity and ecosystem services: a multilayered relationship. Trends Ecol. Evol. 27, 19–26. doi: 10.1016/j.tree.2011.08.006
Mezgebu, A., Lakew, A., Lemma, B., and Beneberu, G. (2019). The potential use of chironomids (Insecta: Diptera) as bioindicators in streams and rivers around Sebeta, Ethiopia. Afr. J. Aquatic Sci. 44, 369–376. doi: 10.2989/16085914.2019.1650711
Nikolić, V., Milićević, D., and Milenković, S. (2009). Wetlands, constructed wetlands and theirs role in wastewater treatment with principles and examples of using it in Serbia. Arch. Civil Eng. 7, 65–82. doi: 10.2298/FUACE0901065N
Nyambe, I., Chabala, A., Banda, K., Zimba, H., and Phiri, W. (2018). “Determinants of spatio-temporal variability of water quality in the Barotse Floodplain, western Zambia,” in Climate Change and Adaptive Land Management in Southern Africa - Assessments, Changes, Challenges, and Solutions, eds R. Revermann, K. M. Krewenka, U. Schmiedel, J. M. Olwoch, J. Helmschrot, and N. Jürgens (Göttingen; Windhoek: Klaus Hess Publishers), 96–105. doi: 10.7809/b-e.00310
Orellana, F., Verma, P., Loheide, I. I. S. P., and Daly, E. (2012). Monitoring and modeling water-vegetation interactions in groundwater-dependent ecosystems. Rev. Geophysics 50, 383. doi: 10.1029/2011RG000383
Reid, W. V., Carpenter, S. R., Mooney, H. A., and Chopra, K. (2005). Millennium Ecosystem Assessment Synthesis Report. Washington, DC: Washington Island Press.
Simaika, J. P., Chakona, A., and van Dam, A. A. (2021). Towards the sustainable use of African wetlands. Front. Environ. Sci. 9, 658871. doi: 10.3389/fenvs.2021.658871
Sinchembe, M., and Ellery, W. N. (2010). Human impacts on hydrological health and the provision of ecosystemservices: a case study of the eMthonjeni–Fairview Spring Wetland, Grahamstown, South Africa. Afr. J. Aquatic Sci. 35, 227–239. doi: 10.2989/16085914.2010.538508
Singh, P. K., and Saxena, S. (2018). Towards developing a river health index. Ecol. Indic. 85, 999–1011. doi: 10.1016/j.ecolind.2017.11.059
Sundermann, A., Leps, M., Leisner, S., and Haase, P. (2015). Taxon-specific physico-chemical change points for stream benthic invertebrates. Ecol. Indic. 57, 314–323. doi: 10.1016/j.ecolind.2015.04.043
Tampo, L., Kaboré, I., Alhassan, E. H., Ouéda, A., Bawa, L. M., Djaneye-Boundjou, G., et al. (2021). Benthic macroinvertebrates as ecological indicators: their sensitivity to the water quality and human disturbances in a tropical river. Front. Water 3, 662765. doi: 10.3389/frwa.2021.662765
Tampo, L., Lazar, I. M., Kaboré, I., Oueda, A., Akpataku, K. V., Djaneye-Boundjou, G., et al. (2020). A multimetric index for assessment of aquatic ecosystem health based on macroinvertebrates for the Zio river basin in Togo. Limnologica 83, 125783. doi: 10.1016/j.limno.2020.125783
Thorp, J. H., and Rogers, D. C. (2010). Field Guide to Freshwater Invertebrates of North America. New York, NY: Academic Press.
Weigel, B. M., and Robertson, D. M. (2007). Identifying biotic integrity and water chemistry relations in nonwadeable rivers of Wisconsin: toward the development of nutrient criteria. Environ. Managem. 40, 691–708. doi: 10.1007/s00267-006-0452-y
White, J., Fornaroli, R., Hill, M., Hannah, D., House, A., Colley, I., et al. (2021). Long-term river invertebrate community responses to groundwater and surface water management operations. Water Res. 189, 116651. doi: 10.1016/j.watres.2020.116651
Winton, R. S., Teodoru, C. R., Calamita, E., Kleinschroth, F., Banda, K., Nyambe, I., et al. (2021). Anthropogenic influences on Zambian water quality: Hydropower and land-use change. Environ. Sci. Processes Impacts 23, 981–994. doi: 10.1039/D1EM00006C
Wood, P. J., Armitage, P. D., Cannan, C. E., and Petts, G. E. (1999). Instream mesohabitat biodiversity in three groundwater streams under base-flow conditions. Aquatic Conserv. Marine Freshwater Ecosyst. 9, 265–278. doi: 10.1002/(SICI)1099-0755(199905/06)9:3<265::AID-AQC342>3.0.CO;2-Q
Zimba, H., Kawawa, B., Chabala, A., Phiri, W., Selsam, P., Meinhardt, M., et al. (2018). Assessment of trends in inundation extent in the Barotse Floodplain, upper Zambezi River Basin: A remote sensing-based approach. J. Hydrol. Reg. Studies 15, 149–170. doi: 10.1016/j.ejrh.2018.01.002
Keywords: Barotse Floodplain, canonical correspondence analysis (CCA), factor analysis, flood pulse, sub-class taxa, wetland conservation
Citation: Banda K, Ngwenya V, Mulema M, Chomba I, Chomba M and Nyambe I (2023) Influence of water quality on benthic macroinvertebrates in a groundwater-dependent wetland. Front. Water 5:1177724. doi: 10.3389/frwa.2023.1177724
Received: 02 March 2023; Accepted: 07 April 2023;
Published: 05 May 2023.
Edited by:
Tatenda Dalu, University of Mpumalanga, South AfricaReviewed by:
Thendo Mutshekwa, University of Venda, South AfricaChipo Perseverance Mungenge, Rhodes University, South Africa
Copyright © 2023 Banda, Ngwenya, Mulema, Chomba, Chomba and Nyambe. This is an open-access article distributed under the terms of the Creative Commons Attribution License (CC BY). The use, distribution or reproduction in other forums is permitted, provided the original author(s) and the copyright owner(s) are credited and that the original publication in this journal is cited, in accordance with accepted academic practice. No use, distribution or reproduction is permitted which does not comply with these terms.
*Correspondence: Kawawa Banda, S2F3YXdhLkJhbmRhQHVuemEuem0=
 Kawawa Banda
 Victoria Ngwenya1
 Mataa Mulema
