
94% of researchers rate our articles as excellent or good
Learn more about the work of our research integrity team to safeguard the quality of each article we publish.
Find out more
ORIGINAL RESEARCH article
Front. Water, 15 May 2023
Sec. Environmental Water Quality
Volume 5 - 2023 | https://doi.org/10.3389/frwa.2023.1117780
 Jonathan J. Kim1*†
 Peter C. Ryan2†
 Timothy Schroeder3†Edwin Romanowicz4†
 David Boutt5†Marcel Belaval6†
 James Shanley7†
Between 2016 and 2019, the Vermont Department of Environmental Conservation discovered that groundwater from over 50% (355/628) of wells and springs in the Bennington area had perfluorooctanoic acid (PFOA) concentrations > 20 parts/trillion (ppt) (Vermont action level). The distribution of contaminated wells was complex, with very different PFOA concentrations in closely-spaced wells (<100 m apart). PFOA was introduced into the environment by a factory that produced Teflon™-coated fabrics from about 1978–2002. Manufacturing involved PFOA expulsion from smokestacks followed by atmospheric transport, deposition, and downward leaching to the aquifer system. The fractured rock aquifer was characterized through physical components (geologic mapping, spatial analysis of wells, and geophysical logging) to build a Three-dimensional conceptual model and then map the spatial distribution of chemical groundwater tracers (PFOA, major and trace elements, stable isotopes, and and recharge ages), adding a fourth temporal dimension. The field area consists of four imbricated metamorphic rock slices bounded by thrust faults. The dominant fracture sets that overprint these slices control the N-S and E-W topographic “grain.” Geophysical logging divided wells into those completed internal to or on the margins of thrust slices. Major and trace element analysis shows that groundwater can be spatially discriminated into carbonate (TDS, Ca, Mg, HCO3), shaly (Sr, U, SO4), and siliceous (K, Si) groups. Depleted H2O stable isotope signatures characterize the siliceous group. Recharge-ages determined from CFC11, 12, and 113 and tritium correlate with geochemical groups and were divided into “older” (~1953–73) and “younger” (1963–88), which predate and are synchronous with factory operation, respectively. Our conceptual model shows recharge from highlands to the west and east flowing toward the Bennington valley where it is locally tapped by wells along thrust faults or fracture zones. This water has older recharge ages and anomalously low PFOA concentrations (<6.7 ppt in 12 of 15 samples, mean = 7.9 ppt) compared to the majority of wells in this region, which are completed in the internal portions of thrust slices. These wells contain groundwater with younger recharge ages and high PFOA concentrations (mean = 290 ppt) and occurrence (>20 ppt in 28/36 samples), indicating mixing of younger and older waters.
Knowledge of the behavior of per- and polyfluorinated alkyl substances (PFAS) in complex groundwater systems consisting of fractured rock aquifers (FRAs) and overlying unconsolidated sediments is limited by the relatively few studies that have addressed such systems (Lv et al., 2018; Schroeder et al., 2021). By far, most studies of PFAS behavior in aquifer systems have focused on unconsolidated sediments, examining unsaturated zone retention and release of PFAS (Ferry et al., 2012; Xiao et al., 2015; Weber et al., 2017; Guo et al., 2020) and fate and transport in sand and gravel aquifers (Schaider et al., 2014; Shin et al., 2015; Xiao et al., 2015; Weber et al., 2017; Sammut et al., 2019). Fractured rock aquifer systems typically are highly anisotropic, and contaminant fate and transport are variably controlled by fractures, bedding and cleavage planes, folds, and faults, as well as secondary dissolution features in carbonate lithologies, and different sorption potentials of formations within the aquifer (Kim et al., 2014, 2016). Given the high degree of heterogeneity, flow paths in FRAs are often difficult to predict, thus complicating interpretation or prediction of PFAS fate and transport.
This study presents a multidisciplinary aquifer characterization approach that was developed to understand and predict PFAS migration in FRAs, consisting of physical (geological and geophysical analyses of aquifer geometries, mapping of potentiometric surfaces from water-level measurements in bedrock wells) and chemical (geochemical and isotopic fingerprinting of groundwater, quantification of groundwater ages, measurement of PFAS across spatial and temporal scales, and the role of airborne delivery of PFAS to the land surface) components. This article describes the approach as well as the resulting aquifer model, and the goal is that this approach be transferrable and applicable elsewhere where PFAS contamination has also been detected in complex FRAs.
Perfluorooctanoic acid (PFOA) and related compounds perfluorooctanoate (PFO) and PFO−anion (when dissociated) and ammonium pentadecafluorooctanoate salt (APFO) are long chain PFAS compounds that are of increasing concern to human and environmental health (Lena et al., 2012). PFOA (C8HF15O2) consists of an octane-like chain of eight carbon atoms (accounting for the pseudonym C8) with fifteen hydrophobic carbon-fluorine bonds, and a hydrophilic carboxyl group (COOH) (e.g., Lemal, 2004; Steenland, 2010; Interstate Technology and Regulatory Council (ITRC), 2020); APFO contains an ammonium () molecule bonded to the PFO− anion (C8F15) and occurs as a solid, water-soluble salt. These PFAS have been used since the 1950s in the production of synthetic performance products. They repel both water and oil, making them widely useful in the manufacture of synthetic products [OECD (Organisation for Economic Co-operation and Development), 2002; Boulanger et al., 2005; Lehmler, 2005; Dinglasan-Panlilio and Mabury, 2006; Interstate Technology and Regulatory Council (ITRC), 2020] PFAS are extremely stable in the environment, resistant to degradation and environmental breakdown. PFAS are commonly found in surface and groundwaters around the world, where they have the potential to bio-accumulate and be transported long distances (Lena et al., 2012).
The environmental and human toxicity of PFAS has led to numerous health studies that associate PFOA with testicular, kidney, prostate and ovarian cancer, and developmental diseases [Lopez-Espinosa et al., 2011; Vaughn et al., 2013; Vieira et al., 2013; Interstate Technology and Regulatory Council (ITRC), 2020]. PFOA enters the body primarily through oral or inhalation pathways and exists in serum albumin; it also may concentrate in the liver and kidney and be excreted in urine and feces (Kudo and Kawashima, 2003). PFOA was projected to be present in the blood, kidneys, and liver of every living person (Kannan et al., 2004; Emmett et al., 2006). Concentrations in factory workers, measured as PFO− anion in blood, were found to be as high as 100 parts per million (ppm) (Ubel et al., 1980; Olsen et al., 1998; Kaiser et al., 2010). Residence time in the body can range from 3.5 to 8.5 years (Olsen et al., 2007). In 2006, the U.S. Environmental Protection Agency (USEPA)classified PFOA as a likely carcinogen.
PFOA and related PFAS are used as surfactants during emulsion polymerization in the production of fluoropolymers, notably Teflon™ (PTFE) [Environmental Protection Agency (EPA), 2016]. PFOA was first synthesized in 1947 by the 3M Corporation™ using electrochemical fluorination (ECF), a method used to create many perfluoroalkyl carboxylates, and added to PTFE production in 1951 [Environmental Protection Agency (EPA), 2016]. DuPont created Teflon™ in 1938, but only in 1951 did DuPont begin buying PFOA from 3M for use in fluoropolymer production at the Washington Works plant in Parkersburg, West Virginia (PFAS Project Lab, 2022). The chemical stability of PFOA and its ability to lower surface tension made it extremely useful for a variety of products in the post-war industrial boom. Commercial uses included cleaning agents, metal plating, fire-fighting foams, coating formulas, inks, varnish, polyurethane production, shampoo, food packaging, floor polish, vinyl polymerization, gasoline, lubricants, oil, and water repellants for paper, leather, and textiles [Holzapfel, 1966; OECD (Organisation for Economic Co-operation and Development), 2002; Boulanger et al., 2005; Lehmler, 2005; Prevedouros et al., 2006; Interstate Technology and Regulatory Council (ITRC), 2020]. The latest and most widespread use of PFOA has been in Gore-Tex™ and Teflon™ products (Steenland, 2010).
Worldwide annual production of PFOA was estimated to be 260 metric tons in 1999 (Prevedouros et al., 2006); since 2002, production and emission rates have fallen, replaced by newer products such as C6 (a 6-carbon chain PFAS). Mechanisms of PFOA contamination of the environment include smokestack emissions during production, leftover product disposal, and factory runoff (Barton, 2008; Xiao et al., 2015). During production, hot (>300 degrees Centigrade) (Schroeder et al., 2021) PFOA vapor is emitted from smokestacks (Step A-Figure 1), contacts cool air and is carried in the lower atmosphere (Step B-Figure 1), coalesces from vapor to form submicron particles (0.1–1 μm) that adsorb to aerosol surfaces, and is deposited onto the land surface (Step C, Figure 1), typically within 5–10 km of the emission source [Interstate Technology and Regulatory Council (ITRC), 2020; Schroeder et al., 2021]. Partitioning and transport of PFOA and other PFAS in soil and groundwater are largely controlled by factors such as topography, water and soil pH, aquifer geochemical properties, humidity, temperature, wind direction and soil type (Barton, 2008; Guo et al., 2020). Although PFOA is very soluble and has a low sorption potential (Ferry et al., 2012), leaching in the unsaturated zone above the water table (Step D, Figure 1) can be retarded by organic carbon, iron oxides and hydroxides, or retention at the water-air interface (Ferry et al., 2012; Guo et al., 2020). For example, adsorption to organic and inorganic particles in the unsaturated zone can lead to an 18-to-64-fold PFAS retardation relative to water transport rates, meaning that PFAS may also continue to occur in soils and sediments decades after release and air deposition (Xiao et al., 2015). Once transported downward to the saturated zone, further migration of PFAS occurs within the surficial aquifer in groundwater flowing through more permeable materials (i.e., sand and gravel) and to the FRA (Steps E and F, Figure 1), where angular or lateral movement along planar discontinuities such as beds, foliations, fractures, and faults occurs (Kim et al., 2014, 2016, 2018, 2019).
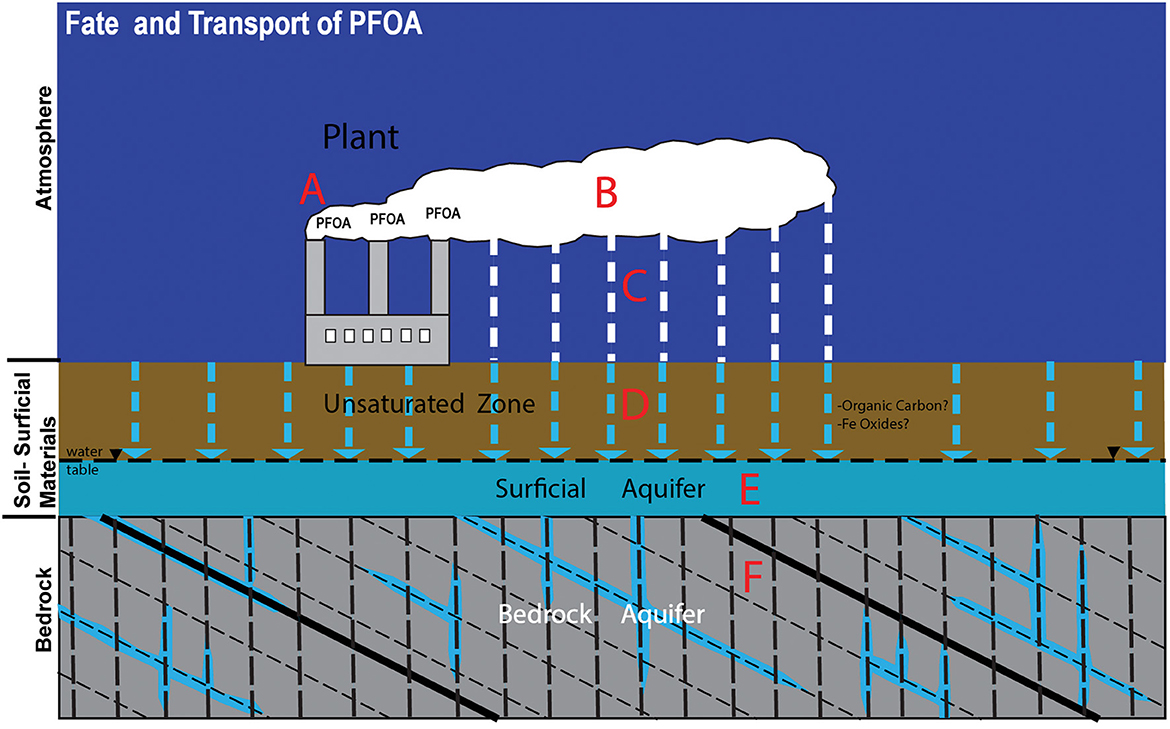
Figure 1. General fate and transport model for Perfluorooctanoic Acid (PFOA) that was emitted from the ChemFab plant in North Bennington (modified from Roakes and Zemba, 2017). See text for details.
Elevated levels of PFOA in groundwater from North Bennington, Vermont were first detected in February 2016 by the Vermont Department of Environmental Conservation (VTDEC). This testing was performed in response to reports of PFOA detected in groundwater of nearby Hoosick Falls, New York, which resulted in a do-not-drink order for the village's public water supply (Albany, 2016; Schroeder et al., 2021); similar manufacturing processes were also being used in North Bennington (Figure 2). PFOA in this region had been used in the production of PTFE (Teflon™)-coated, waterproof fabrics for air-supported roofs from 1969–2002 by St. Gobain Performance Plastics and its predecessor ChemFab (VTDigger, 2017), as well as in wire coating processes by other manufacturers. The ChemFab plant on Water Street in North Bennington operated from 1978–2002 and replaced a much smaller Northside Ave. facility that was shorter-lived (1969–1978) (Barr Engineering, 2018). After closing the ChemFab plant, Saint-Gobain transferred manufacturing operations to a new plant in Merrimack, NH, where PFOA contamination of groundwater was also discovered in 2016 (Figure 2) (VTDigger, 2017).
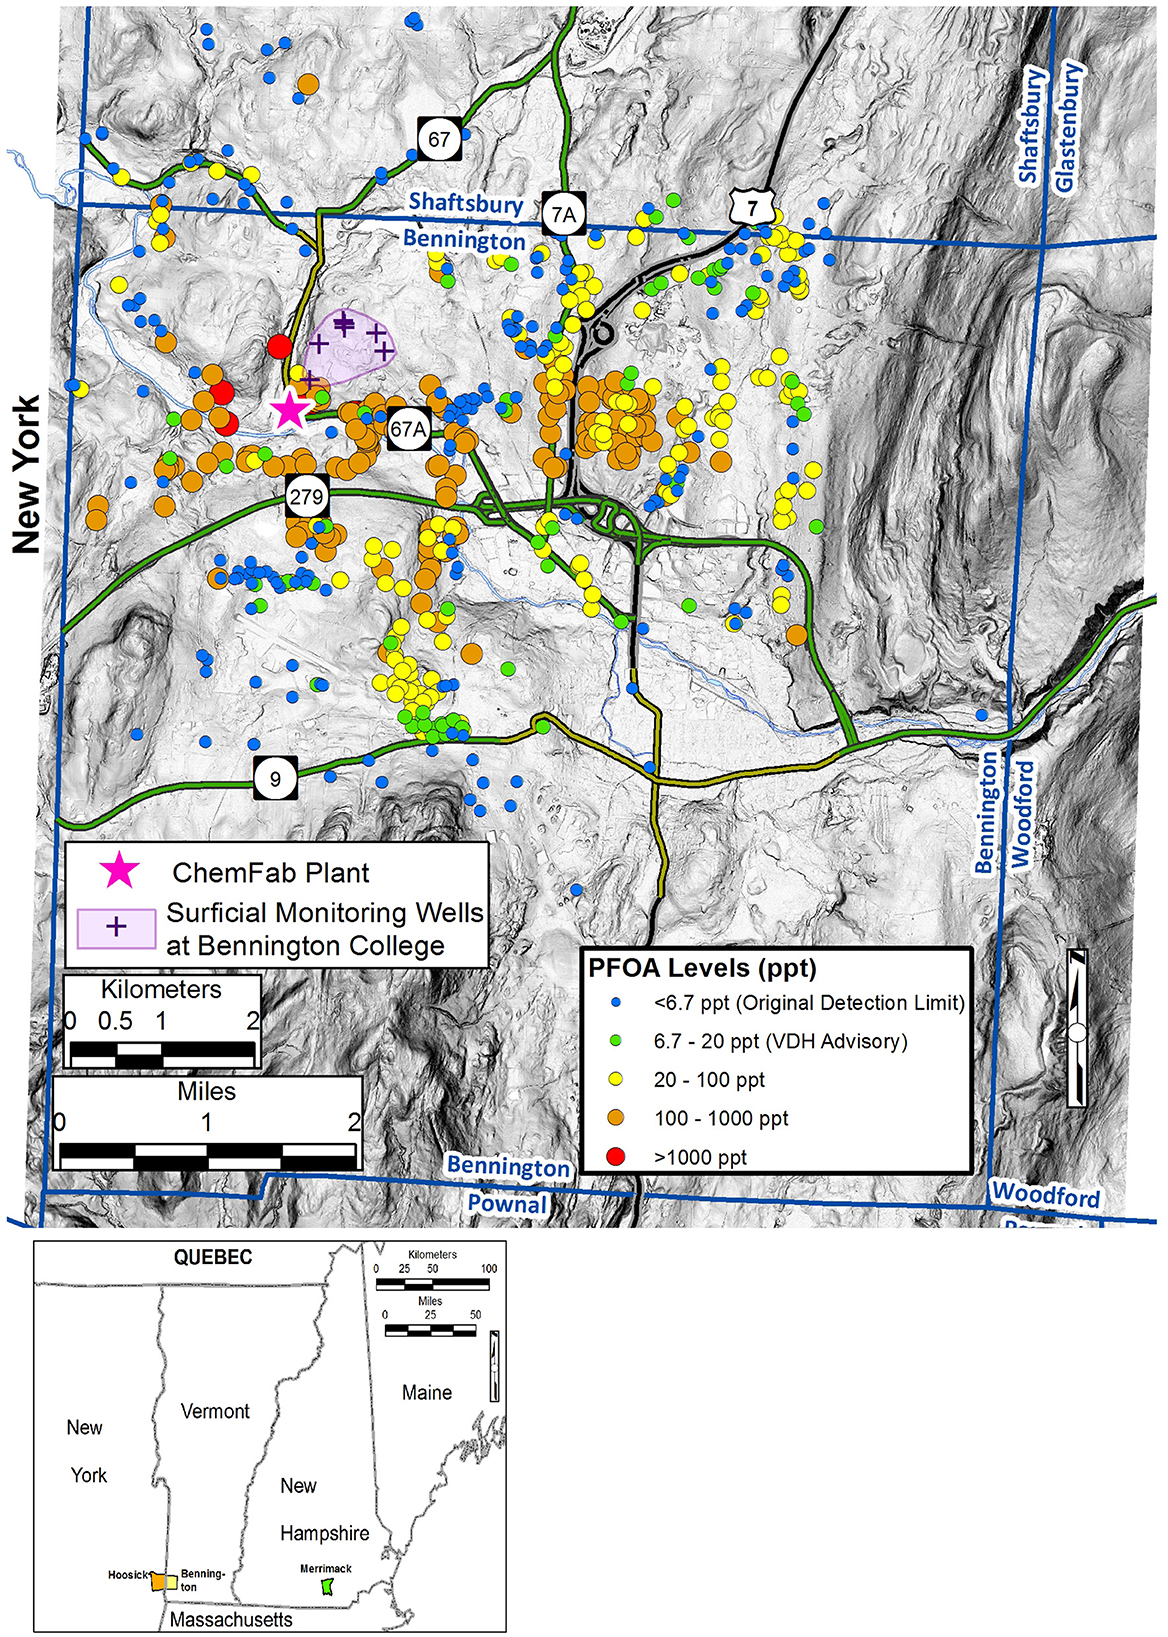
Figure 2. Map of the Town of Bennington and vicinity that shows the Perfluorooctanoic Acid (PFOA) concentrations for wells (and springs) tested by the State of Vermont between 2016-2019 (Vermont Dept. of Environmental Conservation, n.d). Background layer is a light detection and ranging (LiDAR) slope map.
Introduction of PFOA to the environment in Bennington occurred primarily through air emissions (Schroeder et al., 2021). Extensive testing of private groundwater wells over a ~40 km2 area determined that 57% (355/628) of the wells tested had PFOA concentrations above the VTDEC action level of 20 parts/trillion (ppt) (Figure 2). The limits of the contamination area were first determined by testing wells within a 1.6 km radius around the ChemFab plant, but because many wells within this first circle had elevated PFOA, the testing area was progressively expanded until it encompassed the full ~40 km2 area. Most private wells in this area were completed in a FRA comprised of faulted, folded, and weakly-metamorphosed Paleozoic carbonate and clastic rocks (Ratcliffe et al., 2011).
The fate and transport sequence for PFOA in the study area is complex and involves multiple steps (Figure 1). This A-F sequence ran continuously over 25 years in the Town of Bennington (Figure 1) and steps D-F continue to the present, nearly two decades after the plant shut down in February 2002 (VTDigger, 2017; Schroeder et al., 2021). A subordinate amount of PFOA was also introduced directly into soils, streams, or groundwater by dumping and/or spills, thus starting at Step D (Barr Engineering, 2018).
This study primarily deals with the groundwater portion of the PFOA fate and transport sequence, from the saturated zone of the shallow aquifer through flow in the bedrock aquifer (Steps E-F). Because air deposition was presumed to be the dominant mechanism for the introduction of PFOA into the environment, air distribution models for PFOA from the former ChemFab plant were produced by environmental consultants for VTDEC and St. Gobain.
In the northeastern United States, FRAs are comprised of poly-deformed and metamorphosed sedimentary and igneous rocks that are overlain by heterogeneous surficial deposits of predominantly Pleistocene glacial origin. When PFOA is introduced into these aquifers over decades by the complex fate and transport processes described above, a robust, multi-disciplinary approach to characterization is critical for developing an accurate conceptual site model (CSM). Our holistic aquifer characterization approach first builds a physical three-dimensional spatial framework for the field area and then adds a fourth dimension through the integration of temporal chemical tracer data. Using Figure 3 as an outline, the new data sets produced for the field area include:
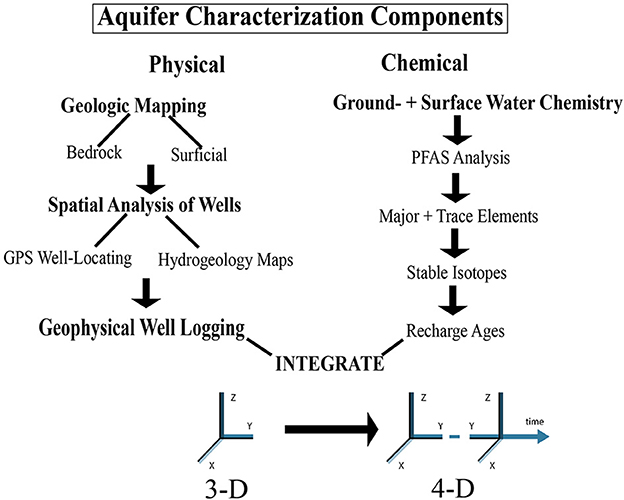
Figure 3. Physical and chemical hydrogeological components used to characterize the complex fate and transport of Perfluorooctanoic Acid (PFOA) in the fractured rock aquifer of Bennington. See text for details. PFAS, per- and polyfluorinated alkyl substances; GPS, Global Positioning System.
Physical Aquifer Characterization:
1) Geologic Mapping- bedrock and surficial maps (scale-−1:12,000).
2) Spatial Analysis of Wells
a. Database of accurately located private wells (n = 148).
b. Isopach, bedrock surface, and potentiometric surface contour maps (scale−1:12,000).
3) Geophysical Well Logging- temperature, fluid conductivity, gamma, caliper, acoustic televiewer, and heat pulse flowmeter logs for 17 wells.
Chemical Aquifer Characterization:
4) PFAS Analysis—PFOA concentrations for 628 wells (and springs) that were sampled and analyzed by consultants under contract to the Vermont Dept. of Environmental Conservation (VTDEC) between 2016 and 2019. An additional 10 wells (and springs) were sampled and analyzed by Bennington College for PFOA for this study.
5) Major and Trace Elements (33 analytes)—concentrations for 59 wells (and springs)
6) 6) Stable Isotopes (deuterium and 18O) abundances for 30 wells (and springs)
7) Recharge Ages—CFC11, CFC12, CFC113, SF6, and Tritium concentrations for 25 wells (and springs).
This paper demonstrates that field-based multi-disciplinary hydrogeological studies are essential for characterizing complex FRAs contaminated with PFAS over decades, particularly due to the complex multi-stage fate and transport pathways that result from high temperature air emissions. We describe how the physical components contribute to the construction of a three-dimensional framework, demonstrate how the chemical components fit into this framework to create a four-dimensional component, and produce conceptual site models of different scales.
Bedrock mapping was completed using traditional field techniques that included use of Brunton Compass, Global Positioning System (GPS) satellite receiver, topographic base map, rock hammer for sampling, hand lens for mineral identification, and field notebook for recording all data. Bedding, foliation, and fracture data were plotted on rose diagrams and equal area nets using Daisy software (Salvini et al., 1999). The field equipment for surficial mapping included a trenching shovel, hand auger, trowel, Munsell Color Chart, and topographic maps generated from LiDAR elevation data. The collation of data sets and map cartography were completed using ArcMap software.
The State of Vermont maintains a database of groundwater wells drilled since ~1970 that has information on well depth, overburden thickness, driller's yield (gallons/minute), static water level (SWL), casing depth and length, and groundwater production zones (Vermont Agency of Natural Resources, 2023). The bedrock wells used to produce the Geographic Information Systems (GIS) maps for this study were located either by GPS or by correlation with E911 street addresses. The overburden data were used to produce bedrock surface contour and isopach maps, whereas the SWL data were used to generate potentiometric surface maps. Although the SWL data in this database do not necessarily represent equilibrium water levels, these data can be judiciously used at the scale of a town (303 km2) or greater, since groundwater flow directions at large scales generally follow topography. Ground surface elevations for wells were determined from LiDAR Digital Elevation Models (DEM).
We sought a relatively even distribution of wells throughout the field area, but were limited by our ability to obtain permission from well owners, as well as the constraint that wells were absent in zones served by public water supplies. Seventeen domestic bedrock wells were logged using the following Mt. Sopris Instruments tools: (1) temperature and resistivity (2PFA-10000), (2) natural gamma (2PGA poly gamma), (3) caliper (2PCA-1000 caliper), (4) acoustic borehole imager (ABI) (QL40), and (5) heat-pulse flowmeter (HFP2293). A continuous color video record of most wells was made using a GeoVISION borehole camera video system. The geophysical data and videos from these 17 wells are currently being collated by the Vermont Geological Survey with funding from the USGS National Geological and Geophysical Data Preservation Program (NGGDPP) and will be available on the Vermont Geological Survey website during late 2023.
The temperature/fluid resistivity probe was used in tandem with the gamma probe. Temperature and fluid resistivity measurements were recorded from the top of the water level downward at a 0.05 m interval as the probes were lowered. The logging speed of temperature and resistivity values was typically between 3.0 and 4.6 m/min. Well logging software converted fluid resistivity measurements to conductivity and specific conductivity (@25°C). Natural gamma measurements were acquired every 0.05 m, as the probes were raised. The logging speed was between 3.0 and 4.6 m/min. Caliper logs were completed by raising a three-prong caliper logger from the bottom of the well to the bottom of the well casing at a sample rate of 0.05 m with a logging speed between 3.0 and 4.6 m/min. Acoustical Borehole Imaging was completed by raising the imager from bottom of the well in order to maintain tension on the cable during imaging at a sample rate of 0.004 m. The logging speed was typically about 1.8 m/min. Logging was terminated at the bottom of the casing or the top of the water, whichever occurred first.
The velocity measurements using a heat-pulse flow meter were made above and below a major fracture. When the bedrock is highly fractured, measurements were made at various intervals. Care was taken to make certain the diverters were oriented properly, pointing in the direction of flow. Multiple measurements were made at each location until measurement values were duplicated. Upward velocity measurements with a peak time >45 secs were discarded because times beyond this reflect thermal density stratification from the heat pulse and not borehole groundwater flow. We assumed those peaks were a result of density stratification of the water due to heating.
Prior to logging, the water line to the home was disconnected and the pump and associated hoses and wiring were removed by a well driller and coiled onto a plastic tarp near the well. The wells were logged under ambient conditions. After logging was completed, the pump was replaced and run until the water ran clear. The pump-pulling and logging equipment was decontaminated with a 1:3 detergent/water mix when entering and after exiting the well. The logging data for each well were collated in a standard format using WellCAD™ software in the order discussed above. The attitudes of planar structures intersecting the well were calculated from Acoustic Televiewer and caliper logs using WellCAD™ software. Structural data for the wells were plotted on rose diagrams and contoured equal area nets using Daisy Software (Salvini et al., 1999) and compared with structural data from bedrock geologic maps.
Groundwater samples were collected over a 3-year period from rural groundwater wells that are the water supplies for private homes. These wells are 15 cm in diameter and steel-cased through surficial deposits to bedrock, and then open to the FRA below the base of casing. Water was sampled using in well production pumps; water treatment systems (e.g., water softeners and/or Point of Entry Treatment (POET) systems using activated carbon) were bypassed, if present. Most samples were obtained directly from the faucet on the pressure tank or from an outdoor spigot. A calibrated YSI or Hanna multiprobe was used to measure water temperature, specific conductivity, pH, and oxidation-reduction potential (ORP), —samples were collected once all parameters had attained steady values, typically after purging for 10 to 20 minutes.
Samples were collected in acid-washed, high-density polyethylene (HDPE) or glass bottles (for P analysis) and stored on ice. Concentrations of metals, metalloids and anions were analyzed at the VTDEC Laboratory in Burlington VT. Samples were acidified and digested before analysis, and methods by which metals and anions were determined are shown below. For representative precision, accuracy, and detection limit data, see this reference (Kim et al., 2014). The following methods apply: (1) EPA Method 6020 (ICPMS, Inductively Coupled Plasma Mass Spectrometry) for Al, As, Ba, Ca, Co, Cu, Fe, Pb, Mg, Mn, Mo, Ni, K, Na, Sr, Total Calculated Hardness (TCH), and U. (2) EPA Method 245.1 for Hg; (3) EPA 300.0 or SM 4500CL-G for Cl; (4) EPA Method 300.0 for SO4 and NO3; (5) SM 4500-PH for P; (6) SM 4500 SiO2-F for dissolved SiO2; and SM 2320B for alkalinity.
Groundwater chemical composition was analyzed using traditional approaches (e.g., Piper and Durov plots, geochemical spider plots, routine statistical analysis) and by a non-metric multidimensional scaling (NMDS) analysis. Spider diagrams plot the relative abundance of components useful in discrimination (e.g., TDS, Ca, Mg, Na, K, Sr, U, SiO2, SO4, Cl) associated with selected Bennington groundwater samples in comparison to their abundance in a reference water (in this study, the reference is the mean value of all groundwater samples analyzed in this study). The differences in the patterns of relative abundances (rather than the abundance values themselves) are what is useful in discrimination. NMDS is a common tool used for working with large datasets. The goal of NMDS is to collapse information from multiple dimensions (e.g., from dozens of chemical parameters) into just a few (e.g., two), so that similarity and difference can be interpreted. Unlike Principal Components Analysis (PCA), which primarily relies on Euclidean distances, NMDS uses rank orders, making it a more flexible technique that can accommodate a variety of datasets. To plot NMDS results on a map, a spreadsheet was created to spatially analyze sample ID and corresponding Universal Transverse Mercator (UTM) coordinates with a single-axis NMDS analysis value (the first dimensional axis). Initially NMDS values ranged from−0.046 to 0.135. These values were normalized with the lowest value equal to 0 and highest to 1, and subsequently multiplied by 100 for ease of use in ArcGIS. The resulting columns were added to ArcGIS as a feature class. The X and Y values of UTM were input as XY data and displayed spatially. Corresponding numerical NMDS data were added as unique values for each sample point, and visually shown with a color wheel (green to red). An empirical Bayesian kriging analysis was performed to create a contoured raster file. In all, three different Kriging models were run, with the Empirical Bayesian Kriging analysis best articulating the relation between points for this use. The Kriging model and sample points are displayed with a satellite base map in the background, along with a layer containing major rivers. In this analysis, slate-influenced waters plot as red and carbonate-dominated waters plot as green.
Samples for stable water isotopic analysis were collected in 15-ml HDPE bottles with tight fitting screw caps. In the laboratory, samples were filtered at 0.22 μm and placed into 2 ml glass auto-sampler vials with a PTFE septa. The isotopic composition (2H-H2O, 18O-H2O) of hydrogen and oxygen of the water molecule of surface water, precipitation and ground water were measured by wavelength scanned cavity ring-down spectrometry on un-acidified samples by Picarro L-1102i WS-CRDS analyzer (Picarro, Sunnyvale, CA). Samples were vaporized at 110°C. A 5 μl Hamilton glass syringe draws 1 μl of sample to inject into a heated vaporizer port (110°C). For each injection, the absorption spectra for each isotope were determined 20 times and averaged. Between injections, the needle was rinsed with 1-Methyl-2-pyrrolidinone and the sample chamber is flushed with dry nitrogen. Three standards that isotopically bracket the sample values were run alternately with the samples. Secondary lab reference waters (from Boulder, Colorado; Tallahassee, Florida; Amherst, Massachusetts) were calibrated with Greenland Ice Sheet Precipitation, Standard Light Antarctic Precipitation and Vienna Standard Mean Ocean Water (VSMOW) from the International Atomic Energy Agency (IAEA). Results were calculated based on a rolling calibration so that each sample is determined by the three standards run closest in time to that of the sample. Long-term averages of internal laboratory standard analytical results yield an instrumental precision of 0.51 ‰ for δ2H-H2O and 0.08 ‰ for δ18O-H2O.
Once field parameters such as temperature, conductivity, pH, and ORP had stabilized, most groundwater samples for chlorinated fluorocarbons (CFC11, CFC12, and CFC113), sulfur hexafluoride (SF6) and tritium analysis were acquired using sampling methods and protocols of the Tritium Lab [The Tritium Lab at the Rosenstiel School of Marine and Atmospheric Sciences (RSMAS), n.d., n.d.], which calls for collection in 500 ml glass bottles with foil-lined screw caps (CFCs, SF6) and 1 liter plastic bottles (tritium), respectively. Most samples were analyzed at this lab. Eight samples were collected by U.S. Geological Survey (USGS) personnel using USGS methods for tritium and chlorofluorocarbons (U.S. Geological Survey Groundwater Dating Lab methods), which are very similar to those of The Tritium Lab. Age tracers for USGS samples were analyzed at the USGS Groundwater Dating Laboratory in Reston, VA except for tritium, which was analyzed at Woods Hole Oceanographic Institute, Woods Hole, MA.
We had access to PFAS data from groundwater samples taken by consultants under contract to the VTDEC from private wells (and springs) throughout the contamination area (n = 628). This dataset was last accessed for this study in May 2019. If more than one PFOA result existed for a well, the maximum value was used. These samples were procured via the methods of Weston and Sampson Engineers Inc (2016). Additional samples referenced in this study were collected from springs and wells by faculty and students at Bennington College using the same methods as VTDEC above (Schroeder et al., 2021). All samples referenced in this study were analyzed at Eurofins Eaton Analytical Labs with USEPA method 537 or 537.1.
Many wells in the study area were tested multiple times for PFOA and the temporal variability of these results for an area near the former factory were assessed (Schroeder et al., 2021). Bennington College students and faculty studied the temporal variability of PFOA contamination by selecting three bedrock wells close to ChemFab with different initial PFOA concentrations (Schroeder et al., 2021). The three wells selected lie within 250 m of one another and are all within 330 m of the former ChemFab facility. They had initial PFOA concentrations of 7.1 ppt, 82 ppt, and 2,090 ppt on March 1, 2016. Each well was sampled between seven or eight additional times between March 2016 and July 2017 (Schroeder et al., 2021).
The concentration of PFOA varied over the 1.5-year sampling period, but the total variation of each well did not cross the ranges of the other two wells (Schroeder et al., 2021). These results indicate that spatial variation is much greater than temporal variation for PFOA concentrations in the FRA. The high spatial variation is likely due to long-term, structural variation in flow patterns rather than short-term turbulence in the system (Schroeder et al., 2021).
The contamination and well testing area lies in the northern half of the Town of Bennington (Figure 4); this area is referred to as the “detailed” field area (see yellow rectangle on Figure 4). The “full” field area also includes the western half of the Town of Woodford, as well as the southernmost part of the Town of Shaftsbury, and extends eastward into the Green Mountains. The “detailed” field area is where new geologic mapping was completed, whereas the “full” field area includes existing mapping for regional context. In addition to this work, there are three previous bedrock geologic studies of the Bennington area (MacFayden and J.A., 1956; Potter, 1971; Ratcliffe et al., 2011).
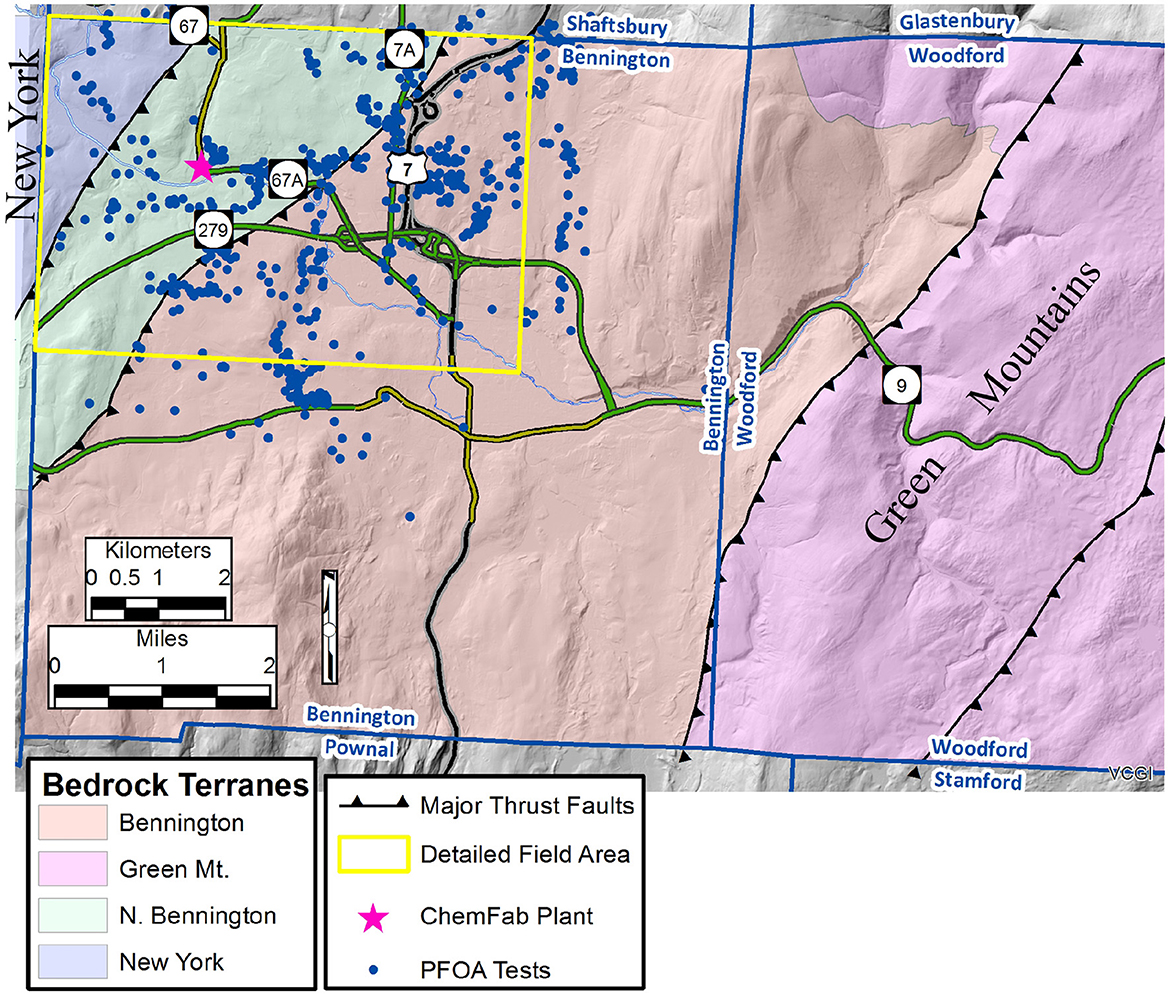
Figure 4. Simplified bedrock geologic of the extended field area (modified from Ratcliffe et al., 2011), the detailed field area (yellow rectangle), and the wells tested for Perfluorooctanoic Acid (PFOA) between 2016-2019 (Vermont Dept. of Environmental Conservation, n.d).
The full field area is comprised of four east-dipping thrust fault-bound slices, which are from west to east and structurally lowest to highest (informally named):
1) New York- Middle-Late Ordovician phyllites and limestones,
2) North Bennington- Late Cambrian-Middle Ordovician dolostones and limestones,
3) Bennington- Cambrian dolostones and quartzites,
4) Green Mountain- Precambrian gneisses and schists.
The Breese Hollow Thrust separates #1 and #2; the Green Mountain Frontal Thrust separates #2 and #3; and an unnamed thrust fault separates #3 and #4 (Figure 5).
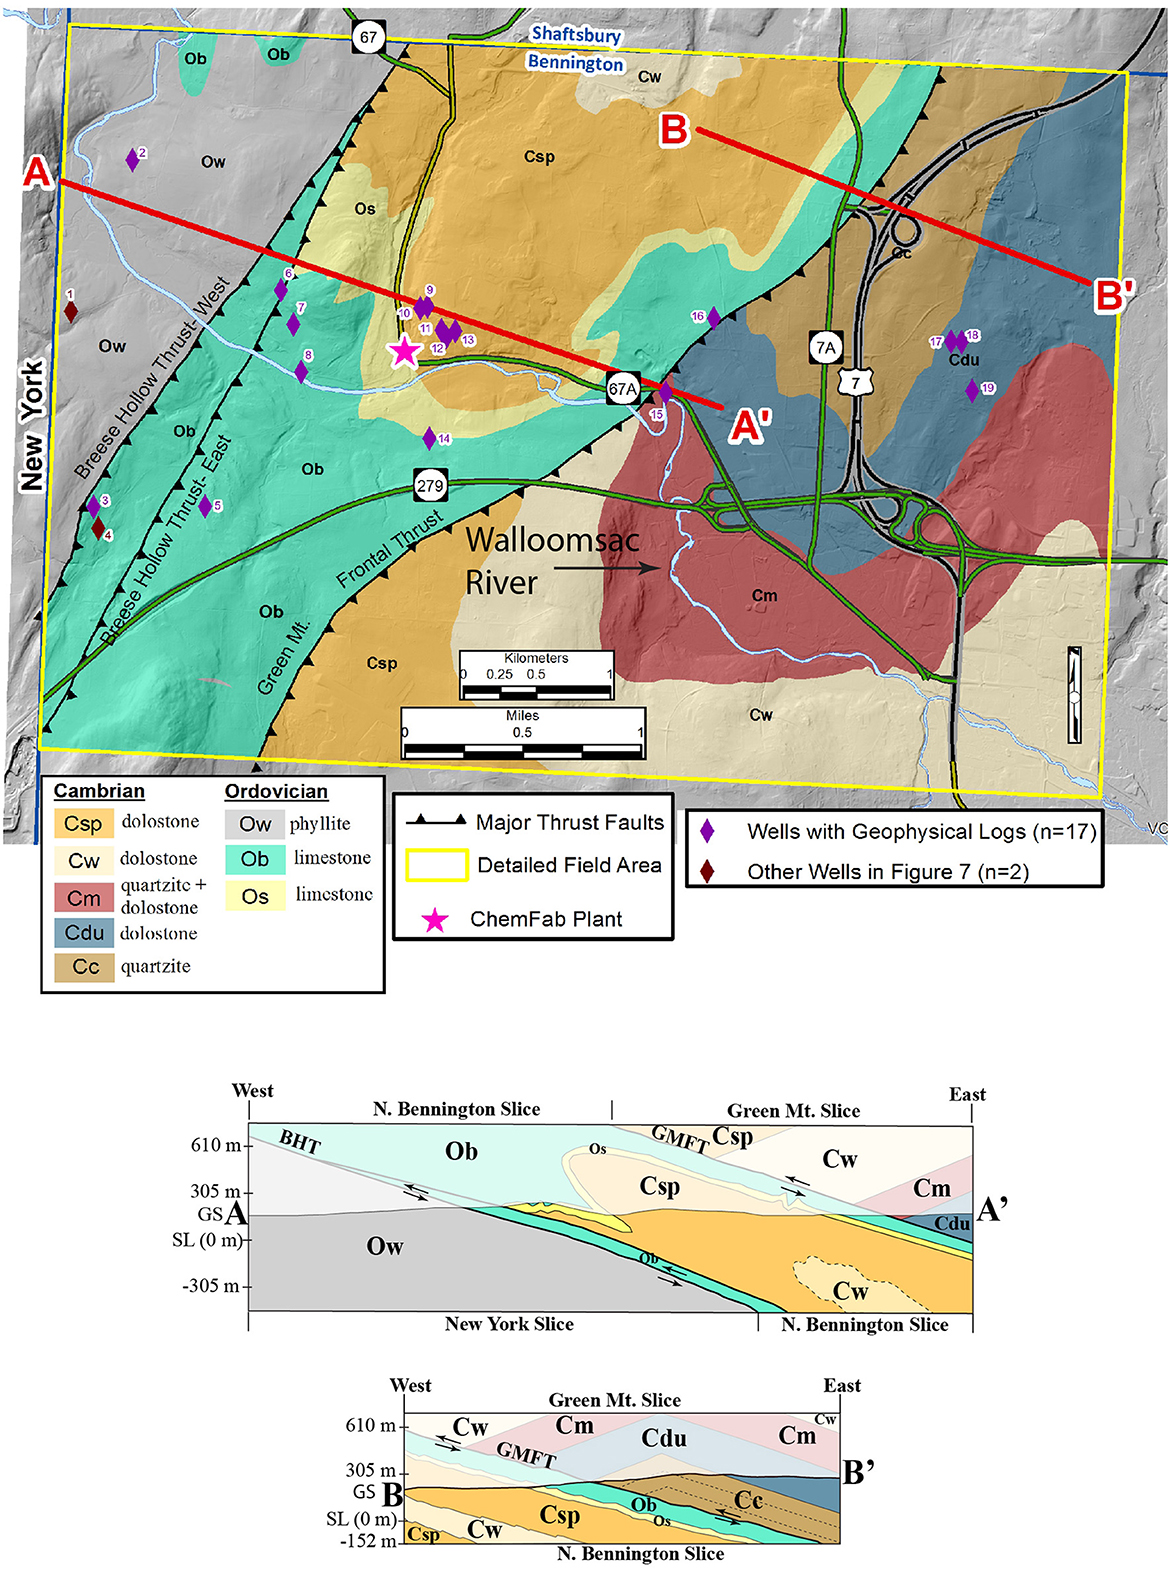
Figure 5. Bedrock geologic map of the detailed field area with lines of section, A–A′ and B–B′, and locations of wells logged with geophysical equipment. Cross sections are below. See text for details.
The detailed field area in Figure 5 (Kim, 2017a) shows individual formations and map-scale anticlines and synclines within the thrust slices. The Breese Hollow Thrust (Potter, 1971) is divided into subparallel east and west splays. The folding and faulting are presumed to be associated with the Taconian Orogeny (Ordovician) (Ratcliffe et al., 2011), but reactivation during the Acadian Orogeny (Devonian) cannot be discounted. All lithologies were weakly-metamorphosed.
The cross sections in Figure 5 show that the slices (and sedimentary bedding) dip shallowly to the east, are folded into map-scale anticlines and synclines that plunge shallowly southward (~15 degrees) and are truncated by the thrust faults, likely indicating folding was synchronous with thrusting. The New York slice is the structurally lowest, the North Bennington slice is intermediate, and the Bennington slice is structurally highest. Deformed bedding is the dominant ductile structure in the North Bennington and Green Mountain slices whereas crenulation cleavage is dominant in the New York slice.
Fractures (or joints) throughout the field area were measured (n = 3,251) and divided into 20 separate geographic domains (Kim, 2017b). Based on frequency azimuth rose diagrams and equal area nets plotted using Daisy software (Salvini et al., 1999), the statistically dominant steeply dipping (> 60 degrees) fracture sets were calculated for each of these geographic domains. Generally, the four dominant fracture sets strike: N-S, NNE-SSW, NW-SE, E-W, and NE-SW. Many fractures in each set are filled with calcite or calcite/quartz and could also be considered veins or vein-filled fractures. Fractures will be discussed in more detail in a later section. The NNE-SSW fracture set is likely a fracture cleavage that is axial planar to the map-scale anticlines and synclines in brittle lithologies such as quartzites and dolostones; these fractures are also ~parallel to the thrust faults.
In carbonate outcrops observed at the surface, both brittle and ductile structures may be solution-enlarged by ground- and/or surface water. In addition, the contact zone between carbonate lithologies and overlying surficial deposits exhibits different degrees of weathering by groundwater. In summary, lithologic heterogeneity (carbonates vs. clastics) and structural anisotropy (bedding, cleavages, fractures, folds, and faults) must be considered when assessing the fate and transport of groundwater and contaminants in the FRA.
In the eastern half of the detailed area, driller's logs for many wells report thick ocher deposits overlying bedrock. An environmental consulting report (McLaren-Hart Environmental Engineering Corp, 1997) reports that ocher, which they call “saprolite,” are “dry, stiff, silt-clay matrix material containing sand to gravel-sized rock fragments.” Other ocher-like horizons were also reported in the same area (Barr Engineering, 2018). The entire interval of unconsolidated incompetent ocher in a well, which can be up to 91 m thick, must be cased to prevent collapse. Ocher deposits, which are associated with kaolinite clay, were mined for iron and manganese in the Bennington area (Burt, 1928; McLaren-Hart Environmental Engineering Corp, 1997). The origin of these deposits is controversial and could involve pre-glacial in situ chemical weathering of bedrock (Burt, 1928) or transport of allochthonous hydrothermal solutions from deeper structural levels following faults and fractures that deposit kaolinite in these structures and alter the surrounding bedrock (Ogden, 1969). The transmissivity of ocher is likely low, so that it retards groundwater flow.
As part of the physical aquifer characterization effort, the surficial geology of the contamination area was also mapped (DeSimone, 2017, 2018) to complement the bedrock geology, spatial analysis of wells, and geophysical well logging components. In general, the upland areas are covered by Pleistocene till, an unstratified, ice-derived, unsorted deposit composed of silt, boulders, gravel, and sand; whereas valley areas are filled with coarse-grained Holocene alluvial and fluvial deposits comprised by sand, silt, and gravel. Subordinate Pleistocene ice-contact deposits, such as outwash, kame, kame terrace, and kame moraine comprised of sand and gravel partially fill some valleys. Pleistocene morainal deposits that have a hybrid composition of till and ice-contact sand and gravel occur on the flanks of some hills. Based on permeability, the potential of surficial deposits to recharge the FRA in the contamination area from highest to lowest as: (1) kame moraine and outwash, (2) kamic sediment, moraine, eroded till, fluvial terrace deposits, and alluvium, (3) thin till overlying bedrock, and (4) thick impermeable till (DeSimone, 2017, 2018). In the following section, we use overburden thickness from well logs to construct isopach and bedrock surface isopach maps, however, we have yet to use the permeability of surficial deposits in our analyses.
Seven shallow monitoring wells, located between 400 m and 1,200 m from the ChemFab factory, were drilled in 2017 and 2018 after the discovery of PFOA in the area (Schroeder et al., 2020) (Figure 2). All well boring sites are between 30 m and 50 m in elevation above the ChemFab factory, have total depths ranging from 3.5 m to 6.7 m, and are screened at the shallow water table within glacial till. From multiple sampling events over 3 years, the average PFOA concentration in the wellwater ranges from 180 ppt to 2600 ppt (Schroeder et al., 2020). Three of these wells are drilled close to one another (80 m) near the top of Bingham Hill, ~1 km northeast of ChemFab. There is high spatial, but low temporal variability in PFOA levels between closely-spaced (80 m) wells located with screens that are set at the same depth horizons (Schroeder et al., 2020).
Given that the elevations of the groundwater in these shallow wells are considerably above the ChemFab factory site, it is unlikely that PFOA contamination in groundwater migrated directly upward to these wells from this factory (Schroeder et al., 2020). The most reasonable explanation for the shallow groundwater contamination is that air-deposited PFOA from factory emissions was sequestered in soil, and is slowly leaching to infiltrating groundwater (Schroeder et al., 2020). This zone likely recharges the till and fractured rock aquifers and continually contributes legacy PFOA from soils and shallow surficial deposits to groundwater to this day (Schroeder et al., 2020).
By correlating well locations with well driller logs (data on well depth, overburden thickness, well yield, static water levels, and casing depth) in the study area, bedrock surface contour, isopach, and potentiometric surface maps were produced using GIS software (Kim and Dowey, 2017). All these maps integrated LiDAR-derived ground-surface elevation data with the well logs.
The primary purpose of the bedrock-surface contour (BSC) map (Kim and Dowey, 2017) for the detailed area was to determine if linear features could be correlated with bedrock structures (Figure 6). To “ground-truth” whether the linear features on the BSC map could be correlated with brittle structures (fractures) and ductile structures (thrust faults), the statistically dominant steeply-dipping (> 60 degrees) fracture sets for geographic domains on the fracture map (Kim, 2017b) were superposed on this map along with the thrust faults (Figure 6).
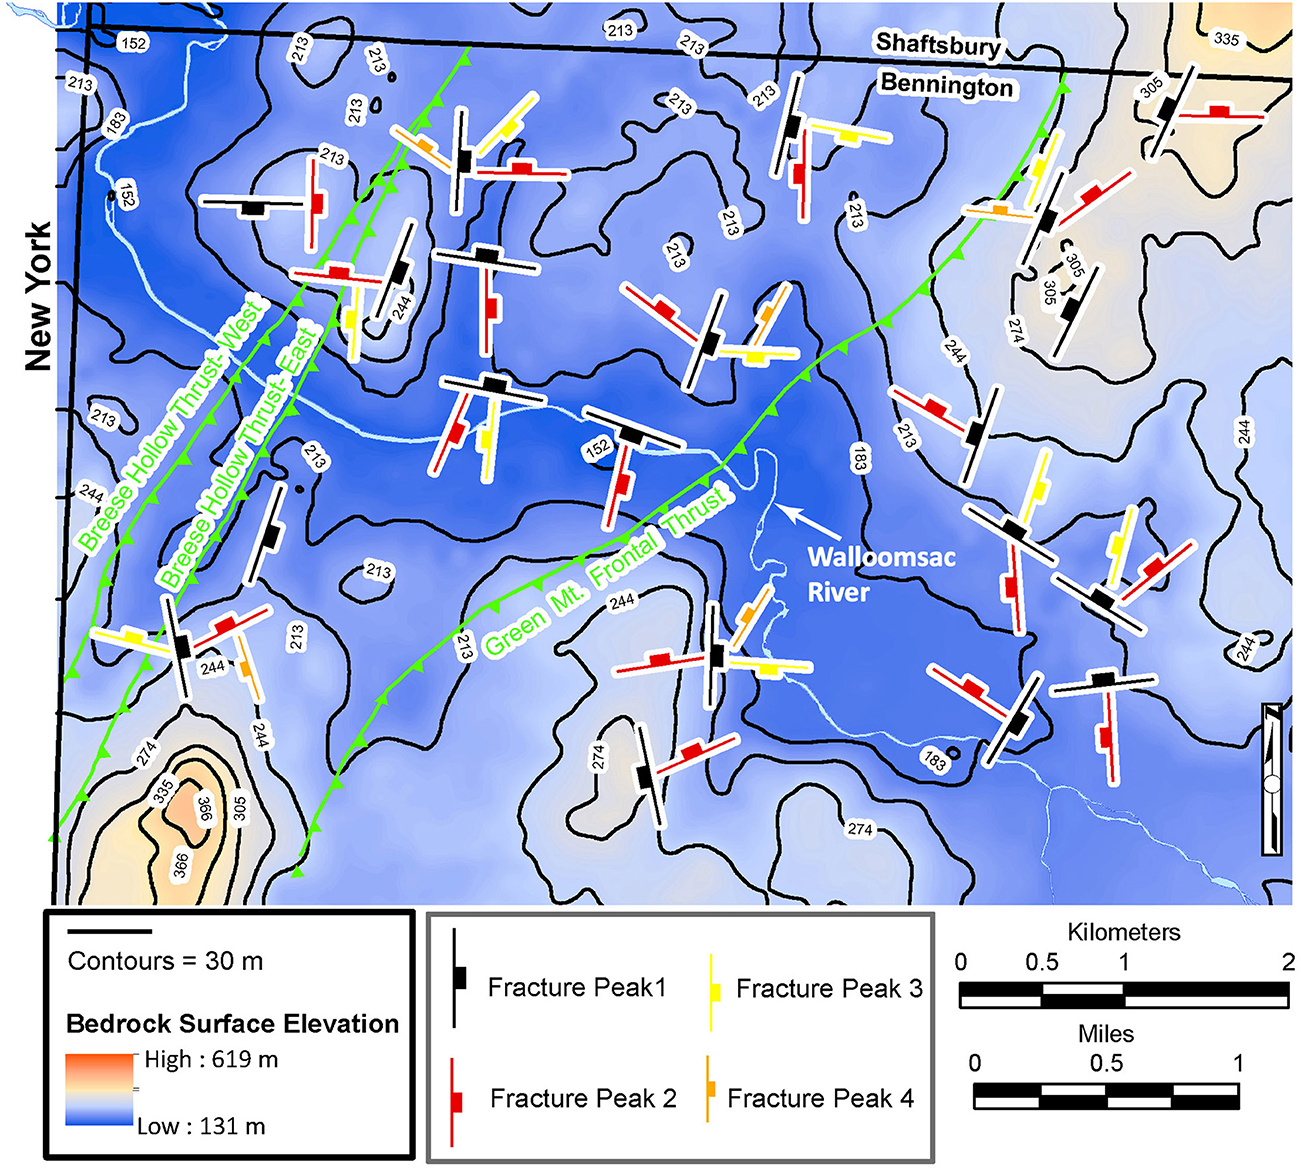
Figure 6. Bedrock surface contour map of the detailed field area showing the dominant steeply dipping fracture azimuths (peaks) for each domain, as determined from Daisy (Salvini et al., 1999) frequency azimuth rose plots (Kim, 2017b). This software calculates the most abundant gaussian fracture peaks, with standard deviations, for each domain. From most abundant to least abundant, the fracture symbols are color-coded black, red, yellow, and orange, respectively. The topography of the bedrock surface strongly reflects the dominant fracture sets. Map constructed from overburden data in bedrock well logs (Vermont Agency of Natural Resources, 2023), bedrock outcrop data (MacFayden and J.A., 1956; Kim, 2017b; DeSimone, 2018) and light detection and ranging (LiDAR) elevation data. See text for details.
The Walloomsac River valley, which represents the lowest elevations in the region, has distinct N-S and E-W segments (Figure 6), as well as intersecting N-S valleys, some that are filled with anomalously thick surficial deposits. Most orthogonal segments are parallel to either the N-S or E-W trending fracture sets, which form fracture intensification domains (FIDs). The NNE-SSW striking fracture set is parallel to the valley that is bounded by both segments of the Breese Hollow Thrust. Other fractures of this attitude are parallel to axial surfaces of major fold structures and both thrust faults (Figure 6). The NW-SE striking fracture set has a more subtle effect on the BSC surface by elongating some contours in that direction.
The isopach map for the detailed area shows how overburden thickness varies throughout the detailed field area (Figure 7A). Like the BSC map, the isopach map correlates strongly with the underlying bedrock structure. For example, thick (> 6 m) surficial deposits parallel the hanging wall of the Green Mountain Frontal Thrust and fill two fracture-controlled bedrock basins on the north side of the Walloomsac River. Thick surficial deposits are also present in the eastern one-third of the field area. Thicker surficial deposits may retard the downward movement of contaminants.
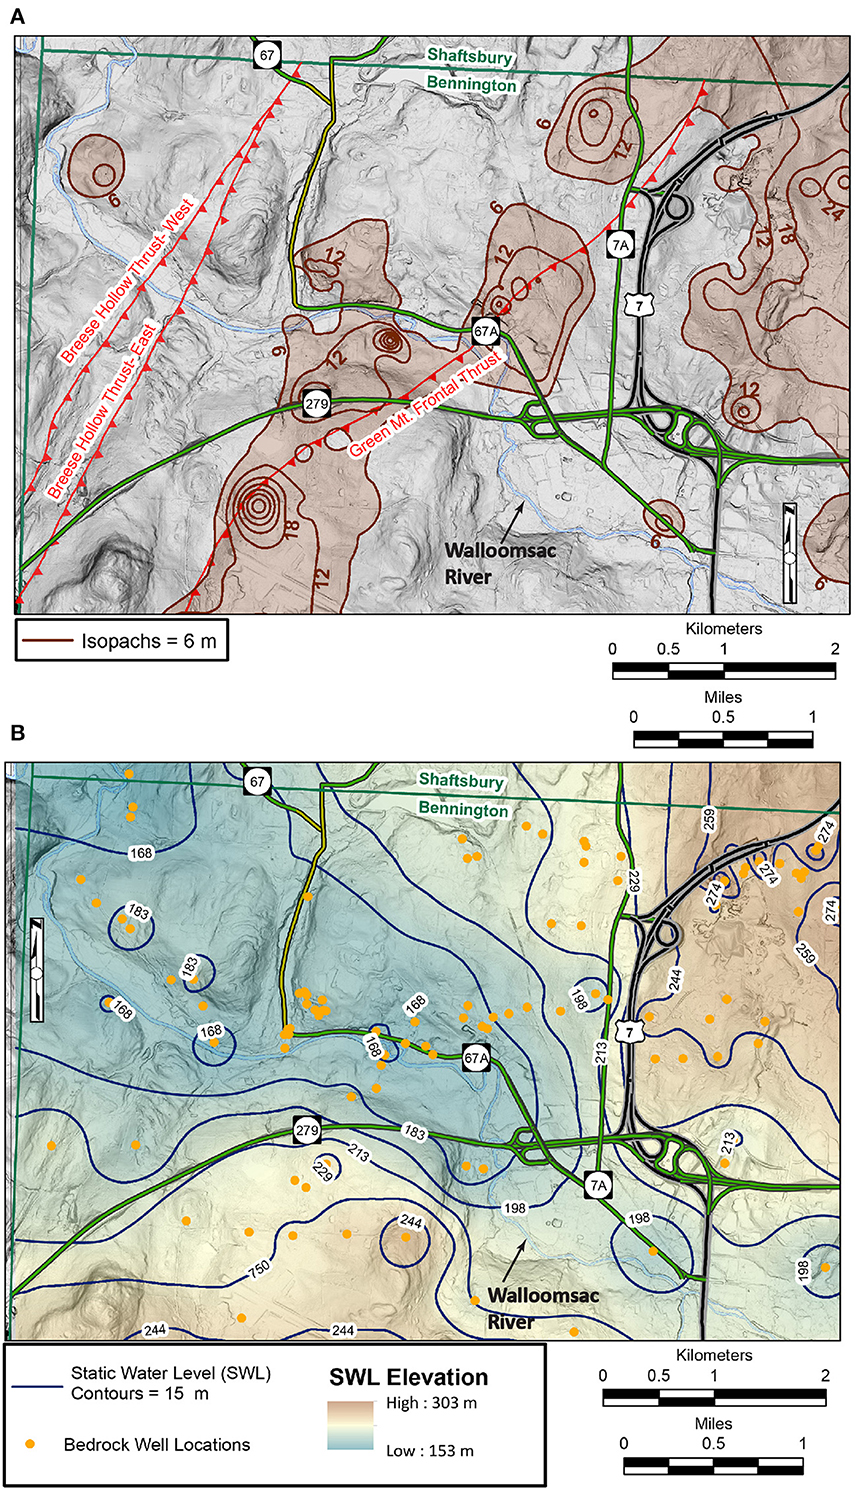
Figure 7. (A) Isopach map of overburden thickness for the detailed field area that was constructed from bedrock well logs and light detection and ranging (LiDAR) elevation data. See text for details. (B) Static water level contours for the bedrock aquifer in meters above sea level for the detailed field area that were constructed from bedrock well logs and light detection and ranging (LiDAR) elevation data.
The potentiometric surface contour map for the FRA in the detailed field area (Figure 7B) shows that groundwater in the FRA generally follows topography and flows toward the Walloomsac River valley; this over simplifies groundwater flow paths and will be discussed further in later sections. The data points used to create Figures 6, 7 are found in Supplementary Table 1.
A total of 17 domestic bedrock wells were logged for this study under ambient conditions after the pump and associated piping and wiring had been removed. The wells ranged in depth from 38–183 m. Composite WellCad plots were assembled from the logs for all wells and included: (1) temperature, (2) specific conductivity, (3) gamma, (4) caliper, (5) acoustic televiewer (AT), and heat-pulse flowmeter. Continuous borehole camera video was recorded for most of these wells. When available, driller's logs for neighboring domestic wells that were not logged with geophysical equipment were consulted. The purpose of this section is to summarize the logs of the wells that were most informative to understanding the hydrogeology of the contamination area.
Figure 8 is a summary of wells logged from west to east that shows well depth, elevation relative to sea level, overburden thickness, depth of casing, bedrock formation, water-producing structures, flow directions, and PFOA concentrations. The wells are grouped according to the structural position they occupy on the bedrock geologic map and cross sections of Figure 5. The W-E groupings of wells are based on whether they are completed: (1) In gray phyllites of the New York Slice west of the Breese Hollow Thrust's surface trace, (2) Through limestones in the hanging wall of the Breese Hollow Thrust into the New York Slice (foot wall), (3) In limestones of the western North Bennington Slice, (4) In dolostones of the eastern North Bennington Slice, (5) Through phyllitic quartzites in the hanging wall of the Green Mountain Frontal Thrust into dolostones and limestones of the Bennington Slice (foot wall), and (6) In dolomitic quartzites of the Bennington Slice, where thick ocher zones are present.
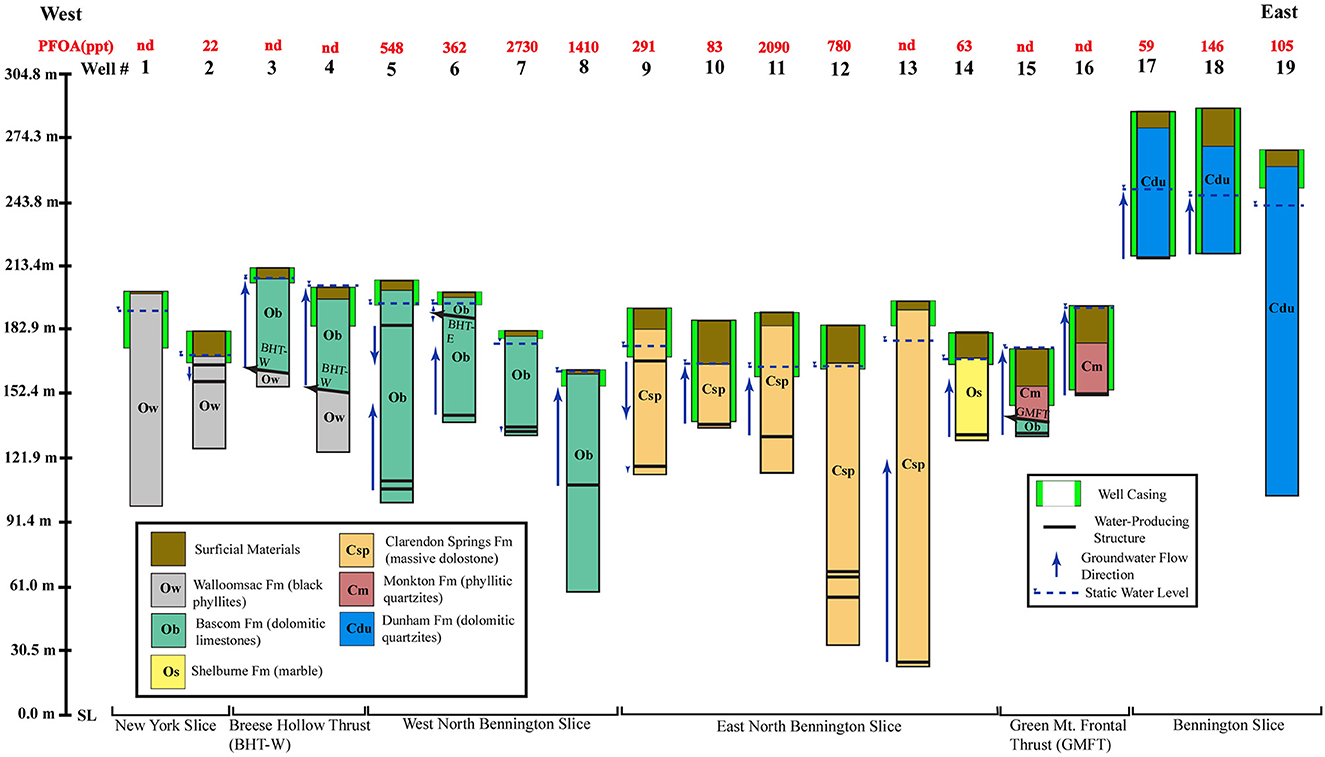
Figure 8. Summary of the geophysical logging of wells in the detailed field area. Wells are arranged by number and by bedrock slice in a west to east cross section, and show overburden thickness, casing depth, bedrock lithology, groundwater producing structure depths and borehole flow directions, and Perfluorooctanoic Acid (PFOA) concentrations. Elevations are in meters above Sea Level (SL). Breese Hollow Thrust- West (BHT-W); Breese Hollow Thrust—East (BHT-E); Green Mountain Frontal Thrust (GMFT). See text for details.
Vertical flow in the wells was measured using the Heat Pulse Flowmeter under ambient conditions. Under ambient conditions, groundwater exchange between water in the borehole and individual fractures intersecting the borehole is a function of the transmissivity of the individual fracture and difference in hydraulic head within the fracture and the water elevation in the borehole (Paillet, 1998). Flow within the open borehole has little effect on the surrounding aquifer (Paillet, 1998) or mimics the regional groundwater flow.
Wells #3-4 and #14-15 were drilled through the Breese Hollow and Green Mt. Frontal thrusts, respectively, where upward wellbore flow directly from the fault or fractures below it produced upward wellbore flow, and static water levels tended to be near or flowing at the surface (flowing artesian). Faults can be recognized at depth through the abrupt lithologic changes observed on gamma, acoustic televiewer, and borehole camera logs. In Well #14 a steeply-dipping, E-W striking fracture ~10 m below the Green Mt. Frontal Thrust (GMFT), presumably related to the Walloomsac River valley fracture zone, produced upward wellbore flow. In Well #15, a 1.2 m cavern at a depth of 40 m produced upward wellbore flow. Wells #14-15 had anomalously thick overburden because they were completed in a filled N-S trending bedrock basin that intersects both the GMFT and the Walloomsac River valley fracture zone. Well #6 penetrated the eastern segment of the Breese Hollow Thrust (BHT-E) at 12.2 m and weak borehole groundwater flow was both upward and downward from this structure.
Wells completed in the internal parts of the New York, North Bennington, and Bennington slices produce groundwater from bedrock structures (primarily bedding) at various depths in the aquifer and the flow directions in these wells were upward, downward, or bidirectional. Well #13 is the deepest well in this group and produced upward-flowing water from a steeply-dipping, E-W striking fracture at 172 m, which is part of the Walloomsac River valley fracture zone.
Two of the wells logged internal to the Bennington Slice have 61 m+ thick ocher horizons, and both produce groundwater from the bottom of the well. The third well has a 5 m weathered bedrock horizon near the surface that may be ocher and produced groundwater from 141 m.
As summarized on Figure 3, our aquifer characterization approach integrates the physical hydrogeologic components (geologic mapping, spatial analysis of wells, and geophysical well logging) with chemical hydrogeologic components (PFOA analysis, major and trace elements, stable isotopes, and recharge ages) to develop a four-dimensional model. Figure 9 shows the sample locations for: (1) PFOA (Figure 9A), (2) major and trace elements (Figure 9B), (3) stable isotopes (Figure 9C), including Bennington College surficial monitoring wells, and (4) recharge-ages (Figure 9D).
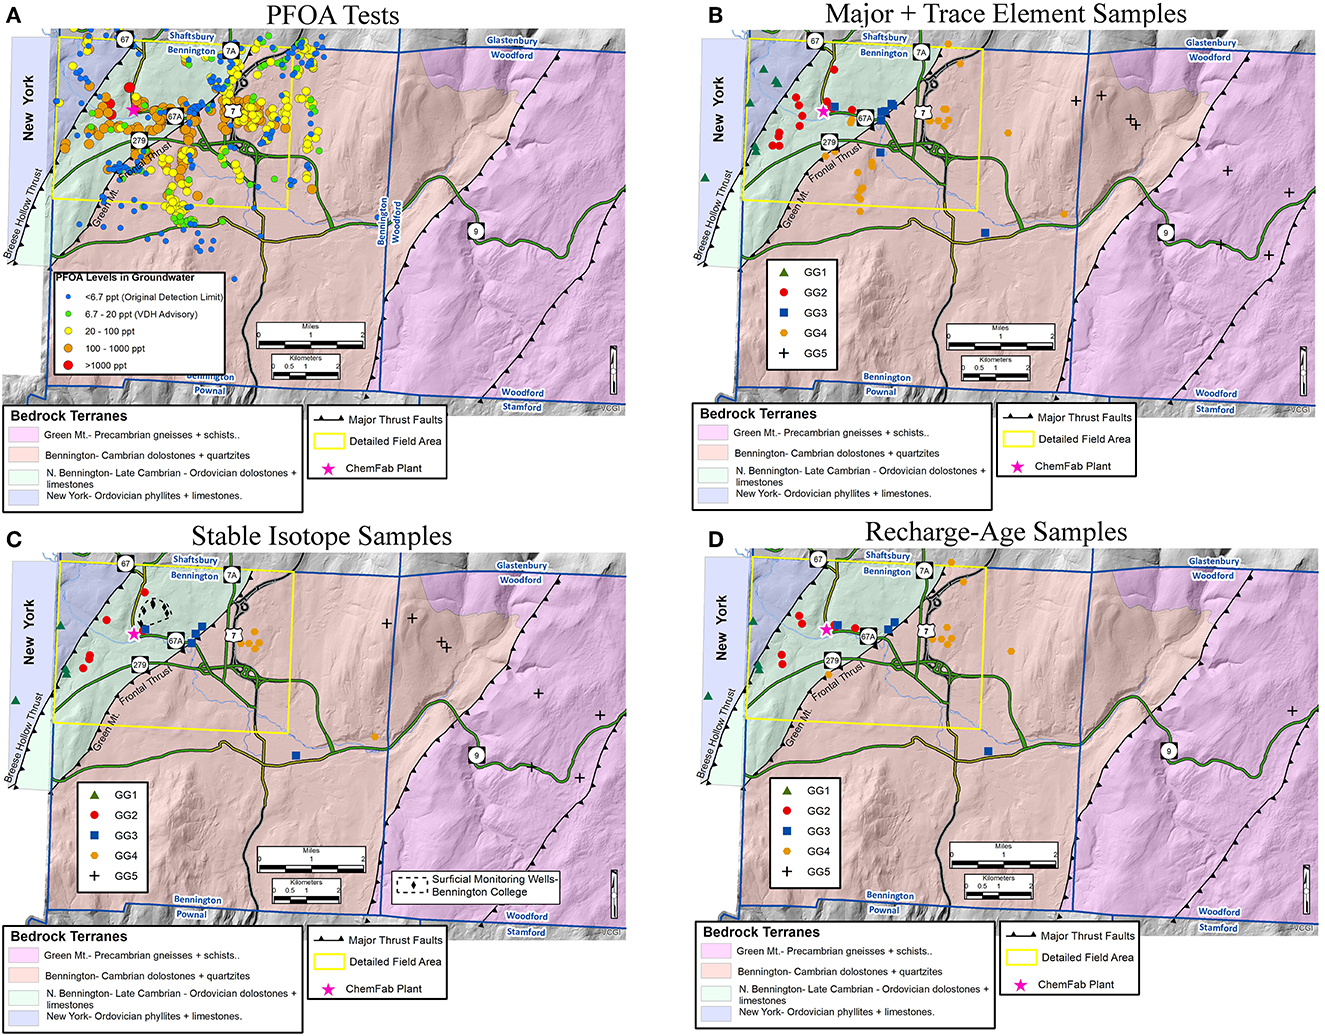
Figure 9. Location maps for chemical hydrogeological (tracer) analyses in the extended field area. Simplified bedrock geology modified from Ratcliffe et al. (2011). Wells and springs sampled for: (A) Perfluorooctanoic Acid (PFOA) between 2016-2019 (Vermont Dept. of Environmental Conservation, n.d), (B) major and trace element analysis, (C) stable isotopes, and (D) recharge-ages. Groundwater hydrochemical signatures that correspond to spatial location and bedrock type are shown in (B–D) as Geochemical Groups (GG) 1, 2, 3, 4, and 5. See text for explanation.
During this investigation, the VTDEC action level for PFOA in drinking water was 20 ppt (PFOA, n.d.). Of 628 wells (and springs) tested, 486 (77.4%) had detectable PFOA and 355 (56.5%) had PFOA concentrations > 20 ppt. The PFOA data were accessed in May 2019 from a VTDEC database (Vermont Dept. of Environmental Conservation, n.d). A reconnaissance-level examination of the complex fate and transport of PFOA in the contamination area is possible through the following sequence: (1) contour the PFOA results in groundwater and look for spatial patterns, (2) examine the spatial distribution of PFOA that occurred from air deposition from the ChemFab factory [air deposition envelope (ADE)], and (3) compare results between #1 and #2 (Figure 10) to see if the calculated PFOA air deposition patterns correlate with those in groundwater. Since > 80% of the wells in the Town of Bennington are bedrock wells, we are primarily concerned with the fractured rock aquifer (FRA) (Vermont Agency of Natural Resources, 2023).
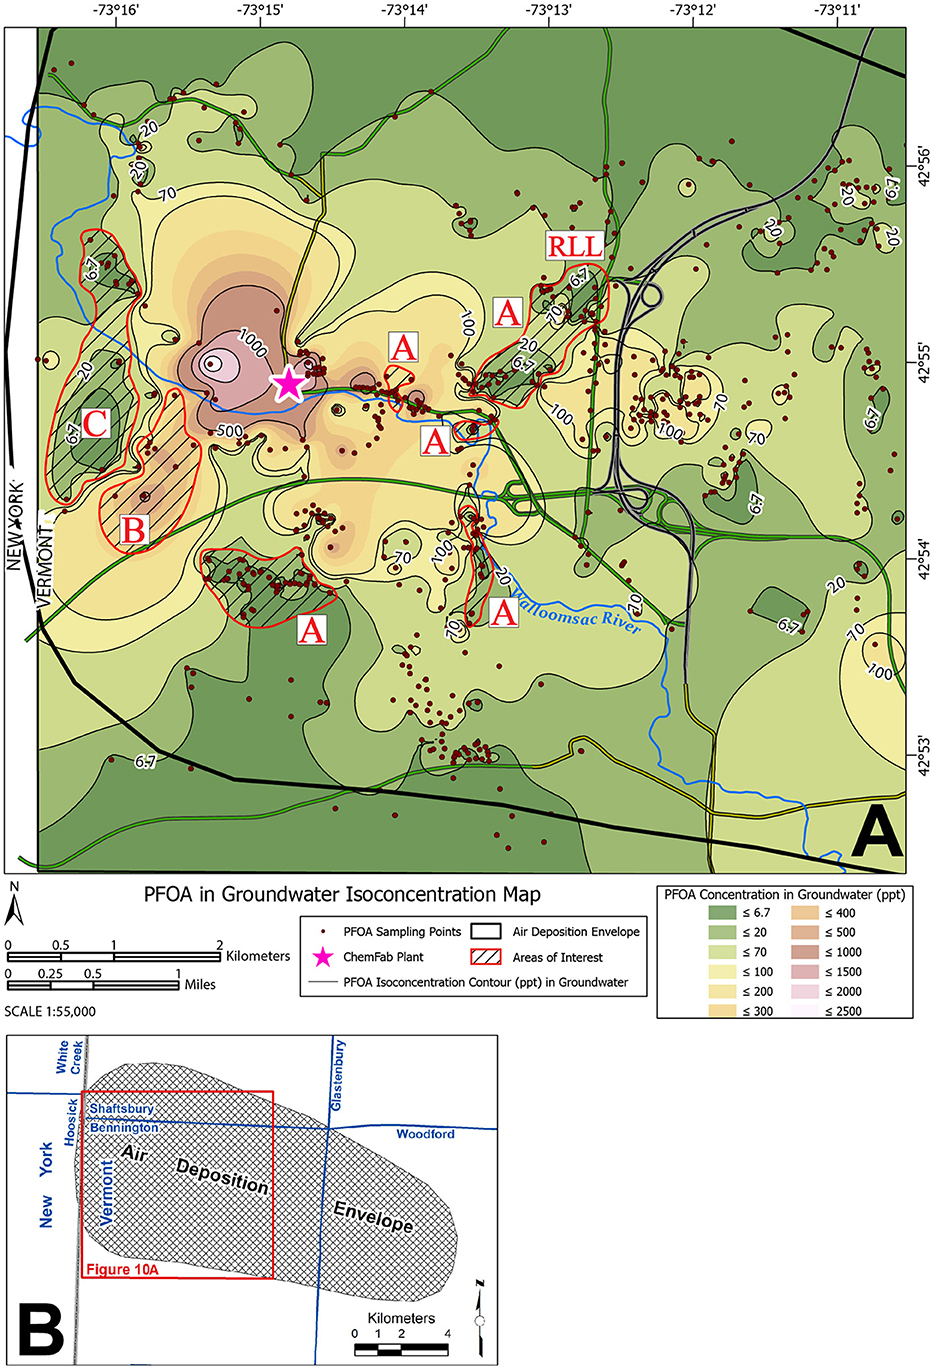
Figure 10. Color contour intervals for PFOA in groundwater overlain by an Air Deposition Envelope (ADE) for PFOA (black polygon) (A). See inset map (B) for the full extent of the ADE. The ADE is the approximate land area over which air airborne PFOA deposition was leached to groundwater in detectable concentrations. The envelope was delineated by extensive sampling of soil and shallow groundwater seeps/springs (Schroeder et al., 2021). Red polygons with black hachures are areas where: (1) Low PFOA areas within the groundwater contours separate higher PFOA areas (labeled with A), (2) Some high PFOA areas in the groundwater contours extend in a SW direction, which is at a high angle to the long axis of the ADE (labeled B), (3) Some low PFOA areas in the groundwater contours decrease abruptly from high PFOA areas (labeled with C). See text for details. RLL, Rice Lane Low is a low PFOA area.
The ADE is the approximated land area over which airborne wind-transported PFOA was deposited on the land surface and leached to groundwater in detectable concentrations. The envelope was delineated by extensive sampling of soil and shallow groundwater seeps/springs (Schroeder et al., 2021).
We compared the groundwater contours of PFOA with ADE and observed the following:
1) The overall elliptical shape, orientation, and extent of the groundwater contours are similar to that of the ADE (Figure 10).
2) There are low PFOA areas within the groundwater contours that separate higher PFOA areas (see areas of interest marked A on Figure 10).
3) Some high PFOA areas in the groundwater contours extend in a southwest direction, which is “against the grain” (at right angles) to the ADE (see area of interest marked B on Figure 10).
4) Some low PFOA areas in the groundwater contours decrease abruptly from high PFOA areas (see area of interest marked C on Figure 10).
Although the “Air Deposition Envelope” is not a perfect representation of the PFOA distribution in the contamination area, observations 2–4, which are marked on the caption of Figure 10 suggest that heterogeneous hydrogeological processes in the surficial and fractured rock aquifers likely play a role in the fate and transport of PFOA, beyond the air transport and deposition geometry.
Waters analyzed in this study (Supplementary Table 2) are predominantly calcium-bicarbonate trending toward intermediate. Low total dissolved solids (TDS), low-NaCl groundwater from the anomalously low PFOA zone is distinguishable from surrounding groundwaters that contain higher TDS and NaCl (and PFOA). The graphical analyses that were most useful in discriminating water types are shown in Figure 11, including a bivariate plot of [alkalinity/(K+SiO2)] vs. [Ca/SO4], a spider diagram that shows relative differences of water types relative to the average of all wells in the study area (N = 59), and a ternary diagram with axes of [alkalinity/(K+SiO2)], [Ca/SO4], and [Sr/Mg].
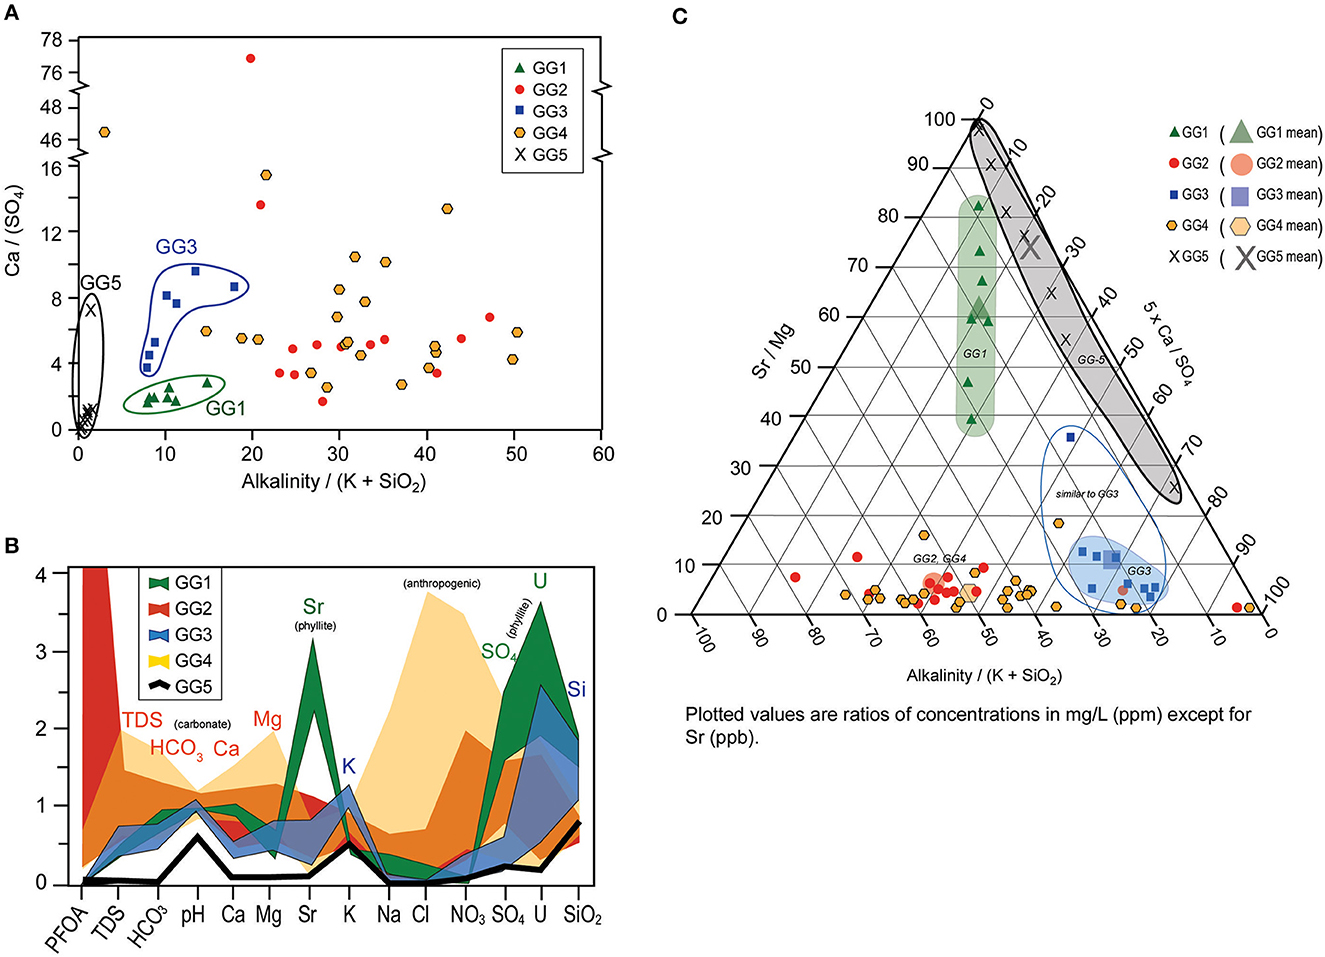
Figure 11. Major and trace element discrimination diagrams used to “fingerprint” Groundwater Groups (GG): (A) Ca/(SO4) vs. Alkalinity/(K + SiO2), (B) Multi-element “spider” diagrams, and (C) Sr/Mg, 5 x Ca/SO4, Alkalinity/(K + SiO2) ternary diagram. PFOA, Perfluorooctanoic Acid; TDS, Total Dissolved Solids. See text for details.
Groundwater hydrochemical signatures that correspond to spatial location and bedrock type are distinguished in Figure 11 as follows:
• Geochemical Group 1 (GG1) waters consist of a low Ca/SO4 signature and relatively low alkalinity (Figure 11A), high Sr, SO4 and U on a spider diagram (Figure 11B), and a unique field in the center of the ternary diagram in Figure 11C. These wells are associated with black slates and phyllites of the Walloomsac Formation in the western part of the study area (Unit Ow on Figures 5, 8; New York Slice on Figures 4, 9). PFOA is considered low in GG1, registering as non-detect (<6.7 parts per trillion [ppt]) in 6 of the 7 wells, with one well containing 22 ppt. Using a value of 3.35 (½ of the detection limit) to determine means, GG1 has mean PFOA concentration of 6.4 ppt and median of <6.7 ppt.
• Geochemical Group 2 and Group 4 waters (GG2, GG4) are typical of carbonate-dominated groundwater chemistry, with high alkalinity (Figure 11A), relatively high Na, Cl and NO3 and low SiO2 and U (Figure 11B) and a relatively distinct field on the ternary diagram that relates to high Ca and low Sr in these groups. Although compositionally similar, GG2 and GG4 occur in different zones within the aquifer system (Figure 9B), so are differentiated based on location. GG2 is considered to have high PFOA values, with mean (median) of 662 ppt (410 ppt) PFOA and a range of <6.7 to 2730 ppt. Wells in GG4 have medium-level PFOA values consisting of a mean (median) of 77 ppt (68 ppt) and range of <6.7 to 172 ppt.
• Geochemical Group 3 (GG3) is spatially situated between GG2 and GG4 and produces groundwater from wells in carbonate rocks (Figure 9B), but the chemical signature is quite distinct from GG2 and GG4 carbonate wells. GG3 wells have anomalously low alkalinity (Figure 11A) as well as low Ca and Mg, but notably high K and SiO2 compared to GG2 and GG4 carbonate wells. These anomalies cause GG3 wells to plot distinct from the carbonate-dominated well water of GG2 and GG4, and suggest influence from a source area rich in K and SiO2 and lacking Ca-Mg-CO3. PFOA is non-detect (<6.7) in all wells in this group.
• Geochemical Group 5 waters (GG5) are from springs and one well in the Green Mountain foothills to the east of the Bennington valley. Most notably, they plot with a very similar pattern to GG3 waters on Figure 11B, i.e., relatively enriched in K and SiO2 compared to GG2 and GG4. They are like GG3 waters on Figures 11A, B, and GG1 waters on Figure 11A. GG5 has low PFOA values, with mean (median) of 9.6 ppt (<6.7 ppt), and non-detect PFOA in 6 of 8 samples.
All groundwater sample δ2H-H2O and δ18O-H2O values plot close to the regional meteoric water line (Cole and Boutt, 2021; Vermont Dept. of Environmental Conservation, n.d) with varying isotopic compositions from−12 to−8 δ18O-H2O ‰ (Figure 12). The stable isotopic data can be found in Supplementary Table 3. See Figure 9C for all sample locations. The isotopic composition of the waters is distinguished by the varying amounts of heavy isotopes present in the waters. The Bennington College (BC) till well samples have the most enriched in heavy isotopic composition (more positive) with an internal sample range of ~1.5 δ18O-H2O ‰. The GG1 and GG2 groups vary by a similar amount (1.5 δ18O-H2O ‰) but are distinctly more depleted in the heavy isotopic composition. The GG4 samples have the smallest internal sample variability and cluster between the upper and lower end of the GG1/2 and BC till wells composition. The GG5 samples have the largest range (> 2 δ18O-H2O ‰) and also cover the whole range of non-till groundwater samples. They do not cluster but rather are distributed across this range. Compared to this distribution, the GG3 wells tightly cluster between−11 and−10.5 δ18O-H2O ‰ and are significantly more depleted than most other samples. The geochemical groups were defined based on elemental chemical components (not isotopic compositions), nevertheless there is some relation between the geochemical groups and the variability and isotopic composition of the waters.

Figure 12. Dual water isotope plot of all water samples reported here. Regional meteoric water line from 2 years of bi-weekly amount weighted precipitation isotope samples from across Massachusetts (Cole, 2019). Vienna Standard Mean Ocean Water, VSMOW. Inset—Box and whisker plot of δ18O-H2O values for the Geochemical groups and till wells. Box plots depict the minimum, first quartile, median, third quartile, and maximum. GG, Groundwater Groups; BC, Bennington College monitoring wells.
All water samples (except for GG5) were collected within a relatively narrow surface elevation band above sea level (ASL) (171–287 m) and show no statistically significant trend in composition with elevation. The till wells are the most enriched, show seasonal variability, and because they are water table samples, they likely range in direct vertical recharge conditions across the lower portions of the river valley. The most depleted isotopic compositions of the till samples are interpreted to be reflective of average cold-season recharge conditions along the valley bottoms (lower elevations). The overlap in the GG4 group and the most depleted till well samples suggest that the GG4 wells receive local, low-elevation recharge waters. GG1 and GG2 samples range from this enriched end member to depleted values and are interpreted to be mixtures of low-elevation and perhaps high-elevation recharge waters. The GG5 group waters range in elevation from 317–792 m ASL with a median value of 658 m ASL, with most of these waters being spring samples. Thus, these waters likely reflect high-elevation recharge waters with a mixture of cold and warm season recharge conditions. The GG3 samples are from wells ranging from 171–226 m ASL and plot in a distinct cluster apart from other low elevation well samples (e.g., GG1, GG2, GG44). These waters are isotopically distinct from the rest, with the exception of high elevation spring water samples of GG5. Thus, these GG3 waters likely reflect a source of recharge in the high-elevation to the east or are waters that were recharged to the FRA locally, but during a period with more depleted (i.e., colder) low-elevation recharge water. The relation between precipitation water isotopic composition and elevation was not statistically valid in the region (Cole and Boutt, 2021). This is likely due to the absence of higher elevation isotope precipitation samples. A local elevation-dependent isotopic analysis does not exist for the region (Cole and Boutt, 2021). The stable H2O isotope samples reflect source-water characteristics compared to the elemental geochemical information which is influenced by weathering and residence time characteristics.
CFC11, CFC12, CFC113, SF6, and tritium concentrations were analyzed from 25 groundwater samples in the field area to determine recharge ages (Figure 9D). Recharge-ages were not analyzed for all major and trace element geochemistry samples. All recharge-age data are presented in Supplementary Table 4 whereas USGS data alone is in a data release (Shanley et al., 2023). Average/Apparent recharge ages were calculated from the CFC concentrations using appropriate recharge temperatures and elevations and converted to year of recharge (Plummer and Busenberg, 2000). Figure 13A shows the recharge years with standard deviations for the samples from each geochemical group. Tritium data in tritium units (TU) are also plotted for the samples in each geochemical group in Figure 13B. The CFC and tritium data in Figures 13A, B are raw/unprocessed.
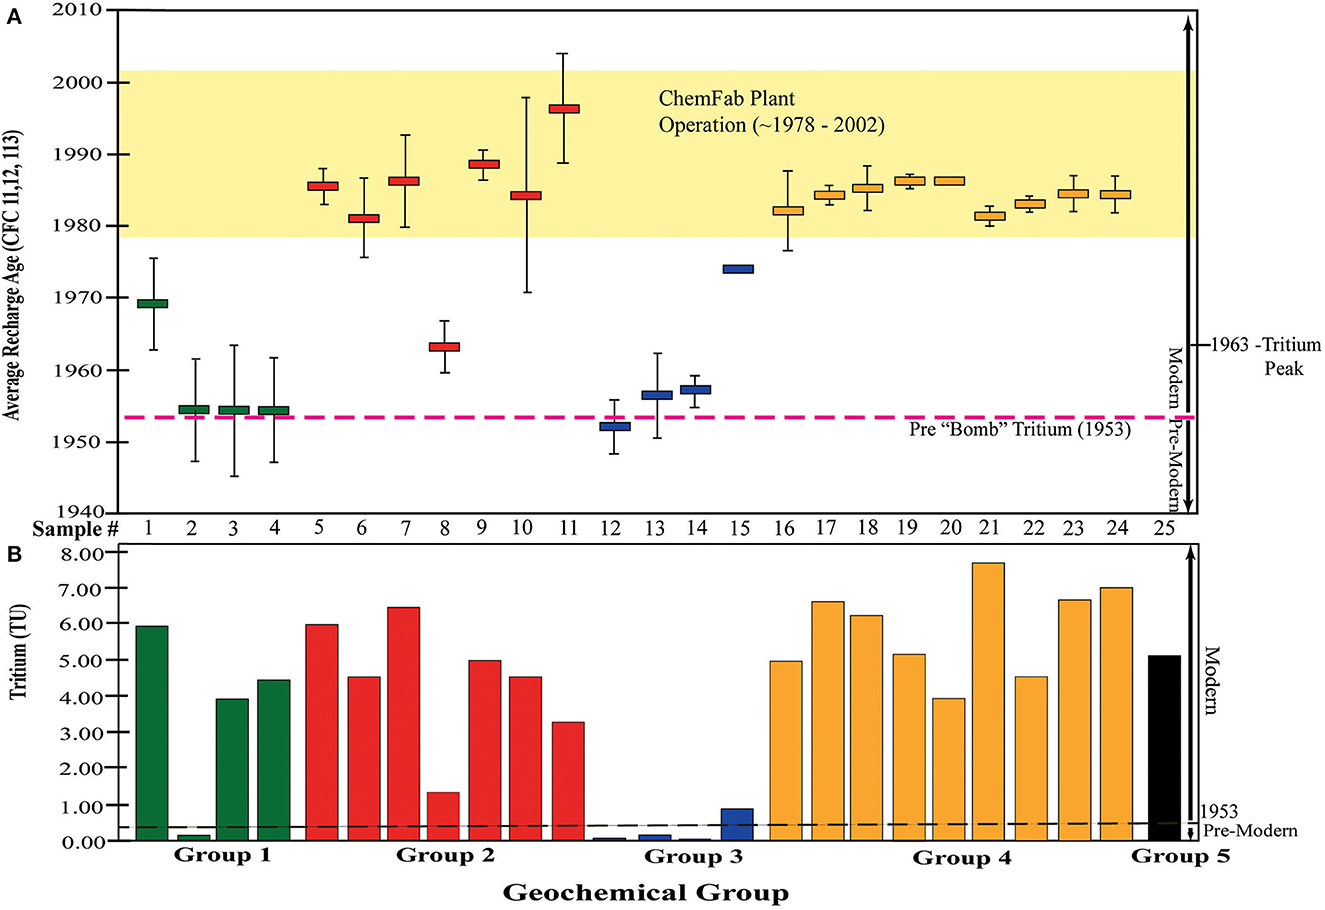
Figure 13. Groundwater recharge-age data by geochemical group for: (A) CFC11, CFC12, and CFC113 with error bars (standard deviations) and (B) Tritium in Tritium Units (TU). Pre-modern (pre-1953)/ Modern (post-1953) water lines modified from Plummer and Busenberg (2000) and Solomon and Cook (2000). See text for details.
Figure 13A generally shows “older” and “younger” CFC age groups, with the former being GG1 and GG3 and the latter GG 2 and GG4. Samples 12–14 in GG 3 and one samples in GG 1 plot below the approximate current tritium threshold for “modern” water (~0.2–0.4 TU, (Plummer and Busenberg, 2000), indicating recharge that predates the presence of tritium in rainfall from atmospheric atomic bomb testing in 1953 (Figure 13B). CFC data for these same samples indicate recharge around 1953. Pre-modern waters are older than 1953 and modern waters are younger than 1953.
Samples 3–4 also have CFC recharge ages near 1953, however, they also have much higher levels of Tritium (~4 TU), which suggests a modern source (s) of Tritium, possibly related, in part, to the 1963 Tritium peak in atmospheric precipitation (Figures 13A, B) (Solomon and Cook, 2000). Sample 1 has a much younger CFC age (1969) and a Tritium level of ~6 TU, indicating a significant component of modern water. Sample 15 has a CFC recharge-age of 1973, but a Tritium concentration of ~1 TU, indicating a significant proportion of modern water.
With one exception, all GG2 and GG4 samples have younger CFC recharge-ages that range from ~1980–1992, which fall within the timeframe of ChemFab plant operation (Barr Engineering, 2018) (Figure 13A). Tritium abundances of ~4–7 TU also indicate modern water. Sample 8 in GG2 has an older CFC recharge age of 1962 and Tritium level of ~1 TU that suggests a mixture of pre-modern and modern waters (Figure 13B).
This study followed a comprehensive aquifer characterization approach in which a three-dimensional physical model of the aquifer(s) was built (geologic mapping, the spatial analysis of domestic wells, and geophysical logging) and used as a framework for tracing the behavior of chemical groundwater tracers (PFOA, major and trace elements, stable isotopes, and recharge-ages). This integration converted the spatial three-dimensional framework into a temporal four-dimensional model (Figure 3). The names of the major thrust faults and lithotectonic slices are simplified in the following sections and figures as follows: Breese Hollow Thrust = Thrust Fault 1; Green Mountain Frontal Thrust = Thrust Fault 2; New York Slice = Slice A; North Bennington Slice = Slice B; Bennington Slice = Slice C; and Green Mountain Slice = Slice D.
The FRA is complex and is composed of four lithotectonic slices of clastic and carbonate metamorphic rock that are bounded by three shallowly east-dipping thrust faults (Figure 14). Based on the major and trace element discrimination diagrams and spider diagrams of Figure 11, the field area can be divided into five spatially distinct geochemical groups (GG), which reflect groundwater-rock interaction with different lithologies and anthropogenic contaminants. The spatial extents of the geochemical groups are shown on Figure 14 and are defined by: (A) GG2 and GG4 waters are carbonate-dominated (TDS, Ca, Mg, HCO3); (B) GG1 waters reflect pyrite-rich shale (Sr, SO4, U); (C) GG3 waters indicate contact with siliceous and micaceous rocks (SiO2, K); and (D) GG5 is similar to GG3, in that K and SiO2 are relatively dominant, but at much lower concentrations. Despite both GG2 and GG4 having a carbonate signature, GG4 waters can be distinguished from those of GG2 based on higher Na, Cl, and NO3; this suggests greater anthropogenic input from road salt and/or septic tanks or farms.
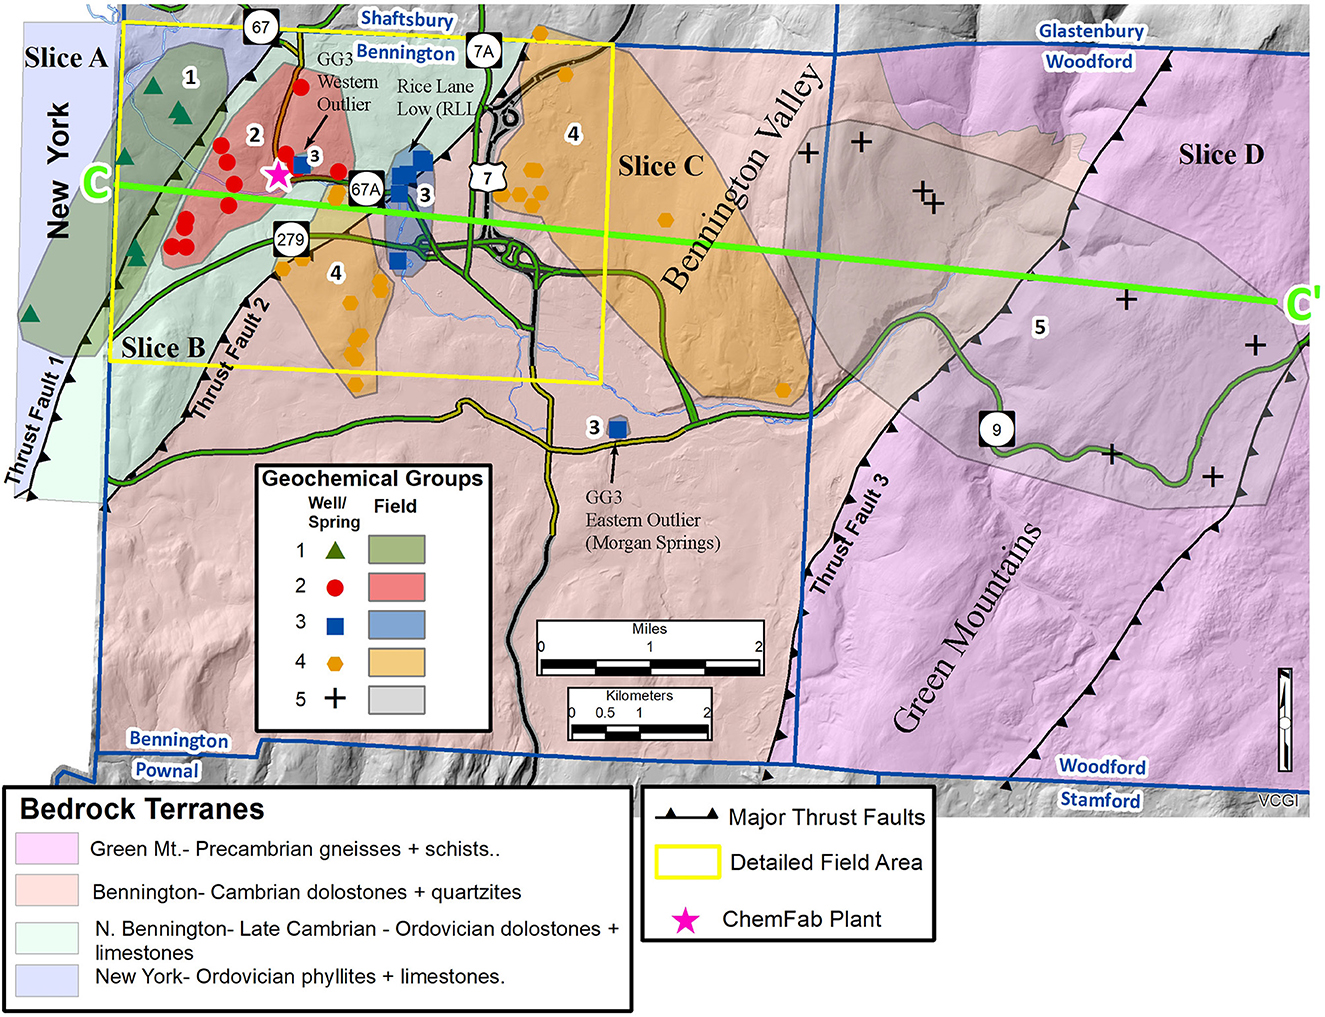
Figure 14. Conceptual Site Model (CSM) map showing the generalized bedrock geology and thrust faults for the extended field area, color-coded groundwater geochemical groups, and the C–C′ line of section for the Figure 15 cross section. Simplified bedrock geology modified from Ratcliffe et al. (2011).
Based on geophysical logs and bedrock geologic maps, GG1 and GG3 are located on or near thrust slice margins whereas GG2, GG4, and GG5 are situated in the internal parts of thrust slices or, when near a thrust fault, only penetrate to shallow depths. Some wells in GG1 and GG3 were completed through Thrust Fault 1 and Thrust Fault 2, respectively, and explain a great deal about the “plumbing” in the fractured rock aquifer in the field area.
Two GG1 wells were completed through the carbonates in the hanging wall of Thrust Fault 1 (Slice 2) and into rusty gray phyllites of the foot wall (Slice A) (wells 3 and 4, Figure 8). Whereas well 3 has a static water level within 6 m of the ground surface, well 4 is a flowing artesian well. Both wells have upward borehole flow from the thrust zone, a Sr, SO4, U geochemical signature, a variable stable isotopic signature, non-detectable PFOA, and average CFC recharge ages of 1953. This groundwater recharged in the highlands on the New York side and flowed within the FRA along foliations and/or fractures to Thrust Fault 1, where it was intercepted. Other GG1wells tapped water with the same chemical characteristics in the Slice A west of this thrust fault. Geophysical logging of the thrust wells demonstrates that Thrust Fault 1 is a conduit for groundwater flow, likely because of the strong hydraulic conductivity contrast between the carbonates of the foot wall and the phyllites of the hanging wall.
GG2 wells were all completed within the interior of the Slice 2 and have a carbonate signature (TDS, Ca, Mg, HCO3), high PFOA concentrations (mean = 662 ppt), mixed stable isotopes, average recharge ages coincident with the factory operation (1978–2002), with one exception for a sample with an older recharge age (1962) and PFOA below detection limits. From geophysical logging, two of these wells had upward and downward borehole flow from separate structures, two wells had downward borehole flow only from a single structure, and three wells had upward borehole flow only from a single structure. The USGS modeled the recharge ages of groundwater from some of these wells using TracerLPM (Jurgens et al., 2014; Shanley et al., 2018) and found that all were a mixture of younger and older water.
GG3 wells have a K-Si geochemical signature; non-detect PFOA levels; depleted stable isotopes; and recharge ages that range from 1952–73, although ages for four of five samples only range from 1952–57. GG3 groundwater is mostly present in wells from the “Rice Lane Low” (RLL) PFOA area, but spatial outliers of this water group occur significant distances to the west and east from the RLL.
The RLL area is within a neighborhood that overlies a N-S striking bedrock basin that is filled with thick (> 18 m) overburden. The wells in this zone are shallow (<61 m) bedrock wells that are cased through the overburden, and some are characterized as flowing artesian. This basin is the northern extension of a fracture zone that controls the course of the Walloomsac River and intersects an E-W fracture zone downstream to the west. Geophysical logging of one of the wells in the RLL (well #14, Figure 8) showed that groundwater entered the well along an E-W fracture 6.5 m below Thrust Fault 2, which juxtaposes rusty weathering black phyllitic quartzites with carbonates. A second well that was logged produced upward flow of water from a sub-horizontal cavern at 41 m, possibly related to Thrust Fault 2.
Two GG3 water zones are located outside of the RLL area: a well located 1.6 km west of the RLL (and within an area of GG2 wells) and a spring (Morgan Springs) 3.2 km southeast of this RLL zone. The western outlier well produces groundwater from an E-W fracture at 174 m below the ground surface, which is presumably part of fracture zone controlling the course of the Walloomsac River at this longitude. Morgan Springs has been used as a water supply for the Town of Bennington for many decades. This flowing spring formerly emerged directly from bedrock until it was covered over relatively recently (Wagner, 1987). The bedrock structural control for groundwater flow to Morgan Springs is not known.
The spaced distribution of GG3 waters in the study area indicates that structural control in the FRA is likely important, particularly fracture zones and thrust faults. The K-Si signature, which is derived from interaction with siliceous and micaceous rocks, along with the very depleted stable isotopes, and the older CFC and tritium recharge-age dates, suggest long flow path and residence time groundwater travel from recharge to discharge, making the Green Mountains the likely recharge area. In fact, this groundwater recharge area was corroborated through a steady-state regional groundwater flow model using MODFLOW 2005, which simulated groundwater flow in the FRA of Bennington, and found that the Barney Brook watershed, (directly east and southeast of Morgan Springs), is the simulated recharge zone for this spring in the foothills of the Green Mountains (Larkin, 2019). This type of recharge could be considered mountain front or block recharge (Wilson and Guan, 2004), depending on its source.
GG4 waters have a carbonate geochemical signature (TDS, Ca, Mg, HCO3), but differ from GG2 based on higher Na, Cl, and NO3; medium PFOA levels (mean = 77 ppt), variable stable isotope patterns, and average recharge ages spanning from 1981–86. On the Figure 14 summary map, GG4 wells straddle the Rice Lane Low, which is spatially associated with Thrust Fault 2 and an intersecting N-S fracture zone. The elevation of the eastern body of GG4 wells nearly reaches the foothills of the Green Mountains. The GG3 Morgan Springs is situated generally south and east of the GG4 areas.
GG5 wells and springs are located the farthest to the east in the field area and span topographically from the foothills to the core of the Green Mountains. These waters have a K-Si geochemical signature that is similar to that of GG3 waters, but at much lower concentrations. Some GG5 waters also have a depleted stable isotopic signature that falls in the same field as GG3 samples. We believe that GG3 and GG5 are spatially and temporally related, with GG5 waters being the precursor for GG3 waters via long flow paths and residence times from recharging in the Green Mountains to discharge in Morgan Springs (3.2–6.4 km), or interception by wells in the RLL (9.7 km), or the western outlier well within GG2 wells (11.3 km). The C'-C topographic gradient descends rapidly from the core of the Green Mountains to the RLL in the Bennington Valley. This direction is also parallel to the dominant fracture sets, which strikes E-W. In addition to the topographic/fracture gradients, it is also possible that GG3 water moves along Thrust Fault 2 from the north to south toward the Walloomsac River Valley. The surface expression of this thrust fault rises 213 m as it moves northward.
“The major processes controlling groundwater flow in intermontane basins are poorly understood, particularly in basins underlain by folded and faulted bedrock and under regionally realistic hydrogeological heterogeneity” (Ball et al., 2013, p. 6788). In fact, “mountain-front recharge” is described as the input of mountainous provinces to recharge in neighboring basin aquifers, in semi-arid and arid climates (Wilson and Guan, 2004). Although the Green Mountains of Vermont are much older and topographically subdued relative to southwestern mountains, the total relief of mountains vs. valleys in Vermont and New England often exceeds 610 m, supporting these hydrologic divisions. From lowest to highest elevations, this type of hydrologic region is comprised of the basin, the mountain front and the mountain block. The relief of a mountain block can be generated through tectonic processes such as thrust faulting, normal faulting, or volcanic eruption (Wilson and Guan, 2004). The location of the mountain front is where the mountains meet the piedmont (Wilson and Guan, 2004). Mountain-front recharge is defined as infiltration from streams and springs near the mountain front through the vadose zone into surficial and fractured rock aquifers, whereas mountain-block recharge is only “subsurface inflow from the adjacent mountains” (Wilson and Guan, 2004, p. 4).
The RLL (GG3) is situated between the areas of GG2 and GG4 groundwater types (Figures 14, 15), but has markedly different geochemistry and recharge ages. Morgan Springs (GG3) sits to the southeast of most GG3 wells and to the west of GG5 wells and springs. If Morgan Springs and RLL waters are geochemically related to GG5 waters as longer distance and residence time equivalents, then the wells in neighboring GG4 must be bypassed by the flow of these waters from the east, ostensibly as shallow or deep mountain block recharge. The westward flowing groundwater from GG5 must move along structures in the FRA as shallow mountain block recharge (Figure 14) and “daylight” as a flowing spring at Morgan Springs. A deeper flow path (deep mountain block recharge) carries chemically-evolving GG3 groundwater beneath the wells in the eastern GG4 well cluster to where it intersects Thrust Fault 2 and N-S fracture zone at the RLL and is extracted by shallow wells in the fracture zone; some of this water also continues westward along an E-W fracture zone that constrains the Walloomsac River and is tapped by the deep western outlier well (174 m; ID 72016-6).
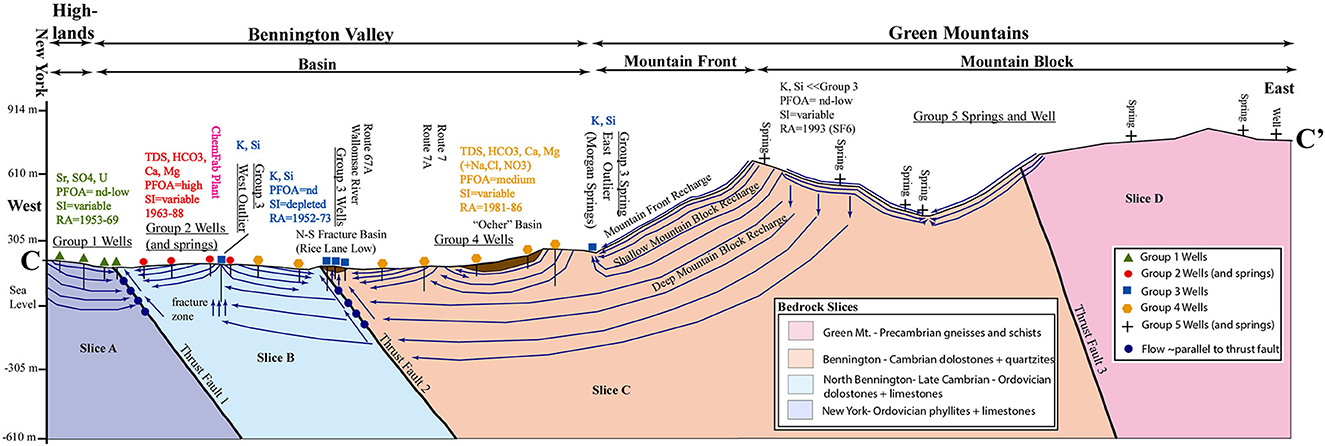
Figure 15. Conceptual Site Model (CSM) cross section C–C′ showing lithologies; thrust faults; bedrock basins; groundwater geochemical groups; mountain block, mountain front, and basin divisions; and thematic groundwater flow patterns. Vertical exaggeration = 3X. Simplified bedrock geology modified from Ratcliffe et al. (2011). See text for details.
The two most important factors affecting recharge to the crystalline rock aquifer in the Mirror Lake area of neighboring New Hampshire were (1) the relief of land and bedrock surface above groundwater discharge areas, and (2) lateral variations in bedrock hydraulic conductivity (Harte and Winter, 1996). A NW- SE cross-sectional model of the Mirror Lake area, based on head measurements in piezometers and major element groundwater chemistry, showed that water recharged at elevations from 549 to 640 m in the mountains could discharge at three different surface water body elevations, which were Norris Brook (274 m), Mirror Lake (183 m), or the Pemigewasset River (152 m) (Harte and Winter, 1996). This model explains how water infiltrated high in the Green Mountain-Block as recharge (GG5) water could discharge at the elevation of Morgan Springs as GG3 water. At a scale of kilometers at the USGS Mirror Lake Site, the hydraulic conductivity of the schists and cross-cutting granites was controlled by less transmissive, rather than highly transmissive fractures, essentially following topography at larger scales (Shapiro et al., 2007).
GG3 wells that have K-Si signatures, no PFOA, depleted stable isotopes, and old recharge ages (1952–73) can be found in the RLL at the intersection of Thrust Fault 2 and a steeply dipping N-S fracture zone. The GG3 West Outlier well sits in the middle of a group of GG2 wells, but, unlike nearby GG2 wells, is tapping water from a deep E-W fracture zone. The E-W and N-S fracture zones control adjacent reaches of the Walloomsac River. The GG3 well groups, which have no PFOA, occur in areas that are adjacent to or surrounded by wells with medium- high PFOA levels, indicating that this older groundwater with a K-Si signature is controlled by flow along bedrock structures including the previously-described fracture zones and thrust faults.
Using contoured PFOA concentrations in groundwater in the study area (Figure 10), we suggested that high and low PFOA zones, which are oriented at a high angle to the surrounding “air deposition envelope,” cannot be explained by air deposition alone and may reflect heterogeneity/ anisotropy in the FRA. Some specific examples from Figure 10 where the PFOA “Areas of Interest” (AOI) correspond with structural features include: (1) AOI C is in the foot wall of Thrust Fault 1 where the groundwater has GG1 chemistry (Sr, SO4, U) and is too old to have any PFOA, (2) AOI B is in the hanging wall of Thrust Fault 1 where the groundwater has GG2 geochemistry (TDS, Ca, Mg, HCO3) and high PFOA because it is much younger; Thrust Fault #1 runs between AOI C and AOI B, and (3) The RLL, which is in the northern part of the largest AOI A polygons, sits in a prominent N-S trending fracture zone where groundwater has GG3 (SiO2, K) chemistry and is too old to have PFOA.
Few multidisciplinary studies of the fate and transport of PFAS in complex FRAs are known in the literature, particularly at the large scale of this Bennington study. Recent studies (Senior et al., 2021a,b) used previously existing geophysical logs and modern PFAS tests of groundwater to constrain their conceptual site models and the fate and transport of this contaminant at a former factory and a Naval Warfare Center in Pennsylvania. An in situ PFAS remediation technique using colloidal activated carbon (CAC) in connected surficial and fractured rock aquifers found that it was much more difficult to remediate a fractured dolostone aquifer because of the complexity of fractures (McGregor and Benevenuto, 2021).
Our integrated physical and chemical aquifer characterization approach supports the following:
1) The PFOA contamination area is composed of four thrust slices of weakly-metamorphosed sedimentary rock that are juxtaposed by three east-dipping thrust faults. From west to east these slices are composed of phyllites and limestones (Slice A), dolostones and limestones (Slice B), dolostones and quartzites (Slice C), and schists and gneisses (Slice D).
2) A bedrock surface contour map of the contamination area, which also integrates field structural data, shows that river and stream valleys are strongly controlled by N-S and E-W striking fracture zones and thrust faults, which also influence groundwater flow. Buried bedrock valleys with deep (> 18 m) overburden are also controlled by fracture zones.
3) Geophysical logging of selected wells and bedrock mapping suggest that wells be grouped according to structural position, intra-thrust slice or thrust slice margin. Slice margin wells that penetrate thrust faults have upward wellbore flow whereas intra-slice wells have either upward or downward wellbore flow.
4) A comparison of the predicted distribution of PFOA on the ground surface from an air deposition envelope with contours of PFOA in groundwater indicated that, although the general shape of the contours for both data sets are elliptical, there are low- and high-concentration PFOA areas of interest in the groundwater that occur at a high angle to the broad large-scale ellipse. Most of these areas of interest correspond with major structures in the fractured rock aquifer.
5) Spatially distinct GGs were delineated from major and trace element data for wells (and springs); these groups reflect water-rock interaction in the different carbonate and clastic rocks in the slices described in #1. GG2 and GG4 have carbonate (TDS, Ca, Mg, HCO3) signatures, while GG1 and GG3 have Sr, U, SO4 and K, Si clastic signatures, respectively. GG5 waters also have a K-Si signature, but at much lower concentrations than GG 3.
6) GG3 and some GG5 waters have depleted stable isotopic (deuterium and 18O) signatures suggesting recharge at high elevations in the Green Mountains, likely from snowmelt; in the case of GG3, flow along faults and fractures transports mountain block recharge to the PFOA-free RLL and other GG3 groundwater zones in the valley.
7) Recharge-ages determined from CFC and tritium strongly correlate with geochemical group. GG1 and GG3 are older (1953–73), generally predating the factory operation, whereas GG2 and GG4 are younger (1963–88) and generally are synchronous with ChemFab factory operation. GG1 and GG3 groundwater, which is intercepted by wells in specific thrust faults or fracture zones, had long flow paths and residence times between recharge and discharge. GG2 and GG4 groundwater is younger, representing a mixture of young and old recharge ages, and is only accessible to wells completed in the interior of slices.
8) Given that soil tests (Barr Engineering, 2018) have part/billion levels of PFOA, the soils and surficial materials in the contamination area will likely continue to be a source for the downward movement of PFOA through the unsaturated zone to the surficial and fractured rock aquifers in the future (Schroeder et al., 2021).
The PFOA contamination of wells in Bennington was first discovered in January 2016 in wells surrounding the former ChemFab plant by the VTDEC and testing was rapidly expanded outward to a radius of 1.6 kilometers and beyond during that winter and spring. The Vermont Geological Survey was first asked to provide the basic geologic framework for the contamination in mid-March of 2016, which, upon further request, was expanded into a comprehensive physical and chemical aquifer characterization study, with the field work portion beginning in late April 2016 and ending in mid-January of 2019.
Although this paper reports in detail on the hydrogeologic framework for the PFOA contamination, it is important for the reader to understand that this study was one part of a massive public health, scientific, and legal effort by the State of Vermont; some elements of this effort follow. After elevated PFOA levels were determined in wells, bottled water was immediately made available to the affected owners. This was followed by installation of Point of Entry Treatment (POET) filtration systems using activated carbon; this occurred from 2016 onward. In July 2017, the State of Vermont settled with the responsible party (Saint-Gobain) to pay for the installation of new water lines using uncontaminated water sources in the western half of the contamination area and in April 2019 in the eastern half (Vermont Public Radio, 2017, 2019). For homes with contaminated wells that are not near the new public water lines, well construction and PFOA testing protocols are being developed to permit new wells to be drilled in these areas. Groundwater in the full PFOA contamination area (52 km2) is currently being formally reclassified as Class 4 (non-drinkable, non-potable) by the State of Vermont.
The original contributions presented in the study are included in the article/Supplementary material, further inquiries can be directed to the corresponding author.
JS: groundwater sampling for recharge ages, recharge age interpretation, manuscript writing, and review. MB: groundwater sampling for major and trace elements, groundwater sampling for stable isotopes, manuscript writing, and review. DB: groundwater sampling for stable isotopes, analysis of stable isotopes, stable isotope interpretation, manuscript writing, and review. ER: geophysical well logging in the field, geophysical data interpretation, manuscript writing, and review. TS: geologic mapping in the field, groundwater sampling for major and trace elements, groundwater sampling for stable isotopes, groundwater sampling for recharge ages, manuscript writing, and review. PR: groundwater sampling for major and trace elements, major and trace element data interpretation, groundwater sampling for stable isotopes, groundwater sampling for recharge ages, recharge age interpretation, manuscript writing, and review. JK: geologic mapping in the field, map production/ data interpretation, geophysical well logging in the field, geophysical data interpretation, groundwater sampling for major and trace elements, major and trace element data interpretation, groundwater sampling for stable isotopes, groundwater sampling for recharge ages, recharge age interpretation, manuscript writing, and review. All authors contributed to the article and approved the submitted version.
TS (Bennington College) and DB (University of Massachusetts Amherst) were supported by National Science Foundation grants #1711637 and #1634237 and the Massachusetts Environmental Trust for Grant METFY2018UMAMHERST01, respectively. Tom Mack and Joe Levitt helped sample USGS wells and Hank Johnson helped with age dating interpretation. Any use of trade, firm, or product names is for descriptive purposes only and does not imply endorsement by the U.S. Government.
We would like to thank John Schmeltzer and Richard Spiese, the Bennington PFOA Project Managers, from the Waste Management and Prevention Division (WMPD) of the VTD EC for their extensive help facilitating this study, and for informal reviews of this manuscript; the citizens of of the Town of Bennington who gave us permission to sample groundwater from their wells, granted access to their land for geologic mapping purposes, or allowed geophysical logging of their wells; and the Vermont State Geologist, Ben DeJong, for a thorough informal review. John Williams, USGS, also provided a valuable review. We would like to acknowledge field assistance from intern Emmet Norris (Middlebury College), who was jointly funded by the Middlebury College Undergraduate Research Fund and the Vermont Geological Survey, and interns Connor Remington (University of Vermont) and William Buchanan (Bennington College), who were funded solely by the Vermont Geological Survey. TS (Bennington College) and DB (University of Massachusetts Amherst).
The authors declare that the research was conducted in the absence of any commercial or financial relationships that could be construed as a potential conflict of interest.
All claims expressed in this article are solely those of the authors and do not necessarily represent those of their affiliated organizations, or those of the publisher, the editors and the reviewers. Any product that may be evaluated in this article, or claim that may be made by its manufacturer, is not guaranteed or endorsed by the publisher.
The Supplementary Material for this article can be found online at: https://www.frontiersin.org/articles/10.3389/frwa.2023.1117780/full#supplementary-material
SUPPLEMENTARY Table 1. Derivative map data.
SUPPLEMENTARY Table 2. Major and trace elements.
SUPPLEMENTARY Table 3. Stable isotopes.
SUPPLEMENTARY Table 4. Recharge ages (including those from Shanley et al., 2023).
Albany (2016). Times- Union Newspaper. Available online at: https://www.timesunion.com/tuplus-local/article/Top-Stories-2016-PFOA-water-pollution-in-Hoosick-10825849.php (accessed September 27, 2022).
Ball, L. B., Caine, J. S., and Ge, S. (2013). Controls on groundwater flow in a semiarid folded and faulted intermountain basin. Water Resour. Res. 50, 6788-6809. doi: 10.1002/2013WR014451
Barr Engineering (2018). Draft Conceptual Site Model Investigation Report. Available online at: https://anrweb.vt.gov/PubDocs/DEC/PFOA/Conceptual%20Site%20Model%20Site%20Investigation/Conceptual-Site-Model-Site-Investigation-Report-MAR-2018.pdf (accessed September 27, 2022).
Barton, C. A. (2008). The Measurement, partitioning and near-field modeling of Perfluorooctanoate (PFO) in air. [dissertation]. [Newark (DE)]: University of Delaware 193p.
Boulanger, B., Peck, A. M., Schnoor, J. L., and Hornbuckle, K. C. (2005). Mass budget of perfluorooctane surfactants in Lake Ontario. Environ. Sci. Tech. 39, 74–79. doi: 10.1021/es049044o
Cole, A. (2019). Spatial and temporal mapping of distributed precipitation, surface and groundwater stable isotopes enables insights into hydrologic processes operating at a catchment scale (Masters theses). p. 823. Available online at: https://scholarworks.umass.edu/masters_theses_2/823 (accessed April 17, 2023).
Cole, A., and Boutt, D. F. (2021). Spatially-resolved integrated precipitation-surface-groundwater isotope mapping from crowd sourcing: toward understanding water cycling across a post-glacial landscape, Front. Water 3, 645634, doi: 10.3389/frwa.2021.645634
DeSimone, D. J. (2017). Surficial geology of the Bennington area, Vermont. Vermont Geol.Surv. 1, 12.
DeSimone, D. J. (2018). PFOA surficial mapping in Bennington, VT, Geol. Soc. Am. Abstracts with Programs 50, 16–7592. doi: 10.1130/abs/2018NE-310039
Dinglasan-Panlilio, M. J., and Mabury, S. (2006). Significant residual fluorinated alcohols present in various fluorinated materials. Environ. Sci. and Tech. 40, 1447–1453. doi: 10.1021/es051619+
Emmett, E., Shofer, F., Zhang, H., Freeman, D., Desai, C., and Shaw, L. (2006). Community exposure to perfluorooctanoate: Relationships between serum concentrations and exposure sources. J. Occup. Environ. Med. 48, 759–770. doi: 10.1097/01.jom.0000232486.07658.74
Environmental Protection Agency (EPA) (2016). Risk Management of Per- and Polyfluoroalkyl Substances (PFAS) under TSCA. Available online at: https://www.epa.gov/assessing-and-managing-chemicals-under-tsca/risk-management-and-polyfluoroalkyl-substances-pfas (accessed September, 27, 2022).
Ferry, M. L., Wilson, J. T., Adair, C., Su, C., Fine, D. D., Liu, X., et al. (2012). Behavior and fate of PFOA and PFOS in Sandy Aquifer Sediment. Groundwater Monitor. Remediat. 32, 63–71, doi: 10.1111/j.1745-6592.2012.01395.x
Guo, B., Zeng, J., and Brusseau, M. L. (2020). A mathematical model for the release, transport, and retention of per-and polyfluoroalkyl substances (PFAS) in the vadose zone. Water Resour. Res. 56, 1-21. doi: 10.1029/2019WR026667
Harte, P. T., and Winter, T. C. (1996). “Factors affecting recharge to crystalline rock in the Mirrow Lake area, Grafton County, New Hampshire,” in U.S. Geological Survey Toxic Substances Hydrology Program- Proceedings of Technical Meeting, Colorado Springs, Colorado, September 20-24, (1993), U.S. Geol. Surv. Water-Res. Invest. Rep, eds Morganwalp, D.W. and Aronson, D.A. p. 141-150.
Interstate Technology Regulatory Council (ITRC) (2020). PFAS—Per- and Polyfluoroalkyl Substances, ITRC PFAS-1. Available online at: https://pfas-1.itrcweb.org/ (accessed September 27, 2022).
Jurgens, B. C., Bohlke, J. K., Eberts, S. M., and Tracer, L. P. M. (2014). (Version 1): An Excel Workbook for Interpreting Groundwater Age Distributions from Environmental tracer Data, U.S. Geological Survey Techniques and Methods Report (2014), 4-F3, 60 p.
Kaiser, M. A., Dawson, B., Barton, C., and Botelho, M. (2010). Understanding potential exposure sources of perfluorinated carboxylic acids in the workplace. Ann Occup Hyg. 54, 915–922. doi: 10.1093/annhyg/
Kannan, K., Corsolini, S., and Falandysz, J. (2004). Perfluorooctanesulfonate and related flurochemicals in human blood from several countries. Environ. Sci. Technol. 38, 4489–4495. doi: 10.1021/es0493446
Kim, J., Ryan, P. C., Klepeis, K., Gleeson, T., North, K., Bean, J., et al. (2014). Ordovician thrust fault controls hydrogeology and geochemistry of a bedrock aquifer system in NW Vermont: northeastern Appalachian foreland. Geofluids 14, 266–290. doi: 10.1111/gfl.12076
Kim, J. J. (2017a). Preliminary bedrock geologic map of the Bennington area. Vermont Geol. Surv. 1, 12.
Kim, J. J., Comstock, J., Ryan, P. C., Heindel, C., and Koenigsberger, S. (2016). Denitrification and dilution along fracture flowpaths influence the recovery of a bedrock aquifer from nitrate contamination. Sci. Total Environ. 569, 450–68. doi: 10.1016/j.scitotenv.2016.06.091
Kim, J. J., and Dowey, C. W. (2017). Derivative maps generated from water well data logs in the Bennington area, Vermont. Vermont Geol. Surv. O 1:12,000.
Kim, J. J., Ryan, P. C., Romanowicz, E., Schroeder, T., Belaval, M., and Boutt, D. (2018). 4D characterization of a fractured bedrock aquifer contaminated with PFOA: Bennington, Vermont. Geologic. Soc. Am. Abstr. Progr. 50, 92. doi: 10.1130/abs/2018NE-310924
Kim, J. J., Ryan, P. C., Schroeder, T., Romanowicz, E., Boutt, D., and Belaval, M. (2019). Using multiple groundwater tracers to assess the fate and transport of PFOA in a surficial-fractured bedrock aquifer system: Bennington, Vermont. Geologic. Soc. Am. Abstr. Progr. 51, 7592. doi: 10.1130/abs/2019NE-328058
Kudo, N., and Kawashima, Y. (2003). Toxicity and toxicokinetics of perfluorooctanoic acid in humans and animals. J. Toxicol. Sci. 28, 49–57. doi: 10.2131/jts.28.49
Larkin, S. (2019). Modeling groundwater flow in Bennington. VT [master's thesis]. [Amherst (MA)]: University of Massachusetts/ Amherst 22p.
Lehmler, H. J. (2005). Synthesis of environmentally relevant fluorinated surfactants-a review. Chemosphere. 58, 1471–1496. doi: 10.1016/j.chemosphere.2004.11.078
Lemal, D. M. (2004). Perspective on fluorocarbon chemistry. J. Org. Chem. 69, 1–11. doi: 10.1021/jo0302556
Lena, C., Biegel-Engler, A., Drost, W., and Schulte, C. (2012). Perfluorooctanoic Acid (PFOA) — main concerns and regulatory developments in europe from an environmental point of view. Environ. Sci. Europe. 24, 16. doi: 10.1186/2190-4715-24-16
Lopez-Espinosa, M.-J., Fletcher, T., Armstrong, B., Genser, B., Dhatariya, K., Mondal, D., et al. (2011). Association of Perfluorooctanoic Acid (PFOA) and Perfluorooctane Sulfonate (PFOS) with age of puberty among children living near a chemical plant. Environ. Sci. and Technol. 45, 8160–8166. doi: 10.1021/es1038694
Lv, X., Sun, Y., Ji, R., Gao, B., Wu, J., Lu, Q., et al. (2018). Physicochemical factors controlling the retention and transport of perfluorooctanoic acid (PFOA) in saturated sand and limestone porous media. Water Resour. 141, 251–258. doi: 10.1016/j.watres.2018.05.020
MacFayden J.A. (1956). The geology of the Bennington area, Vermont, Vermont Geol. Surv. Bull. 62, 500.
McGregor, R., and Benevenuto, L. (2021). The effect of heterogeneity on the distribution and treatment of PFAS in a complex geologic environment. Front. Environ. Chem. 2, 729–779. doi: 10.3389/fenvc.2021.729779
McLaren-Hart Environmental Engineering Corp (1997). Final Draft, Remedial Investigation Report, Bennington Landfill Site, Bennington, Vermont, Submitted to EPA Region I 483p.
OECD (Organisation for Economic Co-operation and Development) (2002). Cooperation on Existing Chemicals—Hazard assessment of perfluorooctane sulfonate (PFOS) and its salts, Environment Directorate, Joint meeting of the Chemicals Committee and the Working Party on Chemicals, Pesticides and Biotechnology. 362 p.
Ogden, D. G. (1969). Geology and Origin of the Kaolin at East Monkton, Vermont. Vermont Geol. Surv. Econ. Geol. 3, 40.
Olsen, G., Burris, J., Ehresman, D., Froehlich, J., Seacat, A., Butenhoff, J., et al. (2007). Half-Life of serum elimination of Perfluorooctanesulfonate, Perfluorohexanesulfonate, and Perfluorooctanoate in retired fluorochemical production workers. Environ. Health Perspect. 115, 1298–1305. doi: 10.1289/ehp.10009
Olsen, G. W., Gilliland, F. D., Burlew, M. M., Burris, J. M., Mandel, J. S., and Mandel, J. H. (1998). An epidemiologic investigation of reproductive hormones in men with occupational exposure to perfluorooctanoic acid. J. Occup. Environ. Med. 40, 614–622. doi: 10.1097/00043764-199807000-00006
Paillet, F. L. (1998). Flow modeling and permeability estimation using borehole flow logs in heterogeneous fractured formations. Water Resour. Res. 34, 997–1010. doi: 10.1029/98WR00268
PFAS Project Lab (2022). Northeastern Univ. Parkersburg, West Virginia. Available online at: https://pfasproject.com/parkersburg-west-virginia/ (accessed October 17, 2022).
PFOA (n.d.). Available online at: https://dec.vermont.gov/sites/dec/files/documents/2016.03.16.PFOA-interim-groundwater-enforcement-standard-1.pdf
Plummer, L. N., and Busenberg, E. (2000). “Chlorofluorocarbons,” Chapter 15. in Environmental Tracers in Subsurface Hydrology, eds Cook, P. G., et al. (New York: Springer Science + Business Media), p. 441–478.
Potter, D. (1971). Bedrock Geology of the Hoosick Falls Area, New York and Vermont, New York state museum and science service. Geol. Surv. 1, 24.
Prevedouros, K., Cousins, I. T., Buck, R. C., and Korzeniowski, S. H. (2006). Sources, fate and transport of perfluorocarboxylates. Environ. Sci. Technol. 40, 32–44. doi: 10.1021/es0512475
Ratcliffe, N. M., Stanley, R. S., Gale, M. H., Thompson, P. J., and Walsh, G. J. (2011). Bedrock geologic map of Vermont, U.S. Geol. Surv. Sci. Invest. Map 1, 100,000. doi: 10.3133/sim3184
Roakes, H., and Zemba, S. G. (2017). “PFAS fate and transport-A heuristic model for understanding PFAS in the environment,” in Environ. Health and Sci. Found., The Annual Conference on Soils, Sediments, Water, and Energy, East Coast Conference Proceedings, University of Massachusetts/ Amherst, p. 108.
Salvini, F., Billi, A., and Wise, D. (1999). Strike-Slip fault-propagation cleavage in carbonate rocks: the Mattinata Fault Zone, Southern Appenines, Italy. J. Struct. Geol. 21, 1731–1749. doi: 10.1016/S0191-8141(99)00120-0
Sammut, G., Sinagra, E., Sapiano, M., Helmus, R., and de Voogt, P. (2019). Perfluoroalkyl substances in the Maltese environment–(II) sediments, soils and groundwater. Sci. Total Environ. 682, 180–189. doi: 10.1016/j.scitotenv.2019.04.403
Schaider, L. A., Rudel, R. A., Ackerman, J. M., Dunagan, S. C., and Brody, J. G. (2014). Pharmaceuticals, perfluorosurfactants, and other organic wastewater compounds in public drinking water wells in a shallow sand and gravel aquifer. Sci. Total Environ. 468, 384–393. doi: 10.1016/j.scitotenv.2013.08.067
Schroeder, T., Bond, D., and Foley, J. (2021). PFAS soil and groundwater contamination via industrial airborne emission and land deposition in SW Vermont and Eastern New York State, USA. Environ. Sci. Processes Impacts. 23, 291–301. doi: 10.1039/D0EM00427H
Schroeder, T., Foley, J., Bond, D., Ging, H.itzelberger, M., Nordyke, A., Salazar, E., et al. (2020). Spatial and temporal variations in shallow groundwater PFOA contamination in Bennington, VT: Matrix diffusion of PFAS during infiltration through heterogeneous till. Geol. Soc. Am. Abstr. Progr. 52, 6. doi: 10.1130/abs/2020AM-357461
Senior, L. A., Anderson, J. A., and Bird, P. H. (2021a). Geophysical and video logs of selected wells at and near the former Naval Air Warfare Center Warminster, Bucks County, Pennsylvania, 2017–19, US. Geol. Surv. 21, 92. doi: 10.3133/ofr20211025
Senior, L. A., Fiore, A. F., and Bird, P. H. (2021b). Hydrogeologic framework, water levels, and selected contaminant concentrations at valmont superfund site, Luzerne County, Pennsylvania: US. Geol. Surv. Open-File Rep. 21, 800. doi: 10.3133/ofr20211093
Shanley, J., Mack, T. J., and Levitt, J. P. (2018). Groundwater age-tracers shed light on the nature of PFOA transport in the N. Bennington, Vermont bedrock aquifer. Geol. Soc. Am. 50, 7592 doi: 10.1130/abs/2018NE-311118
Shanley, J. B., Johnson, H., Levitt, J., and Mack, T. J. (2023). Groundwater age-tracing data and models in a PFOA-contaminated bedrock aquifer, N. Bennington, Vermont: U.S. Geological Survey data release.
Shapiro, A. M., Hsieh, P. A., Burton, W. C., and Walsh, G. J. (2007). “Integrated Multi-Scale Characterization of Ground-Water Flow and Chemical Transport in Fractured Crystalline Rock at the Mirror Lake Site, New Hampshire,” in: Subsurface Hydrology: Data Integration for Properties and Processes, Geophysical Monograph Series 171, American Geophysical Union, ProQuest Ebook Central, eds Hyndman, D.W. et al. Available online at: http://ebookcentral.proquest.com/lib/tui-ebooks/detail.action?docID=1184574 (accessed April 17, 2023).
Shin, H.-M., Vieira, V. M., Ryan, P. B., Detwiler, R., Sanders, B., Steenland, K., and Bartell, S. M. (2015). Environmental fate and transport modeling for perfluorooctanoic acid emitted from the Washington Works facility in West Virginia. Environ. Sci. Technol. 45, 1435–1442. doi: 10.1021/es102769t
Solomon, D. K., and Cook, P. G. (2000). “3H and 3He,” Chapter 13. in Environmental Tracers in Subsurface Hydrology, eds Cook, P. G., et al. (New York: Springer Science + Business Media), p. 397-424.
Steenland, K. (2010). Epidemiologic evidence on the health effects of perfluorooctanoic acid (PFOA). Environ. Health Perspect. 118, 1100–1108. doi: 10.1289/ehp.0901827
The Tritium Lab at the Rosenstiel School of Marine Atmospheric Sciences (RSMAS) (n.d.). Advice on Sampling for cfc sf6. Available online at: https://tritium.rsmas.miami.edu/analytical-services/advice-on-sampling/cfc-and-sf6/index.html (accessed April 17 2023)..
The Tritium Lab at the Rosenstiel School of Marine Atmospheric Sciences (RSMAS) (n.d.). Advice on sampling for tritium. Available online at: https://tritium.rsmas.miami.edu/analytical-services/advice-on-sampling/tritium/index.html (accessed April 17 2023)..
U.S. Geological Survey Groundwater Dating Lab methods. Available online at: https://water.usgs.gov/lab/ (accessed April 17, 2023)..
Ubel, F., Sorenson, S. D., and Roach, D. E. (1980). Health status of plant workers exposed to fluorochemicals–a preliminary report. Am Ind. Hyg. Assoc. J. 41, 584–589. doi: 10.1080/15298668091425310
Vaughn, B., Winquist, A., and Steenland, K. (2013). Perfluorooctanoic acid (PFOA) exposures and incident cancers among adults living near a chemical plant. Environ. Health Perspect. 121, 1313–1318. doi: 10.1289/ehp.1306615
Vermont Agency of Natural Resources (2023). Well Driller Reports. Available online at: https://anrweb.vt.gov/DEC/WellDrillerReports/Default.aspx (accessed April 17, 2023).
Vermont Dept. of Environmental Conservation (n.d.). Information for Impacted Communities Private Drinking Water Wells. Available online at: )https//dec.vermont.gov/sites/dec/files/co/pfoa/documents/NBenn-Benn-Sample-Results-CURRENT.xlsx(vermont.gov) (accessed April 17 2023).
Vermont Public Radio (2017). https://www.vpr.org/post/state-reaches-settlement-over-pfoa-contamination-bennington#stream/5 (accessed October 15, 2022).
Vermont Public Radio (2019). https://www.vpr.org/post/saint-gobain-pay-new-water-service-bennington-homes-contaminated-pfoa#stream/0 (accessed October 15, 2022).
Vieira, V., Hoffman, K., Shin, H.-M, Weinberg, J., Webster, T., and Fletcher, T. (2013). Perfluorooctanoic acid exposure and cancer outcomes in a contaminated community: a geographic analysis. Environ. Health Perspect. 121, 318–323. doi: 10.1289/ehp.1205829
VTDigger (2017). Teflon Town. Available online at: https://vtdigger.org/investigations/teflon-town-part-1/ (accessed September 27, 2022).
Weber, A. K., Barber, L. B., LeBlanc, D. R., Sunderland, E. M., and Vecitis, C. D. (2017). Geochemical and hydrologic factors controlling subsurface transport of poly- and perfluoroalkyl substances, Cape Cod, Massachusetts. Environ. Sci. Technol. 51, 4269–4279. doi: 10.1021/acs.est.6b05573
Weston and Sampson Engineers Inc (2016). Standard Operating Procedure (SOP) 16: Water Supply Water Sampling for PFCs, Environmental, Geotechnical, and Energy Division 2p.
Wilson, J. L., and Guan, H. (2004). “Mountain-block hydrology and mountain-front recharge,” in Groundwater Recharge in a Desert Environment: The Southwestern United States, eds Phillips, F.M., Hogan, J., Scanlon, B. (Washington, DC: American Geophysical Union), p. 1–23.
Keywords: fractured rock aquifer, PFOA fate and transport, groundwater recharge ages, fracture zones, stable isotopes, thrust faults
Citation: Kim JJ, Ryan PC, Schroeder T, Romanowicz E, Boutt D, Belaval M and Shanley J (2023) Four-dimensional characterization of a PFOA-contaminated fractured rock aquifer (FRA) in Bennington, Vermont, U.S.A. Front. Water 5:1117780. doi: 10.3389/frwa.2023.1117780
Received: 06 December 2022; Accepted: 26 April 2023;
Published: 15 May 2023.
Edited by:
Daniela Ducci, University of Naples Federico II, ItalyReviewed by:
Guanxing Huang, Chinese Academy of Geological Sciences, ChinaCopyright © 2023 Kim, Ryan, Schroeder, Romanowicz, Boutt, Belaval and Shanley. This is an open-access article distributed under the terms of the Creative Commons Attribution License (CC BY). The use, distribution or reproduction in other forums is permitted, provided the original author(s) and the copyright owner(s) are credited and that the original publication in this journal is cited, in accordance with accepted academic practice. No use, distribution or reproduction is permitted which does not comply with these terms.
*Correspondence: Jonathan J. Kim, am9uLmtpbUB2ZXJtb250Lmdvdg==
†These authors have contributed equally to this work
Disclaimer: All claims expressed in this article are solely those of the authors and do not necessarily represent those of their affiliated organizations, or those of the publisher, the editors and the reviewers. Any product that may be evaluated in this article or claim that may be made by its manufacturer is not guaranteed or endorsed by the publisher.
Research integrity at Frontiers
Learn more about the work of our research integrity team to safeguard the quality of each article we publish.