 Divya Subramanian
- DS Urban Analytics, Mumbai, India
Introduction: Dense cities in developing nations face rapid urban sprawl. This alters the local ecology and contributes significantly to the local temperature variation. Gray infrastructure (GI) includes vital processes of sewage treatment and wastewater pumping stations. GI is attributed to large greenhouse gas emissions and high energy utilization, contributing to the local urban heat island effect. A knowledge gap exists in assessing GI contribution to the local temperature variation in megacities of developing nations like India.
Methodology: In this study, the Thermal Variance Index (TVI) was derived around a buffer zone for 7 Sewage Treatment Plants (STPs) in Mumbai. Landsat 8 remote sensing imagery was used with summer and winter variation for alternate years from 2014 to 2021.
Results and discussion: Three STPs set within densely built surroundings showed a cooling profile. Four STPs located among wetlands displayed a heating profile. The surrounding built spaces showed significant influence on the TVI recorded. The STP Cooling Effect (CE) was further quantified by deducing its Cooling Range (CR) and Cooling Intensity (CI). STPs within densely built areas showed higher Cooling Range and Cooling Intensity. Regression analysis models indicated a high positive correlation for the Normalized Difference Built-up Index (NDBI), Landscape Shape Index (LSI), and STP capacity. Normalized Difference Vegetation Index (NDVI), Modified Normalized Difference Water Index (MNDWI), and STP area showed a strong negative correlation.
1 Introduction
Urbanization involves drastic land development from natural areas, water bodies, forest land etc. into built spaces. This rapid growth without contributes significantly to climate change (Haaland and van den Bosch, 2015). Cities in developing nations like India are increasingly experiencing rapid urban sprawl that alters the local ecology and negatively impacts the living environment (Aithal and Ramachandra, 2016). The urban sprawl with heterogeneous built forms display variations in outdoor thermal profile. This significantly impacts the experienced thermal comfort (Mehrotra et al., 2019).
Gray Infrastructure (GI) that largely includes water resource management facilities like sewage treatment plants, stormwater drains, sewerage pumping stations, desalination units, etc. provides essential urban services (UNEP, 2017). Sewage Treatment Plants (STPs) are an essential aspect of GI and are perceived as contributors of waste heat, pollutants, noise and residual waste (Sarkar and Bhattacharyya, 2015). These conventionally built water management systems are mostly associated with high greenhouse gas emission levels (Nguyen et al., 2021), pollution (Afolalu et al., 2022), high energy utilization (Zhu et al., 2022), increasing the Urban Heat Island (UHI) effect and eventually contribute to climate change (Qi et al., 2019). Many studies have investigated the cooling effects of water bodies at large (Broadbent et al., 2018; Jamei and Tapper, 2019), mapped the cooling potential of blue-green infrastructure (Yu et al., 2020) and prescribed UHI mitigation strategies with green-blue facilities (Gunawardena et al., 2017). Studies regarding wastewater infrastructure include the economic potential evaluation of UHI mitigation with stormwater facilities (Johnson et al., 2021), sustainable drainage to reverse climate change (Charlesworth, 2010), energy optimization of municipal wastewater systems (Nowak et al., 2015), reclaimed wastewater based urban pavement cooling (Yamagata et al., 2008; Wang et al., 2022). However, very few have evaluated the cooling and heating trends associated with the GI (Wagner et al., 2022). This knowledge gap is furthered in the context of developing nations that face rapid urbanization challenges (Mulligan et al., 2020).
As per the Central Pollution Control Board of India (CPCB) only 19% of the sewage generated is currently treated. And Mumbai STPs amount to 2,130 Million Liters per Day (MLD) or 26% of the nation's capacity (CPCB, 2021). The STP capacity installed has a 78% shortfall for the sewage generation volume. About 1,800 MLD capacity STPs are currently under construction. Substantial capacity addition is envisioned with future development and progress. Given the nascent stage of GI planning and provision (Sinha et al., 2009) in developing nations, an enormous opportunity presents for integrating green-blue-gray infrastructure (Li et al., 2020; Mulligan et al., 2020) to achieve the Sustainable Development Goals (SDGs) (Obaideen et al., 2022), ameliorate the urban environment and improve the quality of life and wellbeing (Dankelman, 2007). Research that analyses STPs impact on urban thermal performance is essential for urban planners who could utilize the learnings and incorporate them in the planning and design of upcoming GI (UN Habitat et al., 2016) and mitigate climate change effects (Demuzere et al., 2014). The present research focusses on the land surface temperature differences as identified across the seven STP locations and their buffer areas in Mumbai. The main objectives of the study included
(i) Comparative analysis of the local temperature variation around STP and buffer areas.
(ii) Quantifying the cooling effect of STPs by deducing CR: Cooling Range and CI: Cooling Intensity.
(iii) Examining the relationship between temperature variation influenced by STP factors and buffer characteristics.
2 Data and methodology
2.1 Study area
Mumbai, the financial capital of India, is a megacity with an estimated population of 12.44 million (Census of India, 2011). Spread over 458.28 square km (MCGM, 2011), this coastal city experiences a tropical climate with an average annual rainfall of 1,800 mm (Rana et al., 2012). The average summer temperature ranges between 21°C and 36°C, and the highest recorded summer temperature is 42°C (Vinayak et al., 2022). The lowest winter temperatures go down to 16°C. The urban built environment of Mumbai is heterogeneous and exhibits multiple instances of the UHI effect with extreme weather occurrences (Dhorde et al., 2017; Mehrotra et al., 2020).
Mumbai treats 80% of the total sewage generated, with about 2,130 MLD sewage treatment capacity (CPCB, 2013). The Mumbai sewerage system serves only 42% of the population (MCGM, 2005). There are seven sewage zones for Mumbai and 13 STPs of varying capacities and technology usage (CPCB, 2021). As seen in Figure 1, the seven STPs considered for this study are located at Worli, Bandra, Dharavi, Versova, Malad, Ghatkopar, and Bhandup, respectively. The estimated capacity and operational volume of these STPs is as shown in Figure 2, where the size of the circle denotes the relative area of the respective STPs.
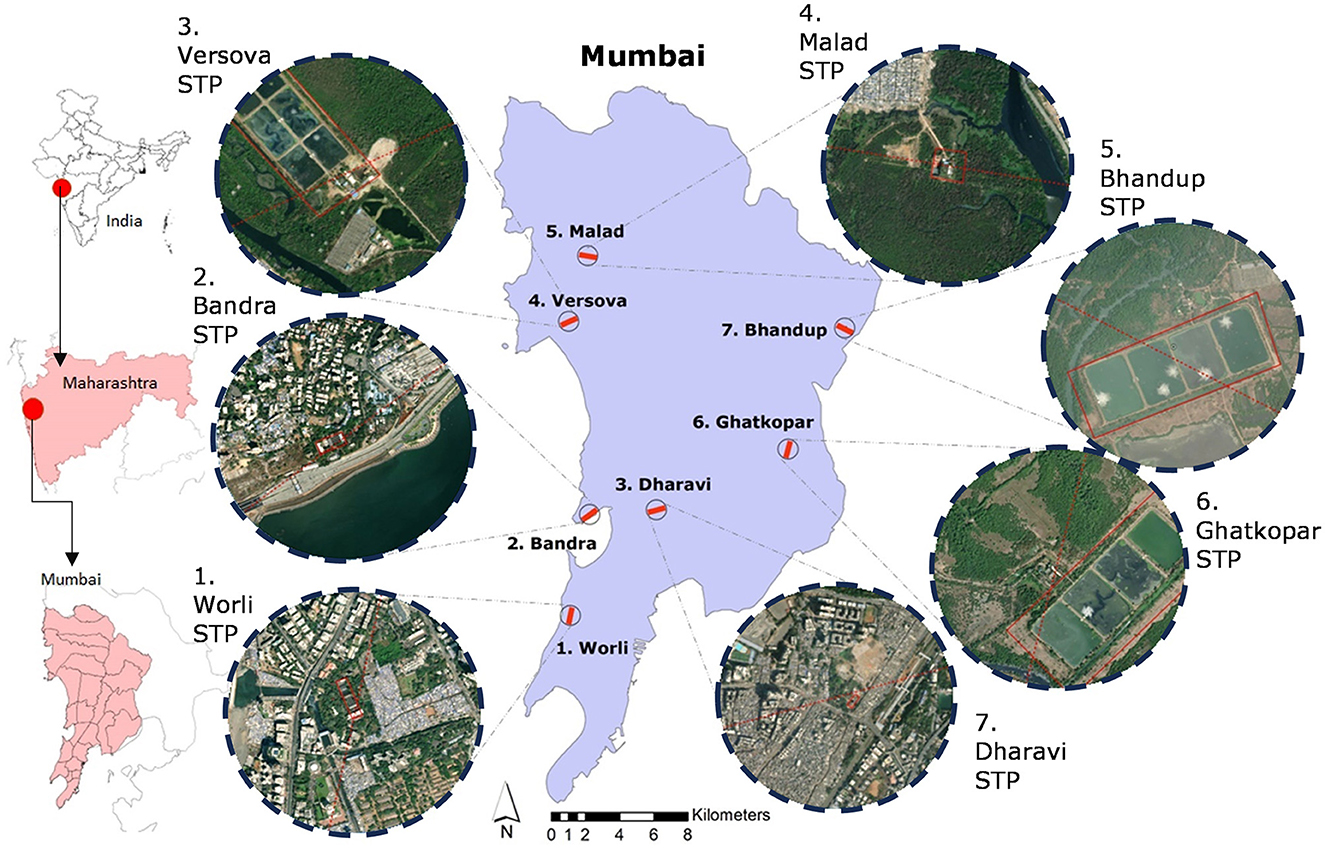
Figure 1. Location map of 7 STPs and surrounding areas in Mumbai, India.

Figure 2. STPs Capacity (MLD) vs the current STPs Operational Volume (MLD) plotted with the size of the circle indicating the relative area of STPs.
2.2 Image processing and study variables
The Remote Sensing and Geographic Information System (RS-GIS) method was used to assess the Land Surface Temperature (LST) variation over the selected STPs and neighboring buffer regions. Landsat 8 OLI/TIRS remote sensing imagery with a spatial resolution of 30 meters was obtained from United States Geological Survey (USGS). RS Images from the summer and winter months were incorporated to assess the impact of seasonal variation, as seen in Table 1. The satellite images of a total 8 dates were selected from years 2014, 2016, 2019, and 2021 respectively. Two dates from the summer and winter months per chosen year were selected having minimal cloud cover (<1%). Supervised classification using the Maximum Likelihood Classifier (MLC) tool was undertaken in ArcGIS to derive three classes: (a) Vegetation, (b) Urban Built and (c) Water/Wetlands. Exploratory variables Normalized Difference Vegetation Index (NDVI), Normalized Difference Built-up Index (NDBI), Modified Normalized Difference Water Index (MNDWI), LST, and Thermal Variance Index (TVI) were derived from the Landsat 8 image data using the ESRI ArcGIS program (Artis and Carnahan, 1982; Xu, 2019). NDVI has been widely accepted as a standardized method to measure and quantify vegetation (Kimothi et al., 2023) by measuring the difference between red (R) and near-infrared (NIR) spectral reflectance values from RS data. NDBI is used to extract built features and built-up regions (Zha et al., 2003). NDBI has shown a strong positive correlation with the LST and is pertinent to evaluate thermal profiles, especially in dense urban areas (Berger et al., 2017; Dai et al., 2018). MNDWI as developed by Xu (2005) is a water-index that uses the green (GREEN) and the short wave infrared (SWIR) bands from RS data. MNDWI has been found to be more effective in highlighting waterbodies among the different types of water-related indices (Szabó et al., 2016). LST was derived using brightness temperature and land surface emissivity (Reddy et al., 2017). To address issues of interannual variations and varied atmospheric conditions associated with comparing remote sensing images of multiple years, normalization of the LST recorded is suggested as presented by Zhang (2006). In this study, the Thermal Variance Index (TVI) is defined as the normalized LST for the selected buffer area using the following method.
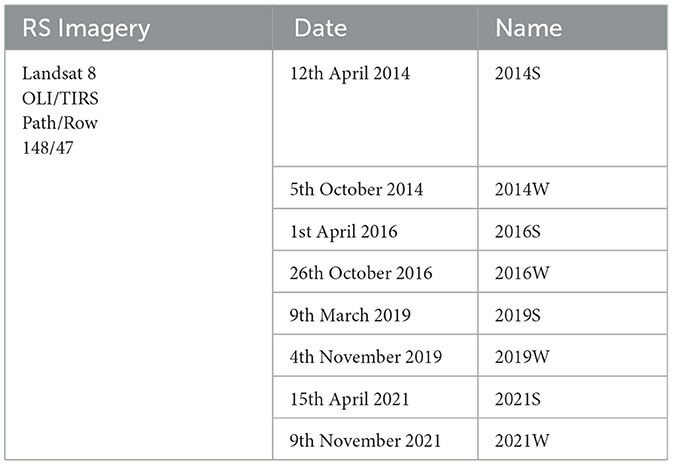
Table 1. Remote sensing satellite images used for RS-GIS analysis.
Where, LST is the land surface temperature, LSTmean is the mean land surface temperature of the buffer area, and STD is the standard deviation. TVI is used in this research as a measure to evaluate the temperature variance within a predetermined buffer zone. The TVI stack profile graph was generated across the seven STPs individually. Buffer radii of 250 m, 500 m, 750 m, and 1 Km were tested for the seven STPs initially. As maximum variation in TVI was captured within a 500 m radius buffer zone, it was selected as the TVI buffer radius for this study (Sun et al., 2012; Lee et al., 2016; Cruz et al., 2019). Continuous buffers of 30 m intervals were created around the 7 STPs. The selection of the 30 m buffer interval was based on the spatial resolution of the Landsat 8 OLI/TIRS remote sensing imagery. The stack profile line was plotted for a one km distance with the STP at the center. Two instances of the TVI stack profile graph have been shown in Figure 4, representing the Versova and Bandra STPs. The TVI profile was calculated using the Landsat images for the eight selected dates as represented in Table 1, capturing summer and winter month variation of each selected year. The mean values of land use and land cover indicators of NDVI, NDBI, and MNDWI for the 8 selected dates across the 7 STPs were compared and plotted in Figure 3.
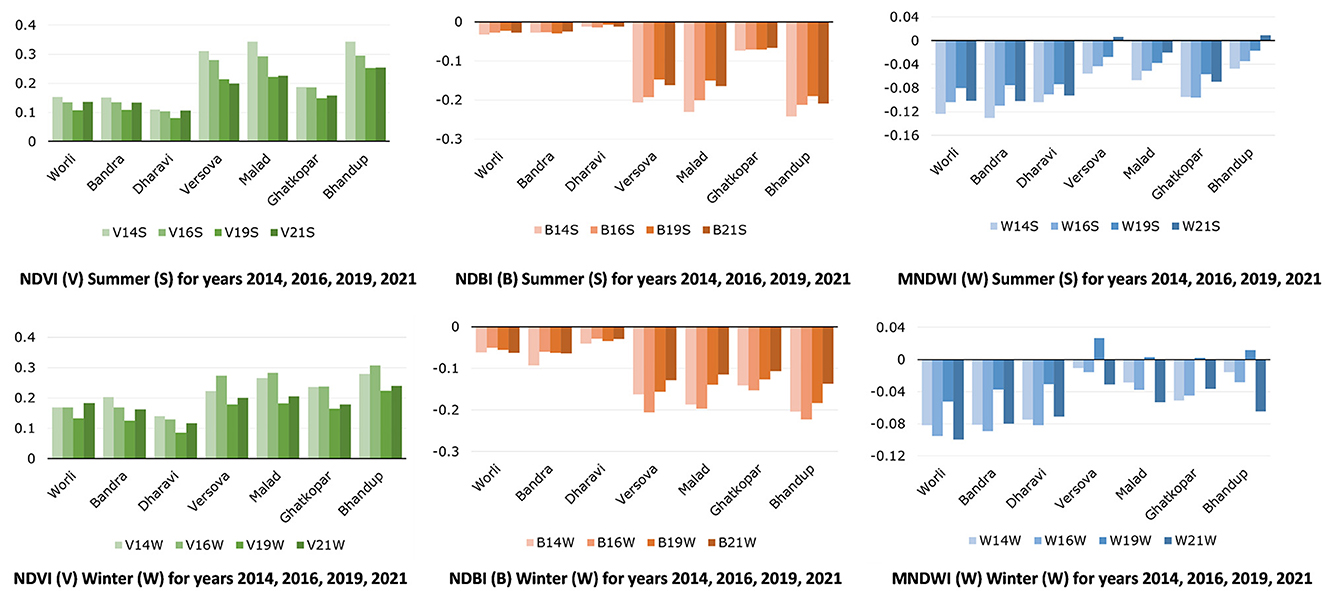
Figure 3. Mean values of NDVI, NDBI, and MNDWI for the 7 STPs plotted for all the selected dates from 2014 to 2021.
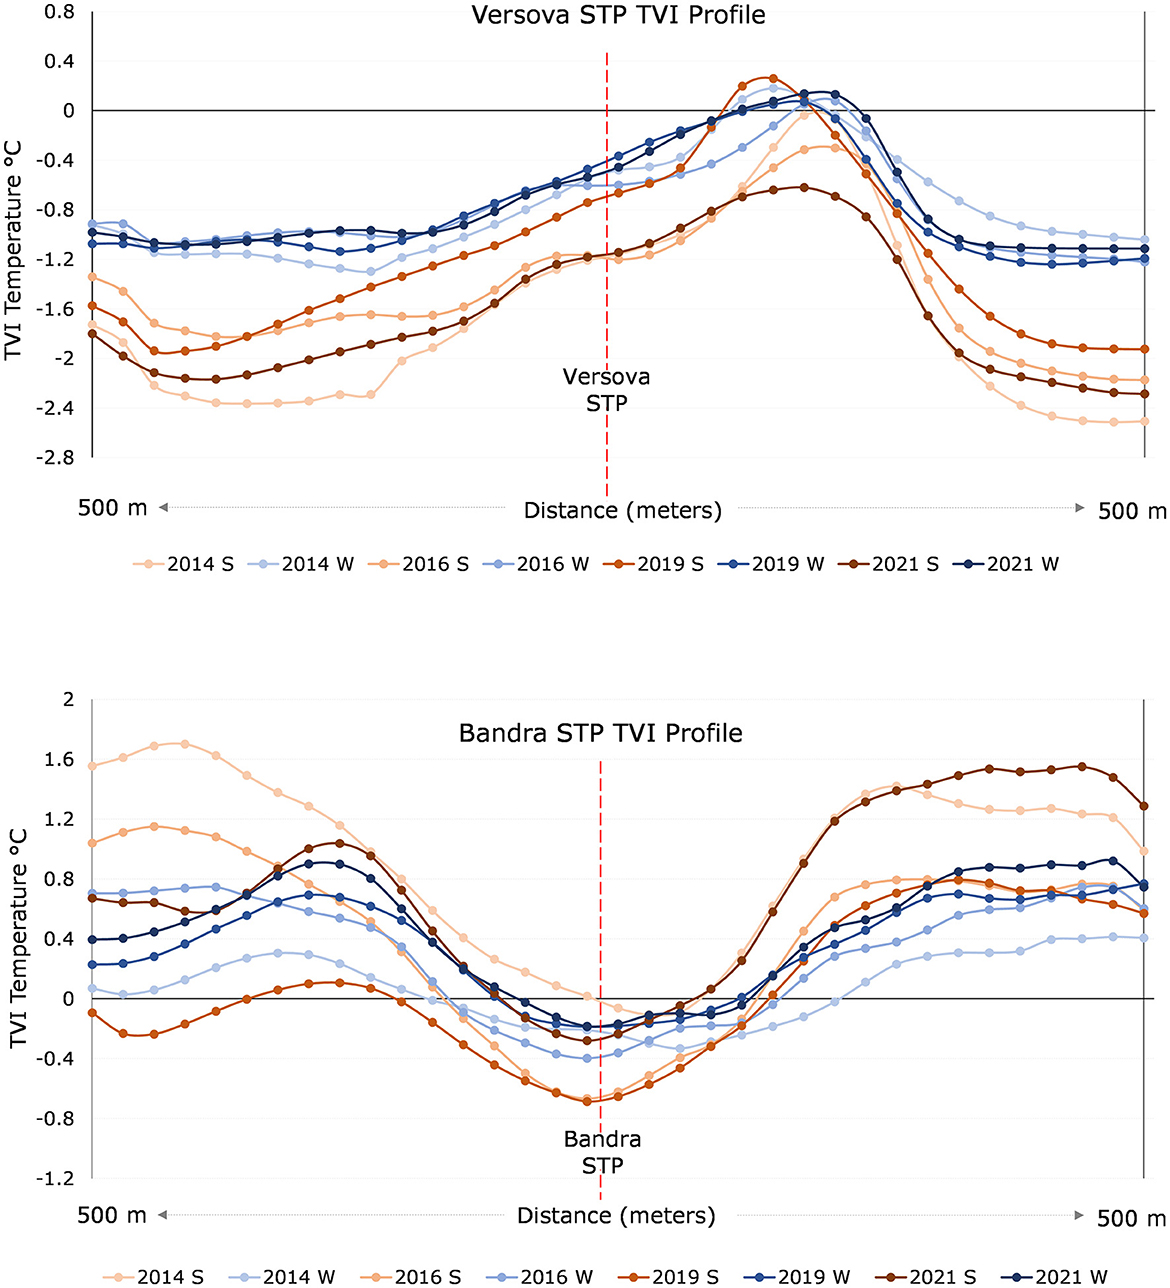
Figure 4. TVI stack profile showcasing the heating and cooling profile of Versova and Bandra STPs from 2014 to 2021 (summer and winter months) respectively.
Multiple STP features and surrounding characteristics were inspected for this study. The STP parameters considered are area, perimeter, capacity volume, operational volume, and Landscape Shape Index (LSI). LSI is defined as the measure of overall shape complexity and signifies the shape irregularity and compactness. Higher LSI values indicate a more complex, irregularly shaped landscape entity. In this study, LSI was derived using the cumulative boundary divided by the square root of its total area, adjusted by the circular standard constant (McGarigal and Marks, 1995). The STP capacity and operational volume data were accessed from the national inventory of STPs in India, refer Figure 2 (CPCB, 2021).
For tropical climate zones, urban heating instances abound. In this context the cooling potential of waterbodies or green spaces have been investigated. However, the cooling effect of GI like STPs have not been estimated. The Cooling Effect (CE) in this study is defined as the temperature difference/lowering effectuated by the STP and is calculated as the function of the Cooling Range (CR), Cooling Intensity (CI), and Temperature Difference (ΔTC) as demonstrated by Sun et al. (2012). To quantify CE, multiple buffer rings of 30 m intervals were plotted around each STP. The Landsat 8 satellite images of 8 specific dates (refer Table 1) were processed to derive the LST for each buffer interval. The mean LST of each buffer interval was plotted against the buffer distance for all the dates selected. The first inflection point of the curve was mapped where the temperature dropped instead of increasing or vice versa. The Cooling Range (CR) is defined as the distance from the STP to the first inflection point. The average CR for the 8 selected dates (refer Table 1) was identified as CRmean for the specific STP. Temperature Difference (ΔTC) in this study is defined as the difference between the temperature recorded at the first inflection point and the temperature recorded at the STP. The Cooling Intensity (CI) in this study is defined as the difference between the average temperature within the CR and the temperature recorded at the STP. The average CI for the 8 selected dates was identified as CImean for the specific STP.
3 Results
3.1 Exploratory variables and LST
The cross comparison of the land use and land cover indicators NDVI, NDBI, and MNDWI (refer Figure 3) depicts the longitudinal changes within the buffer zone for the 7 STPs. For the cases of Worli, Bandra and Dharavi, the NDVI and MNDWI values are seen to be lowest among the 7 STPs and highest for NDBI values. Seasonal variation among the summer and winter dates is seen for the NDVI values. Versova, Malad, and Bhandup STP buffers show decreasing NDVI and increasing NDBI and MNDWI values.
A linear regression analysis was undertaken to evaluate the impact of the STP buffer profile on the LST. The buffer zone included varied land use of urban built, wetlands, roads, vegetation etc. The land-use indices NDVI (for vegetation), NDBI (for built), MNDWI (for water) for the specific buffer zone are indicative of the STP surroundings. These were regressed against the LST for the specific buffer zone to identify the associations between the surrounding and the mapped LST. Table 2 shows the linear regression analysis results of exploratory variables NDVI, NDBI, and MNDWI with respect to the dependent variable LST. Worli, Bandra, and Dharavi buffer zones included densely built spaces, while the rest have comparatively open surroundings that include wetlands and vegetation, refer to Figure 1. NDBI showed comparatively higher R2 values consistently than NDVI and MNDWI for all STPs. This signifies that the presence or absence of built spaces in the surroundings has a comparatively higher impact on the LST than the presence/absence of vegetation and water. The built index showed a strong positive influence on LST for Versova, Malad and Ghatkopar STPs. Malad and Bhandup STPs showed a significant impact of the vegetation index on the LST. Only Worli STP showed a significant influence of MNDWI on the LST.

Table 2. R2 value of linear regression models of NDVI, NDBI, MNDWI, and land-use classification with the dependent variable LST of the respective STP buffer zones.
3.2 TVI Analysis
The Thermal Variation Index (TVI) generated from Landsat imagery for the seven STPs was plotted using stack profile in ArcGIS for the eight selected dates (2014–2021). Figure 4 shows the TVI stack profile for Versova and Bandra STPs with the summer and winter month variation of each selected year represented in different colors. The STP impact can be visually assessed in both these instances. The Bandra STP is located in a densely built context. A significant drop in TVI is noted at the Bandra STP with respect to the surrounding buffer area TVI. Conversely, for the Versova case located around wetlands, a significant rise over the STP in comparison to the buffer area TVI is observed. Bandra STP reports a cooling effect, while Versova STP reports a heating effect. Table 2 reports the TVI profile results for all the STPs of 8 selected dates from years 2014, 2016, 2019, and 2021. It denotes the heating and cooling effect and further enlists the mean temperature difference (ΔT) for all 8 selected dates, summer dates, and winter dates, respectively. ΔT is the difference in temperature between a given buffer ring and the STP. Worli, Bandra, and Dharavi reported a cooling effect. The rest saw a heating profile. The highest overall mean ΔT was reported for the Dharavi STP with 1.99°C and lowest for Worli with 0.95°C. Ghatkopar with 2.47°C reported the highest summer mean ΔT. Dharavi reported the highest winter mean ΔT. Interestingly, Worli and Dharavi reported similar summer and winter mean ΔT. This can be attributed to the neighboring informal settlement/slum clusters within the buffer zone with high NDBI, LST, and TVI, refer Figure 5. These clusters reported high LST in both seasons. The other 5 STPs show a minimum 0.5°C difference between the summer and winter mean ΔT. The highest ΔT between the summer and winter dates is reported by Ghatkopar with 1.76°C followed by Bhandup with 1.30°C. This can be attributed to the wetlands in Ghatkopar and Bhandup buffer zones.
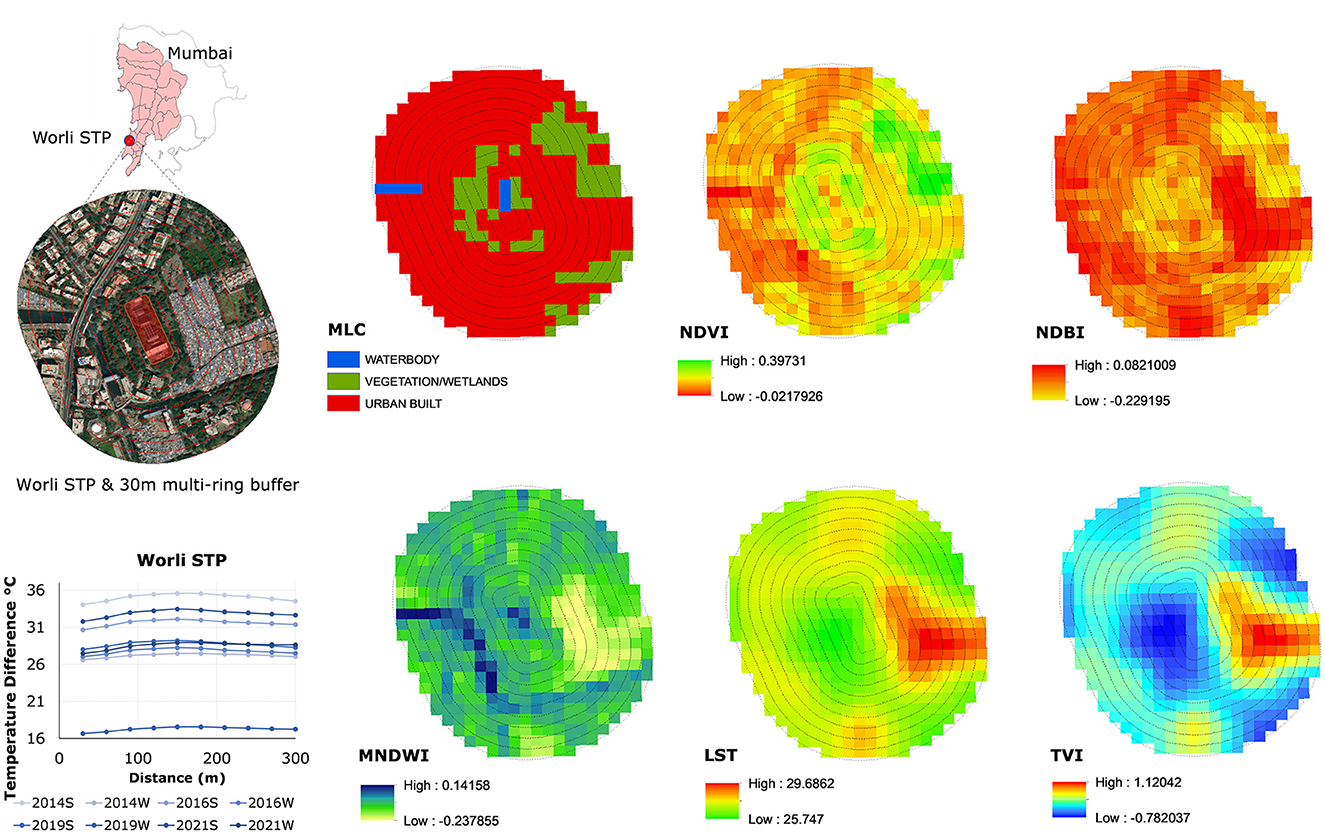
Figure 5. Worli STP and 300 m multi-ring buffer zone showing MLC, NDVI, NDBI, MNDWI, LST, TVI, and CE Index respectively.
Figure 5 shows the Worli case wherein the 30 m multiple buffer rings are demarcated over the satellite image with the STP location highlighted in red. Subsequently, the MLC, NDVI, NDBI, MNDWI, LST, and TVI output of the Worli case are juxtaposed for visual analysis. It can be observed that the highest NDBI, LST, and TVI value is recorded in the slum cluster to the right of the STP. Additionally, the same area exhibits the lowest MNDWI and NDVI values. The lowest LST and TVI values are observed over the STP and the immediate surroundings within the buffer zone. A significant cooling effect of the STP is observed in the Worli scenario. As seen in the MLC and NDVI render, the STP has a ring of vegetation bordering the plant. This further contributes to the cooling effect of the Worli STP.
3.3 Cooling effect indices
Cooling Effect (CE) indices for this study included the Cooling Range, Temperature Difference ΔTC, and Cooling Intensity. Table 3 enlists the CE indices derived for the study period for each specific STP. The CRmean was highest for Bandra at 161.25 m and lowest for Versova at 34 m. The highest ΔTC was noted for Worli, followed by Bandra and Dharavi. Worli, Bandra, and Dharavi had the highest values for the Cooling Effect Indices. These three STPs exhibit the highest cooling effect, attributed to the buffer areas with densely built-up spaces. Conversely, Versova, Malad, and Bhandup had the lowest Cooling Effect Indices. As inferred from the TVI profile data (Table 4), these locations display a heating profile with the resultant low CE indices. Figure 6 shows the Cooling Intensity of all STPs plotted against the Cooling Range for the selected dates between 2014 and 2021. The Cooling Range mode value for Worli, Bandra, and Dharavi was 150 m. For the rest, the mode was 30 m. Comparatively higher CR values of 300 m and 240 m were reported by Ghatkopar for the 2014 and 2016 winter dates. These anomalous data points exhibited the STP cooling effect as opposed to the heating profile reported for the rest of the selected dates. The Cooling Range for Versova, Malad, and Bhandup did not exceed 60 m.
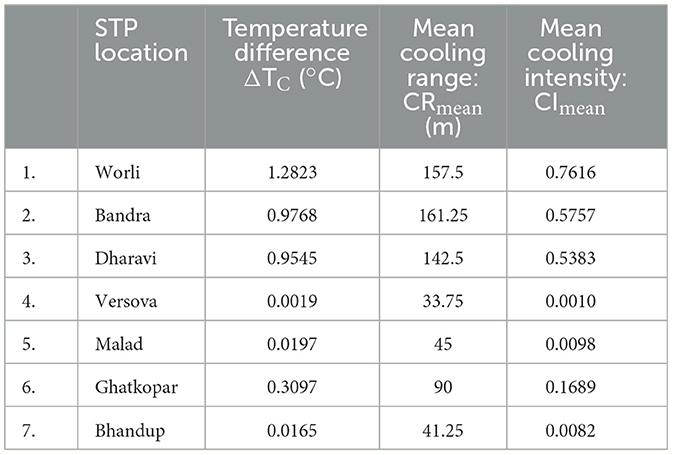
Table 3. Cooling effect indices for the 7 STPs.
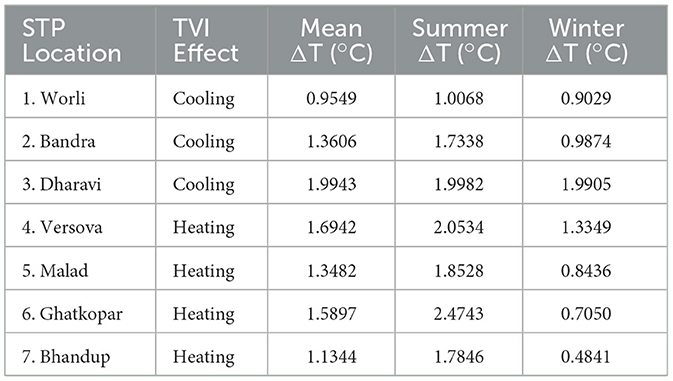
Table 4. TVI profile for STPs showing mean ΔT, summer ΔT and winter ΔT for all selected dates (2014–2021).
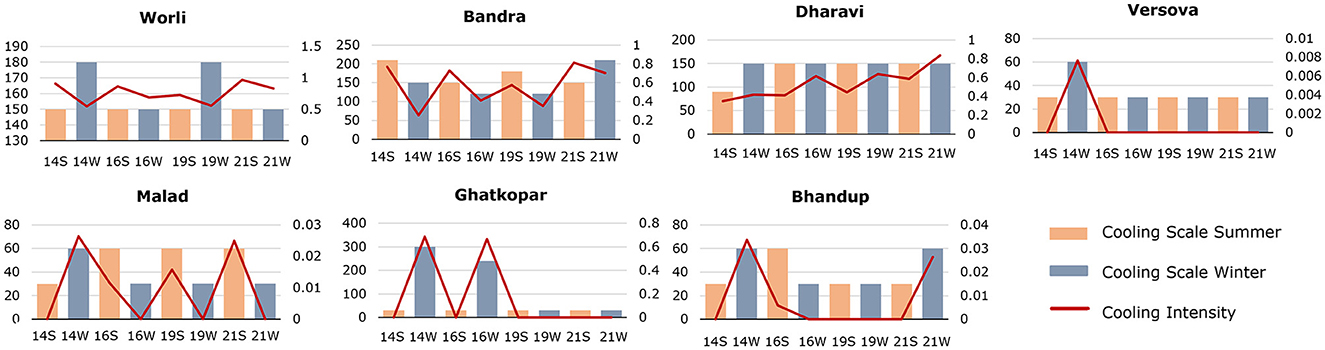
Figure 6. Graph showing Cooling Range vs. Cooling Intensity for 7 STPs (2014–2021).
3.4 Thermal variance index, cooling effect indices and explanatory variables
Figure 7 represents the comparative analysis of parameters considered in this study to evaluate the heating/cooling profiles exhibited by the GI. STP area, Cooling Range and STP capacity values were normalized and used in this graph for comparison. Z-score normalization was undertaken using the mean and standard deviation values of the respective parameters. As seen in Figure 7, Worli, Bandra, and Dharavi show highest values of NDBI, ΔTC, TVI, Cooling Range, and Cooling Intensity for the 8 selected dates (refer Table 1). They also had the lowest values of NDVI and MNDWI. Conversely, Versova, Malad, and Bhandup showed comparatively higher values of NDVI, MNDWI and lower values of NDBI, STP capacity, Cooling Range, and Cooling Intensity. Two instances of heating effect were recorded in Ghatkopar, refer Figure 6. This is reflected in the rising TVI, ΔTC, and Cooling Intensity values of Ghatkopar seen in Figure 7. The capacity of Ghatkopar STP is also comparatively higher. Despite the lower capacity value for Dharavi STP, a high cooling effect is observed.
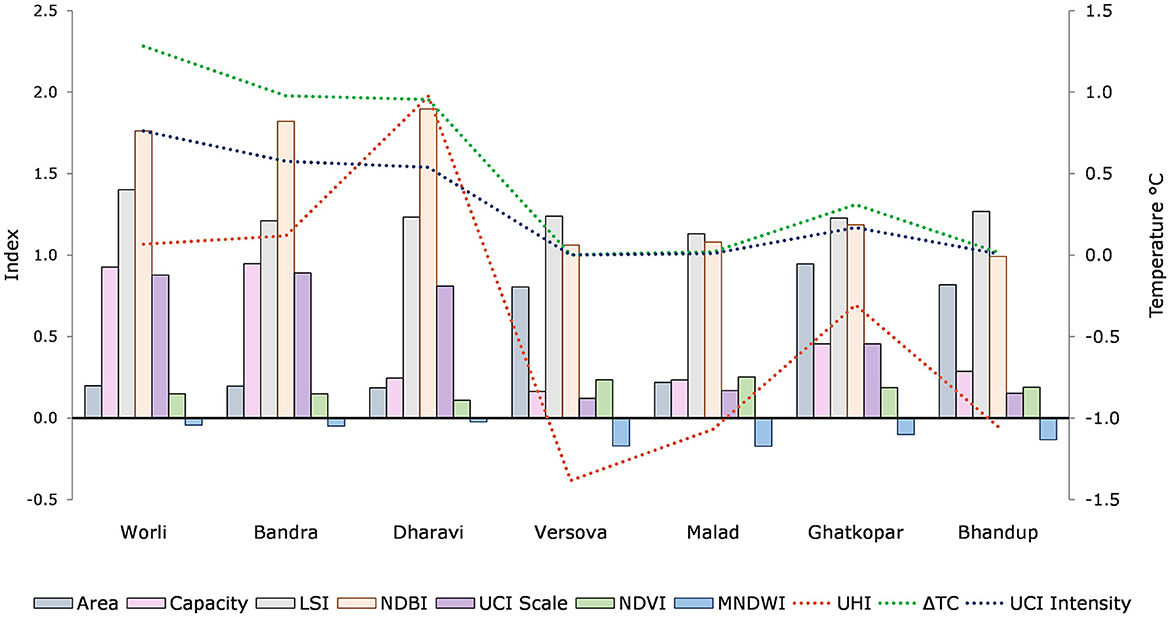
Figure 7. Graph comparing 7 Mumbai STPs' buffer area performance for LSI, NDBI, NDVI, MNDWI, TVI, Cooling Intensity, and Temperature Difference (ΔTC).
To further evaluate the relationship between these parameters, a multiple regression analysis was undertaken, refer Tables 5, 6. The dependent variables selected for heating/cooling profile evaluation were TVI, Cooling Range, and Cooling Intensity. The independent variables selected were LSI, NDBI, NDVI, MNDWI, STP Area, and STP Capacity. Table 5 shows the descriptive statistics of the model parameters. Table 6 entails the multiple regression analysis results for the six models derived.
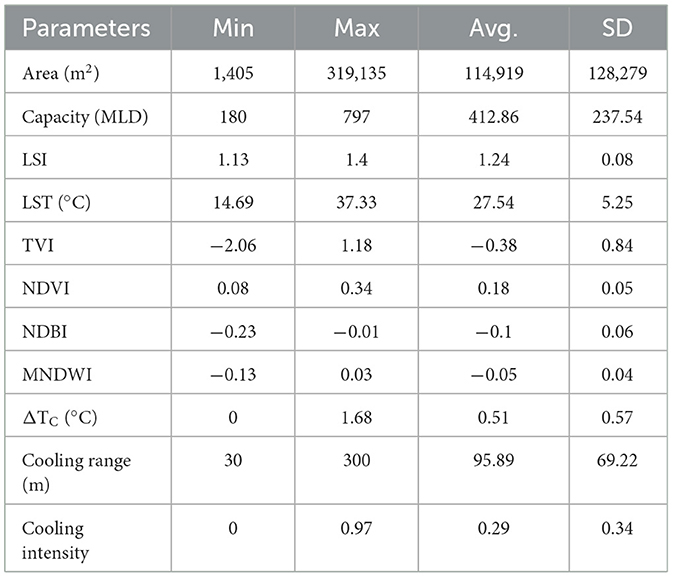
Table 5. Descriptive statistics of model parameters.
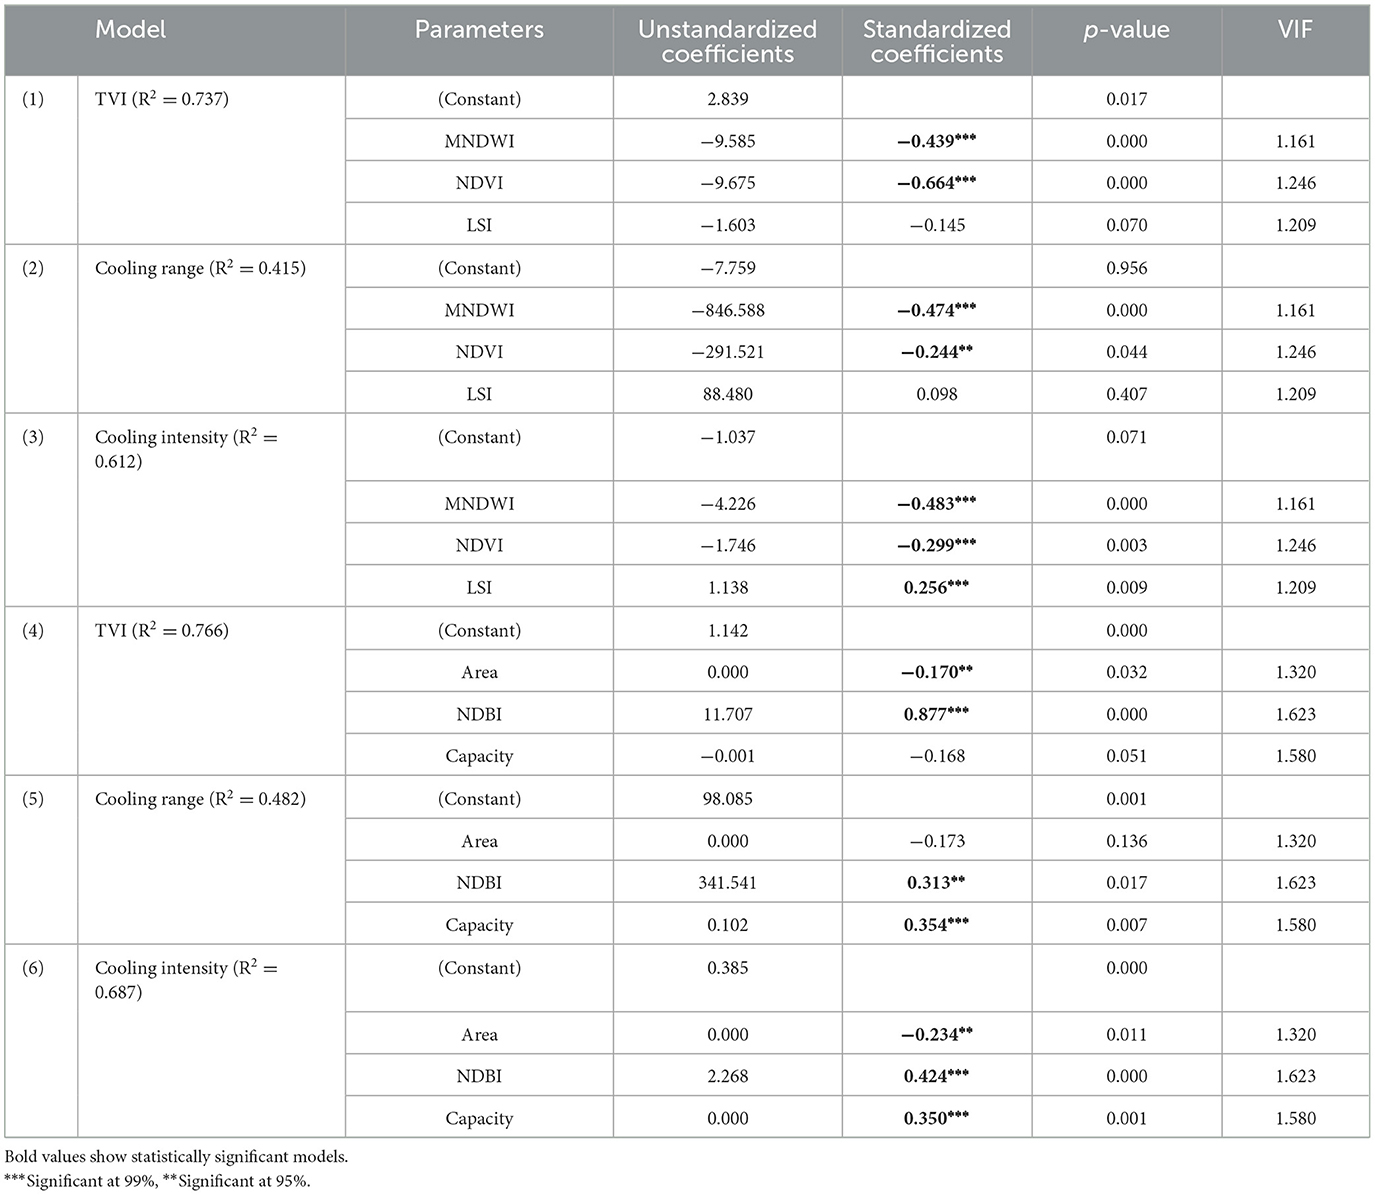
Table 6. Regression analysis results of TVI, cooling range, and cooling intensity (2014–2021).
3.5 MNDWI, NDVI, and LSI
For the multiple regression analysis, two sets of model parameters, namely MNDWI, NDVI and LSI, along with STP Area, STP Capacity and NDBI were each tested against the dependent variables of TVI, CR and CI respectively. Table 6 reports the R2 value, coefficients, significance value and the Variance Inflation Factor (VIF) of these models. NDVI and NDBI showed high collinearity and hence were not included in the same model. The first model set included MNDWI, NDVI and LSI. With an R2 value of 0.73, the first model with dependent variable TVI showed a high goodness of fit score. The first model suggests that MNDWI and NDVI are both negatively correlated to TVI. That is, with higher presence of vegetation/wetlands/water bodies within the buffer zone, the thermal variance observed is lowered. MNDWI and NDVI show a significant negative correlation to Cooling Range and Cooling Intensity in models 2 and 3, respectively. This suggests that if the buffer zone has a higher area of water bodies or vegetation, the cooling range and cooling intensity provided by the STP also reduce significantly. STPs which had lower NDVI and MNDWI and higher NDBI in the buffer zone showed higher cooling range and cooling intensity. The NDBI usually increases in instances of lower NDVI and MNDWI. As thermal variation is lower in higher vegetation/waterbody cases, the cooling intensity exhibited by the specific STP is also lowered, in comparison with cases of buffer zones with higher NDBI. The Landscape Shape Index (LSI) shows a negative correlation to TVI. With a higher LSI value, the STP with more complex shapes show lower thermal variation. The third model further indicates LSI having a significant positive impact on Cooling Intensity. With a higher LSI value, the cooling intensity of the STP was found to be higher.
3.6 NDBI, STP area, and STP capacity
The fourth model (refer Table 6) shows a significantly high positive correlation between NDBI and TVI. Similarly, the built index showed high positive correlation with the Cooling Range and Cooling Intensity respectively. This indicates a higher possibility of thermal variance within the STP buffer zone having densely built spaces. The STP capacity was not found to significantly impact the TVI. However, CR and CI showed a significant positive correlation to the STP capacity. The cooling range and intensity could increase with a higher STP capacity. The STP area showed a significant negative correlation for TVI and CI. This indicates that given a smaller STP area, the thermal variance or Cooling Intensity will be higher.
4 Discussion
The regression analysis results indicated that NDVI, NDBI, and MNDWI were among the main factors to affect the TVI, Cooling Range and Cooling Intensity associated with the STP.
4.1 STP surroundings, thermal variation and cooling effect
4.1.1 Cooling cluster: Worli, Bandra, and Dharavi
This study analyzed the thermal variation of seven STPs including their 500 m radius buffer zones in Mumbai. Three STPs of Worli, Bandra and Dharavi were located within dense urban areas. These cases had high NDBI values in the buffer areas and low NDVI and MNDWI values. All three cases had informal housing clusters/slums apart from other built typologies within the buffer zone of 500 m radius. As shown in Figure 5, the slums within the buffer zones for Worli were also associated with elevated LST and TVI values. As the NDVI and MNDWI values were low for these buffer zones, the STP and the immediate vegetation cover within the STP contributed significantly to the cooling effect. Profile stack graph across the buffer zone with the STP in center demonstrated a significant slump in the TVI values (refer Figure 4), indicating the cooling effect. For the study timeframe (2014–2021), the mean ΔT was highest for Dharavi at 1.99°C and least for Worli at 0.95°C (refer Table 4). The difference between the summer and winter mean ΔT for Dharavi was <0.01°C. The Dharavi STP showed significantly high NDBI values with higher slum coverage. On the contrary, the Bandra STP had high NDBI values but relatively lower slum coverage. The summer and winter mean ΔT difference for Bandra was 0.74°C. This highlights the significant contribution of the built typology toward urban heating. For Dharavi and Worli STPs, the cooling effect were similar, irrespective of seasonal variation. The Cooling Range for Bandra STP was found to be highest at 161.25 m, followed by Worli and Dharavi STPs (refer Table 3). The Cooling Intensity was found to be highest for Worli STP at 0.76, followed by Bandra and Dharavi STPs. The cases of Bandra and Dharavi showed comparable ΔTC and Cooling Intensity. However, the Cooling Range of Bandra STP was found significantly higher than Dharavi STP.
4.1.2 Heating cluster: Versova, Malad, Ghatkopar, and Bhandup
The four STPs of Versova, Malad, Ghatkopar and Bhandup are located in the city outskirts among wetlands and waterbodies. These cases showed high NDVI and MNDWI values and low NDBI values in comparison to the cooling cluster STPs. For this cluster, the difference between summer and winter mean ΔT was significant and showed the impact of seasonal variation (refer Table 4). The heating cluster showed very low Cooling Range, Cooling Intensity and ΔTC (refer Table 3). As seen in Figure 4, the Versova STP shows significant heating effect. Similarly, the other STPs in this cluster also contribute toward urban heating. The cooling effect observed for STPs located in areas with high vegetation was found to be nominal.
4.2 Planning, design, and policy implications
The STPs located within densely built surroundings displayed significant cooling effect, while the ones located near wetlands presented considerable heating effect. Coupled with green strategies, the retrofitted green-gray infrastructure can be used to mitigate the urban heat island effect as observed in densely built cities. Urban planners and designers could incorporate learnings from this study to identify ideal locations for upcoming greenfield STP projects. GI projects that include water management systems are essential services in urban planning. With rapid urbanization, climate change, and global warming threats, it is essential to evaluate the impacts of existing water management systems on the surroundings. The resulting inferences could provide great insights to planners and policymakers for future development. Cities in the Global South are rapidly strengthening their GI, providing for the ever-increasing population. With learnings from this study, the upcoming projects could undertake precautionary steps to mitigate urban ills of heat island effects and capitalize on the cooling effect identified herein where needed. With the integration of Nature- based Solutions where feasible, essential ecosystem services could be provided to achieve climate-resilient solutions (Browder et al., 2019).
4.3 Study limitations and future scope
This study utilized remotely sensed satellite imagery to derive the analytical parameters. The study did not include local air temperature records owing to the lack of meteorological stations in the study vicinity. Cross-validation with on-site air temperature measurements could further strengthen the study results. Furthermore, a comparative analysis between similar STPs in other Indian cities could fortify the learnings. The decarbonization of STP operational processes and the inclusion of green building strategies to reduce urban heat (He, 2022) could be future prospects of this research. The Cooling Effect assessment involves a manual observation of the inflection point to derive the Cooling Range (Kong et al., 2014; Lee et al., 2016; Cruz et al., 2019). This parameter selection could be automated using machine learning models in larger studies to evade human errors. The future scope of this study could include consolidating the Cooling Effect index derivation with GIS-backed models.
5 Conclusion
This research used Landsat 8 remote sensing images of a total of 8 dates from the years 2014, 2016, 2019, and 2021. Two dates from the summer and winter months per chosen year were selected to assess the impact of seasonal variation. Using the RS images, the study demonstrated the contribution of seven Mumbai STPs to the local heating and cooling effect. For the selected dates, the STPs located around wetlands including Versova, Malad, Ghatkopar and Bhandup showed an overall heating effect. The summer ΔT was much higher than the winter ΔT for these cases as well, refer Table 4. These cases also displayed a drastic drop in the ΔT between the summer and winter dates. STPs located within densely built areas including cases of Worli, Bandra and Dharavi, showed an overall cooling effect. For the case of Worli and Dharavi, the summer and winter ΔT did not show any variation. The highest values of Cooling Range and Cooling Intensity were recorded for Worli, Bandra, and Dharavi. This demonstrates that for cases of existing STPs located within the city, there exists an urban cooling potential. In combination with additional nature-based solutions and retrofitting, the existing GI could thus contribute to ameliorating urban heat islands. Land-use indices of NDVI, NDBI, and MNDWI were found to have high significance value in the regression analysis undertaken. STP characteristics parameters like area, capacity and LSI were also found to be significant in some models. MNDWI and NDVI showed a significant negative correlation to the Thermal Variation Index. Higher thermal variation is predicted in STP cases with lower water and vegetation indices. Additionally, the cooling range and intensity demonstrated by the STP increase in instances where the built index is higher within the buffer zone. TVI and Cooling Intensity showed a significant negative correlation with the STP area. In conclusion, the study demonstrated the cooling potential of existing STPs in densely built urban areas. Synergizing green building strategies within the design, construction, and operation of proposed STPs would further aid in alleviating urban heat challenges. Incorporating other green-gray strategies, urban planners can utilize existing GI to mitigate drastic thermal variance effect and provide climate-resilient solutions.
Data availability statement
The raw data supporting the conclusions of this article will be made available by the authors, without undue reservation.
Author contributions
The author confirms sole responsibility for the following: study conception and design, data collection, analysis and interpretation of results, and manuscript preparation.
Conflict of interest
DS is the founder of DS Urban Analytics.
The author declares that the research was conducted in the absence of any commercial or financial relationships that could be construed as a potential conflict of interest.
Publisher's note
All claims expressed in this article are solely those of the authors and do not necessarily represent those of their affiliated organizations, or those of the publisher, the editors and the reviewers. Any product that may be evaluated in this article, or claim that may be made by its manufacturer, is not guaranteed or endorsed by the publisher.
Abbreviations
GI, Gray Infrastructure; STP, Sewage Treatment Plant; LST, Land Surface Temperature; UHI, Urban Heat Island; UCI, Urban Cooling Island; TVI, Thermal Variance Index; CE, Cooling Effect; CR, Cooling Range; CI, Cooling Intensity; NDVI, Normalized Difference Vegetation Index; NDBI, Normalized Difference Built-up Index; MNDWI, Modified Normalized Difference Water Index; LSI, Landscape Shape Index; ΔT, Temperature Difference; ΔTC, Temperature Difference for Cooling Effect; MLD, Million Liters per Day; SDG, Sustainable Development Goals; MLC, Maximum Likelihood Classification; MCGM, Municipal Corporation of Greater Mumbai; USGS, United States Geological Survey; RS-GIS, Remote Sensing and Geographic Information System; HC, Heating effect STP Cluster; CC, Cooling effect STP Cluster.
References
Afolalu, S. A., Ikumayapayi, O., Ogendenbe, T. S., Kazeem, R., and Ogundipe, A. (2022). Waste pollution, wastewater and effluent treatment methods – an overview. Mater Today: Proc. 62, 3282–3288. doi: 10.1016/j.matpr.2022.04.231
Aithal, B. H., and Ramachandra, T. V. (2016). Visualization of urban growth pattern in chennai using geoinformatics and spatial metrics. J. Indian Soc. Remote Sens. 44, 617–633. doi: 10.1007/s12524-015-0482-0
Artis, D. A., and Carnahan, W. H. (1982). Survey of emissivity variability in thermography of urban areas. Remote Sens. Environ. 12, 313–329. doi: 10.1016/0034-4257(82)90043-8
Berger, C., Rosentreter, J., Voltersen, M., Baumgart, C., Schmullus, C., and Hese, S. (2017). Spatio-temporal analysis of the relationship between 2D/3D urban site characteristics and land surface temperature. Remote Sens. Environ. 193, 225–243. doi: 10.1016/j.rse.2017.02.020
Broadbent, A. M., Couttes, A., Tapper, N., Demuzzere, M., and Beringer, J. (2018). The microscale cooling effects of water sensitive urban design and irrigation in a suburban environment. Theor. Appl. Climatol. 134, 1–23. doi: 10.1007/s00704-017-2241-3
Browder, G., Ozment, S., Rehberger Bescos, I., Gartner, T., and Lange, G.-M. (2019). Integrating Green and Gray: Creating Next Generation Infrastructure. Washington, D.C. Washington, D.C.: World Resources Institute.
Census of India (2011). “Census of India, 2011,” in Economic and Political Weeklyo, 5. Available online at: https://cdn.s3waas.gov.in/s311b921ef080f7736089c757404650e40/uploads/2018/04/2018040279.pdf (accessed November 1, 2022).
Charlesworth, S. M. (2010). A review of the adaptation and mitigation of global climate change using sustainable drainage in cities. J. Water Climate Chang. 1, 165–180. doi: 10.2166/wcc.2010.035
CPCB (2013). Evaluation of Sewage Treatment Plants India. New Delhi. Available online at: https://cpcb.nic.in/openpdffile.php?id=UmVwb3J0RmlsZXMvMjlfMTQ1ODExMDk5Ml9OZXdJdGVtXzE5NV9TVFBfUkVQT1JULnBkZg
CPCB (2021). National Inventory of Sewage Treatment Plants March 2021. Available online at: https://cpcb.nic.in/openpdffile.php?id=UmVwb3J0RmlsZXMvMTIyOF8xNjE1MTk2MzIyX21lZGlhcGhvdG85NTY0LnBkZg== (accessed October 28, 2022).
Cruz, J. A., Santos, J. A., Garcia, J. J., Blanco, A. C., and Moscoco, A. (2019). Spatiotemporal Analysis of the Urban Cooling Island (UCI) Effect of Water Spaces in a Highly Urbanized City : A Case Study Of Iloilo River and Adjacent Wetlands, 14–15.
Dai, Z., Guldmann, J. M., and Hu, Y. (2018). Spatial regression models of park and land-use impacts on the urban heat island in central Beijing. Sci. Total Environ. 626, 1136–1147. doi: 10.1016/j.scitotenv.2018.01.165
Dankelman, I. E. (2007). “Environment for Development,” in Global Environment Outlook 4. Nairobi: UNEP, 399–408. Available online at: http://hdl.handle.net/2066/34832 (accessed November 1, 2022).
Demuzere, M., Orru, K., Heidrich, O., Olazabal, E., Geneletti, D., Orru, H., et al. (2014). Mitigating and adapting to climate change: Multi-functional and multi-scale assessment of green urban infrastructure. J. Environ. Manage. 146, 107–115. doi: 10.1016/j.jenvman.2014.07.025
Dhorde, A. G., Korade, M. S., and Dhorde, A. A. (2017). Spatial distribution of temperature trends and extremes over Maharashtra and Karnataka States of India. Theor. Appl. Climatol. 130, 191–204. doi: 10.1007/s00704-016-1876-9
Gunawardena, K. R., Wells, M. J., and Kershaw, T. (2017). Science of the total environment utilising green and bluespace to mitigate urban heat island intensity. Sci. Total Environ. 584–585, 1040–1055. doi: 10.1016/j.scitotenv.2017.01.158
Haaland, C., and van den Bosch, C. K. (2015). Challenges and strategies for urban green-space planning in cities undergoing densification: a review. Urban For. Urban Green. 14, 760–771. doi: 10.1016/j.ufug.2015.07.009
He, B. J. (2022). Green building: a comprehensive solution to urban heat. Ener. Build. 271, 112306. doi: 10.1016/j.enbuild.2022.112306
Jamei, E., and Tapper, N. (2019). WSUD and Urban Heat Island Effect Mitigation, Approaches to Water Sensitive Urban Design. Amsterdam: Elsevier Inc.
Johnson, D., Exl, J., and Geisendorf, S. (2021). The potential of stormwater management in addressing the urban heat island effect: An economic valuation. Sustainability 13, 16. doi: 10.3390/su13168685
Kimothi, S., Thapliyal, A., Gehlot, A., Aledaily, A., Gupta, A., Bilandi, N., et al. (2023). Spatio-temporal fluctuations analysis of land surface temperature (LST) using Remote Sensing data (LANDSAT TM5/8) and multifractal technique to characterize the urban heat Islands (UHIs). Sustain. Ener. Technol. Assessm. 55, 102956. doi: 10.1016/j.seta.2022.102956
Kong, F., Yin, H., Wang, C., Cavan, G., and James, P. (2014). A satellite image-based analysis of factors contributing to the green-space cool island intensity on a city scale. Urban For. Urban Green. 13, 846–853. doi: 10.1016/j.ufug.2014.09.009
Lee, D., Oh, K., and Seo, J. (2016). An analysis of urban cooling island (UCI) effects by water spaces applying UCI indices. Int. J. Environ. Sci. Dev. 7, 0–5. doi: 10.18178/ijesd.2016.7.11.886
Li, J., Ni, Z., Chen, S., and Xia, B. (2020). An integrated strategy to improve the microclimate regulation of green-blue-grey infrastructures in specific urban forms. J. Cleaner Prod. 271, 122555. doi: 10.1016/j.jclepro.2020.122555
McGarigal, K., and Marks, B. J. (1995). FRAGSTATS: Spatial Pattern Analysis Program for Quantifying Landscape Structure. General Technical Report PNW-351. Portland, OR: U.S. Department of Agriculture, Forest Service, Pacific Northwest Research Station.
MCGM (2011). MCGM Land use Classification. Mumbai: MCGM. Available online at: https://udri.org/pdf/03%20working%20paper%202.pdf (accessed October 25, 2022).
Mehrotra, S., Bardhan, R., and Ramamritham, K. (2019). Outdoor thermal performance of heterogeneous urban environment: an indicator-based approach for climate-sensitive planning. Sci. Total Environ. 669, 872–886. doi: 10.1016/j.scitotenv.2019.03.152
Mehrotra, S., Bardhan, R., and Ramamritham, K. (2020). Diurnal thermal diversity in heterogeneous built area: Mumbai, India. Urban Climat. 32, 100627. doi: 10.1016/j.uclim.2020.100627
Mulligan, J., Bukachi, V., Clause, C., Jewel, R., Kirmi, E., and Odbert, C. (2020). Hybrid infrastructures, hybrid governance: new evidence from Nairobi (Kenya) on green-blue-grey infrastructure in informal settlements. Anthropocene. 29, 100227. doi: 10.1016/j.ancene.2019.100227
Nguyen, T. K. L., Ngo, H. H., Guo, W., Nguyen, T. L. H., Chang, S. W., Nguyen, D. D., et al. (2021). Environmental impacts and greenhouse gas emissions assessment for energy recovery and material recycle of the wastewater treatment plant. Sci. Total Environ. 784, 147135. doi: 10.1016/j.scitotenv.2021.147135
Nowak, O., Enderle, P., and Varbanov, P. (2015). Ways to optimize the energy balance of municipal wastewater systems: lessons learned from Austrian applications. J. Cleaner Prod. 88, 125–131. doi: 10.1016/j.jclepro.2014.08.068
Obaideen, K., Shehata, N., Sayed, E., Abdelkareem, M., Mahmoud, M., and Olabi, A. (2022). The role of wastewater treatment in achieving sustainable development goals (SDGs) and sustainability guideline. Energy Nexus. 7, 100112. doi: 10.1016/j.nexus.2022.100112
Qi, J.-D., He, B., Wang, M., Zhu, J., and Fu, W. (2019). Do grey infrastructures always elevate urban temperature? No, utilizing grey infrastructures to mitigate urban heat island effects. Sust. Cities Soc. 46, 101392. doi: 10.1016/j.scs.2018.12.020
Rana, A., Uvo, C. B., Bengtsson, L., and Parth Sarthi, P. (2012). Trend analysis for rainfall in Delhi and Mumbai, India. Climat. Dynam. 38, 45–56. doi: 10.1007/s00382-011-1083-4
Reddy, S. N., Manikiam, B., and Jeevalakshmi, D. (2017). Land surface temperature retrieval from LANDSAT data using emissivity estimation. Int. J. Appl. Eng. Res. 12, 9679–9687. Available online at: https://www.ripublication.com/ijaer17/ijaerv12n20_57.pdf
Sarkar, S., and Bhattacharyya, T. K. (2015). Environmentally sustainable development of urban settlements in India: a framework for development of indicators. 10, 121–142. doi: 10.12944/CWE.10.1.15
Sinha, A. K., Vimal, J. K., Swami, R. D., and Gautam, S. P. (2009). Status of Water Supply, Wastewater Generation and Treatment in Class-I Cities and Class-II Towns of India: Central Pollution Control Board (Ministry of Environment and Forests, Govt. of India). Available online at: www.cpcb.nic.in (accessed October 26, 2022).
Sun, R., Chen, A., Chen, L., and Lu, Y. (2012). Cooling effects of wetlands in an urban region : the case of Beijing. Ecol. Indicat. 20, 57–64. doi: 10.1016/j.ecolind.2012.02.006
Szabó, S., Gácsi, Z., and Balázs, B. (2016). Specific Features Of NDVI, NDWI And MNDWI As Reflected In Land Cover Categories.
UN Habitat WHO UNISDR, UNEP, UNDP, UNESCO. (2016). SDG Goal 11 - Monitoring Framework. A guide to assist national and local governments to monitor and report on SDG goal 11 indicators. Available online at: https://www.habitants.org/content/download/325647/4155401/file/SDG-Goal%2011%20Monitoring%20Framework%2025-02-16.pdf (accessed October 26, 2022).
UNEP (2017). Green Infrastructure Guide for Water Management: Ecosystem-based management approaches for water-related infrastructure projects, Green Infrastructure Guide for Water Management: Ecosystem-based management approaches for water-related infrastructure projects. Available online at: https://wedocs.unep.org/bitstream/handle/20.500.11822/9291/-Greeninfrastructure:guideforwatermanagement-2014unep-dhigroup-green-infrastructure-guide-en.pdf?sequence=3&%3BisAllowed=.%E2%80%9D (accessed October 26, 2022).
Vinayak, B., Lee, H. S., Gedam, S., and Latha, R. (2022). Impacts of future urbanization on urban microclimate and thermal comfort over the Mumbai metropolitan region, India. Sust. Cities Soc. 79, 103703. doi: 10.1016/j.scs.2022.103703
Wagner, F., Nusrat, F., Thiem, L., and Akanda, A. (2022). Assessment of urban water-energy interactions and heat island signatures in Rhode island. Energy Nexus 7, 100093. doi: 10.1016/j.nexus.2022.100093
Wang, J, Meng, Q., Zou, Y., Qi, Q., Tan, K., Santamouris, M., et al. (2022). Performance synergism of pervious pavement on stormwater management and urban heat island mitigation: A review of its benefits, key parameters, and co-benefits approach. Water Res. 221, 118755. doi: 10.1016/j.watres.2022.118755
Xu, H. (2005). Mndw I 徐涵秋. National Remote Sensing Bulletin. Available online at: https://www.researchgate.net/publication/284418225%0AA (accessed October 26, 2022).
Xu, H. (2019). Modification of normalized difference water index (NDWI) to enhance open water. Feat. Remot. Sensed Imag. 27, 3025–3033. doi: 10.1080/01431160600589179
Yamagata, H., Nasu, M., Yoshizawa, M., Miyamoto, A., and Minamiyama, M. (2008). Heat island mitigation using water retentive pavement sprinkled with reclaimed wastewater. Water Sci. Technol. 57, 763–771. doi: 10.2166/wst.2008.187
Yu, Z., Yang, G., Zuo, S., Jorgensen, G., Kaga, M., and Vejre, H. (2020). Urban forestry and urban greening critical review on the cooling effect of urban blue-green space: a threshold- size perspective. Urban For. Urban Green. 49, 126630. doi: 10.1016/j.ufug.2020.126630
Zha, Y., Gao, J., and Ni, S. (2003). Use of normalized difference built-up index in automatically mapping urban areas from TM imagery. Int. J. Remote Sens. 24, 583–594. doi: 10.1080/01431160304987
Zhang, Y. (2006). Land surface temperature retrieval from CBERS-02 IRMSS thermal infrared data and its applications in quantitative analysis of urban heat island effect. J. Remote Sens. 10, 789–797. doi: 10.11834/jrs.200605117
Keywords: gray infrastructure, sewage treatment plant, land surface temperature, heating and cooling profile, Global South
Citation: Subramanian D (2023) Quantifying thermal variation around gray infrastructure in urban India. Front. Water 5:1091871. doi: 10.3389/frwa.2023.1091871
Received: 07 November 2022; Accepted: 24 October 2023;
Published: 23 November 2023.
Edited by:
Melissa Allen, Oak Ridge National Laboratory (DOE), United StatesReviewed by:
Paria Shojaei, Isfahan University of Technology, IranBao-Jie He, Chongqing University, China
Mo Wang, Guangzhou University, China
Copyright © 2023 Subramanian. This is an open-access article distributed under the terms of the Creative Commons Attribution License (CC BY). The use, distribution or reproduction in other forums is permitted, provided the original author(s) and the copyright owner(s) are credited and that the original publication in this journal is cited, in accordance with accepted academic practice. No use, distribution or reproduction is permitted which does not comply with these terms.
*Correspondence: Divya Subramanian, ZGl2eWFzdWJyYW1hbmlhbnN1cmVzaEBnbWFpbC5jb20=