
94% of researchers rate our articles as excellent or good
Learn more about the work of our research integrity team to safeguard the quality of each article we publish.
Find out more
ORIGINAL RESEARCH article
Front. Water, 17 July 2023
Sec. Water and Human Systems
Volume 5 - 2023 | https://doi.org/10.3389/frwa.2023.1087076
This article is part of the Research TopicFlood Risk Perception, Vulnerability, and Risk: From Assessments to AnalysesView all 6 articles
 Emad H. Habib1*
 Brian Miles2
 Liz Skilton3
 Mohamed ElSaadani1
 Anna C. Osland4Emma Willis3
 Robert Miller1
 Trung Do1
 Stephen R. Barnes4
The lack of community-relevant flood informational resources and tools often results in inadequate and divergent understandings of flood risk and can impede communities' ability to function cohesively in the face of increasing flood threats. The current study reports on a set of workshops that the authors conducted with various groups (citizens, city engineers and planners, realtors and builders, and media representatives) within a flood prone community to evaluate how novel hydroinformatic tools that include hydrodynamic modeling, geospatial visualization, and socioeconomic analysis can enhance understanding of flood risk and engagement in flood risk mitigation among diverse community members. The workshops were designed to help identify stakeholder preferences regarding key functionality needed for integrated hydroinformatic technologies and socioeconomic analyses for flood risk reduction. Workshop participants were asked to use and comment on examples of prototype flood risk informational tools, such as: (1) flood damage estimation tool, (2) drivability and emergency accessibility tool, and (3) community-scale social and economic metrics tool. Data gathered from workshops were analyzed using qualitative analysis based on a grounded-theory approach. Data were coded by hand based on themes identified by the research team and incorporated deviant case analysis to ensure minority opinions was represented. The study results are focused on the following main themes and how flood tools can address them: (1) improving the understanding of flood risk and engagement in flood risk mitigation, (2) reducing the gap between individual and community risk, (3) challenges in communicating flood risk information, (4) enhancing relevance to and engagement of the community, and (5) enabling actionable information. Our research demonstrates the need for community-anchored tools and technologies that can illustrate local context, include local historical and simulated events at multiple levels of community impact, enable analyses by flood professionals while also providing simplified tools of use by citizens, and allow individuals to expand their knowledge beyond their homes, businesses, and places of work.
Lack of understanding of individual- and community-level flood risk contributes to disengagement from flood mitigation decision making, both at individual and community levels (Lechowska, 2018; Wang et al., 2018; Verlynde et al., 2019). In the context of this study, the term “flood risk” is defined as the combination of the likelihood of flooding and the associated impacts and consequences of such flooding. The lack of shared understanding among stakeholders in flood-prone communities can lead to conflicting views on what causes flooding and what flood mitigation measures are most effective. Some key reasons behind this disconnect in communities were discussed in Bradford et al. (2011), Stewart and Rashid (2011), and Skilton et al. (2022) and include: (1) ineffective communication between engineering/planning communities and stakeholders on the uncertainties associated with assessment of flood risk and expected impacts of flood mitigation projects, as well the use of complex terms such as exceedance probability and recurrence intervals; (2) inadequate characterization of community-level flood risk; and (3) divergent perceptions of how changes made to the natural and built environments have led to flood damage from past storms.
Increasingly, hydroinformatic tools—including but not limited to hydrologic and hydrodynamic models and geospatial web portals—are being used in participatory settings to overcome lack of shared understanding and to increase engagement with flood risk and integrated water resources management (e.g., Maskrey et al., 2016; Basco-Carrera et al., 2017; Landström et al., 2019). Mostafiz et al. (2022) evaluated 15 publicly available web-based flood risk communication tools for the degree to which they provided actionable information to their intended audiences. They defined actionable information as data relevant to flood magnitude, damage due to floods, mitigation to minimize damage, and cost of mitigation. Flood communication tools were classified into a typology with two dimensions: (1) the time scale on which information can be actionable, ranging from short-term, real-time tools that are intended for immediate preparation and response, to long-term planning tools that could be useful for mitigating flood hazard impacts; and (2) the intended audience of the information, ranging from citizens to community stakeholders such as policymakers, builders, and planners. Mostafiz et al. (2022) found that most flood communication tools were real-time tools targeted toward flood professionals. Those that were tailored to citizens lacked quantitative information on risk and the cost-benefit of mitigation, provided little actionable information, or provided only real-time information (rather than planning-oriented information).
A recent focus group study (Skilton et al., 2022) called for community-centered research to identify gaps in and needs for flood resources and technology tools that can support communities in achieving more connected and cohesive solutions for addressing flood risk. The review of Mostafiz et al. (2022) did not entail gathering empirical data from users about what benefits they saw from using flood risk communication tools. The current study build on these recent efforts in order to gain a direct insight from different community sectors with the goal of evaluating how advances in hydrodynamic modeling, geospatial visualization, and the fusion of heterogeneous data from socioeconomic analysis can help individual citizens develop more accurate understanding of their flood risk and a greater appreciation for their community's social risks. We hypothesize that such advanced tools should clarify the potential benefits of reducing individual risk and add support for collective action needed to reduce social risk.
In this study, we report on a set of interactive workshops that we conducted with diverse stakeholders in Lafayette Parish, a flood-prone community in Louisiana, USA, to examine communities' needs for and perceptions of flood informational tools and how such tools can enhance engagement in and collaboration with flood risk mitigation among diverse community members. To collect authentic feedback from the community, we used a set of preliminary web-based tools that we developed based on actual data and model simulations for a major watershed in the same community. These preliminary tools, along with another example from a national-scale tool, provided the participants with opportunities to examine flooding impacts on structures in their community (e.g., homes, businesses, etc.), on road drivability, and on accessibility to emergency facilities. We also illustrated some examples of community-scale social and economic metrics to facilitate discussion around the idea of individual vs. community risk. These resources were not presented as the ultimate solution for flood tools in the community, but we used them as examples of possible resources that quantify flood risk at various scales and for different audiences. The focus was not on evaluating these particular tools; instead, we used them as a vehicle to promote participants' discussions and to gather information on their needs and perspectives using data and scenarios that they can easily relate to.
The workshops and the feedback collected by the participants will be used to address the following objectives envisioned for the current study: (1) To gain insight on the content and design attributes of flood information tools that are most effective for (a) quantifying individual flood risk, and (b) broadening the understanding of flood risk beyond individual impact into a community-scale risk; (2) To assess possible barriers in communicating highly technical, and sometimes, uncertain flood information to diverse groups within the community, taking into account their historical and local knowledge; and (3) To better understand how flood information tools can enhance the engagement of the community in flood mitigation in such a way that can alleviate conflicting views of flood risk and provide pathways to shared visions of potential solutions. The results of this study will help to identify stakeholder preferences regarding key functionality of integrated hydroinformatic technologies and socioeconomic analyses for flood risk reduction. Such technologies can help reveal misconceptions and knowledge gaps about flood risk and provide opportunities for stakeholders to exchange knowledge and ultimately influence or become better informed about public policy.
The community that this study is focused on is Lafayette Parish (county), which is located in southern Louisiana, USA, and has a population of 126,143. The Cities of Lafayette, Scott, Youngsville, and Broussard form the urban centers for the parish, with other rural and semi-rural communities throughout the parish. The parish has 55,440 housing units with a median housing value of $181,900. The parish is home to more than 10,030 businesses that employ 131,571 employees with an average annual pay of $48,448 (U.S. Bureau of Labor Statistics, 2019). Almost 17% of the population of Lafayette Parish lives below the federal poverty level, including 24% of children under age 18 (US Census Bureau, 2021). The Social Vulnerability Index ranks cities in Lafayette Parish in the low to medium-low category.
Louisiana is historically prone to significant riverine and coastal flooding due to its position on the Gulf of Mexico and in relation to the Mississippi River and its tributaries and distributaries. Located ~50 miles inland from the Gulf of Mexico, Lafayette Parish experiences mostly pluvial and riverine flooding but rare coastal flooding. The area is characterized by low-gradient topography that results in slow drainage (Watson et al., 2017). Combined with the presence of large natural storage areas (e.g., swamps), the area is characterized by complex flow regimes such as reverse flows and backwater effects (Waldon, 2018; Saad et al., 2021) that complicate the decision-making process about which flood mitigation measures to pursue.
Figure 1 depicts the study area including Lafayette Parish and its main hydrologic features. The parish is transected by the Vermilion River that eventually flows south to the Gulf of Mexico. The river acts as a major drainage artery that collects runoff from several sub-watersheds in the parish through a series of lateral channels (also known as coulees). Another major feature in the region is a series of inter-connected swamps and lakes, locally known as the Bayou Tortue Swamp and Lake Martin, that act as natural storage areas and thus provide flood relief to the river during major storms. Due to their upstream location within the parish, they often attract flood water from the river during heavy storms and cause reverse flows in the river (i.e., from downstream to upstream), which adds further complexities to understanding the reasons for flooding and to the ability to model flood hydrodynamics accurately within the parish. These factors also highlight the natural physical connectivity that flooding brings to communities within the parish and across the neighboring parishes as they all grapple with addressing flood risk.
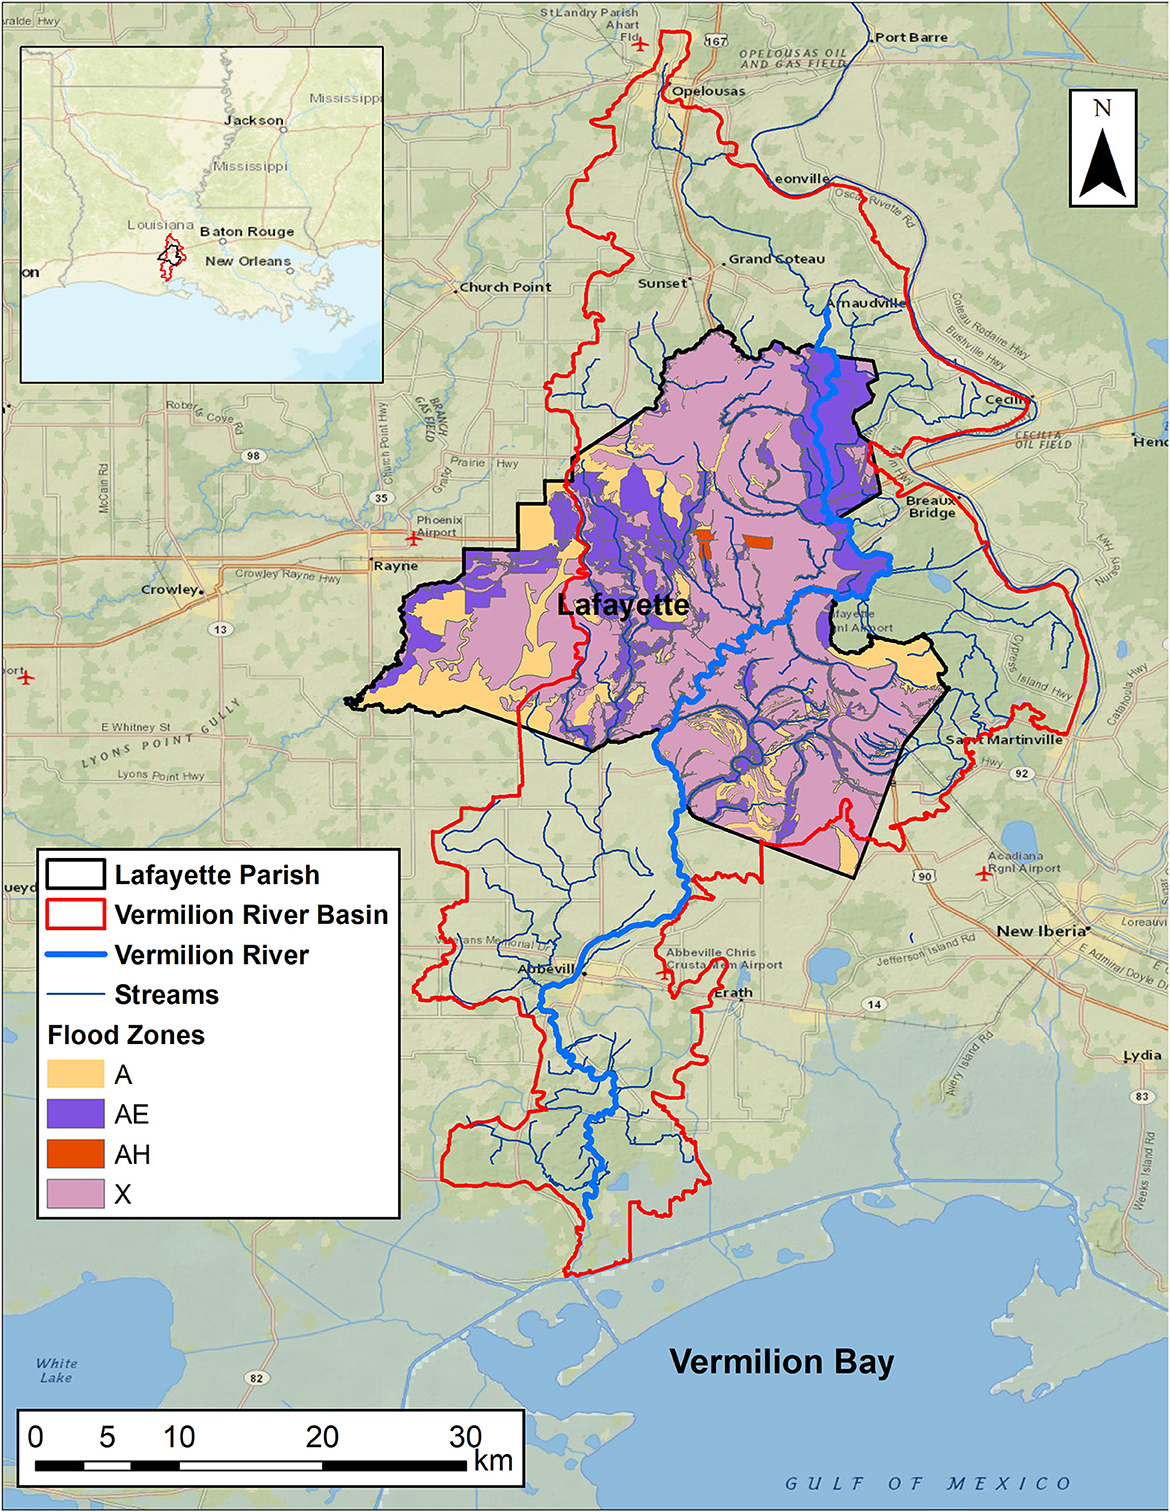
Figure 1. Map of Lafayette Parish and surrounding communities showing the boundaries of the Vermilion River watershed and its main tributaries. The Federal Emergency Management Agency (FEMA) flood zones for Lafayette Parish are also shown.
Figure 1 also illustrates the wide extent of flood risk in the parish, as evident by the FEMA Flood Zones that represent areas within the 100-year flood zone (i.e., zones A, AE, and AH). It is noted that zone X in the map does not necessarily mean that it is not a flood zone; rather, it simply means that this specific area was not included in the FEMA flood mapping study. The parish is a typical example of low-gradient areas that are commonly encountered in inland-to-coastal transitional watersheds (Bilskie and Hagen, 2018). Flooding in the parish is caused by a multitude of factors, including riverine and tributary-induced flooding, as well as flooding due to local rainfall over areas with inadequate surface storage and limited drainage capacities. The river and its tributaries are also affected by backwater effects from the Gulf, especially during tropical storms. These factors exacerbate flood risk throughout the parish as is evident in its long history of large floods. Major floods were recorded in 1927, 1940, 1953, 1955, 1966, 1971, 1973, 1977, 1980, 1982, 1989, 1993, 2014, 2016, and more recent hurricanes such as Barry in 2019 and Laura in 2020 (Watson et al., 2017). The exceptionally high river stages that accompany such major floods cause damage to hundreds of homes in communities situated along the river corridor and its surrounding watersheds. For example, the August 2016 flood has damaged more than 140,000 houses in the broader south-central Louisiana region, required evacuation of more than 20,000 people, and led to at least 13 deaths (Heal and Watson, 2017; Watson et al., 2017). Monetary losses resulting from various damage to homes, businesses, and infrastructure were estimated to be $10 billion. Overall, more than 7,000 structures, mostly homes, experienced flood damage in Lafayette, Vermilion, Iberia, and St. Martin parishes as a result of this historic event (Samenow, 2016; Terrell, 2016; Wright, 2016).
Human-made interventions, such as heavy urbanization, flood control projects, and flow regulations have altered the natural hydrology of the parish and its communities. The impacts of such alterations exacerbate the flooding potential of moderate and heavy rainfall storms. Due to recurring flood events in the region, mitigation measures are increasingly sought by local communities and state and federal water management authorities. Examples of such measures include riverine dredging (Saad and Habib, 2021), channel modifications, and regional detention. Discerning the potential relative benefits of such measures is complicated by the complex hydrology of the region and by the lack of adequate monitoring and modeling capacities. This has often led to controversies within the community about the most beneficial mitigation alternatives, as well as across different parishes about the potential adverse impacts to neighboring parishes (e.g., Capps, 2022a,b; KATC, 2022; Taylor, 2022; Turk, 2022a,b).
This study was undertaken as part of the 1-year U.S. National Science Foundation (NSF) Smart and Connected Communities (SandCC) planning grant awarded to University of Louisiana at Lafayette (UL Lafayette) in 2021. The first phase of this effort (Skilton et al., 2022) used a focus group approach to examine how community members understand their flood risk and how they perceive the need and effectiveness of flood mitigation efforts. Building on results from the focus group research, the current study seeks to identify how recent advances in hydroinformatic technologies can address gaps in communities' understanding of flood risk, and how such technologies can empower a diverse suite of stakeholders in flood-prone communities to engage in formulating and supporting effective flood mitigation strategies. We did so by conducting a set of in-person workshops during the spring and summer of 2022, facilitated by a set of preliminary flood informational tools that we developed for Lafayette Parish, as well as an example from an external tool that is available nationally.
In the current study, we conducted five workshops (3–10 individuals/workshop) with members of the greater Lafayette Parish community, with a total workshop participant sample size of 32. The workshop study was approved by UL Lafayette IRB on May 6, 2022. Workshops were conducted between May and August of 2022. Participants included members of various groups interested in flood mitigation and planning including: city government staff, realtors, and business representatives; media organizations; and selected neighborhood group representatives, representing a broad swath of the community. Participants were solicited through prior contacts with community organizations (e.g., local governments, media organizations, associations of home builders, neighborhood associations and coteries), or contacted using a snowball method of participant selection. Workshops lasted ~1 h and 30 min each, were held at a variety of time periods, and met in person to give participants access to computers to test tools and resources being demonstrated. Three workshops were held on the UL Lafayette campus and two were held off-site at community facilities with computer labs. Two workshops were held over the noon hour, two in the afternoon near the close of business, and one was held in the evening. Participants were not reimbursed for their time. During the workshops, we briefly introduced the study concept, reviewed initial data, and demonstrated preliminary tools and risk metrics that we developed locally and tools that exist nationally, such as the Flood Factor website (Riskfactor, n.d.). While demonstrating the tools, we held discussions on what the participants of each workshop need to better understand flood risk and engage in flood mitigation and planning. We used a broad definition of community risk and allowed participants to discuss it in regard to themselves and how they conceptualize community. Some participants chose to view community at the parish scale, while others chose to discuss it as it related to their neighborhood, church group, family, or another group.
To facilitate the collection of community authentic perspectives, we developed a set of web-based tools that quantify flood risk using different metrics and scales. The tools were all based on a set of hydrodynamic simulations that we performed for the Lafayette Parish as the community of interest in this study.
Simulations of a 500-year flood were used as a common data source for several of the prototype tools evaluated by workshop participants. A 500-year flood was used as an example of an extreme event that could impact the community. These simulations were developed for the drainage basins surrounding Lafayette Parish using a MIKE 21 two-dimensional hydrodynamic model (Miller, 2022). The model was based on a high resolution, LiDAR-based Digital Elevation Model (DEM) dataset. The model was developed at variable mesh resolution (70 m2 down to 15 m2) and was used to generate flood inundation depths in the Parish for a given storm event scenario (Figure 2). The hydrodynamic model produced time-varying values of water depth and water velocity at over 1,912,576 spatial points and at a computational time increment of 5 s. The model skill was assessed via comparison against high-water mark estimates obtained during the August 2016 flood in Louisiana, which approximated the 500-year event in this area. For the purposes of developing easy-to-understand prototype flood information tools, water surface elevation results were reported at a 4-h time increment for the duration of the 500-year flood event. The parish-wide hydrodynamic model simulation results were used in developing subsequent flood consequence tools described next.
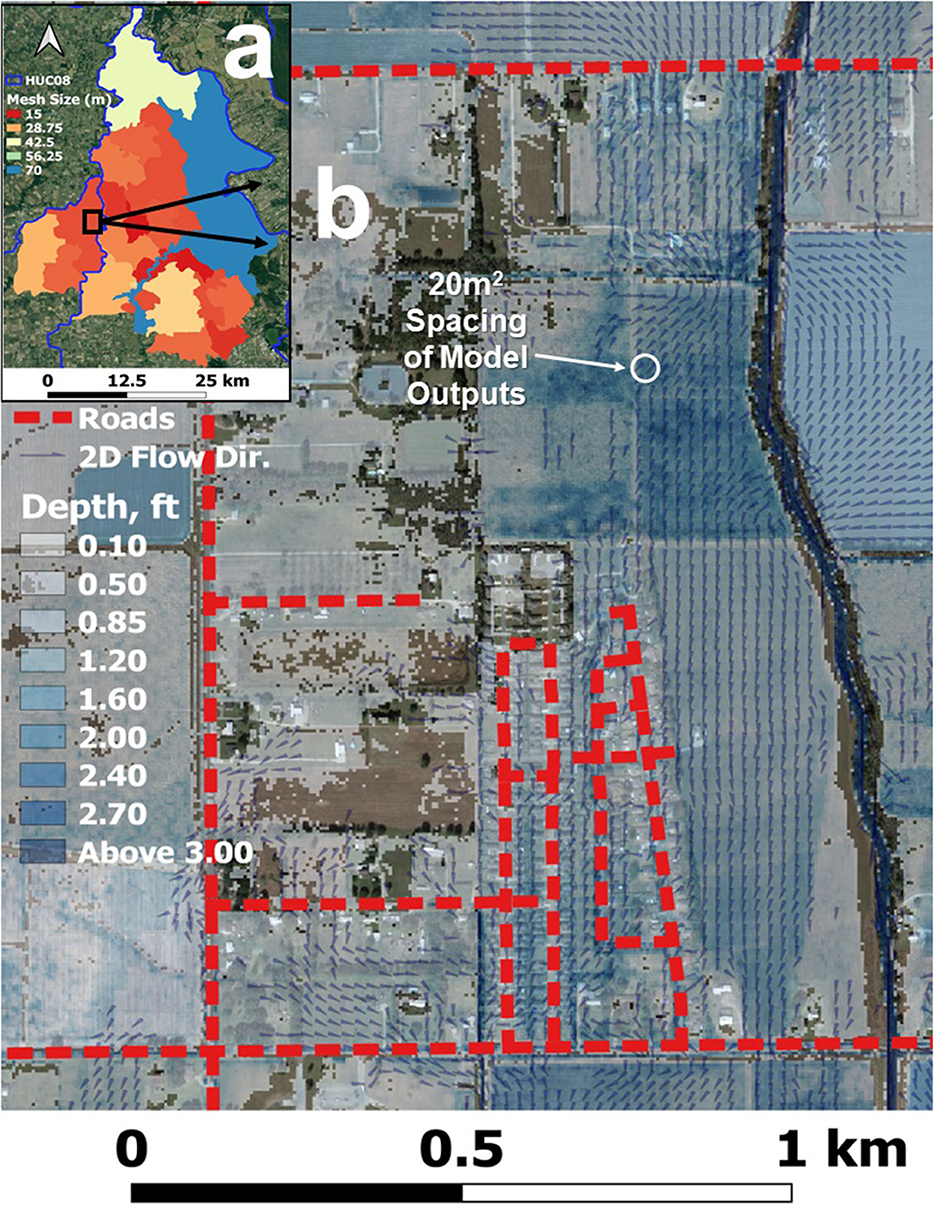
Figure 2. (a) MIKE 21 hydrodynamic model sub-regions and computational point spacing (i.e., mesh size) within the study area. (b) Example of the level of detail in the model outputs (e.g., flow arrows) produced by the 500-year event hydrodynamic simulations. Note: the inundation depths shown in (b) were interpolated to a 5 m2 mesh resolution.
The first set of prototype web-based flood assessment tools quantified and illustrated flood damage to built structures at individual and community scales. The 500-year flood inundation maps were used as the baseline scenario in this case study. The process of calculating the structure damage is depicted in Figure 3.
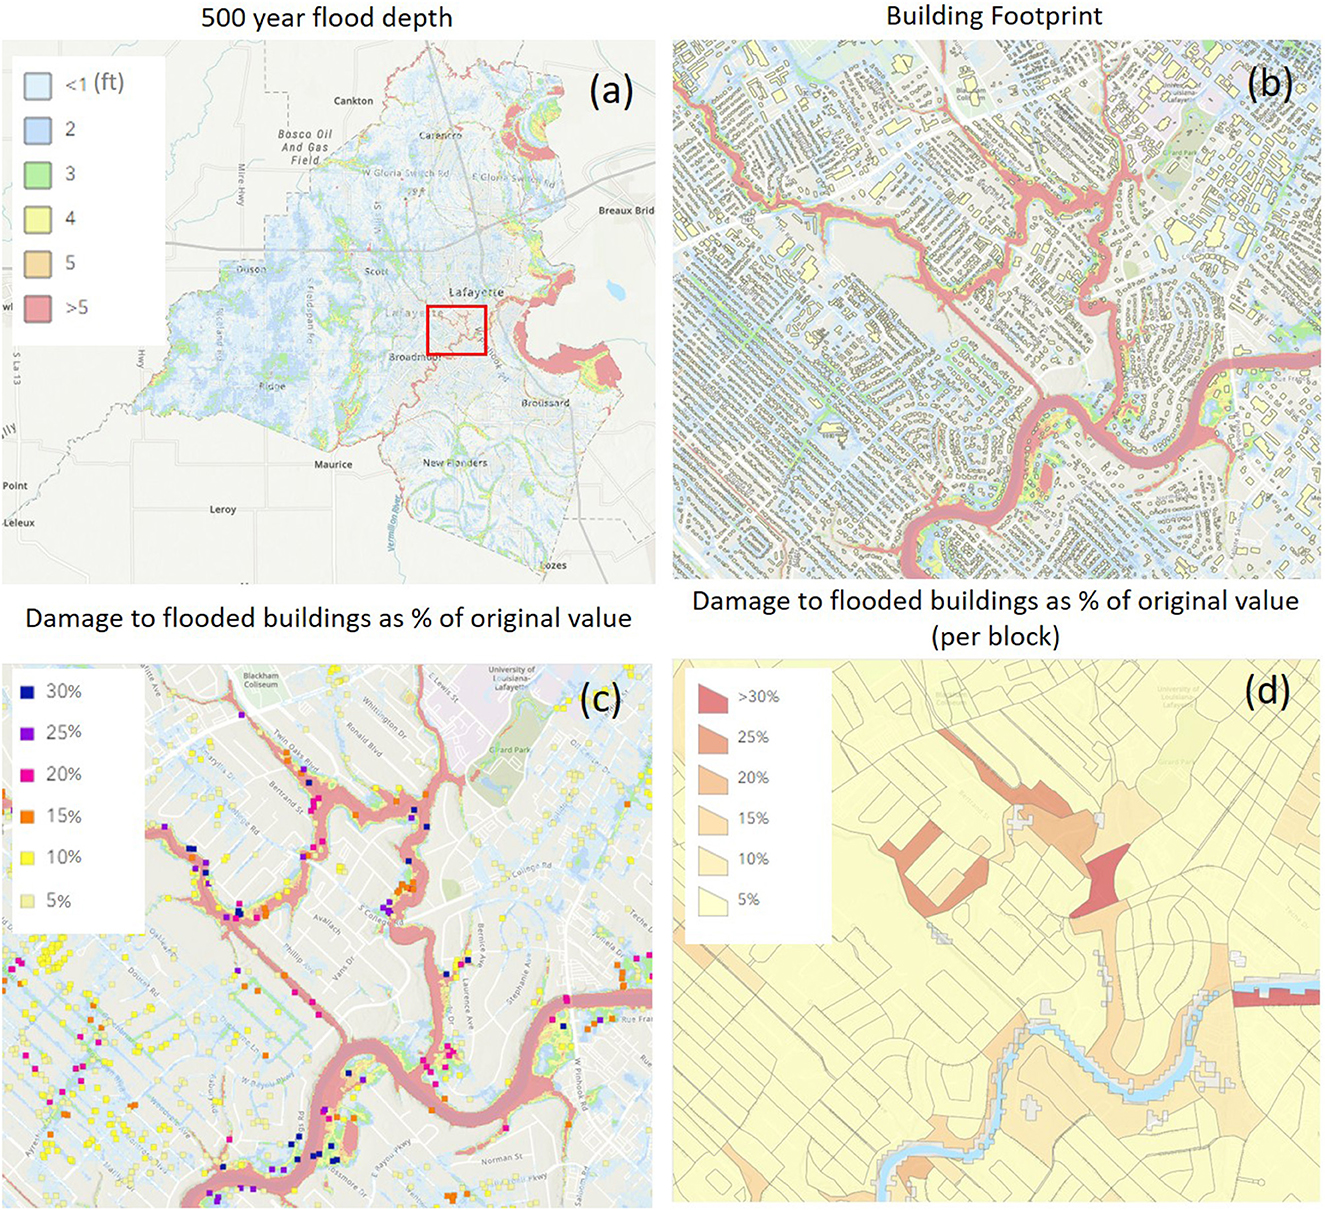
Figure 3. Illustration of process of calculating building damage due to a 500-year flood in the study area. (a) shows the 500-year flood depth map generated using the hydrodynamic model, with the red box representing detailed maps shown in (b–d). (b) shows the building layer superimposed over the 500-year flood map to extract flood depth at each building location. (c) shows the resulting damage estimates for individual buildings using Hazard United States Multi-Hazards (Hazus-MH) depth-damage relationship (FEMA, 2022). (d) shows damage estimates aggregated to the census block level. The legends displayed in panels a, c and d represent the upper limit of each color class.
Panels (A) through (D) in Figure 3 illustrate how individual and aggregated flood risks are calculated. First, 500-year flood inundation rasters were generated using the hydrodynamic model over the extent of Lafayette Parish [panel (A)]. Building locations and information were collected from the National Building Inventory (FEMA, 2021) dataset with partial verification and validation for Lafayette Parish and were superimposed over the inundation raster as shown in panel (B). Building information, such as first floor elevation, foundation type, and number of stories, were updated for each structure manually using local parish data and building elevation certificates before preparing them as an input to the Hazus-MH platform (Ghimire and Sharma, 2021) in order to calculate damage per structure. In the meantime, the flood map generated for the study area through the hydrodynamic model simulation was used as an input to Hazus-MH instead of the default option of using a FEMA flood map. Using this information, Hazus-MH then simultaneously uses a built-in depth damage function to estimate flood damage and direct economic loss for each building structure based on the flood depth at its location as shown in panel (C). Finally, flood damage to each building was aggregated over each census block in the parish as depicted in panel (D).
The main sources of uncertainty in flood loss modeling are due to the uncertainties in the hydrodynamic model outputs (inundation maps), the digital elevation model (DEM), and the accuracy of the estimated structural details. These structural details include building information such as first floor elevation, foundation type, building value, content value, building occupancy, and number of stories, all of which significantly affect the damage estimates (Ghimire and Sharma, 2021). Recent research efforts are trying to reduce challenges in obtaining accurate building information by enhancing the first-floor elevation estimates and other building characteristics using emerging technologies such as Machine Learning and Google Street Views (e.g., Mostafiz et al., 2021; Wang et al., 2021; Chen et al., 2022).
Multiple metrics were calculated to depict the damage resulting from the 500-year flood. A set of layers comprising one metric per layer was created. The first basic layer shows the monetary damage at each individual structure as a percentage of its estimated value. per census block Three of these layers show the number of total residential and non-residential flooded buildings as a percentage of all existing buildings per census block. These layers were created to allow the users to understand how many of their neighbors will be affected by the 500-year flood (residential buildings), as well as how many services surrounding their residence (i.e., non-residential buildings) will be affected. Three additional similar layers were calculated based on the percent monetary damage per census block rather than the percent number of damaged buildings. This is intended to describe collective damage in users' vicinity and how many resources are needed to restore the total functionality of their community.
The second step after creating the above-mentioned layers is to create web-based tools to host this information and make it accessible for users. To do so, we created an ArcGIS online web map to host these layers. ArcGIS online maps allow users to overlay different sets of Geospatial Information System (GIS) layers based on the information of interest. The base layer that appears automatically when accessing the ArcGIS map is the 500-year inundation layer superimposed on Google Maps basemap. The user then can choose what other layers to add to the current view.
To facilitate the discussion during the workshops, and to gather feedback on the utility and future capabilities of these web-based tools, workshop participants were asked to answer questions such as: what features they found most useful in the preliminary tools; what features or capabilities they found missing and want to see added to make the tools more useful; whether they envision that these or similar tools could improve the communication of flood risk or mitigation information.
Using data from simulated 500-year flood scenarios in Lafayette Parish described above, we developed web-based tools for evaluating and communicating the impact of flooding on road network drivability and emergency accessibility. Roadway inundation was modeled in the following way. First, a one-dimensional polyline representation of the road transportation network was rasterized to a uniform 20 m2 grid. Each grid cell on the network was then assigned a height above datum using 5 m2 LiDAR data. The inundation depth along the transportation network was then determined by subtracting the road height above datum from the model simulated water surface elevation at each raster sample point in the roadway network. Road inundation depths (water surface elevation minus roadway elevation above datum) were computed every 4 h of the simulated event out to 36 total hours (nine total timesteps). An arbitrary segment of the roadway network (i.e., each raster pixel) was considered to be drivable for each timestep if the computed road inundation depth was less than eight inches. For the purposes of the workshops, the minimum inundation depth of 8 inches was used to represent a minimum drivable/non-drivable binary state for normal passenger cars (given that emergency managers always discourage drivers from attempting to drive through flood waters of any depth). From this binary classification scheme, a raster describing the drivability throughout the network was obtained for the nine sampled timesteps. We also used this analysis to illustrate the possible flood impacts on accessibility to emergency facilities in the community. Given the drivability raster map for a given timestep, network accessibility to the following two example target points were calculated from all other points on the network: a medical center in southwest Lafayette, and the United States Interstate Highway 10 (I-10) west interchange (I-10 being a primary hurricane evacuation route). Accessibility was calculated using the D8-flood fill algorithm detailed in Miller (2022). A target point was considered to be accessible from a source point on the network if there was a continuous path (including diagonal connections) from the source to the target (Figure 4).
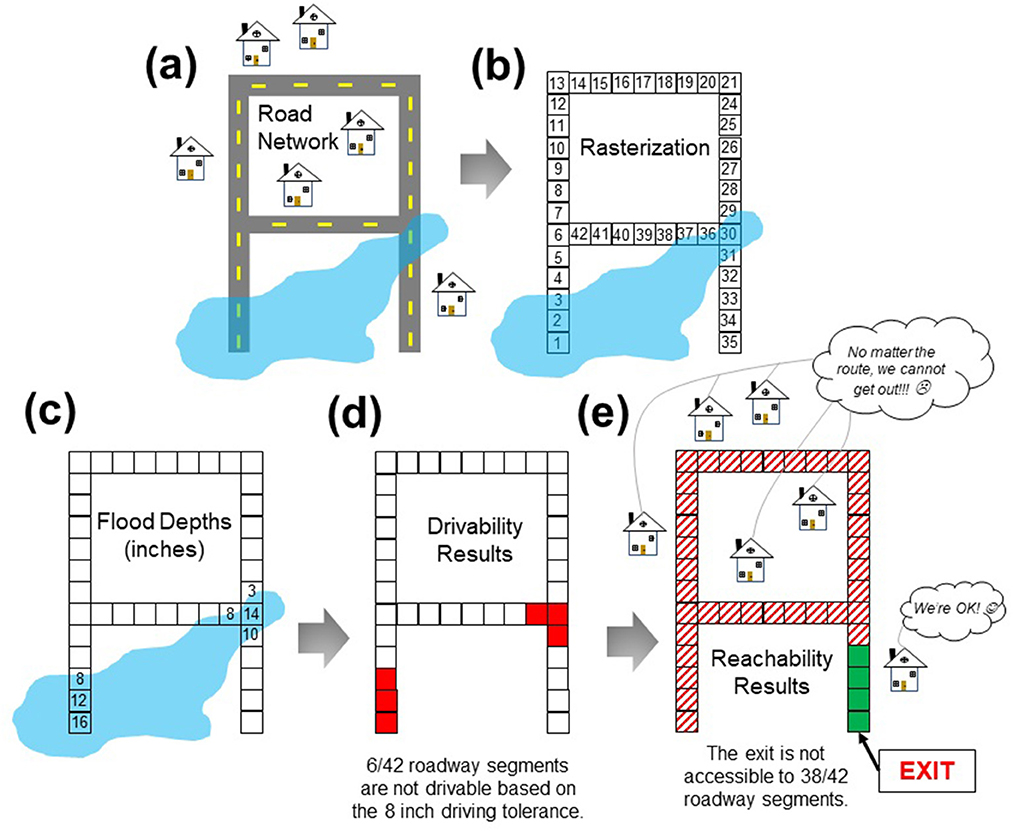
Figure 4. Illustration of the roadway network accessibility/reachability assessment process. (a) Roadway network identification, and (b) rasterization which transforms the geospatial polylines representing the roadway to a raster format containing (LiDAR) road elevations. The overlaid polygon represents a flooded area as simulated by the hydrodynamic flood model. (c) Estimation of flood depths throughout the network, and (d) classification of roadway segments as drivable or non-drivable (14.3%). (e) Calculation of accessible (reachable) segments based on the drivability results. In this example, the exit point (target) is not accessible to ~90% of the network. The hatched areas (e) are classified as inaccessible.
To create web-based tools for assessing drivability and emergency accessibility scenarios, flood inundation and transit network drivability/accessibility maps from the above-described analyses were written into raster maps. These maps were re-projected to WGS 84/Pseudo-Mercator projection (a.k.a. Web Mercator projection using by most web-based GIS systems), uploaded to ArcGIS Online, and shared as Tile Map Services. These tile maps were used as data sources in HTML/JavaScript-based applications, one application per workshop scenario, hosted on Amazon S3. The MapLibre (https://maplibre.org) was used to display and animate the tile map data. Individual applications were used for each scenario (rather than combining scenario data into a single application) to minimize the complexity of the application code developed, which better supported rapid prototyping.
To facilitate discussion around these the tools, the participants were asked to evaluate scenarios such as the drivability of each network segment (can the road be traversed by a car; Figure 5) and the accessibility to emergency facilities (e.g., southwest medical center and I-10 evacuation route; Figure 6). After that, participants were asked to comment on the utility of the tools, discuss whether the road drivability/accessibility matched their experiences during floods, and suggest other features they would like to add to the tools to help them understand flood risk.
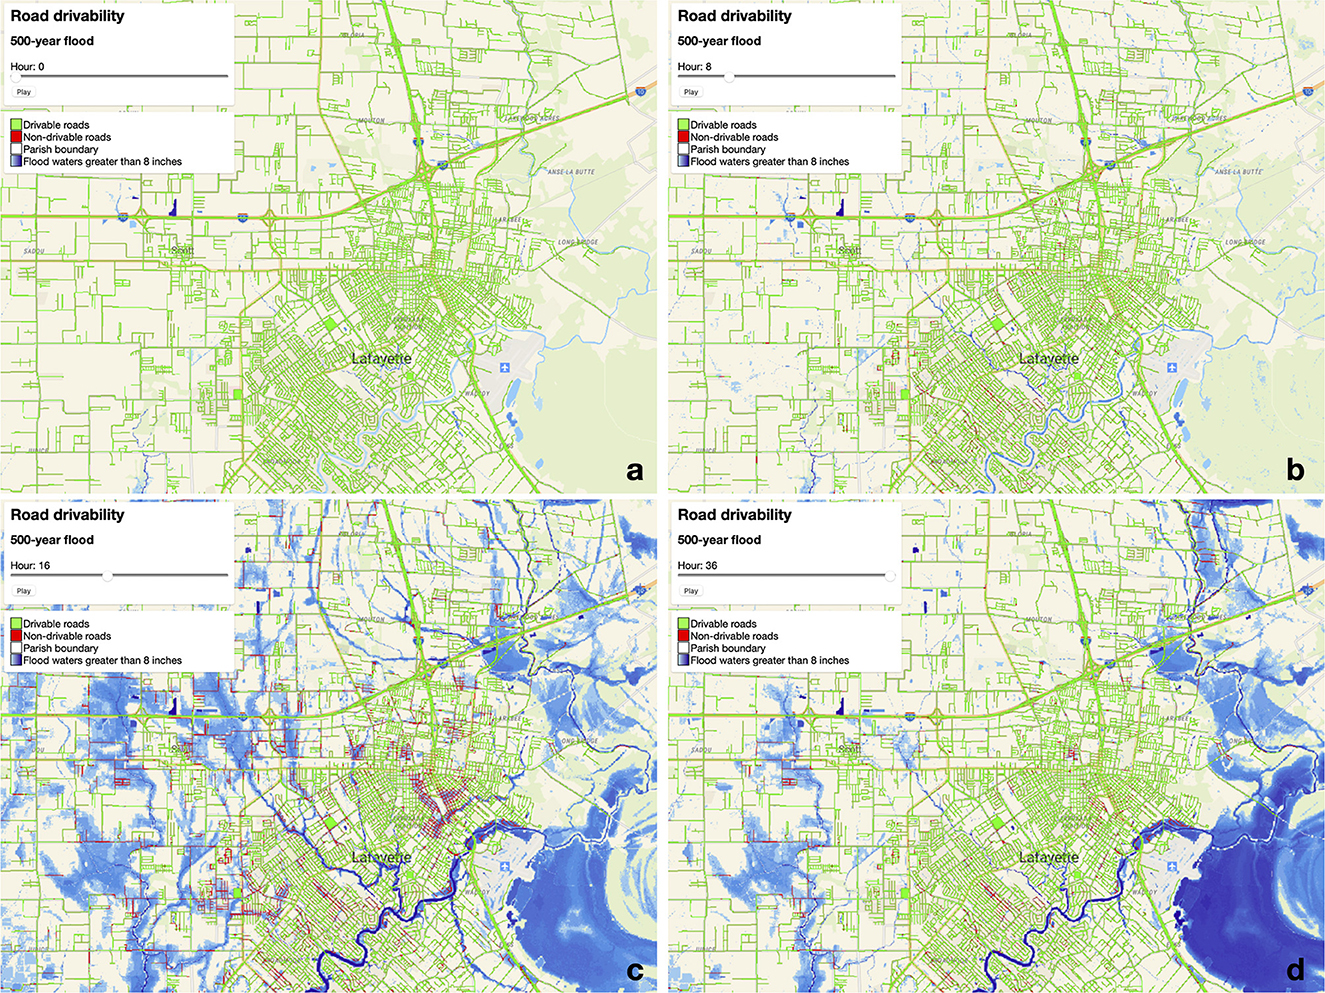
Figure 5. Screenshot of prototype application used in workshop showing road transportation network drivability (>8 inches inundation over roads). (a) Drivability at the beginning of the simulation (upper left). (b) Drivability at hour eight of the simulation (upper right). (c) Drivability at hour 16 (lower left). (d) Drivability at hour 36 (lower right).
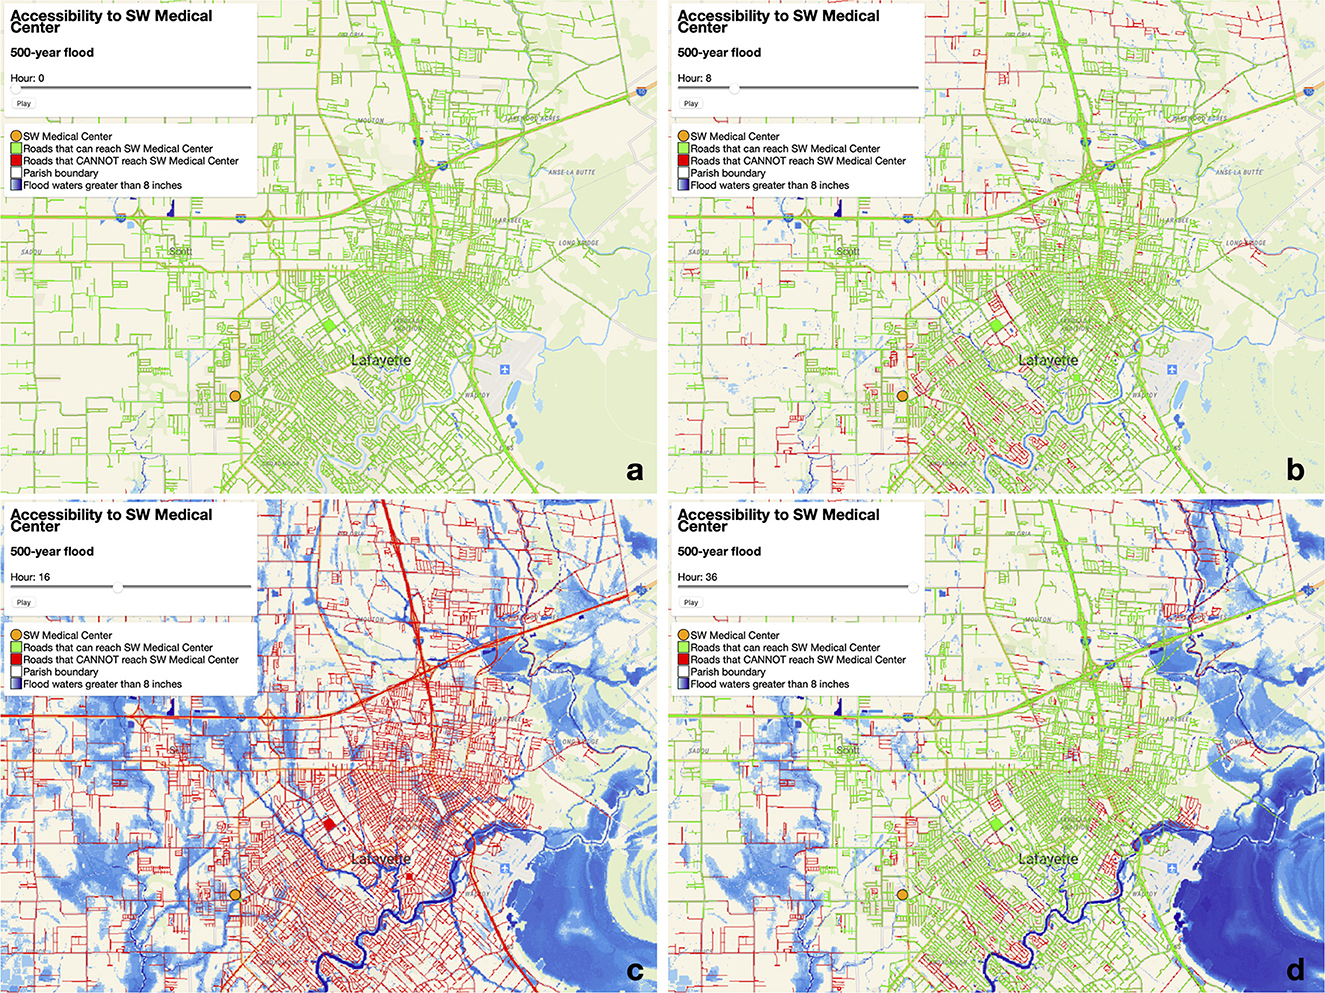
Figure 6. Screenshot of prototype application used in workshop showing road transportation network accessibility to southwest medical center. (a) Accessibility at the beginning of the simulation (upper left). (b) Accessibility at hour eight of the simulation (upper right). (c) Accessibility at hour 16 (lower left). (d) Accessibility at hour 36 (lower right). In all images, the location on the network of the southwest medical center is indicated by an orange circle.
While an individual's own flood risk is a natural focus for many, coordinated planning that considers a broader range of risks may improve the effectiveness of a mitigation program. In addition, some mitigation projects may require a level of funding that exceeds the values that would be supported solely by individual risk assessments. Therefore, a set of community-scale social and economic metrics were developed to facilitate discussion in the workshops about connecting people with flood risk information for other groups of in the community as well as economic and social factors that might extend beyond a traditional assessment of individual risk.
To provide estimates at a plausible scale for the workshop setting, damage assessments from the simulated 500-year flood for Lafayette Parish were used to scale several community and economic metrics from previous research that examined a wide range of damage types in Louisiana (Barnes et al., 2017). In particular, the number of damaged residential structures based on the simulated flood described above was multiplied by the ratio of each community impact metric to the number of damaged residential structures from the published statewide assessment. For example, an estimate of flooded schools used in the workshop was derived by taking the number of damaged residential structures from the simulated 500-year flood and multiplying that by the number of schools facing severe flood risk divided by total residential structures facing severe flood risk in the prior statewide analysis. Similarly, the number of damaged non-residential structures based on the simulated flood described above was multiplied by the ratio of each economic impact metric to the number of damaged non-residential structures from the published statewide assessment. The results of these analyses provided several illustrative metrics that were incorporated into the sample social and economic community risk profile (Figure 7).
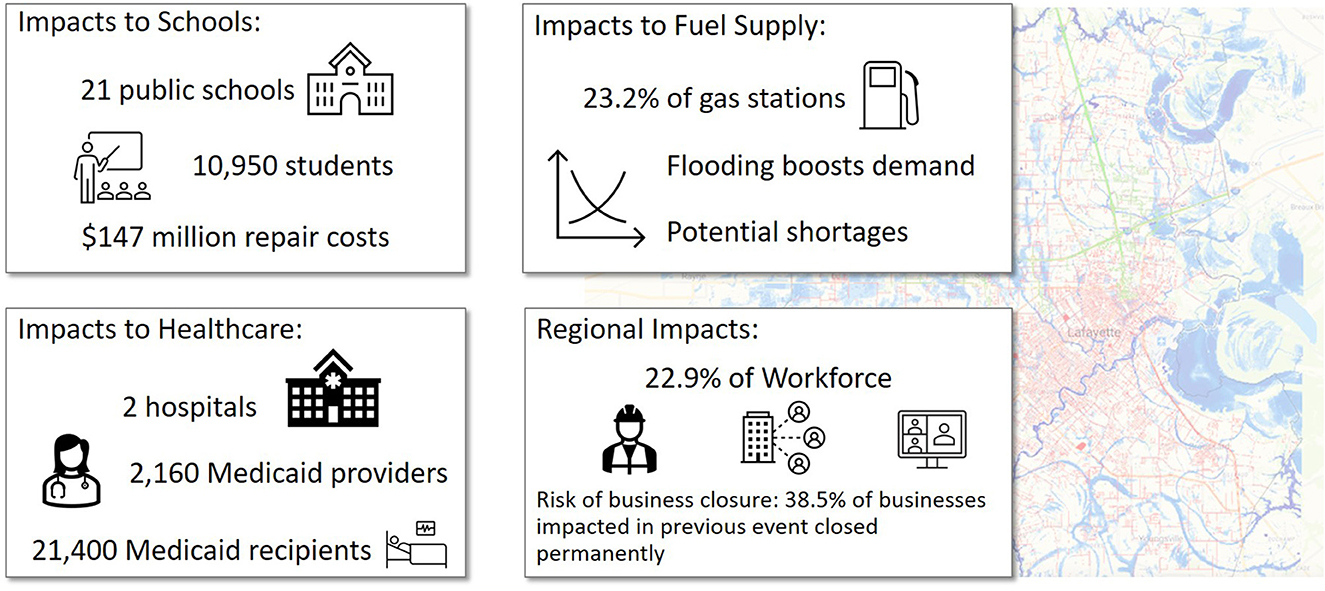
Figure 7. An illustrative example of social and economic community risk profile.
Data gathered from workshops were analyzed using the same qualitative analysis approach used in Skilton et al. (2022). This approach drew from a grounded-theory approach, used summary note compilation, and included the recording and transcription of workshop conversations to improve the accuracy of workshop dataset reporting (Miles and Huberman, 1984; Strauss and Corbin, 1998). Data were coded by hand based on themes identified by the research team and incorporated deviant case analysis to ensure minority opinions were represented (Saldana, 2021). The first round of coding counted reoccurring themes in the data. The research team then met to analyze these themes and reorganize them into meaningful groups. The final round of coding counted frequencies of the following particular themes: the availability of Hyper-Local Information for Understanding of Flood Risk (e.g., flooding of personally relevant buildings or properties, flooding of critical roads); the ability of the tools to Reduce the Gap Between Individual and Community Risk (e.g., metrics, scales, and options that can effectively communicate risk at different levels); Challenges in Communicating Flood Risk Information to different stakeholders in the community (e.g., understanding of technical terminology, tool complexity); and how the tools can Enhance Relevance to and Engagement of Community (e.g., crowd sourcing capabilities) and Enable Actionable Information (e.g., examining flood mitigation alternatives). These specific themes address the three main objectives that were defined earlier for the current study (see Introduction Section); for example, the first two themes address the first objective, the third theme addresses the second objective, and the fourth and fifth themes addresses the third objective. The results of the coding bridge the gap between theoretical constructs (e.g., hypothesized perceptions of flood risk and flood impact and/or ideas about how best to communicate risk) and actual examples used by participants as evidenced in the excised quotes below. For more information on the qualitative methods, see Skilton et al. (2022). The following section describes the results in terms of these main themes.
In the five workshops, participants interacted with the tools and bounced ideas off of one another. We saw palpable excitement from every group at being asked to participate in the research and having the opportunity to contribute. The participants tested the tools and provided feedback while the research team circulated to answer questions and demonstrate different facets of the tools. As they used the tools, participants reflected on flood impacts, discussed ways these tools would reduce gaps in flood knowledge, suggested modifications to the tools that would make them more useful (i.e., consumable, digestible, relevant), and proposed ways to improve communication and engagement with the tools. The excitement we saw with these tools directly related to interest in improving flood risk communication. No participant left the handouts, which listed the URLs to access the tools, behind at the end of the workshops.
Participants in all workshops connected with the tools on a personal level and generally interacted with them to assess their own personal flood risk before examining community-wide flood risk. At first glance when reviewing the sample tools, participants immediately zoomed in on locations relevant to themselves (e.g., home or work address) or their extended family. They rarely looked beyond personally relevant locations. In fact, one participant noted, “If you're aiming at average people, your first page ought to say, ‘Put your address here, and [these are] the things that could happen.' […] Ninety percent of the people I know are not gonna go past page one if they don't see their name or address” (5/23 48:00).
After researching their personally relevant addresses, participants frequently noted how the tools could be used for community purposes including annual cultural events, thus broadening their use. One commented that the road network tool demonstrating flooded roadways could be used to understand other locally relevant traffic snarls during peak periods of use, asking “Can I use this for Mardi Gras? Like a Mardi Gras traffic map?” (5/23 1:05:05) Other participants suggested that the incorporation of locally relevant terminology to refer to waterways would make the tools more culturally applicable. For example, many participants used the French-influenced Louisiana “coulée” to refer to ditches refer to ditches, perennial streams, drainage systems, ravines, and small canals. They also used knowledge of their local watersheds, patterns in water flow, and historic understanding of flood experience and risk in the area. As described by one participant, “When you say flooding, I immediately go to 2016. [But] you [pointing to another participant] went to June [2019 when Lafayette experienced another recent major flood event]” (5/23 40:30).
The value of hyperlocal flood risk information (e.g., at individual's home, street, neighborhood) became apparent as the participants continued to interact with the tools. For example, while using the structure damage tool (Figure 3), they liked the ability to see depths of water at individual structures. As expressed by one of the participating flood professionals, “From a government standpoint, being able to consolidate this data [sic] is helpful, but for an individua'- you're gonna look at your house, your neighborhood.” (5/19 47:43) Another flood professional agreed, stating “They wanna know […] how high the water gets during an event and ‘will it impact my house?”' (5/19 1:01:25) Other community participants exchanged discussions with each other while looking at the tools such as, “I thought the inundation map is for sure useful—like, I think people will look at that and say, “I'm not at risk,” or “I'm at serious risk.” I think there's a ton of value in that. […] [To be able] to say, “You'll have two houses on this street flood, but the six other ones are fine. That's really interesting. I think that explains a lot of things—and [gesturing to another participant] you mentioned there's people down the road that don't flood, and if you look at 2016, like you'd have one house in a row of ten just didn't flood. So, I think the individual property is also very useful.” (5/23 33:00) Another participant went on to say that “It's pretty interesting that the inundation shows the streets [flooded], but you can see that it does not necessarily get the homes.” He paused to peruse it more and then stated, “Yeah, that's actually about right because my backyard would flood [but my home did not]” (5/23 26:00).
Participants also asked for personalized user options when examining the flood tools. For example, participants wished to see higher temporal resolution (e.g., hourly), dynamic calculation of point-to-point accessibility on the network, and the ability to show thresholds for other vehicle types (e.g., SUV, trucks). The desire for highly localized information also became apparent in examining some of the tools available in other regions or nationally. During the workshops, participants were given time to examine the Flood Factor website (Riskfactor, n.d.), as an example of a national-scale flood risk tool. In general, the participants liked the attractive visuals the website provided of a generic flooded home and the ability to toggle between different flood depths. As stated by one participant, “I think this little visualization here is brilliant. It's very clever.” (5/23 1:42:00) Another commented, “I mean, it is nice how they've illustrated it all and kind of diagramed out what the impacts are: drywall, appliances, insulation, wood floors, and carpets. Like, ‘insulated appliances,' that never occurred to me as a specific thing to pay attention to.” (8/4 1:24:35) While this feedback highlighted the importance of powerful visuals, many of the participants agreed that it was not localized enough to be useful [e.g., “You can't zoom in.” (5/24 1:39:40)] and asked for more realistic information from the community, rather than generic examples. As explained during one discussion, “So you see the thing that's like ‘Are there past examples?' [and it says] ‘Based on a recreated model of the flood, 23 properties were impacted by Hurricane Ike's storm' and I'm sort of like ‘Was there only 23? Was there more?' I don't know. […] Its not anchored to my community”' (5/23 1:38:30) Similarly, another participant noted, “Harvey's what came up for mine, and it says 826,000 properties in Lafayette were impacted. We don't have 826,000 properties in Lafayette.” (5/23 1:40:00) The need for locally relevant information was also expressed during one the workshops attended by realtors and developers. As one realtor noted, “I think it's important that whatever it is, there's specific data that says ‘Yeah, you are likely to flood, but here's why,' not just like ‘Hey we looked at an overall picture, we think you're gonna flood in two years because you live on a river.' […] They don't understand, so they make decisions out of fear or unrealistic data, so having solid data is important on our end.” (6/24 39:00) Likewise, said another, “It didn't take into consideration the elevation of the house […], just the fact where it was located” (6/24 1:26:45).
Discussions among the participants highlighted an important avenue for improving the understanding of flood risk by grounding the information and the way it is communicated in citizens' prior experience with flooding. Participants often wanted to see examples of historical floods (e.g., the historic August 2016 flood) within the tools and spoke about flooding in terms of floods they themselves had witnessed in their lifetimes. As one participant commented, “I've seen [the research team] model past storms—it's very informative with what's actually occurring versus what we speculate is going to occur in certain situations.” (5/24 57:00) The value of tying the tools to actual storms was expressed by another participant, “It almost feels like you would get a lot of mileage out of just calibrating people's understanding of what they're reading here with historical examples. So it's basically saying, ‘How did this happen in history?' [….] and you're pairing people's lived experience with this is a five-year storm or […] this is five inches of rain in so many hours” (5/23 1:45:05).
Participants also expressed that this improved understanding could help the community as they grapple with the notion of climate change and the increase in the frequency and severity of extreme storms. A reporter talked about challenges reporting about climate change describing, “For me, what crystallized it was when you started having these freak rainstorms that would disrupt the community for two days [...] but we can't necessarily plan for that—or maybe you ask the question, ‘should we be planning for that? […]–that wasn't even supposed to be a big deal, and it was.” (5/23 1:53:00) Contextualizing flood risk within communities' past experiences was also cited as a facilitating factor in understanding and communicating the potential benefits of a certain mitigation project. The same reporter explained, “That's what I've been trying to do just when we report this stuff. Like I did a story about some detention ponds, right, and one of the ways that I tried to convey magnitude was to say, ‘Here's how this sort of thing works in a 10-year storm. A 10-year storm is like this event that everybody remembers” (5/23 40:45).
Overall, the workshops revealed a level of enthusiasm and desire for tools that communicate flood risk, especially those that communicate information using highly local metrics. Many of the participants requested more time to continue interacting with the tools, and when asked if the group needed more time, one participant immediately responded, “Just a little more time.” Others chimed in, “Can we just do this for the rest of the afternoon?” Agreeing, another said “We're all geeking out” (5/19 35:45).
As participants continued to interact with the tools, they reflected on how the tools would help reduce gaps in flood knowledge between individual and community scales. The road network drivability and emergency accessibility tools in particular encouraged participants to look beyond a single site and to consider a networked community. In using the southwest medical center accessibility tool, participants were able to start from their home or place of interest and then examine the flood obstacles impairing their ability to access the hospital. Similarly, in using the I-10W evacuation tool, participants could examine how flooded roadways would impair evacuation. As described by one participant when looking at the tool, “I can't go—I already know I can't go down the street, but I can go up the street. It's just that I can't get to Pinhook because I pass the coulée […]. I mean, I've done this before where this [she gestures to a spot on the map] wouldn't be deep. I'm gonna find a way out” (8/4 19:28).
In using an individual site to examine complications in accessing key services from that site, participants had to think about the ways their personal flood impact was nested within a community's flood impact. One participant described the utility of the tool for educating other citizens, “It should spark their interest though because this is something that they will have to navigate through if this should ever happen, and in 2016 they had to figure out how to get around. If they didn't have somebody with a high enough vehicle, they were stuck in their houses. They couldn't get their medicine. Emergency personnel couldn't get to them, unless the emergency personnel knew old backways to get around” (8/4 23:32).
The different scales that tools covered such as damage at personal homes vs. aggregated statistics, sparked some interesting dialogues among the participants and exemplified differences in how the community understands flood risk. As described by one participant, “If it affected me, yes I would browse and check it, but if it affects a different neighborhood- nah. But for me, yes.” (8/4 1:07:00) Another responded, “Well no matter what they do in Lafayette, it's gonna affect all of Lafayette. Because, as they have built further out, it affects further in. So, no matter where they build in Lafayette Parish, it's gonna affect all of Lafayette” (Add quote time).
The dialogue during the workshops provided valuable insights into how such tools have the potential to expand understanding of flood risk beyond the individual. In some cases, participants recommended a variety of changes that could allow the average citizen to visualize themselves within the larger community. For example, while reflecting on aggregated flood statistics (Figure 7), the participants provided insights on how the aggregated data can still be made relevant personally. As suggested by one participant, “If you're gonna do the math to make your own stats here, take the major thoroughfares, take the traffic counts and say, ‘If the intersection at Ambassador and Johnston is closed for 36 h because of a flood, how many people can't pass through there in that amount of time?”' (5/23 1:28:30) Another expressed, “I will say, the business closure thing is really interesting because that is a permanent impact. You can fix a school, you can fix a hospital, you can get gas back to people, but [if] a business closes, that's that.” (5/23 1:29:12) Others suggested the use of powerful visuals that the individuals can relate to. For example, one participant noted, “I would suggest you show it with pictures instead of graphs and charts. […] Give me an image of a school underwater.” (5/23 1:30:00) Some participants suggested use of more impactful metrics like, “Instead of 23% of the workforce impacted, talk about that in wages lost. Right? I mean that's a number people pay attention to.” (5/23 1:32:00) Another participant recommended, “‘Given this particular area has more of a financial risk, you know—if that was to be flooded, [its] impacts on the community would be more than this would”' and illustrating this explicitly would help community members make better informed decisions. (5/19 57:16) Similarly, as explained by another participant, “I was thinking about food or grocery stores, like the data on that and/or shelters because if a large shelter in your area would maybe be at risk for flooding, and you wouldn't be able to use it, that could be helpful” (5/24 1:27:34).
Some participants raised concerns about the ability of different sectors of the community to understand the information presented and suggested the possibility of two different tool options, a simplified version and a more comprehensive version. During a workshop with media representatives, a participant expressed the following concern: “For us right now, this group of people, this is really engaging and exciting and fun, but it's also pretty complex, and there could be a whole lot of community members where this would just be too much and they wouldn't want or be able to engage with it, so I wonder- I don't know what the solution to that is. Maybe there's a simplified version and a complex version.” (5/19 58:22). Another explained, “I see [the tool] as useful for particular groups in the community, but not the everyday Joe pulling up something to figure it out.” (5/19 1:01:00) On the other hand, and in the workshop with flood professionals, some expressed the desire for a more advanced tool available to themselves or emergency responders and recommended a more simplified version for the general public, especially if modifications would be made to present the data differently.
Specific examples of commonly used technical terms were cited as a possible source of confusion and lack of clarity in communicating flood risk information. For example, one participant noted: “so ‘Hundred Year Flood and inundation—[you would need] a description of what that means or […] ‘Percent Loss Value' what does that mean? When somebody reads that, they're not gonna say, ‘Oh yeah, I know exactly what that means.' They're gonna say, ‘What are all these numbers?”' (5/19 59:32) The use of the word “coulée,” or lack thereof, was another example of the differences in language between the citizens and scientists or flood professionals interacting with the tools in the workshops. The local term “coulée” was not included in the tools showcased. This was pointed out by local residents as they examined the tools as a missing element to bridging the citizen/scientist communication gap. Similarly, other metrics used to delineate flood impact zones confused community members. For example, the term “census block” was unfamiliar to those outside government, academic, or media circles. Attendees instead recommended a more physically-based approach for examining flood risk connectivity within the community scales. One participant stated, “So, when we look at finding a useful way to aggregate this for people, rather than a census block-and this may be like ton of work, I have no idea- when you look at it, I think people know more about where the nearest coulée is. Can you divide our town into the coulée watershed, sort of where each home drains to which coulée? […] I think if you could visualize it in that way, rather than census blocks, visualize it more [as], ‘What is the shape of this watershed and how much would this little watershed between the railroad and this coulée flood in a 500 -year storm.' […] You want to show people the way that the water drains” (5/23 41:30).
A related theme emerged during the workshops when some attendees expressed that citizens would engage more readily with the tools if there were some sort of news package or rollout of the tools, possibly in conjunction with local media organizations and educational institutions within the community. Participants from the flood professional and media groups argued that such strategy would help remedy a degree of technical difficulties for some segments of the community population: “If you're trying to [….] reach people in a more direct fashion, piggybacking on a partner like the public school system, which is already communicating with these people in a big way, […] it's a different vehicle than the news” (5/23 1:33:00).
An interesting argument by one of the participants was that, “People are habit-forming animals, and they know of course that come springtime things are going to get dodgy, and there are lots of signals for that. You get hurricane preparedness week […] and so it's like, could you stimulate that kind of agenda by just like creating flood preparedness week every year? And what you're doing is just reminding people about the basics of flood risk.” Another chimed in, “Do it on the anniversary of 2016, easy.” (5/23 1:19:00). One participant indicated that the community will “also get interested in it when the media sets the agenda for them by saying, ‘We as a community are doing X or we have just experienced Y and now we're trying to understand what happened and how we can [keep] this scenario from happening again in the future.' So I could see of these things being pertinent or useful in a package where you're combining storytelling that guides them through the process of understanding what these maps mean in a real life sort of way” (5/23 1:17:00).
Similarly, participants gave ample feedback on how the tools could be modified to better inform and improve knowledge about flood risk. Chief among their suggestions was creating better ways to explain currently used terminology, such as 100-year and 500-year floods, that is confusing to the general public. As highlighted in multiple workshop discussions, the use of the terms 100-year vs. 500-year flood might not be the most effective in communicating average and extreme flood risk. A participant asked, “On a five-hundred year flood, what's that rate? How many inches over what time period?” (6/24 28:00). After a researcher responded explaining the meaning, the participant then asked, “Is that 2016-ish?” (6/24 28:30). Participants expressed that it might be easier to include personally comprehensible alternatives such as inches of rain over a set amount of time. One participant suggested that people could be given “a slider which [goes up] 1 inch of rain, 2 inches of rain, and you could see it getting worse and worse.” (5/23 43:00) Another participant described how this could illustrate a connected watershed, stating, “You may need a phase thing too, showing people: if Youngsville [south of Lafayette] gets ten inches and everything starts backing up, maybe the next day your neighborhood [in Lafayette] is gonna flood” (5/23 44:00).
Participants requested that community-specific information be included in the tools to further support their relevance to the community. For example, participants wanted the ability to plug in two locations and have the tool calculate a safe route, as well as offer alternatives. One participant suggested that, “From where you are [at] point A, pick where you could go to point B. And if you have a drivable route to point B.” (8/4 1:02:00). Another participant envisioned that the tools “could give you options of hospitals, like it could have a drop-down list, ‘These are your hospitals in your area,' and you choose your hospital.” (8/4 1:02:30). When viewing the map of flooded roadways, one participant argued that it should have different layers depicting commonly known major and minor roadways, “If this was put out to the public, sometimes this amount of data can be a little overwhelming. So, to have [major roadways] as the first layer, and then they can have the local roads as a second layer that they can turn on.” (5/24 1:19:30) Another participant suggested for the road network tool that, “It would be nice to be able to filter your arterial [streets]. Especially if you're trying to access emergency facilities […] Typically those roads have better capacity, they're going to have power lines cleaned up faster. So, from that aspect, those are the primary things you want to get open and functioning” (5/24 1:17:43).
The benefit of having a simplified and complex tool option as raised earlier would also allow groups of interested individuals to delve into specifics of community issues and enhance the relevance of the tools. On the topic of using census block to aggregate data, one participant noted that census blocks were useful for reporting but not for the average individual. The participant stated, “From my standpoint, I think it's great for a reporting tool, [but] people don't know what census block they live in. They don't know what a census block is.” (5/23 36:45) Delving into this issue a bit more later in the workshop, the participant expressed that looking at census block data allows for the examination of impact on socio-economically disadvantaged groups and should be kept as an option in the tools for this reason. Explaining this, they said, “Or, just to consider your census blocks, exporting that and just looking at ‘Is it poor communities? Is it Black communities? Who bears the brunt of this really?”' (5/23 50:15) Keeping census blocks as a tool feature allows community members to examine these distinctions at scales that make sense for their community.
Lastly, workshop participants expressed desire for more opportunities to engage with these tools by creating a way for community members to add data to the existing tool platforms through crowd-sourcing efforts. This could include adding data available to realtors or from developers as new projects get underway. On the topic of providing data for homes on the map, a participant responded, “So if there was an easy link or email or something like that, and realtors had the information—as I'm taking a listing and my sellers say, ‘Hey, by the way, my house flooded four times'–well that data may or may not be really out there. If that's something we could, to help the data, just send a quick email, like ‘Here's the data I received.' […] I know some of us would be happy to do that because we get that data behind the scenes” (6/24 1:35:15).
Additional crowd-sourced data might also include citizen-science data collected during flood events for local areas (e.g., rainfall amounts, impassable roads, coulée backups) or individually contributed historic knowledge about prior events (e.g., pictures of properties during past floods). Despite the unique value of citizen-contributed data, they also bring some complications in terms of need for curation and verification to avoid propagation of erroneous or inaccurate information.
The workshops also revealed a desire by the participants for the tools to provide them with actionable information, besides informing them about flood risk. One requested functionality was to examine different proposed mitigation projects or strategies and predict flooding under such new conditions. It was notable that these views were expressed by citizens as well as by flood officials and media representatives. One participant noted, “You don't have to identify the project, but if you could tell people the impact of lowering the flow to this river on this coulée would pull 200 homes out of a 25-year flood, then I don't think it matters whether it's a detention pond on the coulée. Just the impact scenario, rather than the exact project, could be very helpful. Because they keep talking ‘Oh we're gonna take six inches on the Vermilion River.' How many people does that help? No one cares.” (5/23 56:00) During the workshop with flood professionals, one of the participating planners elaborated on how the tools could already facilitate their operations and advance collaborations within their own organizations, “This is actually really helpful for me to think about where we might propose some green infrastructure. I could have conversations with our drainage department about what they've seen in the past, but this is really useful for looking at different scenarios” (8/4 52:20).
Participants from the media identified ways the tools could assist them in framing communication strategies about flood mitigation. One participant described potential uses by stating, “As a reporter, you would want to ask questions about, ‘We're putting so many resources into this zone; how many people is it affecting, equity and disparity issues that come up.” Another chimed in, adding, “It's a great accountability tool. Amazing.” The first responded emphatically, “Yes, [it is a] wonderful policy tool.” (5/23 37:20) Adding such functionality to the tools would also enhance the community understanding of ongoing mitigation efforts in their community. As stated by one participant, “It could be cool if something showed the last mitigation action taken in your area.” (5/24 1:55:40) One of the attending elected officials went as far as suggesting that such tools, when equipped with the ability to examine mitigation actions, can be powerful ways for addressing citizens' concerns about the government actions, or the lack of thereof. As the elected official explained, “The fact that we have drainage town halls […] we need to have those, […] to get out there and show them what's available from flood proofing to the current measures and mitigation efforts to what they can do to help as a personal, property landowner [….] I mean, the transparency goes a long way” 5/24 1:56:50.
The workshops also highlighted the utility of flood information tools for planning efforts by local government and districts. For example, participants from the regional planning district indicated that the road network flooding analysis tool could be integrated into their transportation models for identification and prioritization of roadway and transportation projects. This brought up the idea of scaling up the tools across the different metropolitan planning organizations (MPO) as part of their transportation modeling, forecasting, and project scoring efforts. Similarly, participants from the traffic department asked if the hydrodynamic simulations upon which tools are based could be augmented or integrated with in-situ sensors in which the city has started to invest recently, and whether emerging machine learning technologies can play a role in maximizing the value of both sources of data for real-time and planning efforts.
While the tools illustrated during the workshops did not support real-time decisions, flood warnings, forecasting, and evacuation, such needs were also expressed by some of the attendees. Specifically referring to the drivability tool, one of the participating citizens asked: “So this is updated for like every storm?” (5/24 1:12:53) Some of the emergency management attendees identified how the tools can also be used for the emergency management service: “It's not only a tool for us. It could be a tool for emergency personnel, even businesses to be able to deliver something.” (8/4 1:04:45) Further, they pointed out, “Yeah because we had some conversations with the drainage department about flooding, and one of the topics was emergency vehicle access during flooding and being able to identify, ‘You know what? It's going to be a priority for us to make sure that the major roads, like Louisiana Avenue, are safe to travel on even during storms” (8/4 1:04:55).
Through a set of workshops with various stakeholders within Lafayette Parish, a flood-prone community in Louisiana, USA, this study evaluated how emerging flood hydroinformatic tools can enhance understanding of flood risk and engagement in flood risk mitigation among diverse community members. Our analyses contributed new insights on the following main themes and how flood tools can address them: (1) improving the understanding of flood risk and engagement in flood risk mitigation; (2) reducing the gap between individual and community risk; (3) challenges in communicating flood risk information; (4) enhancing relevance to and engagement of the community; and (5) enabling actionable information.
During the workshops, participants interacted with a set of illustrative tools that were developed for the community to quantify and communicate flood risk at different scales, both spatially and socially. The illustrative, yet community-specific tools were used as a vehicle to facilitate the collection of feedback from the community participants and to engage them in meaningful discussions and were not presented as recommendations or solutions of flood tools they should use in their community. The tools included: web-based applications that quantify flood damage to individual homes, neighborhoods and businesses under example storm scenarios; impacts on drivability and accessibility to emergency facilities; as well as examples of aggregated flood risk impacts at community-wide scales. The workshops also evaluated an example of an existing, national-scale tool that is of relevance to the same community under consideration in this study.
A key finding from our study is that stakeholders look for innovative tools and resources that are anchored to their local communities with a strong desire for hyper-localized (e.g., at the neighborhood or block level) flood information, scaling options, and historical perspectives in such tools. The need for hyper-local, community-specific flood risk information, in addition to aggregated, large-scale information, was apparent across different sectors of the community, including citizens as well as professionals who deal with flood mitigation decisions. Further, communities are eager for flood information tools, especially those that bring flood risk to their personal scale. There is an apparent need for tools that enhance community connectivity by communicating effectively where and how flood water moves, and by using metrics that connect citizens and decision makers across geographical boundaries and connect personal risk to community risk. Our results show that challenges exist in making the tools relevant to the individuals, while still communicating from a community-wide perspective. Use of locally relevant terminology and drawing on historical knowledge was also identified as essential for connecting the tools to potential users within the community. In addition to communicating and allowing citizens to explore flood risk, advanced hydroinformatic tools should also facilitate possible mitigation strategies and their attendant costs and benefits. Above all, these tools must enable both individual and community-level risk to be communicated and understood. The use cases that emerged from the workshop research included those of citizens, such as supporting flood decisions at the personal scale, to those of flood professionals, such as community-wide planning and mitigation activities.
A general observation of our workshop research is that participants readily engaged with the hydroinformatic tools presented to them. They did not seem to question whether such tools have a role in addressing flood risk understanding or flood mitigation participation, in general. However, one possible counter-indication came from the flood professional workshop, where it was noted that, “people don't like being told what to do.” The flood professionals indicated that tools like these could be effective if they inform and engage with people where they are, without being perceived to be draconian.
Another general observation from the workshops is that people unaware of the cause of floods and may not agree on the specific sources of flooding in their local areas. Any attempts to bring hydroinformatic tools to bear on increasing engagement in flood mitigation will need to communicate and educate about the etiology of flooding, which is a substantial challenge in low-relief urbanized coastal environments where pluvial, fluvial, storm surge, and tidally-influenced flooding are all possible. One possible way to begin addressing communication of flood etiology is to provide hyper-local estimates of flood extent and impact that are grounded in individual and community experience of historical flood events. Historically plausible and hyper-local, time-varying simulations that allow citizens to “zoom in” to landscape features with which they are intimately familiar can help citizens and communities to better understand how flood conditions evolve during an event. This may help with the identification of landscape flow paths and barriers contributing to flood emergence and duration.
Our research indicated a few ways to improve perception of community-level flood risk. One was to develop community-specific metrics to communicate flood impacts, for example: the number of cars that would be unable to travel through a certain intersection during a flood event; how many businesses are housed in buildings that would be destroyed or damaged beyond repair by a flood; how many would be unemployed; how much tax revenue would be lost; how many children might be forced to repeat a grade in school due to the disruption; and how certain sectors in the community might suffer mental health issues. Relatedly, our research indicates that community-level flood impacts should be reported at spatial levels that are meaningful to community members such as the watershed or neighborhood, in addition to census geographies of interest to flood professionals.
In terms of tool design and intended audience, our research indicates the need for at least two classes of hydroinformatic tools for flood risk communication: (1) simplified tools for use by the general public; and (2) more comprehensive tools that may present advanced terminology or display sensitive information of use to emergency responders or flood professionals. This finding reinforces the typology of flood risk communication tools as targeting “lay” and “community” decision maker audiences described by Mostafiz et al. (2022). A prime example of this can be seen in participant responses to our transportation network accessibility tools. Participants wanted to be able to select different water height thresholds for different vehicles. However, it is generally accepted that for the public, emergency responders would prefer a binary definition. That is, if there is any standing water, citizens should consider the road impassable. However, those operating in a disaster response capacity will need to know what classes of vehicles can access different parts of the road network (with different inundation depths) so that responders can task the appropriate vehicles for search and rescue operations.
Related to the simplified-complex tools dichotomy, our research indicates a dichotomy between static planning tools and dynamic real-time tools. In general, people related more to real-time tools. This desire was expressed clearly when workshop participants were evaluating road transportation network drivability and accessibility tools. Again, this reflects the tool typology of Mostafiz et al. (2022) where existing tools tend to be biased toward providing real-time information of use just before or during flooding events. However, the time and financial resources required to develop tools that can ingest real-time sensor data from waterways and from the road network and perform accessibility or drivability analyses far exceeds that required to produce planning-oriented analyses using static models. Further, publishing and maintaining tools that people may use in real-time during flood emergencies may incur potential legal liability that needs to be considered carefully. Future research is needed to explore what is behind the desire for dynamic real-time tools and to determine to what degree these needs can be provided using static planning tools. From our workshop research we have developed a follow-on hypothesis that a significant value can be gleaned from static planning tools employing models of historical and potential future flood events, without incurring the significant expense and liability involved with building dynamic real-time tools. Through further research, we propose to test whether such planning tools could be used as part of “war gaming” individual and community flood response to help people and communities build better intuition regarding flood risk based on the best available localized models.
The challenges of communicating complex flood risk information, as became evident from our workshops, suggest the need for working with local media outlets and communication experts. Such collaboration can provide compelling ways for building community-level awareness about flood implications through novel hydroinformatic tools and communication strategies (e.g., journalism series with multimedia) that illustrate historic impacts at a community scale while communicating complex flood information, model outputs and risk metrics. Finally, we point out that, while our study attempted to reach wide swaths of the community, a broader and more diverse participation to include those from lower socioeconomic backgrounds and underrepresented groups is still needed in future efforts. Also, our study used a set of preliminary tools that were used primarily to initiate community interaction and engagement in the research. Therefore, future work is needed to engage in a participatory design process and co-create tools and technologies that can inclusively address the different needs of communities as they face increasing flood risk and climate extremes.
The raw data supporting the conclusions of this article will be made available by the authors, without undue reservation.
The studies involving human participants were reviewed and approved by Institutional Review Board, University of Louisiana at Lafayette. The participants provided their written informed consent to participate in this study.
EH, BM, LS, ME, AO, and SB contributed to the study conception and development. EH led and coordinated the workshops and all authors contributed to facilitating the workshops. ME, BM, TD, and RM developed the flood information tools. EW, LS, AO, and EH performed the analyses of workshops data. EH and BM led the writing of the manuscript, with contribution from LS, AO, and EW to the Results Section, and from ME, RM, TD, and SB to the Methodology Section. All authors contributed to the article and approved the submitted version.
This work was financially supported by a National Science Foundation Smart and Connected Communities Planning Grant (Award# 2125472).
The authors wish to acknowledge the community members and organizations who participated in and helped advertise the workshops.
The authors declare that the research was conducted in the absence of any commercial or financial relationships that could be construed as a potential conflict of interest.
All claims expressed in this article are solely those of the authors and do not necessarily represent those of their affiliated organizations, or those of the publisher, the editors and the reviewers. Any product that may be evaluated in this article, or claim that may be made by its manufacturer, is not guaranteed or endorsed by the publisher.
Barnes, S. R., Bond, C., Burger, N., Anania, K., Strong, A., Weilant, S., et al. (2017). Economic evaluation of coastal land loss in Louisiana. J. Ocean Coastal Econ. 4, 1062. doi: 10.15351./2373-8456.1062
Basco-Carrera, L., van Beek, E., Jonoski, A., Benítez-Ávila, C., and Pj Guntoro, F. X. (2017). Collaborative modelling for informed decision making and inclusive water development. Water Res. Manag. 31, 2611–2625. doi: 10.1007/s11269-017-1647-0
Bilskie, M. V., and Hagen, S. C. (2018). Defining flood zone transitions in low-gradient coastal regions. Geophys. Res. Lett. 45, 2761–2770. doi: 10.1002/2018GL077524
Bradford, R. A., O'Sullivan, J. J., Langan, S. J., Rotko, P., Bonaiuto, M., Twigger-Ross, C., et al. (2011). Improving flood communications in Europe: results from vulnerable and impacted communities, Proceedings of the International Symposium on Urban Flood Risk Management, Graz, Austria, 553–558.
Capps, A. (2022a). Lafayette sues St. Martin, corps of engineers over vermilion river spoil banks removal. Daily Advertiser. Available online at: https://www.theadvertiser.com/story/news/local/2022/03/24/lafayette-sues-st-martin-over-vermilion-river-spoil-banks-removal/7146795001/ (accessed August 9, 2022).
Capps, A. (2022b). Lafayette has $13.5M tied up in a drainage project that it can't spend. Daily Advertiser. Available online at: https://www.theadvertiser.com/story/news/local/2022/09/06/lafayette-may-be-out-22-million-as-state-says-reimbursement-being-neglected-josh-guillory/65462998007/ (accessed October 31, 2022).
Chen, F. C., Subedi, A., Jahanshahi, M. R., Johnson, D. R., and Delp, E. J. (2022). Deep learning–based building attribute estimation from google street view images for flood risk assessment using feature fusion and task relation encoding. J. Comp. Civil Engin. 36, 04022031. doi: 10.1061/(ASCE)CP.1943-5487.0001025
FEMA (2021). Hazus Inventory Technical Manual. Available online at: https://www.fema_hazus-inventory-technical-manual-4.2.3.pdf (accessed July 02, 2023).
FEMA (2022). Hazus 5.1 Flood Technical Manual. Available at: https://www.fema.gov/sites/default/files/documents/fema_hazus-flood-model-technical-manual-5-1.pdf (accessed March 23, 2023).
Ghimire, E., and Sharma, S. (2021). Flood damage assessment in HAZUS using various resolution of data and one-dimensional and two-dimensional HEC-RAS depth grids. Nat. Hazards Rev. 22, 04020054. doi: 10.1061/(ASCE)NH.1527-6996.0000430
Heal, E. N., and Watson, K. M. (2017). Flood inundation extent and depth in selected areas of Louisiana in August 2016. U.S. Geol. Sur. Data Rel. ver. 1, 1. doi: 10.5066/F79K48C1
KATC (2022). Judge orders drainage work halted until case is settled. KATC. Available at: https://www.katc.afayettelafayette-parish/judge-orders-drainage-work-halted-until-case-is-settled (accessed March 20, 2023).
Landström, C., Becker, M., Odoni, N., and Whatmore, S. J. (2019). Community modelling: a technique for enhancing local capacity to engage with flood risk management. Environ. Sci. Policy 92, 255–261. doi: 10.1016/j.envsci.11009
Lechowska, E. (2018). What determines flood risk perception? A review of factors of flood risk perception and relations between its basic elements. Nat. Hazards 94, 1341–1366. doi: 10.1007/s11069-018-3480-z
Maskrey, S. A., Mount, N. J., Thorne, C. R., and Dryden, I. (2016). Participatory modelling for stakeholder involvement in the development of flood risk management intervention options. Environ. Modell. Software 82, 275–294. doi: 10.1016/j.envsoft.04027
Miles, M. B., and Huberman, A. M. (1984). Qualitative Data Analysis. Beverly Hills: Sage Publications.
Miller, R. L. (2022). Modeling temporal accessibility of an urban road network during an extreme pluvial flood event. Nat. Hazards Rev. 23, 04022032. doi: 10.1061/(ASCE)NH.1527-6996.0000586
Mostafiz, R. B., Friedland, C. J., Rahman, M. A., Rohli, R. V., Tate, E., Bushra, N., et al. (2021). Comparison of neighborhood-scale, residential property flood-loss assessment methodologies. Front. Environ. Sci. 9, 734294. doi: 10.3389/fenvs.2021.734294
Mostafiz, R. B., Rohli, R. V., Friedland, C. J., and Lee, Y. C. (2022). Actionable information in flood risk communications and the potential for new web-based tools for long-term planning for individuals and community. Front. Earth Sci. 3, 242. doi: 10.3389./feart.2022.840250
Riskfactor (n.d.). Available online at: https://riskfactor.com/ (accessed March 29, 2023)..
Saad, H. A., and Habib, E. H. (2021). Assessment of riverine dredging impact on flooding in low-gradient coastal rivers using a hybrid 1D/2D hydrodynamic model. Front. Water 3, 628829. doi: 10.3389/frwa.2021.628829
Saad, H. A., Habib, E. H., and Miller, R. L. (2021). Effect of model setup complexity on flood modeling in low-gradient basins. JAWRA 57, 296–314. doi: 10.1111/1752-1688.12884
Saldana, J. (2021). The Coding Manual for Qualitative Researchers. Thousand Oaks, CA: SAGE Publications Limited.
Samenow, J. (2016). No-name storm dumped three times as much rain in Louisiana as Hurricane Katrina. Available online at: https://www.washingtonpostcom/news/capital-weather-gang/wp/2016/08/19/noname-storm-dumped-three-times-as-much-rain-in-louisiana-as-hurricane-katrina (accessed August 9, 2022).
Skilton, L., Osland, A. C., Willis, E., Habib, E. H., Barnes, S. R., and ElSaadani, M. (2022). We don't want your water: broadening community understandings of and engagement in flood risk and mitigation. Front. Water 3, 169. doi: 10.3389./frwa.2022.1016362
Stewart, R. M., and Rashid, H. (2011). Community strategies to improve flood risk communication in the Red River Basin, Manitoba, Canada. Disasters 35, 554–576. doi: 10.1111/j.1467-717.2010.01222.x
Strauss, A., and Corbin, J. (1998). Basics of Qualitative Research: Second Edition: Techniques and Procedures for Developing Grounded Theory. 2nd edition. Thousand Oaks: SAGE Publications, Inc.
Taylor, C. (2022). Judge to decide on one LCG quick-take land grab case by April 13. The Advocate. Available online at: https://www.theadvocate.com/acadiana/news/courts/article_cf43ec90-b67a-11ec-99cd-8fa31a19b87d.html (accessed October 31, 2022).
Terrell, D. (2016). The Economic Impact of the August 2016 Floods on the State of Louisiana. Baton Rouge: Louisiana Economic Development. Available online at: https://gov.louisiana.gov/assets/docs/RestoreLA/SupportingDocs/Meeting-9-28-16/2016-August-Flood-Economic-Impact-Report_09-01-16.pdf (accessed July 2, 2023).
Turk, L. (2022a). Lafayette's ‘new pace' of government lands its drainage strategy in court. The Current. Available online at: https://thecurrentla.com/2022/lafayettes-new-speed-of-government-has-its-drainage-strategy-in-court/ (accessed August 9, 2022).
Turk, L. (2022b). Judge rules against LCG in second expropriation case, orders halt on work at massive Homewood site. Available online at: https://thecurrentla.com/2022/judge-rules-against-lcg-in-second-expropriation-case-orders-halt-on-work-at-massive-homewood-site/ (accessed October 31, 2022).
U.S. Bureau of Labor Statistics (2019). State and County Employment and Wages. Washington, DC: U.S. Bureau of Labor Statistics. Available online at: https://www.bls.gov/cew/data.htm (accessed July 2, 2023).
US Census Bureau (2021). American community survey poverty status in the past 12 months, table S1701, 5-year estimates for 2017–2021. Available at https://data.census.gov/ (accessed July 2, 2023).
Verlynde, N., Voltaire, L., and Chagnon, P. (2019). Exploring the link between flood risk perception and public support for funding on flood mitigation policies. J. Environ. Plann. Manag. 62, 2330–2351. doi: 10.1080/09640568.2018.1546676
Waldon, M. G. (2018). High Water Elevations on the Vermilion River During the Flood of August 2016. Available online at: https://www.researchgate.net/publication/323108783_High_Water_Elevations_on_the_Vermilion_River_During_the_Flood_of_August_2016 (accessed September 1, 2022).
Wang, C., Yu, Q., Law, K. H., McKenna, F., Stella, X. Y., Taciroglu, E., et al. (2021). Machine learning-based regional scale intelligent modeling of building information for natural hazard risk management. Automat. Const. 122, 103474. doi: 10.1016/j.autcon.2020.103474
Wang, Z., Wang, H., Huang, J., Kang, J., and Han, D. (2018). Analysis of the public flood risk perception in a flood-prone city: the case of Jingdezhen city in China. Water 10, 1577. doi: 10.3390/w10111577
Watson, K. M., Storm, J. B., Breaker, B. K., and Rose, C. E. (2017). Characterization Of Peak Streamflows and Flood Inundation of Selected Areas in Louisiana from the August 2016 flood (No. 2017–5005). US Geological Survey. doi: 10.3133./sir20175005
Wright, P. (2016). Louisiana flood by the numbers: tens of thousands impacted. the weather channel. Available online at: https://weather.com/news/news/louisiana-floods-by-the-numbers (accessed August 9, 2022).
Keywords: flooding, community, informatics, tools, workshops, risk, social, hydrodynamic
Citation: Habib EH, Miles B, Skilton L, ElSaadani M, Osland AC, Willis E, Miller R, Do T and Barnes SR (2023) Anchoring tools to communities: insights into perceptions of flood informational tools from a flood-prone community in Louisiana, USA. Front. Water 5:1087076. doi: 10.3389/frwa.2023.1087076
Received: 01 November 2022; Accepted: 22 June 2023;
Published: 17 July 2023.
Edited by:
Jayant Kumar Routray, Asian Institute of Technology, ThailandReviewed by:
Robert V. Rohli, Louisiana State University, United StatesCopyright © 2023 Habib, Miles, Skilton, ElSaadani, Osland, Willis, Miller, Do and Barnes. This is an open-access article distributed under the terms of the Creative Commons Attribution License (CC BY). The use, distribution or reproduction in other forums is permitted, provided the original author(s) and the copyright owner(s) are credited and that the original publication in this journal is cited, in accordance with accepted academic practice. No use, distribution or reproduction is permitted which does not comply with these terms.
*Correspondence: Emad H. Habib, ZW1hZC5oYWJpYkBsb3Vpc2lhbmEuZWR1
Disclaimer: All claims expressed in this article are solely those of the authors and do not necessarily represent those of their affiliated organizations, or those of the publisher, the editors and the reviewers. Any product that may be evaluated in this article or claim that may be made by its manufacturer is not guaranteed or endorsed by the publisher.
Research integrity at Frontiers
Learn more about the work of our research integrity team to safeguard the quality of each article we publish.