 Seifu Kebede
 Kidist Hailu
 Abdulhafiz Siraj2
 Behailu Birhanu
95% of researchers rate our articles as excellent or good
Learn more about the work of our research integrity team to safeguard the quality of each article we publish.
Find out more
COMMUNITY CASE STUDY article
Front. Water , 13 March 2023
Sec. Water and Climate
Volume 5 - 2023 | https://doi.org/10.3389/frwa.2023.1066055
This article is part of the Research Topic Show Cases in Water View all 4 articles
This study demonstrates the use of environmental tracers (Water isotopes-δ18O–δ2H, Radon-222Rn, and Electrical Conductivity-EC) as complementary tools for backtracking the water source, estimating pipe water residence time, and monitoring the instability of the water quality. Using the capital of Ethiopia, Addis Ababa, as a case study site, we demonstrate that water isotopes (δ18O andδ2H) effectively backtrack the tap water to its source (springs, reservoirs, shallow aquifers, or deep aquifers). 222Rn is shown to be effective for discriminating groundwater-sourced pipe networks from those that are dominated by surface waters. Our reconnaissance survey reveals that 222Rn, a tracer previously not considered to determine the pipe water residence time, can be used effectively to determine pipe water residence time in groundwater-sourced pipe networks. We recommend further research to explore the capability of 222Rn as a robust indicator of the pipe water residence time in an urban piped water network. The tracers reveal that 50% of the city obtains its water from groundwater and that the groundwater-sourced areas of the city show the highest water quality instability. The water quality in groundwater-sourced pipes varies depending on pumping stoppage owing to power interruptions. Surface water-sourced pipe water shows seasonal variations in water quality, with occasional large deviations from the normal trends following flow interruptions.
Urban water managers need to track the water source in the pipe network and to monitor and modify its quality between the points of treatment and use. It is necessary to track the sources of tap water, as the associated quantity (e.g., water source depletion) and quality risks (e.g., source pollution) differ between the various sources (Wet et al., 2020). For example, groundwater is believed to be more resilient to short-term droughts and less vulnerable to pollution than surface water (Foster et al., 2020), which has a potential knock-on effect on the pipes they supply. The water quality at the point of use may differ from the quality at the source because of the modification processes within the distribution network (Liu et al., 2018), making monitoring the water quality modifications imperative. The International Standards Organization (ISO 5667-5:2006) and WHO recommend municipal water monitoring to detect these changes.
In cities with centralized water sourcing and well-engineered pipe networks, it may be feasible to determine the water source using pipe network maps and the pressure distribution within the system. In rapidly-growing urban centers in developing countries, multiple and decentralized water sources (reservoirs, well-fields, solitary wells, springs, etc.) contribute to the piped network (Price et al., 2019). This makes it challenging to backtrack the water source and determine the residence time of different water sources at the point of use.
The water quality may change along the flow path within the pipe network (Zlatanović et al., 2017; Wee et al., 2021; Zhang et al., 2021). The residence time of pipe water, the infiltration of exogenous substances, in the case of negative pressure in the pipes, as well as the mixing of water from different sources could lead to changes in the water quality. A longer residence time often leads to a greater probability of water contamination within the pipe network (Tinker et al., 2009; Sekozawa et al., 2013; Zlatanović et al., 2017; Geng et al., 2021; Kennedy et al., 2021). Thus, water residence time in pipe network is a variable of interest for urban water utilities; it can be determined by using methods such as hydraulic models (Tinker et al., 2009), chlorine decay model (Bhadula et al., 2021; Geng et al., 2021), or, to a lesser extent, by measuring trihalomethane, a by-product of the chlorine-organic matter interaction (Sekozawa et al., 2013).
Another characteristic of interest in piped networks is the irregular changes in its quality. Irregular changes in the quality of the source water cause microbiological and physicochemical destabilization of pipe materials, which subsequently lead to the release of substances into the drinking water through biofilm detachment and resuspension, which cause health and esthetic issues (Liu et al., 2017, 2018). Thus, monitoring the stability of water quality of a piped network is of interest in urban piped-water quality management. Theoretically, pipes sourced from surface water reservoirs should show seasonal variations in the water quality, and borehole-sourced pipes should show a stable chemical composition, due to the general stability of the groundwater chemistry, compared to that of the surface water. However, this may not be the case if boreholes source their water from different layers of the aquifer, which have different chemistries. The water quality variations in borehole water can occur in response to the degree of pumping and to seasonality (Yager and Heywood, 2014; Piscopo et al., 2020). The systematic and comparative investigation of the stability of the water quality for differently-sourced (surface water, groundwater, etc.) pipe networks is lacking in the literature. As more and more cities in developing nations shift from centralized to multiple decentralized sources (Chávez García Silva et al., 2020), an understanding of the stability of the water quality of piped waters, may be of interest.
This paper aims to test the applicability of environmental tracers as tools for backtracking the pipe-water sources, monitoring the composition stability of pipe-water, and determining its residence time in the pipes. We will demonstrate the capability of water isotopes (δ18O and δ2H) and Electrical Conductivity (EC) in backtracking the sources of water. We aim to demonstrate the potential use of 222Rn (Radon isotope), something that has not previously been considered, to determine the residence time of pipe water. Furthermore, we will test the potential of 222Rn for discriminating between surface water and groundwater sources in pipe networks. We have used Addis Ababa, the capital city of Ethiopia, as our case study site.
Environmental tracers (δ18O–δ2H, 222Rn, and EC) are widely used in hydrology to trace the origin and movement of water in the hydrological cycle (Gat, 1996; Bresciani et al., 2018; Kebede et al., 2021). Water isotopes (δ18O–δ2H) have recently been employed in urban water systems to differentiate between the sources of water in pipe networks and to investigate the reliance of the urban water supply on one source or another (Bowen et al., 2007; Jameel et al., 2016; Nagode et al., 2022). The advantage of water isotopes is that once the source water enters the pipe network, its δ18O–δ2H composition does not change within the pipes. Thus, δ18O and δ2H are powerful conservative tracers for backtracking the sources of pipe water, given that the different sources show different compositions.
222Rn is the other isotope that can be used to trace pipe water sources and estimate water residence time. 222Rn is a naturally-occurring and inert radioactive gas with a half-life of 3.82 days. It is produced in rocks and is abundant in groundwater, but non-existent in surface water. Depending on their residence time and degassing rate, water sources connected to groundwater should show a measurable 222Rn content. Since the half-life of 222Rn is short, it is an ideal isotope for determining the residence time of groundwater-sourced pipe water, as the typical age of water in pipes ranges from a few hours to a few days. Furthermore, 222Rn is an ideal tracer for discriminating between groundwater-sourced pipe water from surface-sourced (reservoir) ones. Given that the residence of water in the pipe network is sufficiently short (e.g., <10 days) and that the source water contains sufficient initial 222Rn, pipe water sourced from groundwater must show detectable levels of 222Rn. All surface-sourced pipe water must show non-detectable levels, as the 222Rn in this water is near zero. No published literature is available on the use of 222Rn for determining the residence time of pipe water and for backtracking the water sources. However, a number of studies employ 222Rn measurements in pipe networks to assess the radioactivity hazard of the water (Thabayneh, 2015; Büyükuslu et al., 2018). The current study is apparently the first in using 222Rn to determine the water source and residence time in pipe networks.
Electrical Conductivity (EC) is a vital water quality parameter that can be measured easily (Bresciani et al., 2018). It correlates with most other dissolved substances in water and is thus widely used as a proxy for other dissolved substances in water (USGS, 2019). Thus change in the EC signifies a change in the water quality, implying EC can be used as a tracer of the water quality changes within a pipe network. Groundwater has a higher EC than surface water due to its chemical interaction with rocks (USGS, 2019). Generally, the shallow layers of an aquifer have a lower EC, compared to the deeper layers (Hem, 1989). Thus, EC can be used to backtrack pipe water to its shallow aquifer, deep aquifer, or surface water sources.
The study was conducted in the water-challenged city of Addis Ababa. The challenges include complexity of the pipe network, intermittent water supply, and inadequate water quality at the point of use. The city has a complex urban water supply system. Many other cities in developing nations face similar challenges (Oluka et al., 2013; Chakava et al., 2014; Beard and Mitlin, 2021). Firstly, the pipe water is sourced from multiple origins (Figure 1A), including two large surface water reservoirs (Legedadi R and Gfersa R), multiple well-fields (Akaki 1, Akaki 2, Akaki 3, Old Akaki, and Legedadi), solitary decentralized boreholes within the premises of the urban area, and dispersed springs (Figure 1A). Secondly, tens of thousands of households have installed secondary water storage reservoirs (with a 1–5 m3 capacity) to overcome the intermittent water supply. The reservoirs could alter the pipe water residence time and quality because of the potential backflow from the storage to the pipe network. Thirdly, untreated groundwater from hundreds of boreholes (BHs) is haphazardly injected into the pipe network from multiple decentralized solitary boreholes. The borehole water may be injected directly into the primary or higher-order pipes or singularly, where they are used to supply a specific area (e.g., the high-rise condos) of the city. This increases the risk of adding unaccounted-for pollutants into the pipe networks. Studies have demonstrated that tap water in Addis Ababa is polluted with trace elements, including As, Cr, Ni, Pb, Fe, and Mn (Dessie et al., 2021), turbidity, E. Coli bacteria (Mekonnen, 2015; Dessie et al., 2021), and coliforms (Wolde et al., 2020). The causes of pollution are unknown; it could be because the contaminated source or modification of the water quality within the pipes. A systematic investigation has been lacking into whether the above-normal concentrations are due to the water quality characteristics of the source, the infiltration of contaminated water into the pipe network, or the water quality changes within the pipe network.
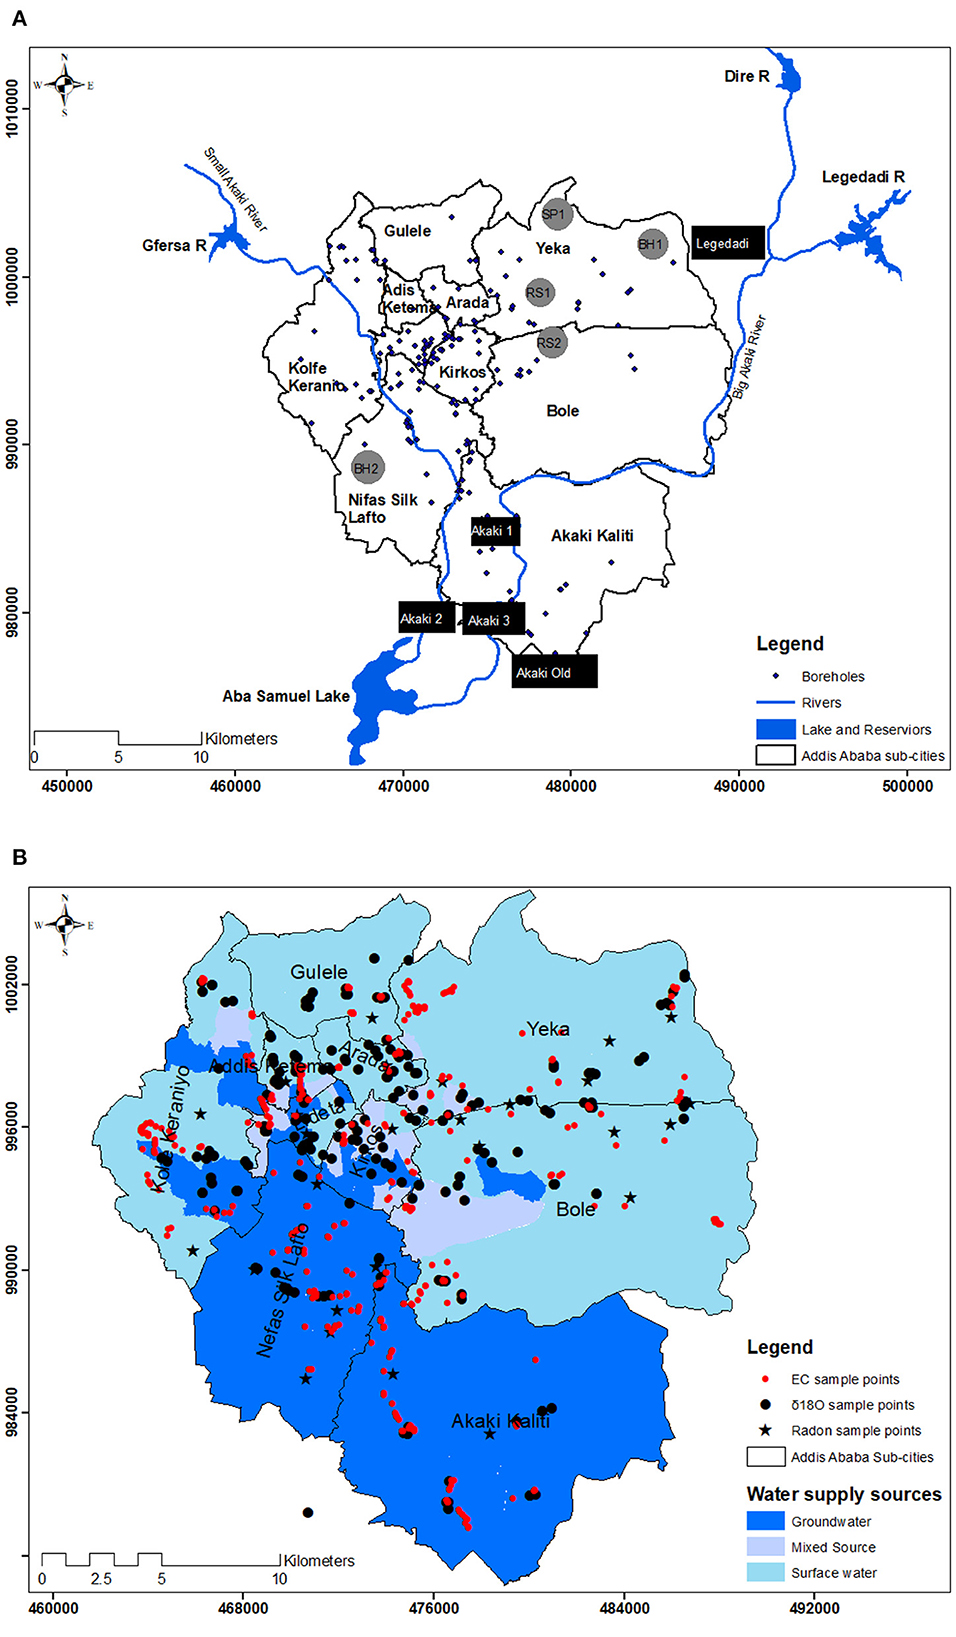
Figure 1. (A) Location of the various water sources supplying the city of Addis Ababa and EC monitoring sites, (B) Approximate Urban Water Utility water source map and snapshot of tap water sampling sites.
There is limited literature on the use of environmental tracers for backtracking the water sources, estimating residence time, and understanding the water quality stability. As a result, we designed our sampling and measurement strategy as a reconnaissance survey and thus conducted a number of snapshot measurements at multiple spatial and temporal scales.
We sampled 48 groundwater sources (springs, shallow wells, and deep wells) and ten samples from the reservoirs and stream waters that feed the reservoirs (Gfersa and Legedadi) for δ18O and δ2H measurements. We measured the EC of tap water at 510 locations (Figure 1B), which are fairly distributed across the water source map produced by the Addis Ababa Urban Water Utility (Figure 1B). We sampled the tap water at 220 locations (Figure 1B) for δ18O and δ2H, primarily before the pipes entered the household storage reservoirs. 222Rn samples were measured at 27 selected locations. For the 222Rn measurements, we took samples along the pre-defined flow direction of the pipe water.
For isotopic and EC measurement, grab samples were taken from water sources (water wells, reservoirs, springs and streams) and tap waters. We allowed the tap water to run for 15 s before taking the samples. In all cases, leak-proof doubly capped plastic bottles were used for sample collection for δ18O and δ2H analysis. Locations for the spatial sampling of tap waters were chosen to represent the entire city and the water sources. The sites for temporal monitoring of water quality in tap waters were chosen based on a priori knowledge of the water source at the point of monitoring.The Spatial Analyst tool in ArcGIS version 10.3 was used to produce the maps in this work.
Furthermore, on-site EC (25°C) monitoring was conducted hourly at five selected households at the five locations (Sites RS1, RS2, BH1, BH2, SP1 in Figure 1A) for a minimum of 72 h and a maximum of 4 months. Hand-held devices (HannaTM 98312) with automatic temperature compensation and daily calibration were used to measure the EC of the water. The monitored sites included two predominantly surface water-sourced sites (RS1 and RS2), two solitary borehole-sourced sites (BH1 and BH2), and a site with mixed surface water and spring water source (Sp 1). The purpose of the long-term hourly measurement was to monitor the instability of the water quality within the pipe network accompanying the various sources.
A RAD7 radon electronic detector, fitted with a Big Bottle System for high sensitivity (Durrige Company Inc., 2020), was used to analyze the in situ 222Rn content on grab samples of the waters. The detection limit of the device is in the order of 30 Bq.m−3. The counting was based on the principle of liquid–gas-membrane extraction (Schmidt et al., 2008). An extraction module, consisting of hollow vinyl fibers allows radon stripping from the water sample into a connected closed-air loop. The water temperature was measured to convert the 222Rn in the air to 222Rn in the water. The overall standard deviation varied between 15 and 20%, which is higher for a low radon content. 222Rn counting was conducted at each site over a period of 2 h in four cycles of 30 min each. The first reading was discarded, and the average of the latter three readings was taken as the mean 222Rn composition of the specific water point. Liquid Water Isotope Analyzer version DLT 100 at Addis Ababa University was used to determine the δ18O and δ2H results in per mil (‰) notation calibrated against Vienna Standard Mean Ocean Water (VSMOW). The laboratory standard deviations are 0.2‰ for δ18O and 3‰ for δ2H.
The δ18O–δ2H composition of the water sources shows significant spatial and depth-wise variations. The shallow aquifers (Old Akaki Wellfield) and the cold springs plot near the weighted average δ18O–δ2H composition of the Addis Ababa summer rains (Figure 2). The deeper aquifers distinctly show the depleted δ18O–δ2H, when compared to the composition of the shallow aquifers and the weighted mean rainfall (Figure 2). The two surface water reservoirs and their tributaries showed a relatively enriched δ18O–δ2H composition, owing to evaporation from their surfaces (Figure 2).
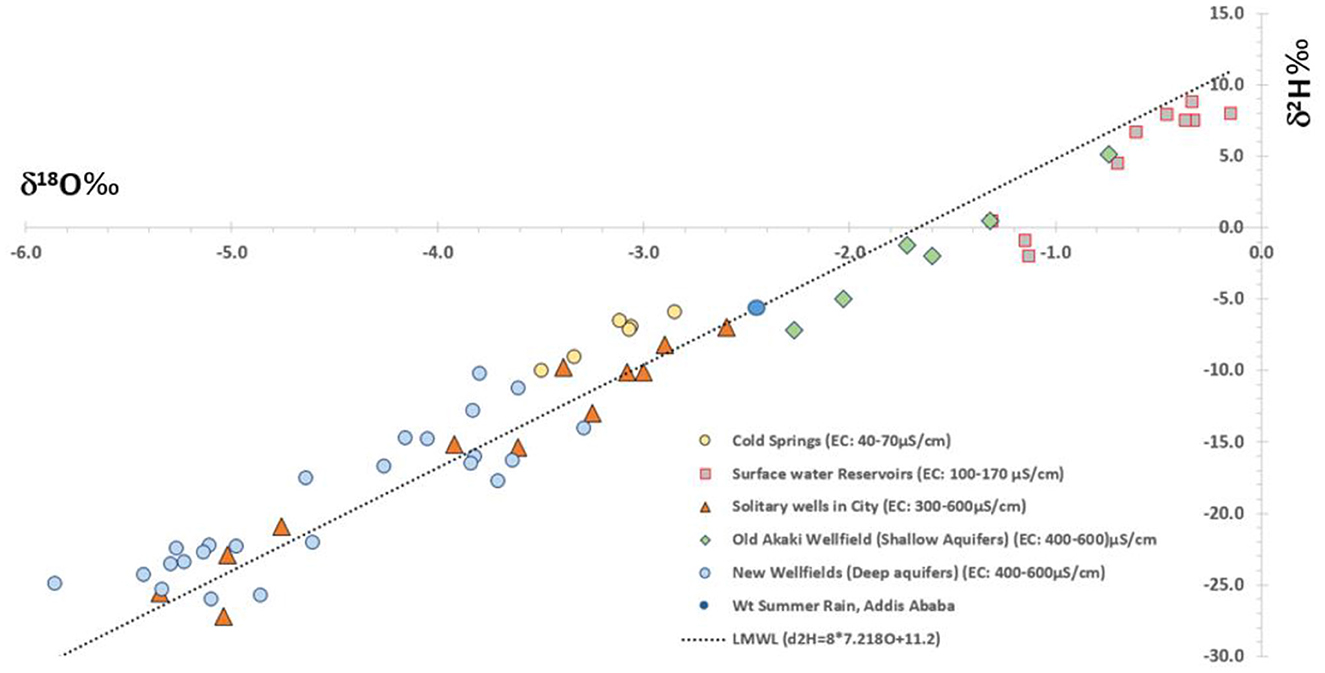
Figure 2. The δ18O– δ2H composition of the various water sources supplying the city of Addis Ababa. The range of EC values corresponding to each water source is given, along with the legend.
The EC of the groundwater (boreholes and well fields) varied between 400 and 700 μS/cm. The shallow aquifers generally showed a lower EC than the deeper aquifers (Figure 2). The two surface water reservoirs showed EC values ranging between 100 and 170 μS/cm, which were low in the rainy summer (June–September)and high in the dry winter (October–May). The cold springs supplying the northern part of the city showed an EC value that ranged from 40 to 70 μS/cm. 222Rn data in the surface water reservoirs showed values below the detection limit (30 Bq.m−3), and the shallow and deep groundwaters from the aquifers show 222Rn values ranging between 3,000 and 12,000 Bq.m−3.
The EC value of the 510 tap water samples ranged between 100 and 670 μS/cm. The Inverse Distance Weighting (IDW) method was used to make a spatial interpolation and produce the spatial distribution map. The distribution shows a distinct spatial variation, which mirrored the variations in the source water composition (Figure 3A). Two major regions can be recognized from Figure 3A: The tap water in the southern part of the city showed high EC values, compared to that in the northern part. The high EC in the southern sector mirrors that the tap water source is from the Akaki well-fields (Akaki 1, Akaki 2, Akaki 3, and Old Akaki), located to the south of the city. The northern part of the city showed low EC values, which mirrors sources coming from the two surface water reservoirs (Legedadi R and Gfresa R). The EC pattern also distinguished the presence of local groundwater sources within the surface water-dominated pipe networks in the northern part of the city. For example, in the north-west and north-east of the Yeka sub-city and east of the Bole sub-city (Figure 3A), the local high EC values reflect that the source of water is from the solitary boreholes and the newly-developed Lededadi well-field (Figure 1A). The intermediate EC value observed in the Kolfe-Keraniyo sub-city (Figure 3A) mirrors the mixture of water from the solitary shallow boreholes and water from the Gfresa Reservoir.
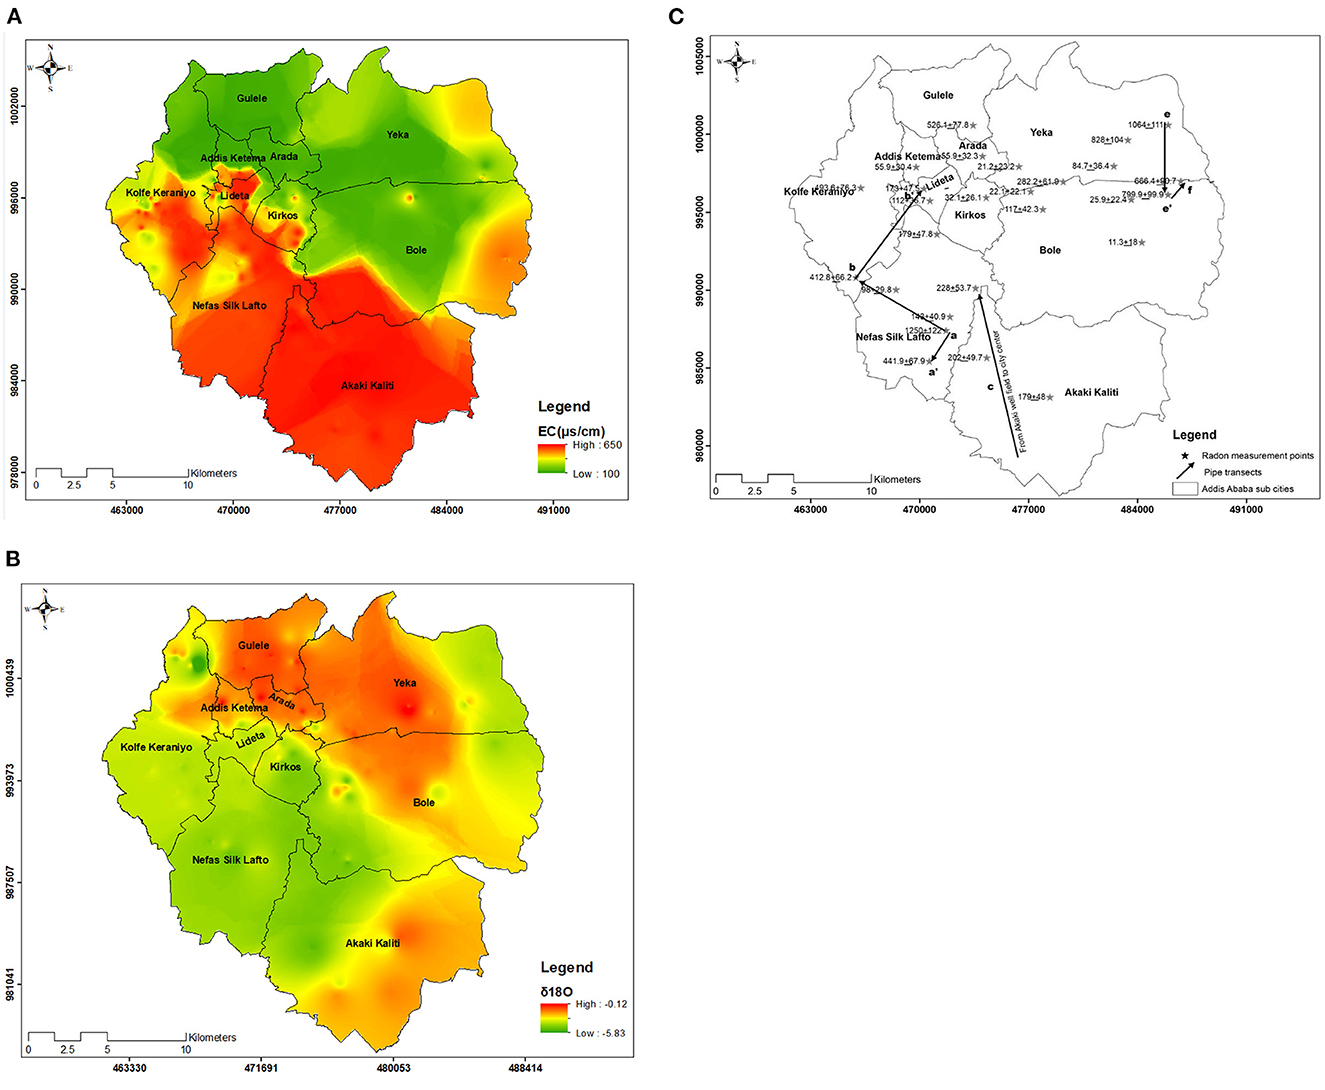
Figure 3. (A) The spatial pattern of EC, (B) the spatial pattern of δ18O(‰), and (C) the 222Rn (Bq/m3) composition in selected tap waters.
The δ18O pattern reflects a pattern similar to that of the EC, but with local differences. The tap waters showing the depleted δ18O signals (Figure 3B) in the south-western and most eastern sub city mirror the deep δ18O–δ2H depleted groundwater sources coming from the Akaki well-fields 1, 2, 3, and the Lededadi well-field, while the δ18O enriched regions reflect the sources from the surface water reservoirs (Legedadi R and Gfresa R). The enriched δ18O region in the south-eastern sector of the Akaki-Kaliti sub-city mirrors source from the shallow, relatively δ18O-enriched aquifers from the Old Akaki well-field.
The 222Rn in tap water showed a distinct spatial pattern that mirrors the source of the pipe water (Figure 3C). A high 222Rn was observed in the southern sub-city and locally in all the sub-cities reflecting a groundwater source. The northern and north-eastern region shows a low 222Rn, owing to sources from the two surface water reservoirs. The high 222Rn in the surface water-dominated northern sub-cities (Yeka, Bole, and Gulele) indicate that the source of pipe water is from solitary wells and that the addition of groundwater into the pipe network is from the newly-developed Legedadi well-field. All in all, the EC, δ18O, and 222Rn patterns reflect the -source water composition, which mirrors the City Administration's map of the tap water sources, as shown in Figure 1B.
The hourly monitoring of tap water at the five sites reveals variability in the EC, even when the water source is attributed to a single source. In the surface water sourced Yeka sub-city (Site RS1 in Figure 1A), a diurnal variation in EC was noted for the first 4 days, after which the EC jumped by about 30 μS/cm. While the water temperature variation can explain the diurnal variation, the cause of the jump on the fifth day was unclear (Figure 4A). One plausible explanation may be that the jump in EC marks the transitory passage of the borehole water injected into the system. The long-term (3-month) hourly EC in the surface water-sourced tap water (Site RS2 in Figure 1A) shows daily, seasonal, and other erratic variations. Similar to the RS1 site, the RS2 site shows a diurnal variation (Figure 4B). The EC declined from around 190 μS/cm in June (a dry month) to around 100 μS/cm in the wet month of August. The decline in the EC mirrors the decline of the EC in the source water, owing to the dilution of the reservoir water by rainfall. Site RS2 also shows erratic EC values. The first one is the very high outlier EC that was observed on three occasions (EC > 200 μS/cm). The outlier values were observed following pipe water interruptions and reconnection incidents. The outlier EC values thus reflect stagnation or the infiltration of contaminants into the pipe network, following the negative pressure that developed. The second erratic feature was the high variability in EC at Site RS2 in the month of September (Figure 4B); the cause of this high variability could not be established.
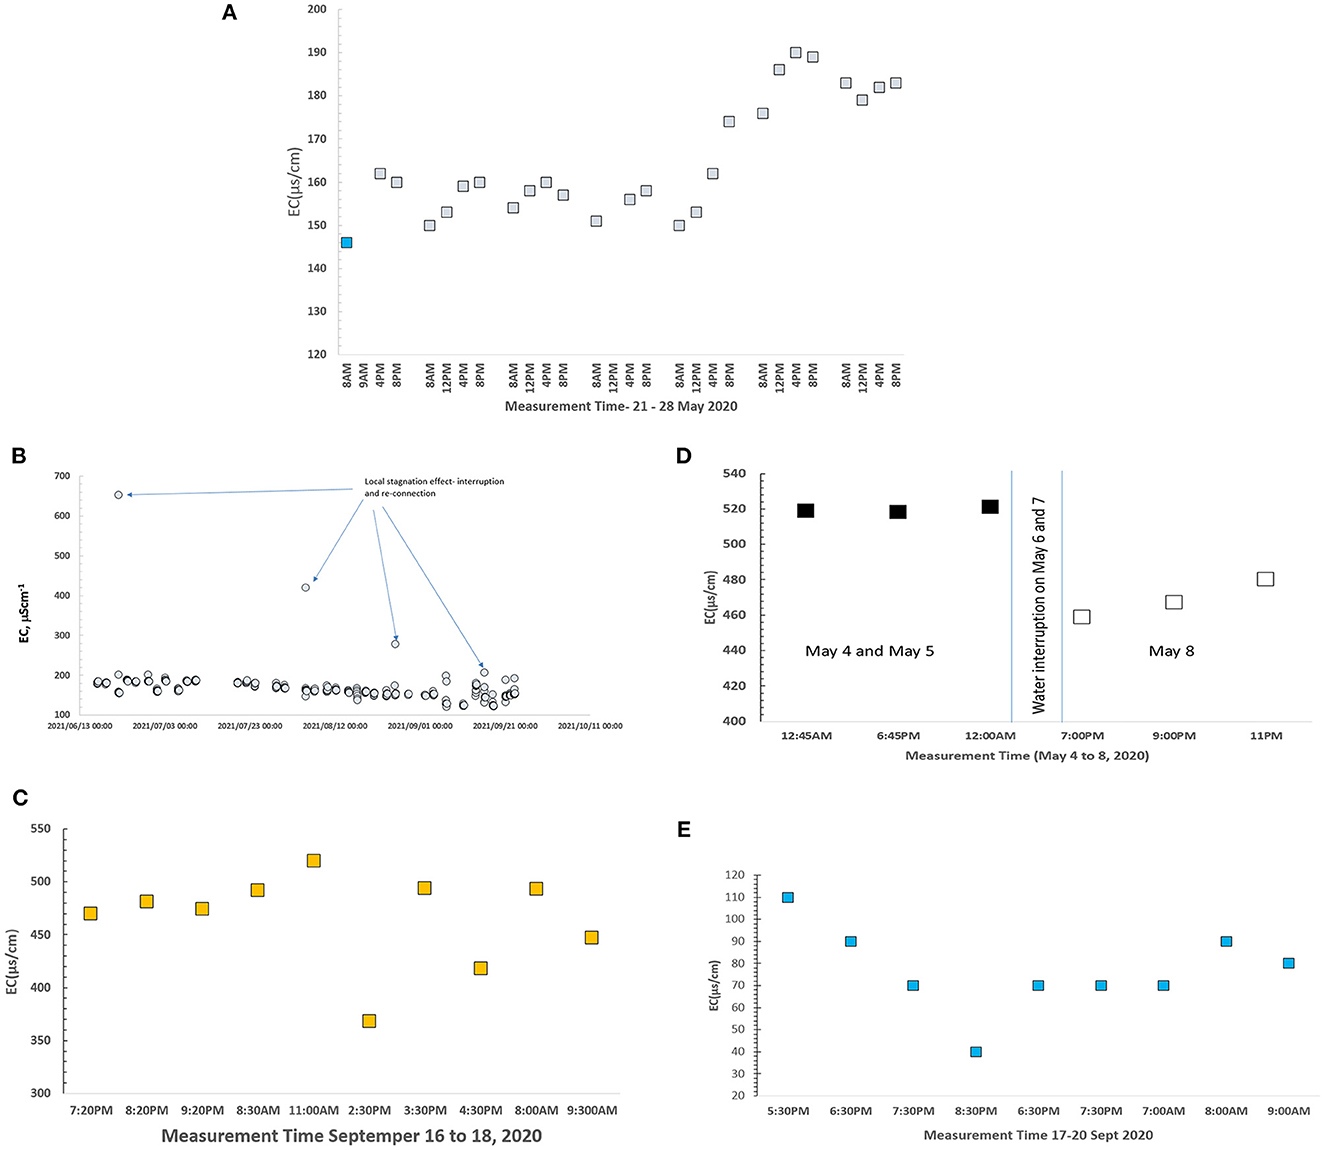
Figure 4. EC variation at sites RS1 (A), RS2 (B), BH2 (C), BH1 (D), and SP1 (E). The timing of the measurement of the EC values are given, along with the figures.
The two groundwater-sourced sites (BH1 and BH2 in Figure 1A) showed a significant EC variation (Figures 4C, D). In BH1, the pump was operated based on the users' water demand. Variations in the EC were linked to the pump operation hours. The EC is generally low at the start of pumping and increases during peak water use. The second site (Figure 4D) showed different EC patterns, after and before the days of water interruption, following a power cut. The higher EC on May 4 and 5 reflected water coming from a deeper level of the aquifer, while the low EC observed on May 8 reflected water coming from the shallow aquifer layers, which was caused by the aquifer recovery on May 6 and 7, following the power cut. The site sourced from the mixing of spring water (SP1) and the surface reservoir water (Legedadi R) (Figure 4C) showed a diurnal EC variation, which mirrored the mixing proportion between the two sources. The EC varied between 35 and 120 μS/cm (Figure 4E), with the low EC end member reflecting the water coming from the spring and the higher EC member, which reflected the water originating from the Legedadi Reservoir.
Another notable feature is the fact that borehole-sourced sites (BH1, BH2) showed the highest instability in EC values (Figures 4C, D), compared to the surface water-sourced sites (RS1, RS2). The high variability in solitary well-sourced sites probably reflects variations in the degree of pumping and subsequent variations in the layer of the aquifer from which water is pumped in that particular instance. The surface water reservoir-sourced pipes showed relatively greater water quality stability, with noticeable seasonal changes and an occasional significant departure (Figure 4B). The outlier values in surface water-sourced sites may be due to the infiltration of contaminants into the pipe network.
EC, δ18O–δ2H, and 222Rn effectively distinguished tap water sources. The tracers could also show the presence of locally-injected borehole water in otherwise surface water-dominated pipe networks. In the groundwater-sourced suburbs, the tap water showed a generally depleted δ18O, a high EC, and a measurable amount of 222Rn. The taps connected to shallow boreholes show an enriched δ18O, compared to the deep groundwater-sourced taps. The tap waters sourced from surface water reservoirs show a relatively enriched δ18O, a low EC, and a 222Rn content that was below detection (< 30 Bq/m3). This work reveals that such tracers can effectively discriminate the water sources in pipe networks offering the opportunity to use the tracers as complementary tools in urban pipe system water quality monitoring studies and monitoring design.
Urban water engineers conventionally use chlorine-based decay equations or hydraulic models to estimate the water residence time. Chlorine-based pipe water residence time computations are prone to error because of the non-conservative nature of chlorine. Depending on the water temperature and the initial concentration, chlorine interacts with the pipe wall and leads to a non-constant decay rate, which adds errors to the residence time computations (Tinker et al., 2009; Bhadula et al., 2021; Geng et al., 2021).
One of the important findings of the current research is that 222Rn can be used as a potential tracer to determine the residence time of pipe water, potentially complementing chlorine decay or hydraulic model-based estimations. The advantages of 222Rn include its non-reactive nature and its half-life, which is within the usual water residence time in urban pipe networks. We propose the simple radioactivity equation (Equation 1: modified from http://www-naweb.iaea.org/napc/ih/documents/global_cycle/vol%20i/cht_i_06.pdf to estimate the residence time.
where 222Rnt is the composition at the downstream end of the pipe network, 222Rno is the initial concentration of 222Rn at the point of entry in the upstream location λ is radon decay constant and is 0.181/day, and t is the time it takes for the water (residence time) to flow from the upstream entry point to the downstream point.
The disadvantage of 222Rn may be its loss to degassing in the pipe network if there are storage reservoirs between the two ends of the pipe for which the residence time estimation is required. Degassing may lead to a loss of 222Rn, and it may thus overestimate the residence time if Equation 1 is to be used. The residence time may be estimated easily under conditions where degassing is negligible. Degassing may be negligible if a large volume of water flows through the pipes daily and if the number of secondary reservoirs is limited. Furthermore, substantial infiltration and exfiltration of air into and from the pipe network can also alter the 222Rn content, which may lead to an overestimation of residence time. Assuming that there is no loss by degassing, no addition of new water into the pipe network, and insignificant infiltration and exfiltration of air, the age equation (Equation 1) can easily be used to compute the residence time.
For our study, it was unrealistic to assume that degassing in the pipe network was negligible if the entire network was considered. Thus, instead of computing the residence time across the entire pipe network, we isolated a specific pipe section with a known pipe layout with no storage to estimate the residence time of water flow from the upstream end to the downstream point. We selected six different transects connecting the upstream and downstream points. The pipe transects along which the age determination has been computed are shown in Figure 3C (transects a–a′, a–b, b–b′, c–c′, d–d′, and e–e′). We took the 222Rn in the upstream and downstream sites as 222Rno and 222Rnt, respectively, and computed the residence time between the two sites.
A quick look into the 222Rn pattern observed in the groundwater-sourced suburbs (Figure 3C) shows a generally declining trend as one moves into the city center from the well-fields in the southern and south-western parts of the city. The residence time estimated by using Equation 12 along the selected transect and the salient features of the selected pipe transect, are presented in Table 1. We do not have independent sources of evidence to validate the estimation. The Addis Ababa Urban Water Utility estimates that 3 days is the mean residence time of water in the entire pipe network (Personal Communication), which suggests the reasonability of the estimates made for the selected pipe section. Apart along section a–a′, there is a good correlation (R2 = 0.75) between the mean residence time and the length of the pipe, which further confirms the reasonableness of the 222Rn-based estimates.
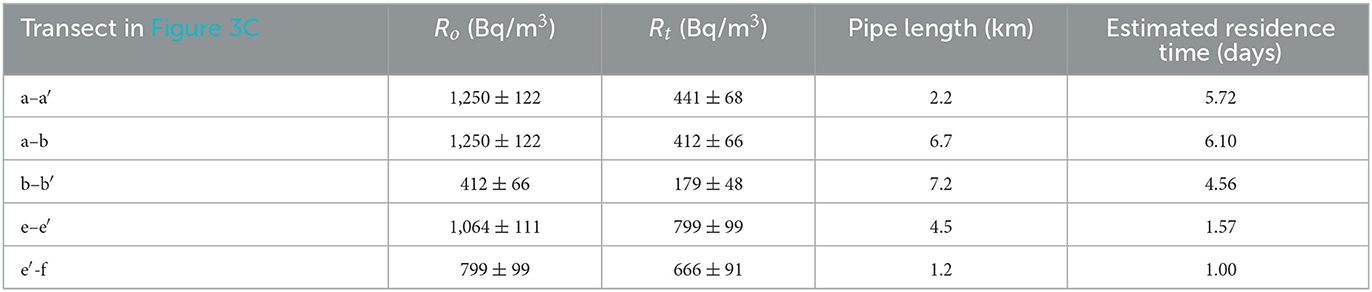
Table 1. 222Rn based residence time estimation for the selected section of pipes in Addis Ababa.
Using EC as an index of the water quality, we demonstrated that all the tap water showed a significant temporal variation, which potentially implies a temporal chemistry variation in the water. The variations has been observed on an hourly, daily, weekly, and seasonal time scale. Groundwater-sourced sites showed the highest temporal variations compared to surface-water and reservoir-sourced sites. Erratic changes in the EC of the water were noted in the surface water-sourced sub-city. These erratic variations are most likely attributed to stagnation and the infiltration of contaminated water into the pipe network following pipe water interruptions. The snapshot survey demonstrates that the chemical composition of tap water varies in response to the water sources. It also demonstrates that the spot water samples may not represent the long-term water quality properties of tap water. Solitary borehole-sourced tap water showed the highest degree of quality fluctuation. The stoppage of boreholes as a result of power outages was the primary cause of water quality fluctuation in borehole-sourced sites. Surface water-sourced tap waters also showed water quality fluctuations in response to diurnal variations in the temperature, water interruptions, and the infiltration of ambient contaminated water into the pipes.
Environmental tracers have been proven to be an effective tool for backtracking the origins of tap water and for providing supplementary information on the residence time of pipe water. Backtracking the tap water to its source should provide important supplementary information for managing the water quality risks. The temporal monitoring of tap water shows the presence of unstable water quality at multiple time scales. The water quality of the monitored sites, at any given time, is not only the result of the composition of the source water but it is also affected by the mixing of water sources, the degree of pumping, the water-flow interruptions, stoppages, the reconnection of borehole pumps, etc. The instability in the composition of pipe water reveals the need to consider these variations in the design of urban water quality monitoring. The National guideline determines the number and frequency of monitoring based on the population density. The current work demonstrates that monthly sampling may not effectively capture water quality variations. More frequent monitoring may be needed in cities supplied by solitary boreholes. Monitoring the water quality also needs to be done following water interruptions, as an interruption may lead to compositional changes due to the infiltration of extraneous substances into the pipe network. In addition to the known water quality degraders, such as a high residence time and negative pressure in the pipe network, the current work demonstrates that the urban pipe water quality may be tied to the urban energy supply, as water quality changes can happen in response to borehole stoppages and reconnection as a result of electricity cuts.
The current work demonstrates the potential of environmental tracers, such as water isotopes (δ18O–δ2H), radon (222Rn), and Electrical Conductivity (EC), for backtracking the sources of water, for estimating the residence time of water and for monitoring the instability of the water quality in an urban pipe network. The tracers have effectively discriminated between surface water-sourced pipe water from those sourced from groundwater. The groundwater-sourced sites have been further discriminated into shallow groundwater vs. deep groundwater. The use of the 222Rn decay equation provided reasonable age values for the selected known sections of the pipe. To avoid complications from unaccounted radon rise, storage, and sink, we have isolated a specific pipe section with a known pipe layout with no storage, rise, and sink in order to estimate the residence time of water flow from the upstream end to the downstream point. While the non-reactive nature of 222Rn and its half-life is suitable for the estimation of water residence time in the urban pipe network, the impact of (a) degassing of 222Rn, (b) ingress of gasses into the pipe networks and, (c) radioactivity that may arise from the pipe wall, must be the target of future research. Sediment deposition inside pipe walls serving as a source of 222Rn is the other complicating factor that needs further research.
We established that groundwater was the predominant water source for the case study site in the southern part of the city. In contrast, surface water sources dominated the northern part of the city. By using EC and 222Rn, the presence of water originating from solitary boreholes was identified in the surface water-dominated pipe network in the northern part of the city. Water residence time varied from a few hours to 1–6 days. Surface water-sourced (reservoir) pipe networks show a seasonal trend and have relatively high water quality stability, except when it shows outlier values following pipe water interruptions and reconnections. Small diurnal variations in chemistry are noted for the surface water-sourced networks. Solitary borehole-sourced pipe waters show a high water quality variation, probably in response to the degree of pumping and pump stoppages and restarts, following electricity disruptions. This reveals the potential link between the energy supply and water quality in urban settings.
The raw data supporting the conclusions of this article will be made available by the authors, without undue reservation.
The authors confirm contribution to the paper as follows: SK: study conception, design, analysis and interpretation of results, and manuscript writing. BB: GIS and production of figures and data collection. KH: data collection (δ18O–δ2H, 222Rn) and contribution to writing. AS: data collection (EC). All authors reviewed the results and approved the final version of the manuscript.
This paper is an output of the Coordinated Research Project (IAEA-CRP F33024) by the International Atomic Energy Agency and is entitled Isotope Techniques for the Evaluation of Water Sources for Domestic Supply in Urban Areas. We also acknowledge the additional support of the REACH program, which is led by the University of Oxford. REACH is funded by UK Aid from the FCDO for the benefit of developing countries (Aries Code 201880); it has provided logistical support, such as laboratory supplies, and it has financed the publication fees. However, the views expressed, and the information contained in it, are not necessarily those of, or endorsed by, the University of Oxford or the FCDO, which can accept no responsibility for such views or information, or for any reliance placed on them.
The authors declare that the research was conducted in the absence of any commercial or financial relationships that could be construed as a potential conflict of interest.
All claims expressed in this article are solely those of the authors and do not necessarily represent those of their affiliated organizations, or those of the publisher, the editors and the reviewers. Any product that may be evaluated in this article, or claim that may be made by its manufacturer, is not guaranteed or endorsed by the publisher.
Beard, V. A., and Mitlin, D. (2021). Water access in global South cities: the challenges of intermittency and affordability. World Dev. 147, 105625. doi: 10.1016/j.worlddev.2021.105625
Bhadula, R. C., Kala, V. N., Pant, R., Kholiya, D., and Singh, S. J. (2021). Ageing of pipe induced chlorine concentration decay: a one dimensional mass transfer modeling. Mater. Today Proc. 46, 10761–10765. doi: 10.1016/j.matpr.2021.01.670
Bowen, G. J., Ehleringer, J. R., Chesson, L. A., Stange, E., and Cerling, T. E. (2007). Stable isotope ratios of tap water in the contiguous United States. Water Resour. Res. 43, 1–12. doi: 10.1029/2006WR005186
Bresciani, E., Cranswick, R. H., Banks, E. W., Batlle-Aguilar, J., Cook, P. G., and Batelaan, O. (2018). Using hydraulic head, chloride and electrical conductivity data to distinguish between mountain-front and mountain-block recharge to basin aquifers. Hydrol. Earth Syst. Sci. 22, 1629–1648. doi: 10.5194/hess-22-1629-2018
Büyükuslu, H., Özdemir, F. B., Öge, T. Ö., and Gökce, H. (2018). Indoor and tap water radon (222Rn) concentration measurements at Giresun University campus areas. Appl. Radiat. Isotopes 139, 285–291. doi: 10.1016/j.apradiso.2018.05.027
Chakava, Y., Franceys, R., and Parker, A. (2014). Private boreholes for Nairobi's urban poor: the stop-gap or the solution? Habit. Int. 43, 108–116. doi: 10.1016/j.habitatint.2014.01.012
Chávez García Silva, R., Grönwall, J., Van Der Kwast, J., Danert, K., and Foppen, J. W. (2020). Estimating domestic self-supply groundwater use in urban continental Africa. Environ. Res. Lett. 15, 9. doi: 10.1088/1748-9326/ab9af9
Dessie, B. K., Gari, S. R., Mihret, A., Desta, A. F., and Mehari, B. (2021). Determination and health risk assessment of trace elements in the tap water of two Sub-Cities of Addis Ababa, Ethiopia. Heliyon 7, e06988. doi: 10.1016/j.heliyon.2021.e06988
Foster, S., Eichholz, M., Nlend, B., and Gathu, J. (2020). Securing the critical role of groundwater for the resilient water-supply of urban Africa. Water Policy 22, 121–132. doi: 10.2166/wp.2020.177
Gat, J. R. (1996). Oxygen and hydrogen isotopes in the hydrologic cycle. Ann. Rev. Earth Planet. Sci. 24, 225–262. doi: 10.1146/annurev.earth.24.1.225
Geng, B., Fan, J., Shi, M., Zhang, S., and Li, J. (2021). Control of maximum water age based on total chlorine decay in secondary water supply system. Chemosphere 287, 132198. doi: 10.1016/j.chemosphere.2021.132198
Hem, J. D. (1989). Study and Interpretation of Chemical Characteristics of Natural Waters, 3rd edn. Denver: US Geological Survey Water Supply Paper, p. 2254.
Jameel, Y., Brewer, S., Good, S., Tipple, B., Ehleringe, J., and Bowen, G. (2016). Tap water isotope ratios reflect urban water system structure and dynamics across a semiarid metropolitan area. Water Resour. Res. 44, 5891–5910. doi: 10.1002/2016WR019104
Kebede, S., Charles, K., Godfrey, S., MacDonald, A., and Taylor, R. G. (2021). Regional-scale interactions between groundwater and surface water under changing aridity: evidence from the River Awash Basin, Ethiopia. Hydrol. Sci. J. 66, 450–463. doi: 10.1080/02626667.2021.1874613
Kennedy, A., Flint, L., Aligata, A., Hoffman, C., and Arias-Paić, M. (2021). Regulated disinfection byproduct formation over long residence times. Water Res. 188, 6523. doi: 10.1016/j.watres.2020.116523
Liu, G., Zhang, Y., Knibbe, W. J., Feng, C., Liu, W., Medema, G., et al. (2017). Potential impacts of changing supply-water quality on drinking water distribution: a review. Water Res. 116, 135–148. doi: 10.1016/j.watres.2017.03.031
Liu, G., Zhang, Y., van der Mark, E., Magic-Knezev, A., Pinto, A., van den Bogert, B., et al. (2018). Assessing the origin of bacteria in tap water and distribution system in an unchlorinated drinking water system by SourceTracker using microbial community fingerprints. Water Res. 138, 86–96. doi: 10.1016/j.watres.2018.03.043
Mekonnen, D. K. (2015). The Effect Of Distribution Systems On Household Drinking Water Quality In Addis Ababa, Ethiopia, and Christchurch, New Zealand A Thesis Submitted in Partial Fulfilment of the Requirements for. University of Canterbury, Christchurch, New Zealand. pp. 55–109.
Nagode, K., Kanduč, T., Železnik, B. B., Jamnik, B., and Vreča, P. (2022). Multi-isotope characterization of water in the water supply system of the City of Ljubljana, Slovenia. Water 14, 1–16. doi: 10.3390/w14132064
Oluka, S., Steigen, A. L., and Randhir, T. O. (2013). Managing coliform contamination and chlorine by-products in urban water supply system in Uganda. Sustain. Water Qual. Ecol. 1–2 59–67. doi: 10.1016/j.swaqe.2014.04.001
Piscopo, V., Formica, F., Lana, L., Lotti, F., Pianese, L., and Trifuoggi, M. (2020). Relationship between aquifer pumping response and quality of water extracted from wells in an active hydrothermal system: The case of the island of Ischia (Southern Italy). Water 12, 576. doi: 10.3390/w12092576
Price, H., Adams, E., and Quilliam, R (2019). The difference a day can make: The temporal dynamics of drinking water access and quality in urban slums. Sci. Total Environ. 671, 818–826. doi: 10.1016/j.scitotenv.2019.03.355
Schmidt, A., Schlueter, M., Melles, M., and Schubert, M. (2008). Continuous and discrete on-site detection of radon-222 in ground- and surface waters by means of an extraction module. Appl. Radiat. Isotopes. 66, 1939–1944. doi: 10.1016/j.apradiso.2008.05.005
Sekozawa, T., Masuda, K., and Murata, T. (2013). New method calculating water residence time for trihalomethane in a water supply network. WSEAS Trans. Syst. 7, 262–274.
Thabayneh, K. M. (2015). Measurement of 222Rn concentration levels in drinking water and the associated health effects in the Southern part of West bank: Palestine. Appl. Radiat. Isotopes 103, 48–53. doi: 10.1016/j.apradiso.2015.05.007
Tinker, S. C., Moe, C. L., Klein, M., Flanders, W. D., Uber, J., Amirtharajah, A., et al. (2009). Drinking water residence time in distribution networks and emergency department visits for gastrointestinal illness in Metro Atlanta, Georgia. J. Water Health 7, 332–343. doi: 10.2166/wh.2009.022
USGS (2019). Specific conductance chapter 6.3 of section A, national field manual for the collection of water-quality data. Technique 9, 1–15.
Wee, S. Y., Aris, A. Z., Yusoff, F. M., and Praveena, S. M. (2021). Tap water contamination: multiclass endocrine disrupting compounds in different housing types in an urban settlement. Chemosphere 264, 128488. doi: 10.1016/j.chemosphere.2020.128488
Wet, R. F., De, A., West, A. G., and Harris, C. (2020). Seasonal variation in tap water δ2H and δ18O isotopes reveals two tap water worlds. Sci. Rep. 41, 1–14. doi: 10.1038/s41598-020-70317-2
Wolde, A. M., Jemal, K., Woldearegay, G. M., and Tullu, K. D. (2020). Quality and safety of municipal drinking water in Addis Ababa City, Ethiopia. Environ. Health Prevent. Med. 25, 1–6. doi: 10.1186/s12199-020-00847-8
Yager, R. M., and Heywood, C. E. (2014). Simulation of the effects of seasonally varying pumping on intraborehole flow and the vulnerability of public-supply wells to contamination. Ground Water 52, 40–52. doi: 10.1111/gwat.12150
Zhang, H., Xu, L., Huang, T., Yan, M., Liu, K., Miao, Y., et al. (2021). Combined effects of seasonality and stagnation on tap water quality: changes in chemical parameters, metabolic activity and co-existence in bacterial community. J. Hazard. Mater. 403, 124018. doi: 10.1016/j.jhazmat.2020.124018
Keywords: isotopes (δ18O–δ2H), radon (222Rn), tap water, residence time, water quality, backtracking
Citation: Kebede S, Hailu K, Siraj A and Birhanu B (2023) Environmental isotopes (δ18O–δ2H, 222Rn) and electrical conductivity in backtracking sources of urban pipe water, monitoring the stability of water quality and estimating pipe water residence time. Front. Water 5:1066055. doi: 10.3389/frwa.2023.1066055
Received: 10 October 2022; Accepted: 23 February 2023;
Published: 13 March 2023.
Edited by:
Wan Hanna Melini Wan Mohtar, Universiti Kebangsaan Malaysia, MalaysiaReviewed by:
Teh Sabariah Abd Manan, Universiti Malaysia Terengganu, MalaysiaCopyright © 2023 Kebede, Hailu, Siraj and Birhanu. This is an open-access article distributed under the terms of the Creative Commons Attribution License (CC BY). The use, distribution or reproduction in other forums is permitted, provided the original author(s) and the copyright owner(s) are credited and that the original publication in this journal is cited, in accordance with accepted academic practice. No use, distribution or reproduction is permitted which does not comply with these terms.
*Correspondence: Seifu Kebede, S2ViZWRlR3VybWVzc2FTQHVrem4uYWMuemE=
Disclaimer: All claims expressed in this article are solely those of the authors and do not necessarily represent those of their affiliated organizations, or those of the publisher, the editors and the reviewers. Any product that may be evaluated in this article or claim that may be made by its manufacturer is not guaranteed or endorsed by the publisher.
Research integrity at Frontiers
Learn more about the work of our research integrity team to safeguard the quality of each article we publish.