 Roger A. Burke
 Ken M. Fritz
 Brent R. Johnson2
 Rachel Price
- 1United States Environmental Protection Agency (USEPA), Center for Environmental Measurement and Modeling (CEMM), Athens, GA, United States
- 2United States Environmental Protection Agency (USEPA), Center for Environmental Measurement and Modeling (CEMM), Cincinnati, OH, United States
Mountaintop removal coal mining (MTR) has been a major source of landscape change in the Central Appalachians of the United States (US). Changes in stream hydrology, channel geomorphology and water quality caused by MTR coal mining can lead to severe impairment of stream ecological integrity. The objective of the Clean Water Act (CWA) is to restore and maintain the ecological integrity of the Nation's waters. Sensitive, readily measured indicators of ecosystem structure and function are needed for the assessment of stream ecological integrity. Most CWA assessments rely on structural indicators; inclusion of functional indicators could make these assessments more holistic and effective. The goals of this study were: (1) test the efficacy of selected carbon (C) and nitrogen (N) cycling and microbial structural and functional indicators for assessing MTR coal mining impacts on streams; (2) determine whether indicators respond to impacts in a predictable manner; and (3) determine if functional indicators are less likely to change than are structural indicators in response to stressors associated with MTR coal mining. The structural indicators are water quality and sediment organic matter concentrations, and the functional indicators relate to microbial activity and biofilm production. Seasonal measurements were conducted over the course of a year in streams draining small MTR-impacted and forested watersheds in the Twentymile Creek watershed of West Virginia (WV). Five of the eight structural parameters measured had significant responses, with all means greater in the MTR-impacted streams than in the forested streams. These responses resulted from changes in source or augmentation of the original source of the C and N structural parameters because of MTR coal mining. Nitrate concentration and the stable carbon isotopic ratio of dissolved inorganic carbon were the most effective indicators evaluated in this study. Only three of the fourteen functional indicators measured had significant responses to MTR coal mining, with all means greater in the forested streams than in the MTR-impacted streams. These results suggest that stressors associated with MTR coal mining caused reduction in some aspects of microbial cycling, but resource subsidies may have counterbalanced some of the inhibition leading to no observable change in most of the functional indicators. The detritus base, which is thought to confer functional stability, was likely sustained in the MTR-impacted streams by channel storage and/or leaf litter inputs from their largely intact riparian zones. Overall, our results largely support the hypothesis that certain functional processes are more resistant to stress induced change than structural properties but also suggest the difficulty of identifying suitable functional indicators for ecological integrity assessment.
Introduction
A major goal of the 1990 amendment to the United States (US) Clean Air Act was to reduce acid precipitation. In response to this, coal production in West Virginia shifted from the high-sulfur coals in the north to the low-sulfur coals in the steep mountainous terrain of the south (Peng, 2000). Mountaintop removal coal mining (MTR) was a cost-effective technique that allowed the profitable recovery of coal seams in mountain ridges in the early twenty-first century (Peng, 2000). At the time of this study, the MTR process consisted of: (1) removing forest cover and soil; (2) blasting and removing overlying sedimentary rock layers (overburden or spoil); (3) mining the coal; (4) returning most of the overburden to the ridges; (5) dumping the excess overburden in adjacent valleys, which creates valley fills and buries stream channels; and (6) reclaiming the site (Griffith et al., 2012). The MTR process exposes minerals containing reduced sulfur and unweathered carbonates to air, resulting in the formation of sulfuric acid which dissolves the carbonates, releasing huge quantities of dissolved inorganic carbon (DIC), and calcium, magnesium, and sulfate ions to receiving streams which causes elevated conductivity (Ross et al., 2018). Reclamation entails site stabilization by compaction and terracing, reconstructing the soil column, constructing diversion channels to support hydrological stability, and rebuilding the landscape by restoring the vegetation (Feng et al., 2019). Largely because the MTR technique opened up such vast areas to profitable coal production, surface coal mining became the single greatest driver of land use change in the heavily forested Central Appalachians region of the US in recent decades (Drummond and Loveland, 2010). The cumulative area impacted by surface coal mining between 1976 and 2015 was estimated to be 5,900 km2, about 7.1% of Central Appalachia (Pericak et al., 2018). Using data from the U.S Energy Information Administration (U.S. Energy Information Administration, 2015, 2019) we calculated that the MTR technique accounted for 41% of the total surface coal production from 2008 to 2014 in West Virginia and Kentucky, which dominate MTR coal mining in Central Appalachia (Supplementary Table 1).
The objective of the US Clean Water Act (CWA) is to restore and maintain the ecological integrity of US waters. Human modifications of watershed land use often stress stream ecosystems and diminish their ecological integrity (Allan, 2004). Appropriate species, structures, and functions at multiple hierarchical levels are required for ecological integrity (Dale and Beyeler, 2001). Structures include the composition of the biological community, abiotic materials such as nutrients and other chemical components, and other features such as habitat structure, temperature, streamflow, and light, and functions include biological energy flows and nutrient cycling (Odum, 1962). The sediment microbial community plays a key role in several stream ecosystem functions including decomposition of organic matter and nutrient transformations (Findlay, 2010). These functions are controlled by several factors including the biodegradability of the organic matter undergoing decomposition, temperature, available electron acceptors, and a suitable microbial community (Jones, 1985). The energy yields of the various oxidation-reduction (redox) reactions associated with organic matter decomposition when denitrification occurs favor the use of electron acceptors in the following order: oxygen, nitrate, manganese (Mn IV), iron (Fe III), sulfate, and bicarbonate (Bethke et al., 2011). Assessing the impacts of MTR coal mining on the ecological integrity of Central Appalachian streams should consider structural and functional features of organic matter and nutrient cycling.
Tools for assessing ecological integrity are divided into two categories, those that measure structural integrity and those that measure functional integrity (National Research Council, 1996). Most indices and methods used by monitoring agencies to evaluate ecological condition have traditionally relied solely on structural indicators such as measurements of biological community composition and habitat structure (Davies and Jackson, 2006; Truchy et al., 2022). Inclusion of functional indicators in condition assessments should enable clearer communications of the status and restoration potential of aquatic ecosystems (Davies and Jackson, 2006) and perhaps better respond to CWA goals. In some cases, functional indicators show a stronger response to stressors than structural indicators and may be able to detect smaller perturbations and thus be more sensitive indicators of ecological integrity (Gulis et al., 2006). A major challenge is identifying and selecting useful indicators because they should be easily measured, be sensitive to the stresses placed on the system under study, respond to the stresses in a predictable manner, have a known response to natural and anthropogenic disturbances, and have low variability in response (Dale and Beyeler, 2001). Ideally, the relationship between indicator and stressor should be linear so that ecological integrity is simply proportional to measured indicator value, although this is often not the case (Young and Collier, 2009). For example, total insect production did not respond in a predictable manner to conductivity along a 5.5-km river continuum; although total insect production was 3.5 times lower in a site with intermediate conductivity (359 μS/cm) compared to an unmined stream (111 μS/cm), total insect production at a higher conductivity site (915 μS/cm) was not different than that of the unmined stream (Voss and Bernhardt, 2017). Further, Vander Vorste et al. (2019) observed that leaf litter decomposition rates were not reduced along a gradient of mining impacted streams with conductivity ranging from 25 to 1,383 μS/cm whereas leaf litter decomposition rates were reduced in MTR-impacted streams with mean conductivities ranging from 1,279 to 3,000 μS/cm (Maxwell, 2009; Fritz et al., 2010).
Odum (1985) hypothesized that certain functional properties are more resistant to stress induced change than are species composition and other structural properties. This greater resistance to stress exhibited by ecosystem functions is due to reserve capacity and/or the ability of some ecosystems to perform these functions by multiple pathways (Bormann, 1985). This functional redundancy is based on variations in genotypes, populations, and species found in many undisturbed or mildly disturbed ecosystems (Bormann, 1985). Small streams draining forested watersheds are largely detritus-based systems with direct litterfall from adjacent vegetation providing ~40% of the energy inputs (Fisher and Likens, 1973). A detritus base is characteristic of relatively mature ecosystems and is thought to confer functional stability to these systems (Odum, 1969). Because clearcutting of existing forest is part of the MTR process, the detritus base of the original system could be decreased to some extent or even temporarily lost. Geogenic organic matter (GOM), which consists of coal fragments and kerogen and is transferred to surface soils because of MTR mining, is a potentially large additional source of organic matter to MTR-impacted streams (Fox, 2009).
The occurrence of MTR coal mining in Central Appalachian watersheds causes changes in stream hydrology, geomorphology (Jaeger, 2015), and physicochemical water quality (Griffith et al., 2012), resulting in changes in structural properties such as altered biofilm bacterial communities (Bier et al., 2015), and decreased macroinvertebrate (Pond et al., 2008), and fish (Hitt and Chambers, 2014) diversity. Most stream assessments of the impact of MTR coal mining to date have employed structural indicators (e.g., Hartman et al., 2005; Lindberg et al., 2011; Ross et al., 2018) with relatively few studies including functional measures (e.g., Fritz et al., 2010; Johnson et al., 2013; Burke et al., 2014; Voss and Bernhardt, 2017; Krenz et al., 2018; Bier et al., 2020).
In this study, we evaluate the impact of land use (forest or MTR coal mining) on structural and functional parameters in perennial streams in the West Virginia coal mining region during fall, winter, spring, and summer sampling campaigns. The structural parameters evaluated as indicators of MTR coal mining included C and nitrogen (N) parameters in water and organic matter content in sediment. Elevated DIC and nitrate concentrations are often observed in MTR-impacted streams, respectively, from the dissolution of carbonates in sedimentary rock layers (Vengosh et al., 2013) and from explosives (Brooks et al., 2019) associated with the MTR process. Ash-free dry mass (AFDM) and dissolved organic carbon (DOC) parameters reflect watershed C sources which may be elevated by C inputs from sedimentary rock layers disturbed during MTR mining (Acton et al., 2011). The functional parameters considered are measures of sediment microbial process rate and biofilm productivity. Fluorescein diacetate activity (FDA), dehydrogenase activity (DHA), denitrification enzyme activity (DEA), and sediment oxygen demand (SOD) are all widely measured indicators of sediment microbial activity, which have not been widely evaluated in streams impacted by MTR mining (but see Burke et al., 2014). DHA in eastern US stream sediments was inversely correlated with alkalinity, conductivity, pH, and sulfate (Hill et al., 2002), which are frequently elevated with MTR mining (Lindberg et al., 2011; Griffith et al., 2012; Ross et al., 2018). FDA associated with freshwater macrophyte decay was shown to be inhibited by increasing conductivity levels (Roache et al., 2006). Higher nitrate concentrations generally lead to higher denitrification activity if redox conditions are suitable and if adequate labile carbon is available (Ambus, 1993; Udy et al., 2006), suggesting DEA as a potential indicator of MTR mining impact. Biofilm production on artificial substrates has been widely used to assess stream water quality (Fellows et al., 2006; Tien et al., 2009). The main purpose of this effort is to: (1) determine which structural and functional indicators in streams responded to MTR coal mining relative to forested controls; (2) determine whether responsive indicators to MTR coal mining responded in a predictable manner; and (3) evaluate whether functional indicators are less likely to change in response to stress than structural indicators.
Methods
Study area and sampling approach
Ten perennial streams within the Twentymile Creek watershed located in southern West Virginia, USA were chosen for study (Figure 1). The study area consists of steep ridges and narrow valleys and is underlain with middle- and lower-Pennsylvanian cyclic sequences of sandstone, shale, clay, coal, and limestone (Geologic Map of West Virginia; https://www.wvgs.wvnet.edu/www/maps/Geologic_Map_of_West_Virginia-Map25A.pdf). Although carbonates are found deeper in the subsurface, soil surveys found soil pH values generally <6 and no evidence of carbonates in the upper 2 m of forested soils (https://www.nrcs.usda.gov/resources/data-and-reports/web-soil-survey). Further details of the geology, geography, historic land use of the study area, and sampling site locations were described in companion studies conducted at the same sites and time as the present study (Maxwell, 2009; Johnson et al., 2013) and in a previous study (Wiley et al., 2001). Five of the streams drained watersheds (0.57–5.27 km2) impacted by MTR mining and five drained areas (0.91–3.99 km2) with 95 to 100% mixed hardwood forest cover (Supplementary Table 2). Comparison of 2001 National Land Cover Database (NLCD; https://www.usgs.gov/centers/eros/science/national-land-cover-database) with 2007 aerial photos suggests that most of the mining including creation of valley fills and initial reclamation occurred between 2001 and 2007 (Supplementary Table 3 and Google Earth images in Supplementary material). The MTR-impacted watersheds had 8–62% forest land cover and 38–92% barren land cover, presumably mostly due to MTR coal mining (Supplementary Table 2). All of the forested watersheds were clear-cut in the early 1900s and are impacted by natural gas production, so are not pristine controls, but are representative of the least disturbed condition in the area (Johnson et al., 2013). The streams were evaluated (Johnson et al., 2013) with the Riparian, Channel, and Environmental (RCE) Inventory (Petersen, 1992). The three RCE metrics which describe the riparian zone indicate that, except for one of the mining-impacted streams (Lost), all study streams have reasonably intact riparian vegetation and >80% canopy cover (Supplementary Table 2). All of the forested streams had total RCE scores in the “Excellent” class, four of the MTR-impacted streams scored as “Very good” and one MTR-impacted stream (Lost) scored as “Good” (Johnson et al., 2013). A companion study conducted in these sites at the same time as the present study found substantial sediment accumulation in litterbags deployed in the MTR-impacted streams suggesting considerable mobilization of sediment by the MTR mining process (Maxwell, 2009). Sediment metrics associated with the RCE inventory and the Rapid Bioassessment Protocol (RBP; Barbour et al., 1999) assessments conducted by Johnson et al. (2013) and reported in Supplementary Table 2 also suggest sedimentation impacts in the MTR-impacted streams.
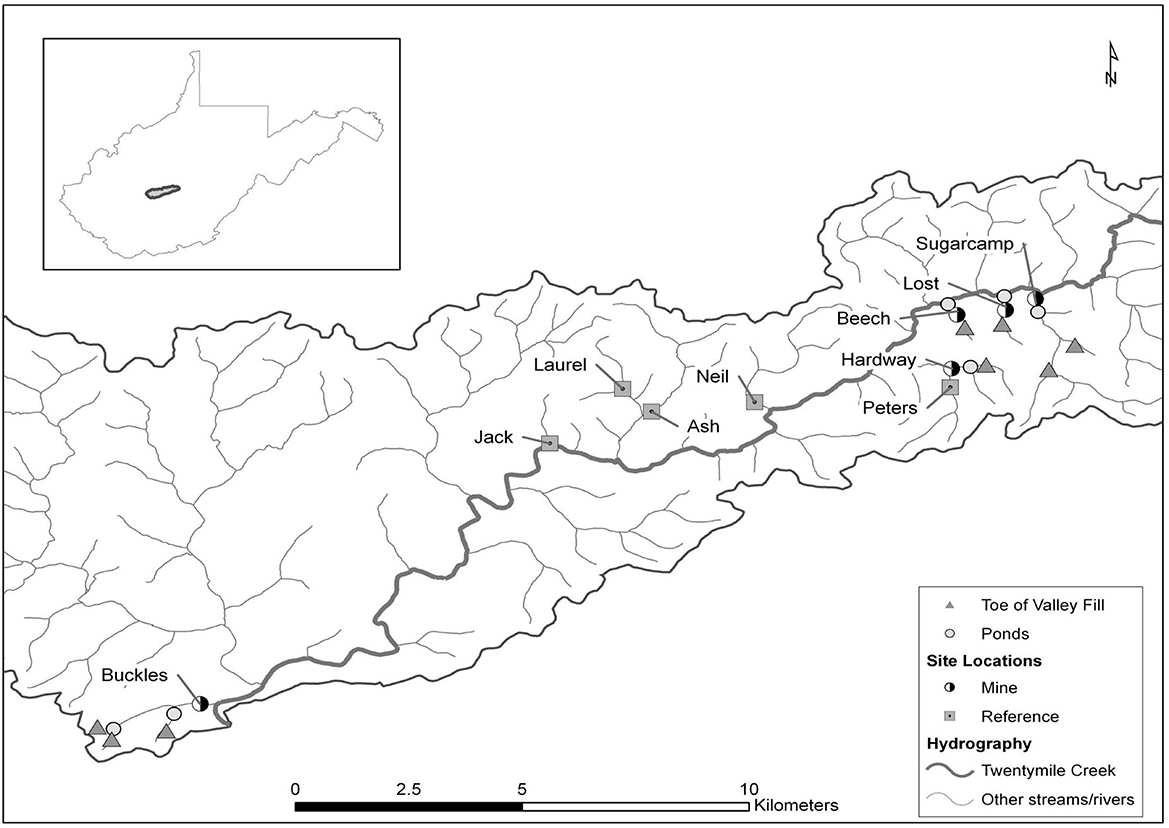
Figure 1. Map of study site locations, sediment ponds, and associated valley fills in the Twentymile Creek watershed, WV, USA (from: Johnson et al., 2013; www.schweizerbart.de/journals/fal).
The parameters described here were collected from 3 to 7 times between October of 2007 and July of 2008. Water samples were collected from the main flow path at mid-depth. Conductivity, temperature, and pH of stream water were measured in a companion study (Johnson et al., 2013) with a portable multiprobe (Hydrolab Quanta; Hydrolab Corp., Austin, TX) and are reported in Supplementary Table 4. Sediment samples were collected from the upper 2 cm of about five depositional areas within the wetted area of the channel along 100 m reaches and composited in each study stream. Sediments that passed through a 2-mm sieve were collected and further processed. For the biofilm production studies, two cinder blocks (20.3 × 40.6 × 4.2 cm), each with 25 fused-silica porous disks (5.31 cm2, Leco Corporation #528-042) attached were deployed on the stream beds in conjunction with the seasonal sampling trips and allowed to colonize for 9–36 days.
Structural measures
All water samples for DOC and DIC analyses were filtered in the field with GF/F syringe filters (0.7 μM pore size) and collected in 40-ml amber volatile organic analysis vials. Sample vials for DOC were capped with Teflon septa, and those for DIC were carefully filled to overflowing to exclude air and capped with butyl rubber septa. Water samples were transported to the lab on ice and refrigerated until analysis. The concentration and stable carbon isotopic composition (δ13C) of DOC and DIC were determined as previously described (Burke et al., 2014). Briefly, an OI Analytical 1030 W total inorganic carbon-total organic carbon analyzer (OI Analytical, College Station, TX) interfaced to a Thermo Delta V Plus isotope ratio mass spectrometer (Thermo Fisher Scientific, Waltham, MA) was used for DOC and DIC analyses. DOC parameters were analyzed following acidification and persulfate digestion and DIC parameters were analyzed following acidification. Stable carbon isotope ratios are expressed as per mil (‰) in the delta notation vs. Vienna Peedee Belemnite (VPDB):
All reported DIC and DOC concentration and δ13C values are based on at least two measurements. Dissolved CO2 concentrations, expressed as CO2 partial pressure (pCO2) in μatm, were calculated using the CO2Calc package (Robbins et al., 2010) from DIC concentrations and corresponding pH and temperature measured in the field. Nitrate concentrations in field-filtered (GF/F) water samples were measured by second-derivative UV spectroscopy (Crumpton et al., 1992). The AFDM of two sediment size fractions associated with different functional measures were determined by combustion at 500°C for 5 h. The AFDM of sediments that passed a 2-mm sieve will be referred to as AFDM2. A swirl-decantation technique (Palmer, 1990) was used in the field to obtain a fine sediment fraction from the 2 mm-sieved sediments. Briefly, 2 mm-sieved sediments were placed in a tub with stream water and the mixture was swirled around to suspend a finer and/or less dense fraction, which was then poured off into a cup. This suspended sediment fraction will be referred to here as “fine sediment” and AFDM of this fine sediment fraction will be referred to as AFDMf. AFDM was determined on all sediment sample replicates analyzed for a functional indicator except for DHA. For DHA, AFDMf was based on analyses of a single 10-g composite sediment sample collected from each stream on each date as described above. Although AFDM2 and AFDMf were each analyzed in two separate sets of samples, they are considered to be two indicators rather than four. All samples for AFDM analysis were put on ice, frozen as soon as possible, and transported to the lab.
Functional measures
Sediments
Denitrification is the microbial respiration of nitrate to nitrogen gas (N2) or nitrous oxide (N2O), using nitrate as the electron acceptor (Payne, 1973). Sediment DEA was measured in the lab by incubating ~25 g of 2 mm-sieved sediment, and 25 ml of a solution consisting of 100 mg N/L of nitrate, 40 mg/L of dextrose, and 10 mg/L of chloramphenicol dissolved in high purity water in an atmosphere of ~10% acetylene/90% nitrogen, for ~1.5 h, with gas samples generally taken at 30 min and 1.5 h (Groffman et al., 1999). The DEA assay provides conditions that are non-limiting for denitrification (anaerobic, abundant nitrate and labile carbon), but which inhibit organism growth (chloramphenicol). DEA is thus an estimate of the maximum potential denitrification rate by the denitrifying community present at the time of sampling.
Sediment denitrification rate (DeN) was measured similarly to DEA but using site water with 10 mg/L of chloramphenicol and no added nitrate or labile carbon and with an ~2 h incubation time, and gas samples generally taken at 30 min and 2 h (Loken et al., 2016). DEA and DeN were estimated by measuring production of N2O, which is the final product of denitrification with the added acetylene, during incubation. Acetylene is known to inhibit nitrification, so coupled nitrification/denitrification, which is the major source of N for denitrification when the overlying water has a nitrate concentration <140 μg N/L (Seitzinger et al., 2006) is also inhibited. As a result, DeN is likely lower than the actual in situ denitrification rate when stream nitrate concentrations are low. At overlying water nitrate concentrations in excess of 840 μg N/L, nitrate in the overlying water accounts for about 80% of the N used in denitrification (Seitzinger et al., 2006) and DeN could approximate actual in situ denitrification rates. All reported DEA and DeN values are based on measurement of at least two separate subsamples.
Sediment oxygen demand (SOD) includes the aerobic respiration of all organisms living in the sediment and chemical oxidation of reduced species such as Fe (II), Mn (II), and sulfide (Bowman and Delfino, 1980). SOD was estimated in the field as the change in oxygen concentration, as measured with a YSI Model 58 m and Model 5905 stirring dissolved oxygen (DO) probe (YSI Inc., Yellow Springs, OH) in 50-ml centrifuge tubes after incubation. The centrifuge tubes were completely filled with ~5 g of 2 mm-sieved sediment and stream water and incubated in the dark for ~2 h at ambient stream temperature (Hill et al., 2002). The SOD data are calculated based on measurement of five replicates and two stream water blanks.
Fluorescein diacetate is hydrolyzed to fluorescein by a wide range of intracellular and extracellular enzymes involved in organic matter decomposition, including esterases, proteases, and lipases, and it is generally assumed that the FDA assay provides a synoptic estimate of microbial decomposer activity (Adam and Duncan, 2001). Sediment FDA was measured (Green et al., 2006) by mixing ~0.5 g of fine sediment with 5 ml of phosphate buffer (pH 7.6) and 0.5 ml of fluorescein diacetate solution (8.4 mM) in 50-ml centrifuge tubes in the field, incubating for 30 min in the dark at ambient stream temperature, and terminating the hydrolysis reaction with acetone. The reacted samples were put on ice, frozen as soon as possible, and transported to the lab. After thawing and centrifugation, the fluorescein concentration of the supernatant was determined at 490 nm by spectrophotometry. The sediment FDA data are calculated based on triplicate measurements with a single reagent control.
Dehydrogenase activity (DHA), which is often referred to as electron transport system (ETS) activity in the literature (e.g., Trevors, 1984; Blenkinsopp and Lock, 1990), estimates the activity of intracellular hydrogenases that catalyze the redox reactions required for organic matter decomposition and is correlated with microbial activity (García et al., 1994). Sediment DHA was measured in the lab by adding ~0.5 g of fine sediment, 4 ml of deionized water, and 1 ml of 0.14% iodonitrotetrazolium chloride (INT) solution to a 50-ml centrifuge tube and vortexing for 30 s. The samples were then incubated for 6 h at 36°C, centrifuged for 5 min at 3,000 rpm, the supernatant removed, and 8 ml methanol added. The samples were again vortexed for 30 s, the supernatant removed, and the INT-formazan (INTF) produced was quantified at 440 nm by spectrophotometry. The sediment DHA data are triplicate measurements with duplicate controls that consisted of sediment and high purity water without any INT addition. The data presented here can be thought of as an estimate of in situ DHA because ETS stimulators (NADH, NADPH, and succinate) were not added so that disruption of sediment biofilms could be avoided (Blenkinsopp and Lock, 1990). The DHA values presented here are thus lower than many measurements of potential DHA from the literature that were determined using methods (e.g., Broberg, 1985) that added ETS stimulators. Sediment functional measurements are expressed on a g per dry mass (DM) or g AFDM basis (either AFDM2 or AFDMf).
Biofilm colonization
One or two disks, collected from the stream each visit, were incubated in 50-ml centrifuge tubes to measure biofilm production of oxygen demand, FDA, DHA, and chlorophyll a. Biofilm oxygen demand was measured with the same technique that was used for SOD. Biofilm FDA and DHA analyses used the same reagent additions, reaction times and temperatures, and spectrophotometry techniques as were used for the sediment analyses. Chlorophyll a was analyzed (Lorenzen, 1967; Sartory and Grobbelaar, 1984) by adding 10 ml of 90% ethanol to each tube and ensuring that the disks were completely submerged, shaking, incubating for 5 min at 78°C, and allowing tubes to stand in the dark at room temperature for 24–72 h. The extracts were then poured into other tubes, centrifuged for 20 min at 2,000 rpm, the supernatants removed and measured at 750, 664, 647, and 630 nm without acid and then at 750 and 665 nm after addition of 0.155 ml of 0.2 N HCl and a 90 s reaction period. Chlorophyll a amount was calculated as previously described (Lorenzen, 1967) with modifications. Production rates of biofilm oxygen demand (BfOD), biofilm FDA (BfFDA), and biofilm DHA (BfDHA) were calculated by dividing incubation rates by disk area and the colonization period length (days). Biofilm chlorophyll a production rate (BfChla) was calculated by dividing chlorophyll a mass by disk area and the colonization period length. BfOD, BfFDA, and BfDHA data were based on the same number of replicates and blanks as for the corresponding sediment parameters. BfChla data were based on triplicate measurements with blanks scattered throughout each sample set.
Data analysis
The Number Cruncher Statistical Software (NCSS) NCSS2019 package (NCSS, Kaysville, UT) was used for statistical analyses. The NCSS2019 Mixed Models procedure was used for repeated measures comparisons of each structural and functional parameter measured to determine if these parameters responded to MTR coal mining relative to forested controls. Sampling date was the time variable and the Kenward-Roger adjustment for degrees of freedom was applied to all analyses. Models with a range of error covariance structures (R matrices) of varying complexities were run and the model with the lowest Akaike Information Criteria (AIC) value was accepted (Anderson et al., 2000). Because the number of observations never exceeded the number of model parameters by at least a factor of 40, a modified criterion for small ample size correction called AICc was used for model selection (Anderson et al., 2000). To determine whether responsive indicators to MTR coal mining responded in a predictable manner multiple comparisons tests [Least Squares Means (LS Means) with Bonferroni adjustments] were run to identify specific differences when significant differences among treatments were indicated. Mean values of the dependent variables across replicates collected from a reach during a specific sampling trip were treated as the statistical unit for comparisons. Means reported in the text, tables, and figures are LS Means calculated by the NCSS2019 software. Results of the mixed models with the lowest AICc for each of the parameters reported here are given in Tables 1, 2, and Supplementary Table 5. The NCSS Linear Regression and Correlation routine was used to test for linear relationships between the functional indicators and temperature, conductivity, and pH when data from all dates and sampling sites were combined.
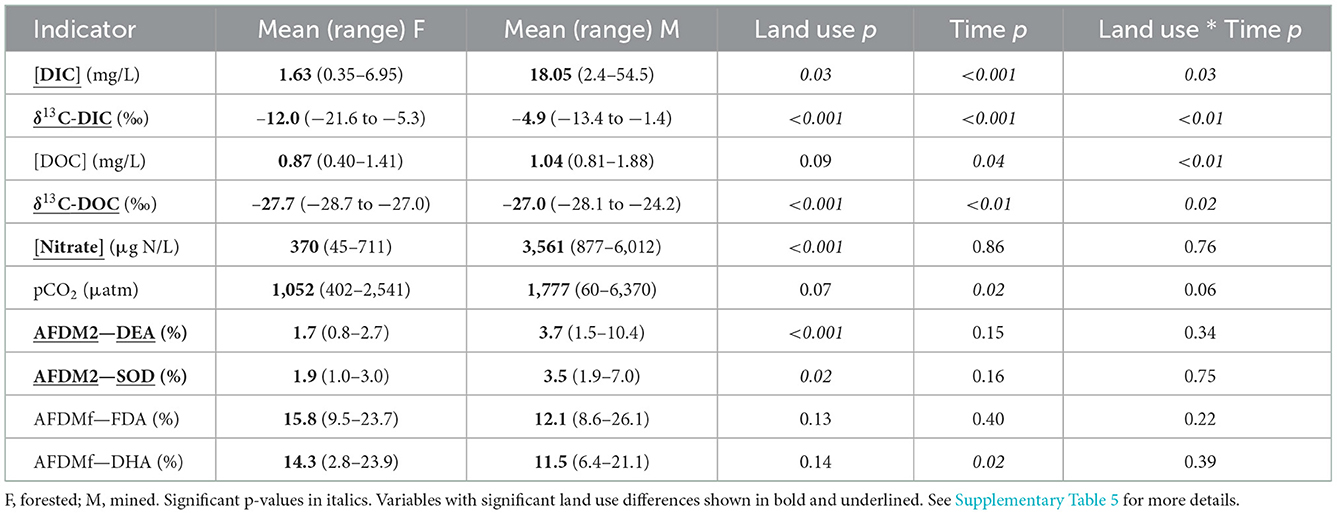
Table 1. Structural indicators mean [concentration], range, and p-values from model with lowest AICc.
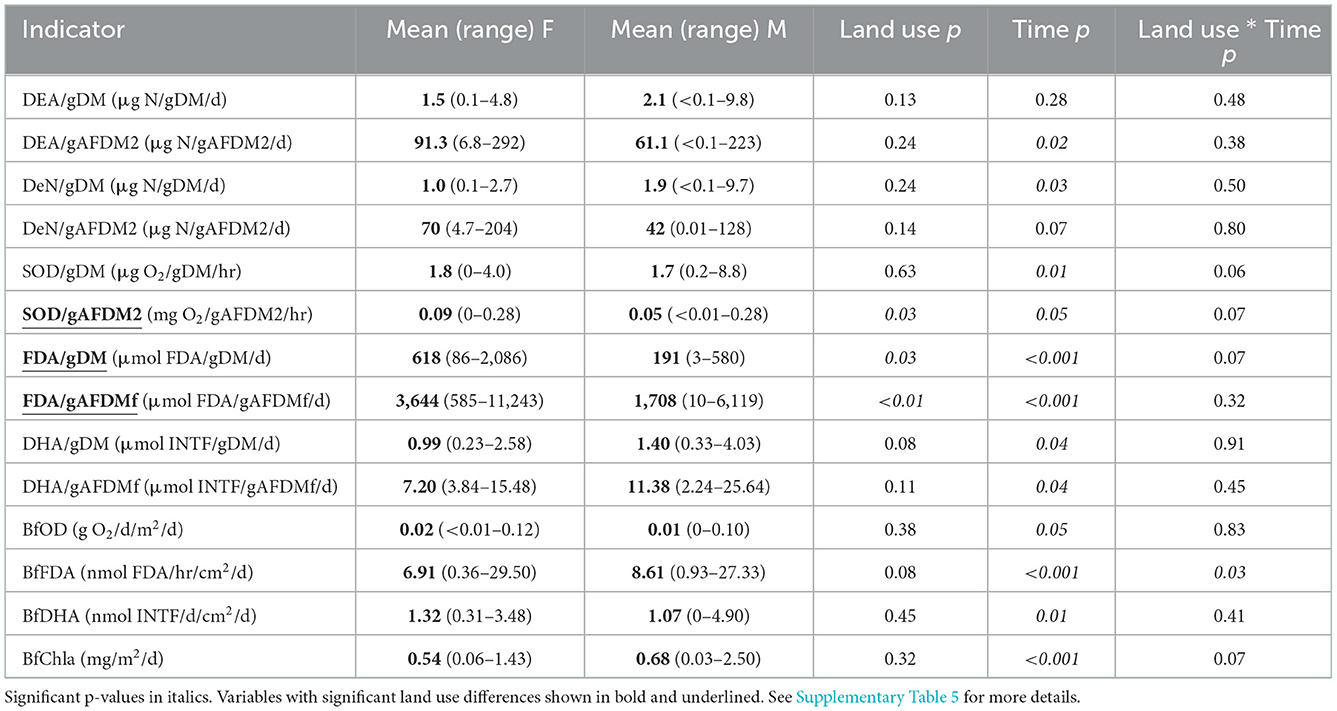
Table 2. Functional indicator p-values from models with the lowest AICc.
We used Miller-Tans plots of our DIC concentration and stable carbon isotopic composition (δ13C-DIC) data to estimate the source δ13C-DIC to forested and mining-impacted streams (Miller and Tans, 2003). The Miller-Tans plot (δ13C-DIC * DIC concentration vs. DIC concentration) results from an equation derived such that (1) the slope provides an estimate of the δ13C of a source (e.g., CO2 from soil respiration or DIC from carbonate dissolution) mixing with a background component (e.g., atmospheric CO2); and (2) the concentration and δ13C of the background component need not be known and can be variable (Miller and Tans, 2003). The slopes of the Miller-Tans plots were determined with the linear regression procedure in the NCSS2019 software.
We assessed the possible influence of CO2 degassing on DIC concentration and δ13C-DIC by performing degassing simulations (Venkiteswaran et al., 2014). Degassing is relatively more important in low-productivity streams draining silicate-dominated watersheds with low to moderate pH values (<7) and high CO2 concentrations, such as the forested streams studied here (Johnson et al., 2013; Venkiteswaran et al., 2014). For the degassing simulations we assumed a soil CO2 concentration of 20,000 μatm and a source δ13C-DIC of −22.3‰ (value calculated with the Miller-Tans plot of the forested stream data—see below) for the soil respiration source. We simulated degassing by removing portions of the CO2, initially in increments of 1,000 μatm down to 10,000 μatm, then in increments of 500 μatm down to 2,500 μatm, and finally in increments of 100 μatm down to 300 μatm. The CO2Calc package was used to calculate the redistribution of carbonate species and the pH change with degassing with constant carbonate alkalinity (Robbins et al., 2010). We imported the information regarding carbonate species changes with degassing into an Excel spreadsheet, which was used to perform all further calculations. We applied carbon isotopic fractionations of 2 and 3.5‰ (Wanninkhof, 1985; Zhang et al., 1995), respectively, to the increments of degassed CO2 and used the approach described by Campeau et al. (2017) and the data from CO2calc to calculate δ13C-DIC changes resulting from degassing.
Results
Structural measures
When data from all sampling dates were combined, mean DIC concentration was greater in the MTR-impacted streams than in the forested streams (Table 1, Figure 2A). Time and land use * time interactions are indicated on Figure 2A and in Supplementary Table 5. DIC concentrations varied a lot less in the forested streams than in the MTR-impacted streams (Figure 2A, Supplementary Table 6).
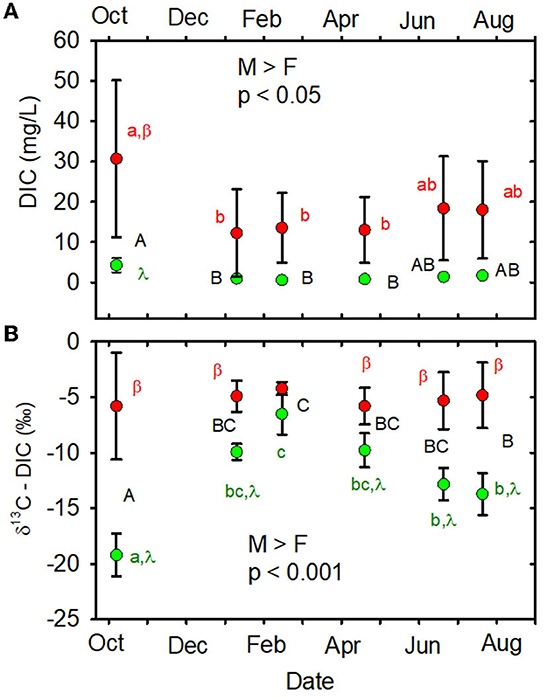
Figure 2. (A) DIC concentration (mg/L) vs. date. (B) δ13C-DIC (‰) vs. date. Statistical differences across all dates and sites are indicated as M > F or F > M and p-value. Different capital letters indicate significant time effects across all sites, different lowercase letters indicate significant time effects within a given land use, and Greek letters indicate a significant land use impact at a given time. When letters are not shown, no significant differences were observed. Forested watersheds —  , MTR watersheds —
  .
.
When data from all sampling dates were combined, mean DIC stable carbon isotopic composition (δ13C-DIC) was greater in the MTR-impacted streams than in the forested streams (Table 1, Figure 2B). The Miller-Tans plots are presented in Figures 3A, B and suggest watershed-source inorganic carbon δ13C values of −22.3 and −2.6‰, respectively, for the forested and MTR-impacted streams.
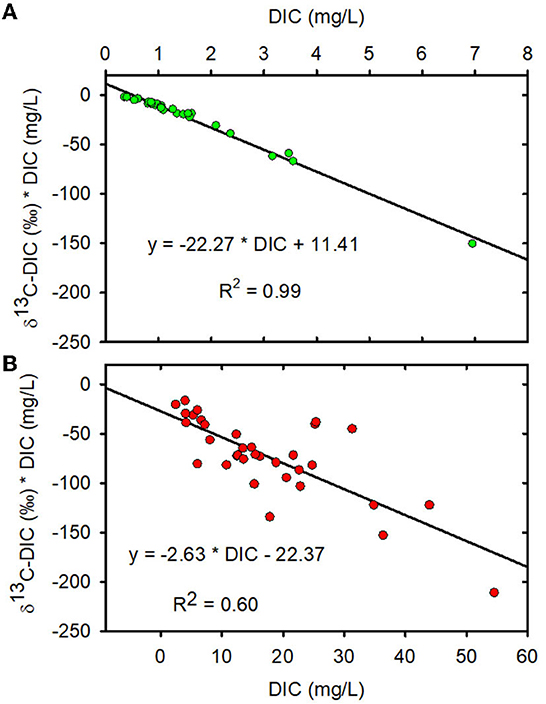
Figure 3. (A) Miller-Tans plot for forested watersheds. (B) Miller-Tans plots for mined watersheds. Forested watersheds — , MTR watersheds — .
When data from all sampling dates were combined, the mean DOC stable carbon isotopic composition (δ13C-DOC) in the MTR-impacted streams was greater than the mean in the forested streams (Table 1, Figure 4B, Supplementary Table 6).
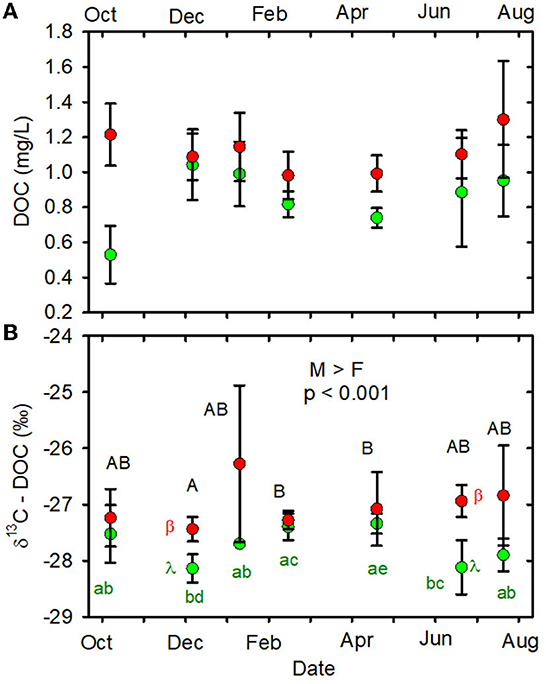
Figure 4. (A) DOC (mg/L) vs. date. (B): δ13C-DOC (%) vs date. Statistical differences indicated as in Figure 2. Forested watersheds — , MTR watersheds — .
The mean nitrate concentration in the MTR-impacted streams was almost 10 times higher than in the forested streams (Table 1, Figure 5A, Supplementary Table 7). Mean nitrate concentrations were higher in the MTR-impacted streams than in the forested streams on every date and there were no significant seasonal variations (Table 1, Figure 5A). Nitrate concentrations were much less variable in the forested streams than in the MTR-impacted streams (Figure 5A).
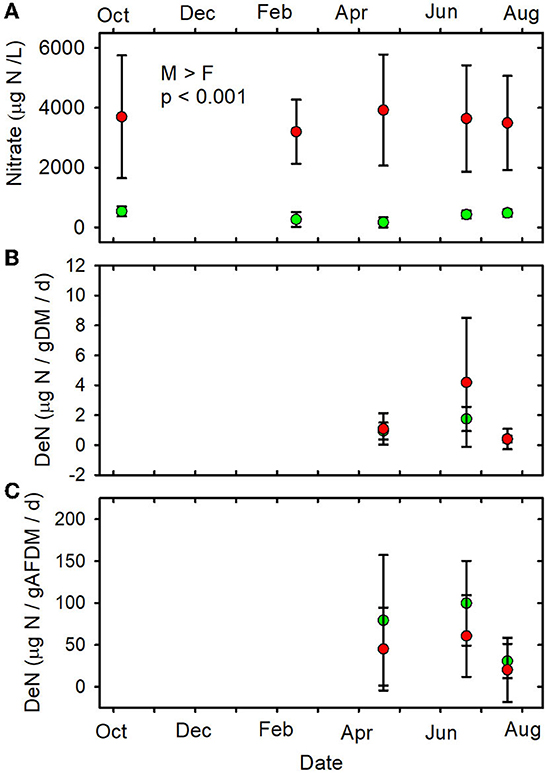
Figure 5. (A) Nitrate concentrations vs. date. (B) DeN/gDM vs. date. (C) DeN/gAFDM vs. date. Statistical differences indicated as in Figure 2. Forested watersheds — , MTR watersheds — .
AFDMf values were considerably higher than AFDM2 values suggesting that the swirl-decantation technique (FDA and DHA) preferentially removed an organic-rich sediment fraction from the 2 mm-sieved sediment (Table 1, Supplementary Table 8). Mean AFDM2-DEA was very similar to mean AFDM2-SOD in both forested and MTR-impacted streams (Table 1). Both AFDM2-DEA and AFDM2-SOD means were greater in the MTR-impacted streams than in the forested streams when data from all sampling dates were combined (Table 1).
When data from all sampling dates were combined, mean DOC concentration (Figure 4A), mean pCO2 (Supplementary Table 7), and mean AFDMf (Supplementary Table 8) were not different between MTR-impacted and forested streams (Table 1). The pCO2 of all but two of our samples (Supplementary Table 7) exceed the mean 2008 atmospheric pCO2 of 385 μatm (Lan et al., 2022) indicating that these streams are generally expected to degas CO2 to the atmosphere. The pH values of the two samples from Sugarcamp with sub-atmospheric levels of CO2 were high enough (8.8 and 8.9; Supplementary Table 4) to shift the carbonate equilibria away from CO2 toward and (Zeebe et al., 1999). The results of the degassing simulation are presented in Figures 6A, B.
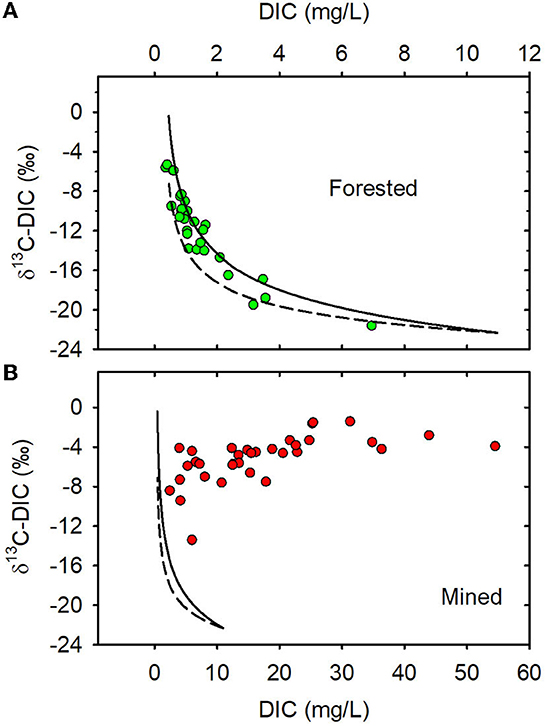
Figure 6. (A) Degassing simulation for forested watersheds. (B) Degassing simulation for mined watersheds. Solid line is 3.5% isotopic fractionation and dashed line is for 2% isotopic fractionation. Forested watersheds — , MTR watersheds — .
Five of the eight structural parameters measured were detectably different between MTR-impacted and forested streams. Means for these five structural parameters were greater in the MTR-impacted streams than in the forested streams across all sampling dates. This difference (MTR > forested) was more consistently observed on individual sampling dates for δ13C-DIC (5 dates) and nitrate (5 dates) than for δ13C-DOC (2 dates), DIC concentration (1 date), or AFDM2 (no dates; Supplementary Table 5).
Functional measures
When data from all sampling dates were combined, mean SOD/gAFDM2 (Figure 7B, Supplementary Table 9), mean FDA/gDM (Figure 8A, Supplementary Table 10) and mean FDA/gAFDMf (Figure 8B, Supplementary Table 10) were greater in the forested streams than in the MTR-impacted streams (Table 2).
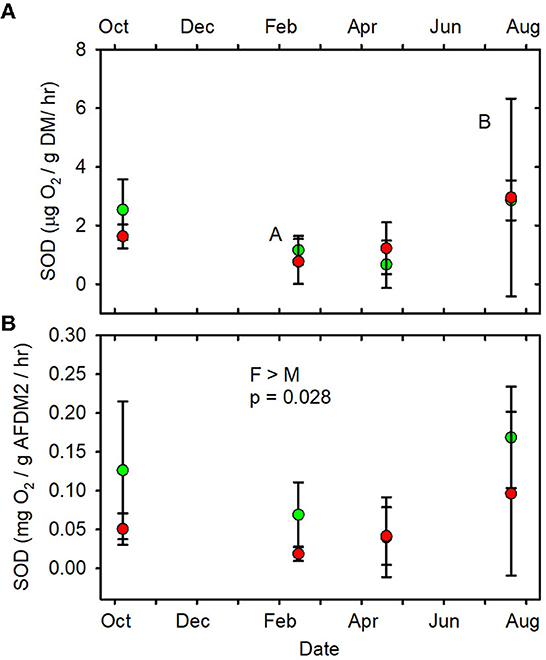
Figure 7. (A) SOD/gDM/hr vs. date. (B) SOD/gAFDM2/hr vs. date. Statistical differences indicated as in Figure 2. Forested watersheds — , MTR watersheds — .
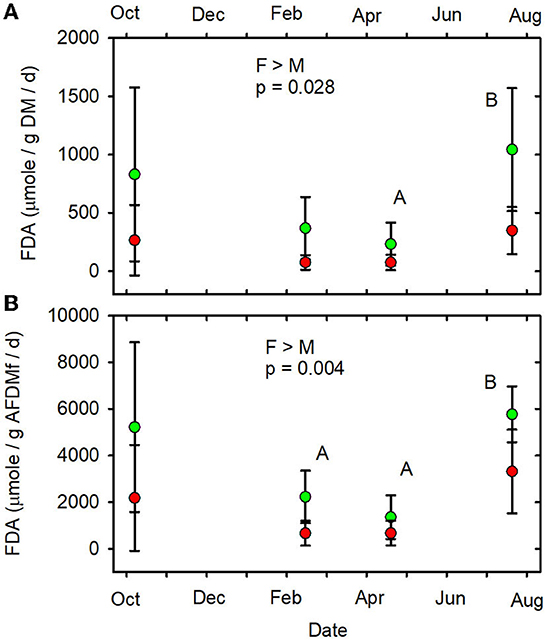
Figure 8. (A) FDA/gDM/d vs. date. (B) FDA/gAFDMf/d vs. date. Statistical differences indicated as in Figure 2. Forested watersheds — , MTR watersheds — .
None of the other functional indictors differed between the forested and MTR-impacted streams across all sampling dates, although there were significant time differences and BfFDA exhibited a significant land use * time interaction (Supplementary Table 5). When data from all sampling sites were combined, summer-fall (June, July, October) mean values of SOD/gDM (Figure 7A), FDA/gDM (Figure 8A), FDA/gAFDM (Figure 8B), DHA/gDM (Figure 9A), DHA/gAFDM (Figure 9B), BfOD (Figure 10A) BfFDA (Figure 10B), and BfDHA (Figure 11A) were higher than values in winter-spring (December–April; Supplementary Table 5) suggesting these biological processes were stimulated by higher temperatures. Significant linear correlations between temperature and many of these functional parameters (Supplementary Table 15) further suggest that temperature is an important control of many of these parameters. SOD/gAFDM2 was the only functional variable which exhibited a significant negative linear correlation with conductivity after Ln-transformation of both variables (Supplementary Table 15). BfChla (Figure 11B, Supplementary Table 14), on the other hand was higher in spring than in summer-fall, apparently reflecting stimulation by higher light levels. In contrast, none of the denitrification parameters, DeN/gDM (Figure 5B), DeN/gAFDM2 (Figure 5C), DEA/gDM (Figure 12A), and DEA/gAFDM (Figure 12B) exhibited any time or land use * time interactions. Many of the sediment functional indicator values were notably depressed in the Lost samples which may partly reflect the high percentage of barren land use and low RCE scores in the Lost watershed (Supplementary Table 2).
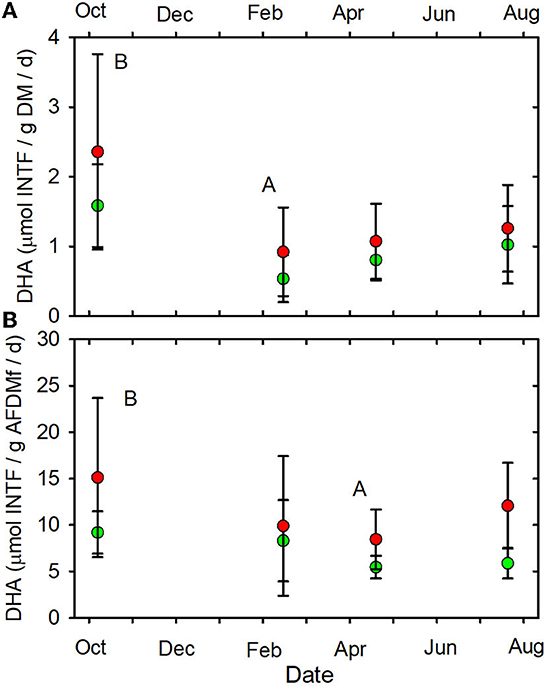
Figure 9. (A) DHA/gDM/d vs. date. (B) DHA/gAFDMf/d vs. date. Letters indicating statistical differences indicated as in Figure 2. Forested watersheds — , MTR watersheds — .
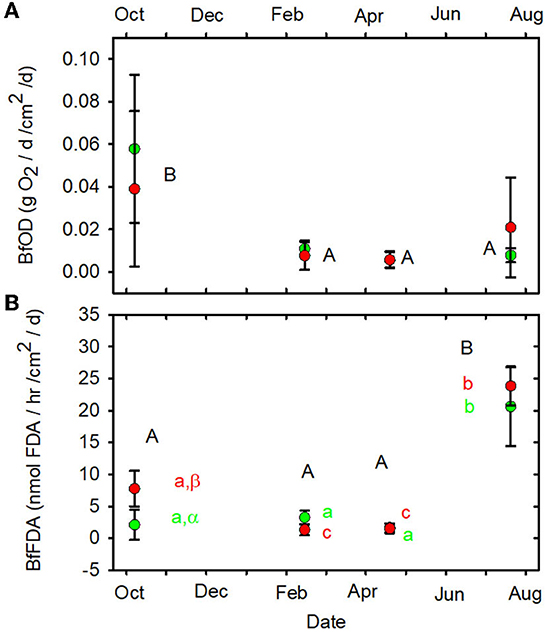
Figure 10. (A) BfOD vs. date. (B) BfFDA vs. date. Statistical differences indicated as in Figure 2. Forested watersheds — , MTR watersheds — .
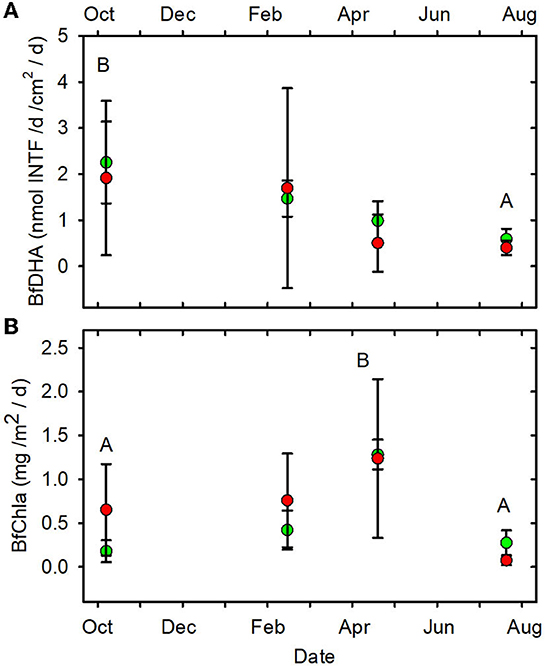
Figure 11. (A) BfDHA vs. date. (B) BfChla vs. date. Statistical differences indicated as in Figure 2. Forested watersheds — , MTR watersheds — .
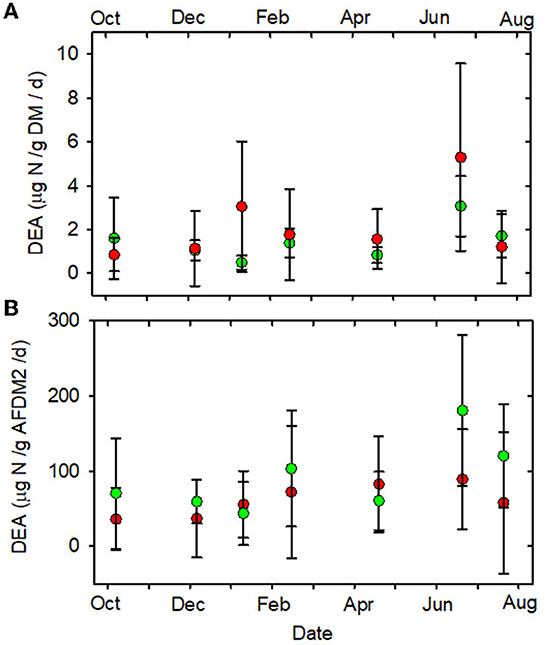
Figure 12. (A) DEA/gDM/d vs. date. (B) DEA/gAFDM2/d vs. date. Statistical differences the same as in Figure 2. Forested watersheds — , MTR watersheds — .
Only SOD/gAFDM2, FDA/gDM, and FDA/gAFDMf of the fourteen functional parameters measured had significant responses to MTR coal mining. The means across all sampling dates were greater in the forested streams than in the MTR-impacted streams for these three functional parameters. No significant responses to MTR coal mining were observed for these three functional parameters on any of the individual sampling dates (Figures 7B, 8A, B). All results presented in this paper are reported in the Supplementary material.
Discussion
In support of Odum's hypothesis that functional properties are more resistant to stress induced change than structural properties (Odum, 1985), we found a much higher proportion of structural than functional indicators that differed between MTR-impacted and forested streams. Structural indicator values were higher in the MTR-impacted streams than in the forested streams, which in each case likely reflected source changes or augmentation induced by mining. Further, there were many individual sampling dates in which the MTR value was higher than the forested value for the structural indicators that were significantly higher when all sample dates were combined. In contrast, there were no dates in which the forested values were higher than the MTR values for the functional indicators that showed a significant land use response when all dates were combined. This suggests that the significant structural indicators responded to land use in a more predictable manner than did the significant functional parameters.
High weathering rates resulting from MTR mining cause oxidation of reduced sulfur (e.g., pyrite) to sulfuric acid which then reacts with 13C-rich carbonates (δ13C ~0 ± 3‰) to produce large quantities of 13C-rich DIC which dominate DIC inputs to MTR-impacted streams (Sharma et al., 2013; Vengosh et al., 2013). The δ13C-DIC values in the MTR-impacted streams reported here mostly fall within the range of previous measurements (−7–0‰) in streams draining MTR-impacted watersheds (Vengosh et al., 2013; Burke et al., 2014).
On the other hand, soil respiration is likely the dominant source of stream DIC in these forested watersheds (Campeau et al., 2017). Soil CO2 levels in forested Appalachian soils were found to exhibit seasonal variation, with near atmospheric levels in winter and up to 10,000–27,000 μatm (25–70 times atmospheric levels) during summer (Rightmire, 1978; Castelle and Galloway, 1990; Jones and Mulholland, 1998). The δ13C of DIC entering forested streams is mostly controlled by the δ13C of watershed plant materials (−30 to −27‰; Garten and Taylor, 1992), fractionation due to organic matter decomposition (~1.5‰; Acton et al., 2011) and diffusion of CO2 from the soil (~4‰; Cerling et al., 1991). After these fractionations, δ13C-CO2 values between about −26 and −21.5‰ (mean of −23.8‰) from root respiration and organic matter decomposition are expected in the forested soils. The δ13C of CO2 in forested Virginia soils was also found to vary seasonally, ranging from −9.6‰ in winter to −21.5‰ in summer (Rightmire, 1978). Miller-Tans plots of our data suggest that the mean δ13C of DIC contributing to these forested streams is −22.3 ± 1‰ (Figure 3A) and that the δ13C of DIC input to the MTR-impacted streams is −2.6 ± 0.8‰ (Figure 3B). These values fall within the range of values predicted above using information from the literature and reinforce the interpretation that MTR coal mining causes a fundamental change in stream DIC source from soil respiration in the forested watersheds to carbonate dissolution in the mined watersheds. Accompanying this source change is a significant change in both DIC concentration and δ13C-DIC making these effective indicators of MTR coal mining in these and other MTR-impacted headwater streams.
Several processes such as CO2 degassing to the atmosphere, photosynthesis, and in-stream production, both biological and photochemical, can impact stream DIC concentration and δ13C-DIC and explain differences between predicted source values and those observed in the stream (Campeau et al., 2017). The generally elevated pCO2 values (Supplementary Table 7) and inverse relationship between DIC concentration and δ13C-DIC that we observed in the forested streams (Figure 3A) are consistent with degassing as an important controller of δ13C-DIC (Doctor et al., 2008). We performed degassing simulations to assess the possible influence of degassing on DIC concentration and δ13C. The field data from the forested watersheds largely fits within the two simulation curves (Figure 6A), suggesting that variations in DIC concentration and stable carbon isotopic composition in these watersheds are primarily controlled by evasion of CO2 from the streams to the atmosphere (Venkiteswaran et al., 2014; Campeau et al., 2017) and that associated carbon isotopic fractionation is in the 2–3.5‰ range. In contrast, the shape of the plot of DIC vs. δ13C-DIC for the MTR-impacted streams bears no resemblance to the degassing simulation curves (Figure 6B), suggesting that degassing is not a significant control of DIC concentration and δ13C-DIC in those streams. The elevated pCO2 values we observed in the MTR-impacted streams suggests that substantial CO2 evasion occurs in those streams; however, acid dissolution of exposed carbonates appears to be a far more important control of DIC concentration and δ13C-DIC than degassing in the MTR-impacted streams. Alteration of δ13C-DIC by degassing can eventually cause DIC in forested streams to have a δ13C within the range of values observed in the MTR-impacted streams, thus rendering δ13C-DIC an ineffective indicator of mining influence at advanced stages of degassing. The forested stream samples at an advanced stage of degassing had much lower DIC concentrations than any observed in the MTR-impacted streams, however, so DIC concentration would still be an effective indicator of mining influence (Figures 6A, B).
Groundwater/soil water has been shown to account for about 60% of yearly stream DOC inputs in several southern Appalachian forested watersheds (Meyer and Tate, 1983; Qualls et al., 2002). Instream DOC production from organic matter stored in the stream channel accounts for about 30% of yearly DOC inputs (Meyer et al., 1998). Stream DOC concentrations observed in the present study are very similar to those reported for southern Appalachian mixed hardwood forested watersheds with similar soils and vegetation (Meyer and Tate, 1983; Qualls et al., 2002), suggesting a similarity in stream DOC controls. The δ13C of DOC in soil water is generally within ± 2‰ of the δ13C of the associated soil organic matter (Amiotte-suchet et al., 2007). Assuming the δ13C of soil organic matter in these forested watershed soils ranges from −27 to −25.5‰ (Acton et al., 2011), we would expect soil water δ13C-DOC to range from −29 to −23.5‰. This easily encompasses the range of forested stream δ13C-DOC values we observed (Figure 4B, Supplementary Table 6) and further suggests the importance of soil water as a source of DOC to these streams. Forested stream δ13C-DOC values observed in the present study are also consistent with published values of instream and throughfall sources, falling within the range of C3 vegetation δ13C, −30 to −27‰ (Garten and Taylor, 1992; Garten et al., 2000).
Two lines of evidence suggest that GOM might be contributing appreciable DOC to the MTR-impacted streams. Acton et al. (2011) reported a mean δ13C of −24.7‰ for GOM input to the surface soils of Central Appalachian (Kentucky) watersheds impacted by MTR mining. This δ13C of the Kentucky GOM is near the middle of the δ13C range of coals (−27 to −22‰; Whiticar, 1996) and nearly identical to the average value (−24.8‰) for Mississippian and Pennsylvanian Type III kerogen reported by Kotarba et al. (2014). Assuming a δ13C-GOM of −24.7‰ and that little carbon isotopic fractionation is associated with the solubilization of GOM to DOC, the higher stream δ13C-DOC values observed in the MTR-impacted streams (Table 1) suggest the input of geogenic organic carbon (GOC) to the stream DOC pool. Using a δ13C-GOC value of −24.7‰, a range of assumed δ13C-DOC derived from the present forested stream data, and a simple isotopic mass balance model we calculate that GOC would have to comprise from 15 to 32% of the carbon input to the MTR-impacted streams to account for their higher δ13C-DOC values (Supplementary Table 16).
Meyer and Tate (1983) reported that DOC exports from a watershed that had been clear-cut 2 years previously were only about 70% of DOC exports from an undisturbed southern Appalachian forested watershed, due presumably to reduced litter inputs to clear-cut watershed soils. Because MTR mining includes clear-cutting, lower stream DOC concentrations might be expected due to reduced inputs from watershed terrestrial vegetation. Using our discharge and DOC concentration measurements, we calculate that, on average, ~2.7 and 3.2 kg/ha of DOC were transported from the forested and MTR-impacted watersheds, respectively, over the 220-day period for which these measurements are available (Supplementary Table 17). Assuming a 70% reduction of DOC exports from the watershed due to the clear-cut, we calculate that some other source is needed to provide 41% of the DOC (1.3 kg/ha) exported in the MTR-impacted streams (Supplementary Table 17). Along a 14-year reclamation chronosequence of southern Appalachian MTR-impacted soils, GOC dominated the soil organic carbon pool in the upper 50 cm and accounted for 45–99% of the total carbon (Acton et al., 2011), which we calculate amounts to 75–281 Mg GOC/ha. Laboratory extractions with water ranging from <1 day to a week found that about 0.003–1% of the carbon was leached from coal into solution (Fendinger et al., 1989; Orem et al., 1999). The above leaching and carbon pool estimates suggest that about 2–2,810 kg C/ha from leaching of GOC could be available from the upper 50 cm of the soil to potentially make up for the presumed vegetation carbon shortfall in the MTR-impacted watersheds for 1–1,400 years. Leaching of GOM deeper in the valley fills, which typically range from 10 to >100 m in depth (Ross et al., 2016), might provide additional DOC inputs to MTR-impacted streams. These two approaches, isotope mass balance and DOC transport calculations, suggest that GOC could be contributing up to 30–40% of the DOC in the MTR-impacted streams. In support of our contention that GOM plays an important role in the stream C cycle, Fox (2009) estimated that GOM accounted for ~40% of the sediment organic matter load transported by Kentucky streams impacted by MTR mining. Further, transport of GOM particles from MTR-impacted watersheds may contribute to the greater AFDM2 observed in MTR-impacted streams compared to forested streams (Table 1). Slower breakdown of leaf litter in MTR-impacted streams compared to forested streams (Maxwell, 2009; Fritz et al., 2010) would also favor higher AFDM2 levels in mining-impacted streams.
Atmospheric deposition is the dominant, and usually the only, source of reactive N to remote Northeastern forests, which generally leads to relatively low stream nitrate concentrations (Driscoll et al., 2003). Sources of N that likely contribute to the greatly elevated nitrate levels in MTR-impacted streams include N-rich explosives used during the blasting phase, fertilizer used during reclamation, atmospheric deposition in conjunction with reduced plant uptake due to the forest removal stage of MTR, and release of N by the enhanced rock weathering associated with MTR coal mining (Brooks et al., 2019). Although nitrate concentrations are often highly elevated in MTR-impacted streams compared to forested streams, they tend to decline with time since mining to values closer to those of forested streams (Brooks et al., 2019), thus reducing the effectiveness of nitrate concentration as an indicator of MTR mining. Stable N isotope ratios of organisms and organic matter pools have also suggested an alteration in N source or processing as a result of MTR mining (Daniel et al., 2015).
The lack of response to MTR coal mining of most of the functional indicators measured here may be due to the largely intact riparian zones and channel storage (Wondzell and Ward, 2022) which may contribute enough leaf litter to maintain a significant detritus base in the streams, and thus enhance functional stability (Odum, 1969). It was recently reported that in streams with an intact riparian zone, structural, and functional indicators were little affected by forestry disturbance elsewhere in the catchment (Truchy et al., 2022). Our observations are in accord with a previous study in which functional genes associated with microbial metabolism of carbon, nitrogen, sulfur, and selenium were used to evaluate the impact of MTR-mining in a nearby West Virginia watershed (Bier et al., 2020). Less than 10% of the functional genes measured were impacted, some positively due to resource subsidies associated with MTR-mining (e.g., nitrate and sulfate) and some negatively due to carbon limitation and increases in conductivity and metals (Bier et al., 2020).
The counterbalancing of resource subsidies with stressors associated with MTR coal mining (Bier et al., 2020) could also contribute to the unresponsiveness of the functional indicators measured here. On the one hand, sulfate (Pond et al., 2008; Fritz et al., 2010; Ross et al., 2018) and nitrate (Table 1, Figure 5A, Brooks et al., 2019) concentrations are often much higher (7–140 times for sulfate and up to ten times for nitrate) in MTR-impacted streams than in forested streams and may stimulate certain microbial processes. For example, DHA was shown to increase with addition of the electron acceptor sulfate to estuarine sediments (Ho and Liu, 2010) and denitrification rate is positively related to nitrate concentration when an adequate carbon source is available (Seitzinger et al., 2006).
On the other hand, elevated conductivity, which is commonly observed in MTR-impacted streams (Lindberg et al., 2011; Griffith et al., 2012), can depress ecosystem functions. In the present study, conductivity ranged from 49 to 2,513 μS/cm (Supplementary Table 4) and the mean of the MTR-impacted streams (1630 μS/cm) was over 30 times greater than the forested streams' mean of 52 μS/cm (Johnson et al., 2013). Denitrification rate in saline wetland soils was negatively related to conductivity (negative exponential function) across a conductivity gradient of 2,000–13,000 μS/cm (Yu et al., 2012). Nitrate reductase, a key enzyme in the denitrification process, was negatively correlated with conductivity across a gradient of 457–1,313 μS/cm in stream and river sediments impacted by wastewater treatment plant effluents (Unda-Calvo et al., 2019). Several indices of microbial activity, including FDA and the activities of the extracellular enzymes β-glucosidase, alkaline phosphatase and arylsulfatase were negatively related (negative exponential function) to electrical conductivity over a range of 450–24,000 μS/cm in sugarcane soils (Rietz and Haynes, 2003). DHA, soil respiration, and the activities of several hydrolases were negatively related to electrical conductivity over a range of 140–2,860 μS/cm in arid Mediterranean soils (García et al., 1994). Microorganism-mediated leaf litter breakdown was inversely correlated both to dryland-induced salinity (50–11,000 μS/cm) and coal mining- induced salinity (100–2,400 μS/cm) in stream sediments (Sauer et al., 2016). Metals, which are also often elevated in conjunction with conductivity in MTR-impacted streams (Fritz et al., 2010; Bier et al., 2020), can also depress microbial activity indicators measured here (Hill et al., 1997; Baeseman et al., 2006; Jaiswal and Pandey, 2018).
The complex and heterogeneous chemical composition and overall physical inaccessibility of coal render it difficult to degrade although there are numerous reports of limited biodegradability. Biodegradation of coal by bacteria or fungi includes solubilization, depolymerization, use as a substrate, and methane production (Saha and Sarkar, 2019). Only 1 to 10% by weight of coal was biodegraded during laboratory incubations using various microbial groups and lasting from 14 to 60 days (Laborda et al., 1997; Machnikowska et al., 2002; Fallgren et al., 2013). These results suggest that geogenic organic matter is recalcitrant and, along with elevated conductivity and metals, could also counterbalance the resource subsidies and/or depress or limit microbial process rates if it contributes significantly to the sediment organic matter or DOC pool, which our measurements and calculations suggest it does.
Of the fourteen functional indicators measured, only three—FDA/gDM, FDA/gAFDMf, and SOD/gAFDM2—were detectably different between forested and MTR-impacted streams. The forested stream values were higher in all three cases. The FDA assay provides an estimate of total microbial hydrolytic enzyme activity by bacteria and fungi (Adam and Duncan, 2001) and hydrolytic enzymes are of major importance in leaf litter degradation (Krishna and Mohan, 2017). Leaf breakdown is more rapid in these West Virginian (Maxwell, 2009) and Kentucky (Fritz et al., 2010) forested streams than in corresponding MTR-impacted streams. Leaf litter breakdown in streams is largely mediated by detritivores, fungi, and bacteria (Marks, 2019). Leaf pack shredder density and diversity were higher in these forested streams than in the corresponding MTR-impacted streams, but shredder density was not related to leaf breakdown rate (Maxwell, 2009). Further, fungal biomass accumulation in leaf packs did not differ between these forested and MTR-impacted streams (Maxwell, 2009). It thus appears that shredder density and fungal biomass differences were not the primary drivers of the observed differences in leaf litter breakdown and FDA between these forested and MTR-impacted streams. Rather, it appears that differences in bacterial activity, and possibly shredder diversity were more responsible for the observed differences in leaf litter breakdown and FDA. The observed difference in SOD/gAFDM2 may be partly due to much higher amounts of geogenic organic matter in the MTR-impacted stream sediments (i.e., division of SOD by a larger number) compared to the forested streams. Expressed on a g DM basis, SOD did not differ between forested and MTR-impacted streams (Table 2, Figure 7A). The MTR vs. forested differences in the FDA and SOD parameters likely reflect that (1) the sediment organic matter in the forested streams is more biologically available than that in the MTR-impacted streams and/or (2) stressors associated with MTR coal mining inhibited microbial process rates more than resource subsidies increased them.
The sediment microbial process rate indicators generally exhibit significant time effects with higher values at the higher temperatures (Supplementary Tables 4, 5) observed during fall (16.4–22.4°C) and summer (13.9–25.4°C) as compared to the winter (3.7–8.5°C) and spring (8.5–12.7°C) values in accord with the known influence of temperature on microbial processes. Partial temperature control of these parameters is further demonstrated by the observed significant linear correlations of several of these parameters with temperature (Supplementary Table 15). Hill et al. (2000) also observed a significant linear correlation between SOD/gAFDM and temperature for first- to third-order streams sampled during spring-summer in the Central Appalachians. The biofilm production parameters are less consistently related to temperature and are likely responding to other factors such as hydrodynamics, carbon and nutrient availability, and light (Battin et al., 2016). There is substantial variation in the land use (forest or barren) and riparian zone condition (RCE scores) of the MTR-impacted streams (Supplementary Table 2), and this may partially account for the relatively higher variability in DIC and nitrate concentrations observed in the MTR-impacted streams compared to the forested streams. The barren land use is particularly high and the RCE scores are very low in the Lost watershed, and this may help explain the much lower functional indicator values observed in Lost compared to the other MTR-impacted streams.
Despite the substantial watershed disturbance and change in physicochemical water quality, and the likely reduction in organic matter bioavailability due to inputs of geogenic carbon associated with MTR coal mining, we did not observe significant impacts on most of the microbial process rate indicators measured in this study. Reasons for the muted response of these functional indicators likely include: (1) the continued detritus-base in the MTR-impacted streams due to the largely intact riparian zones and/or channel storage; (2) the diversity of the microbial community which contains stress-tolerant members able to carry out the functions while exposed to MTR coal mining stressors such as elevated conductivity and metals; and (3) negative impacts from MTR coal mining are counterbalanced by associated resource subsidies such as elevated nitrate and sulfate. The short sampling period and small sample sizes of this study, as well as the high variability of many of our functional parameters and the fact that our forested sites have also been subjected to disturbance (Feio et al., 2010), may have also limited our ability to detect functional indicator responses to MTR mining. The link between MTR mining and the structural indicators appears to be simpler, a change in or augmentation of the source(s) of the C, N, and organic matter indicators. These results largely support Odum's hypotheses that: (1) a mature detritus base confers functional stability to a system; and (2) functional properties are more resistant to stress induced change than structural properties. The ideal indicator would show treatment differences on all sampling dates; under this criterion δ13C-DIC and nitrate concentration were the most effective indicators in the present study. The other structural indicators and all functional indicators exhibited fewer or no treatment differences on the individual sampling dates. These inefficient indicators would need to be sampled more times to potentially detect a treatment difference. Our results illustrate the difficulty of identifying effective functional indicators for evaluating the ecological integrity of stressed stream ecosystems.
Data availability statement
The datasets presented in this study can be found in the Supplementary material and at https://doi.org/10.23719/1528387.
Author contributions
RB was primarily responsible for data analysis and manuscript preparation with assistance from KF, BJ, and RP. RP, KF, and BJ were primarily responsible for field and laboratory measurements with assistance from RB. All authors approved the submitted version.
Acknowledgments
We thank Maggie Passmore, Greg Pond, Frank Borsuk, and Danielle Tilman for field support, Ellen D'Amico for GIS support and Massey and Fola/Amvest Coal for access to the study sites.
Conflict of interest
All authors were employed by USEPA and CEMM at the time the study was conducted. RP is currently employed by the Federal Energy Regulatory Commission. Mention of trade names or commercial products does not constitute endorsement or recommendation for use by the USEPA.
Publisher's note
All claims expressed in this article are solely those of the authors and do not necessarily represent those of their affiliated organizations, or those of the publisher, the editors and the reviewers. Any product that may be evaluated in this article, or claim that may be made by its manufacturer, is not guaranteed or endorsed by the publisher.
Author disclaimer
The views expressed in this article are those of the authors and do not necessarily represent the views or policies of the U.S Environmental Protection Agency.
Supplementary material
The Supplementary Material for this article can be found online at: https://www.frontiersin.org/articles/10.3389/frwa.2022.988061/full#supplementary-material
References
Acton, P. M., Fox, J. F., Campbell, J. E., Jones, A. L., Rowe, H., Martin, D., et al. (2011). Role of soil health in maintaining environmental sustainability of surface coal mining. Environ. Sci. Technol. 45, 10265–10272. doi: 10.1021/es202764q
Adam, G., and Duncan, H. (2001). Development of a sensitive and rapid method for the measurement of total microbial activity using fluorescein diacetate (FDA) in a range of soils. Soil Biol. Biochem. 33, 943–951. doi: 10.1016/S0038-0717(00)00244-3
Allan, J. D. (2004). Landscapes and riverscapes: the influence of land use on stream ecosystems. Annu. Rev. Ecol. Evol. Syst. 35, 257–284. doi: 10.1146/annurev.ecolsys.35.120202.110122
Ambus, P. (1993). Control of denitrification enzyme activity in a streamside soil. FEMS Microbiol. Ecol. 11, 225–234. doi: 10.1111/j.1574-6968.1993.tb05814.x
Amiotte-suchet, P., Linglois, N., Leveque, J., and Andreux, F. (2007). 13C composition of dissolved organic carbon in upland forested catchments of the Morvan Mountains (France): influence of coniferous and deciduous vegetation. J. Hydrol. 335, 354–363. doi: 10.1016/j.jhydrol.2006.12.002
Anderson, D. R., Burnham, K. P., and Thompson, W. L. (2000). Null hypothesis testing: problems, prevalence, and an alternative. J. Wildl. Manage. 64, 912–923. doi: 10.2307/3803199
Baeseman, J. L., Smith, R. L., and Silverstein, J. (2006). Denitrification potential in stream sediments impacted by acid mine drainage: effects of ph, various electron donors, and iron. Microb. Ecol. 51, 232–241. doi: 10.1007/s00248-005-5155-z
Barbour, M., Gerritsen, J., Snyder, B., and Stribling, J. (1999). Rapid Bioassessment Protocols Foruse in Streams and Wadable Rivers: Periphyton, Benthic Invertebrates and Fish. Washington, DC: USEPA.
Battin, T. J., Besemer, K., Bengtsson, M. M., Romani, A. M., and Packmann, A. I. (2016). The ecology and biogeochemistry of stream biofilms. Nat. Rev. Microbiol. 14, 251–263. doi: 10.1038/nrmicro.2016.15
Bethke, C. M., Sanford, R. A., Kirk, M. F., Jin, Q., and Flynn, T. M. (2011). The thermodynamic ladder in geomicrobiology. Am. J. Sci. 311, 183–210. doi: 10.2475/03.2011.01
Bier, R. L., Voss, K. A., and Bernhardt, E. S. (2015). Bacterial community responses to a gradient of alkaline mountaintop mine drainage in Central appalachian streams. ISME J. 9, 1378–1390. doi: 10.1038/ismej.2014.222
Bier, R. L., Wernegreen, J. J., Vilgalys, R. J., Ellis, J. C., and Bernhardt, E. S. (2020). Subsidized or stressed? Shifts in freshwater benthic microbial metagenomics along a gradient of alkaline coal mine drainage. Limnol. Oceanogr. 65, S277–S292. doi: 10.1002/lno.11301
Blenkinsopp, S. A., and Lock, M. A. (1990). The measurement of electron transport system activity in river biofilms. Water Res. 24, 441–445. doi: 10.1016/0043-1354(90)90226-V
Bormann, F. H. (1985). Air pollution and forests: an ecosystem perspective. Bioscience 35, 434–441. doi: 10.2307/1310024
Bowman, G. T., and Delfino, J. J. (1980). Sediment oxygen demand techniques: a review and comparison of laboratory and in situ systems. Water Res. 14, 491–499. doi: 10.1016/0043-1354(80)90215-8
Broberg, A. (1985). A modified method for studies of electron transport system activity in freshwater sediments. Hydrobiologia 120, 181–187. doi: 10.1007/BF00032140
Brooks, A. C., Ross, M. R. V., Nippgen, F., McGlynn, B. L., and Bernhardt, E. S. (2019). Excess nitrate export in mountaintop removal coal mining watersheds. J. Geophys. Res. Biogeosci. 124, 3867–3880. doi: 10.1029/2019JG005174
Burke, R. A., Fritz, K. M., Barton, C. D., Johnson, B. R., Fulton, S., Hardy, D., et al. (2014). Impacts of mountaintop removal and valley fill coal mining on C and N processing in terrestrial soils and headwater streams. Water Air Soil Pollut. 225, 2081. doi: 10.1007/s11270-014-2081-z
Campeau, A., Wallin, M. B., Giesler, R., Löfgren, S., Mörth, C.-M., Schiff, S., et al. (2017). Multiple sources and sinks of dissolved inorganic carbon across Swedish streams, refocusing the lens of stable C isotopes. Sci. Rep. 7, 9158. doi: 10.1038/s41598-017-09049-9
Castelle, A. J., and Galloway, J. N. (1990). Carbon dioxide dynamics in acid forest soils in Shenandoah National Park, Virginia. Soil Sci. Soc. Am. J. 54, 252–257. doi: 10.2136/sssaj1990.03615995005400010040x
Cerling, T. E., Solomon, D. K., Quade, J., and Bowman, J. R. (1991). On the isotopic composition of carbon in soil carbon dioxide. Geochim. Cosmochim. Acta 55, 3403–3405. doi: 10.1016/0016-7037(91)90498-T
Crumpton, W. G., Isenhart, T. M., and Mitchell, P. D. (1992). Nitrate and organic N analyses with second-derivative spectroscopy. Limnol. Oceanogr. 37, 907–913. doi: 10.4319/lo.1992.37.4.0907
Dale, V. H., and Beyeler, S. C. (2001). Challenges in the development and use of ecological indicators. Ecol. Indic. 1, 3–10. doi: 10.1016/S1470-160X(01)00003-6
Daniel, W. M., Kaller, M. D., and Jack, J. (2015). Nitrogen stable isotopes as an alternative for assessing mountaintop removal mining's impact on headwater streams. Fundament. Appl. Limnol. 186, 193–202. doi: 10.1127/fal/2015/0712
Davies, S. P., and Jackson, S. K. (2006). The biological condition gradient: a descriptive model for interpreting change in aquatic ecosystems. Ecol. Applic. 16, 1251–1266. doi: 10.1890/1051-0761(2006)016[1251:TBCGAD]2.0.CO;2
Doctor, D. H., Kendall, C., Sebestyen, S. D., Shanley, J. B., Ohte, N., and Boyer, E. W. (2008). Carbon isotope fractionation of dissolved inorganic carbon (DIC) due to outgassing of carbon dioxide from a headwater stream. Hydrol. Process. 22, 2410–2423. doi: 10.1002/hyp.6833
Driscoll, C. T., Whitall, D., Aber, J., Boyer, E., Castro, M., Cronan, C., et al. (2003). Nitrogen pollution in the northeastern united states: sources, effects, and management options. BioScience 53, 357–374. doi: 10.1641/0006-3568(2003)053[0357:NPITNU]2.0.CO;2
Drummond, M. A., and Loveland, T. R. (2010). Land-use pressure and a transition to forest-cover loss in the Eastern United States. BioScience 60, 286–298. doi: 10.1525/bio.2010.60.4.7
Fallgren, P. H., Jin, S., Zeng, C., Ren, Z., Lu, A., and Colberg, P. J. S. (2013). Comparison of coal rank for enhanced biogenic natural gas production. Int. J. Coal Geol. 115, 92–96. doi: 10.1016/j.coal.2013.01.014
Feio, M. J., Alves, T., Boavida, M., Medeiros, A., and Graca, M. A. S. (2010). Functional indicators of stream health: a river-basin approach. Freshw. Biol. 55, 1050–1065. doi: 10.1111/j.1365-2427.2009.02332.x
Fellows, C. S., Clapcott, J. E., Udy, J. W., Bunn, S. E., Harch, B. D., Smith, M. J., et al. (2006). Benthic metabolism as an indicator of stream ecosystem health. Hydrobiologia 572, 71–87. doi: 10.1007/s10750-005-9001-6
Fendinger, N. J., Radway, J. C., Tuttle, J. H., and Means, J. C. (1989). Characterization of organic material leached from coal by simulated rainfall. Environ. Sci. Technol. 23, 170–177. doi: 10.1021/es00179a005
Feng, Y., Wang, J., Bai, Z., and Reading, L. (2019). Effects of surface coal mining and land reclamation on soil properties: a review. Earth Sci. Rev. 191, 12–25. doi: 10.1016/j.earscirev.2019.02.015
Findlay, S. (2010). Stream microbial ecology. J. North Am. Benthol. Soc. 29, 170–181. doi: 10.1899/09-023.1
Fisher, S. G., and Likens, G. E. (1973). Energy flow in bear brook, new hampshire: an integrative approach to stream ecosystem metabolism. Ecol. Monogr. 43, 421–439. doi: 10.2307/1942301
Fox, J. F. (2009). Identification of sediment sources in forested watersheds with surface coal mining disturbance using carbon and nitrogen isotopes1. J. Am. Water Resourc. Assoc. 45, 1273–1289. doi: 10.1111/j.1752-1688.2009.00365.x
Fritz, K. M., Fulton, S., Johnson, B. R., Barton, C. D., Jack, J. D., Word, D. A., et al. (2010). Structural and functional characteristics of natural and constructed channels draining a reclaimed mountaintop removal and valley fill coal mine. J. North Am. Benthol. Soc. 29, 673–689. doi: 10.1899/09-060.1
García, C., Hernández, T., and Costa, F. (1994). Microbial activity in soils under mediterranean environmental conditions. Soil Biol. Biochem. 26, 1185–1191. doi: 10.1016/0038-0717(94)90142-2
Garten, C. T., Cooper, L. W., Post, W. M. III., and Hanson, P. J. (2000). Climate controls on forest soil c isotope ratios in the southern appalachian mountains. Ecology 81, 1108–1119. doi: 10.1890/0012-9658(2000)081[1108:CCOFSC]2.0.CO;2
Garten, C. T., and Taylor, G. E. (1992). Foliar δ13C within a temperate deciduous forest: spatial, temporal, and species sources of variation. Oecologia 90, 1–7. doi: 10.1007/BF00317801
Green, V. S., Stott, D. E., and Diack, M. (2006). Assay for fluorescein diacetate hydrolytic activity: optimization for soil samples. Soil Biol. Biochem. 38, 693–701. doi: 10.1016/j.soilbio.2005.06.020
Griffith, M. B., Norton, S. B., Alexander, L. C., Pollard, A. I., and LeDuc, S. D. (2012). The effects of mountaintop mines and valley fills on the physicochemical quality of stream ecosystems in the central appalachians: a review. Sci. Total Environ. 417–418, 1–12. doi: 10.1016/j.scitotenv.2011.12.042
Groffman, P. M., Holland, E. A., Myrold, D. D., Robertson, G. P., and Zou, X. (1999). “Denitrification,” in Standard Soil Methods for Long Term Ecological Research, eds G. P. Robertson, C. S. Bledsoe, D. C. Coleman, and P. Sollins (New York, NY: Oxford Universiy Press), 272–288.
Gulis, V., Ferreira, V., and Graca, M. A. S. (2006). Stimulation of leaf litter decomposition and associated fungi and invertebrates by moderate eutrophication: implications for stream assessment. Freshw. Biol. 51, 1655–1669. doi: 10.1111/j.1365-2427.2006.01615.x
Hartman, K. J., Kaller, M. D., Howell, J. W., and Sweka, J. A. (2005). How much do valley fills influence headwater streams? Hydrobiologia 532, 91. doi: 10.1007/s10750-004-9019-1
Hill, B. H., Hall, R. K., Husby, P., Herlihy, A. T., and Dunne, M. (2000). Interregional comparisons of sediment microbial respiration in streams. Freshw. Biol. 44, 213–222. doi: 10.1046/j.1365-2427.2000.00555.x
Hill, B. H., Herlihy, A. T., and Kaufmann, P. R. (2002). Benthic microbial respiration in appalachian mountain, piedmont, and coastal plains streams of the eastern U.S.A. Freshw. Biol. 47, 185–194. doi: 10.1046/j.1365-2427.2002.00791.x
Hill, B. H., Lazorchak, J. M., McCormick, F. H., and Willingham, W. T. (1997). The effects of elevated metals on benthic community metabolism in a rocky mountain stream. Environ. Pollut. 95, 183–190. doi: 10.1016/S0269-7491(96)00123-6
Hitt, N. P., and Chambers, D. B. (2014). Temporal changes in taxonomic and functional diversity of fish assemblages downstream from mountaintop mining. Freshw. Sci. 33, 915–926. doi: 10.1086/676997
Ho, C. H., and Liu, S. M. (2010). Impact of coplanar PCBs on microbial communities in anaerobic estuarine sediments. J. Environ. Sci. Health Part B 45, 437–448. doi: 10.1080/03601231003800172
Jaeger, K. L. (2015). Reach-scale geomorphic differences between headwater streams draining mountaintop mined and unmined catchments. Geomorphology 236, 25–33. doi: 10.1016/j.geomorph.2015.02.007
Jaiswal, D., and Pandey, J. (2018). Impact of heavy metal on activity of some microbial enzymes in the riverbed sediments: ecotoxicological implications in the Ganga River (India). Ecotoxicol. Environ. Saf. 150, 104–115. doi: 10.1016/j.ecoenv.2017.12.015
Johnson, B. R., Fritz, K. M., and Price, R. (2013). Estimating benthic secondary production from aquatic insect emergence in streams affected by mountaintop removal coal mining, West Virginia, USA. Fundament. Appl. Limnol. 182, 191–204. doi: 10.1127/1863-9135/2013/0403
Jones, J. G. (1985). Microbes and microbial processes in sediments. Philo. Trans. R. Soc. Lond. Ser. A Math. Phys. Sci. 315, 3–17. doi: 10.1098/rsta.1985.0025
Jones, J. J. B., and Mulholland, P. J. (1998). Carbon dioxide variation in a hardwood forest stream: an integrative measure of whole catchment soil respiration. Ecosystems 1, 183–196. doi: 10.1007/s100219900014
Kotarba, M. J., Nagao, K., and Karnkowski, P. H. (2014). Origin of gaseous hydrocarbons, noble gases, carbon dioxide and nitrogen in carboniferous and permian strata of the distal part of the polish basin: geological and isotopic approach. Chem. Geol. 383, 164–179. doi: 10.1016/j.chemgeo.2014.06.012
Krenz, R. J., Zipper, C. E., and Schoenholtz, S. H. (2018). Periphyton structure and function in constructed headwater streams of the appalachian coalfield. Freshw. Sci. 37, 780–794. doi: 10.1086/700621
Krishna, M. P., and Mohan, M. (2017). Litter decomposition in forest ecosystems: a review. Energy Ecol. Environ. 2, 236–249. doi: 10.1007/s40974-017-0064-9
Laborda, F., Fernández, M., Luna, N., and Monistrol, I. F. (1997). Study of the mechanisms by which microorganisms solubilize and/or liquefy Spanish coals. Fuel Proc. Technol. 52, 95–107. doi: 10.1016/S0378-3820(97)00019-2
Lan, X., Tans, P. P., and Thoning, K. W. (2022). Trends in Atmospheric Carbon Dioxide. National Oceanic and Atmospheric Administration (NOAA)/Earth System Research Labortories/Global Monitoring Laboratory. Available online at: https://gml.noaa.gov/ccgg/trends/gl_data.html (accessed November 8, 2022).
Lindberg, T. T., Bernhardt, E. S., Bier, R., Helton, A. M., Merola, R. B., Vengosh, A., et al. (2011). Cumulative impacts of mountaintop mining on an appalachian watershed. Proc. Nat. Acad. Sci. U.S.A. 108, 20929–20934. doi: 10.1073/pnas.1112381108
Loken, L. C., Small, G. E., Finlay, J. C., Sterner, R. W., and Stanley, E. H. (2016). Nitrogen cycling in a freshwater estuary. Biogeochemistry 127, 199–216. doi: 10.1007/s10533-015-0175-3
Lorenzen, C. J. (1967). Determination of chlorophyll and pheo-pigments: spectrophotometric equations1. Limnol. Oceanogr. 12, 343–346. doi: 10.4319/lo.1967.12.2.0343
Machnikowska, H., Pawelec, K., and Podgórska, A. (2002). Microbial degradation of low rank coals. Fuel Proc. Technol. 77–78, 17–23. doi: 10.1016/S0378-3820(02)00064-4
Marks, J. C. (2019). Revisiting the fates of dead leaves that fall into streams. Annu. Rev. Ecol. Evol. Syst. 50, 547–568. doi: 10.1146/annurev-ecolsys-110218-024755
Maxwell, C. F. (2009). Stream Functional Response to Mountaintop Removal and Valley Fill Coal Mining. (Unpublished Master's Thesis), Virginia Polytechnic Institute and State University, Blacksburg, VA, USA.
Meyer, J. L., and Tate, C. M. (1983). The effects of watershed disturbance on dissolved organic carbon dynamics of a stream. Ecology 64, 33–44. doi: 10.2307/1937326
Meyer, J. L., Wallace, J. B., and Eggert, S. L. (1998). Leaf litter as a source of dissolved organic carbon in streams. Ecosystems 1, 240–249. doi: 10.1007/s100219900019
Miller, J. B., and Tans, P. P. (2003). Calculating isotopic fractionation from atmospheric measurements at various scales. Tellus B 55, 207–214. doi: 10.3402/tellusb.v55i2.16697
National Research Council (1996). Freshwater Ecosystems: Revitalizing Educational Programs in Limnology. Washington, DC: The National Academies Press.
Odum, E. P. (1962). Relationships between structure and function in the ecosystem. Jpn. J. Ecol. 12, 108–118.
Odum, E. P. (1969). The strategy of ecosystem development. Science 164, 262–270. doi: 10.1126/science.164.3877.262
Odum, E. P. (1985). Trends expected in stressed ecosystems. Bioscience 35, 419–422. doi: 10.2307/1310021
Orem, W. H., Feder, G. L., and Finkelman, R. B. (1999). A possible link between balkan endemic nephropathy and the leaching of toxic organic compounds from Pliocene lignite by groundwater: preliminary investigation. Int. J. Coal Geol. 40, 237–252. doi: 10.1016/S0166-5162(98)00071-8
Palmer, M. A. (1990). Temporal and spatial dynamics of meiofauna within the hyporheic zone of goose creek, Virginia. J. North Am. Benthol. Soc. 9, 17–25. doi: 10.2307/1467930
Payne, W. J. (1973). Reduction of nitrogenous oxides by microorganisms. Bacteriol. Rev. 37, 409–452. doi: 10.1128/br.37.4.409-452.1973
Peng, S. S. (2000). Mountaintop removal controversy slows West Virginia coal mining. Min. Eng. 52, 53.
Pericak, A. A., Thomas, C. J., Kroodsma, D. A., Wasson, M. F., Ross, M. R. V., Clinton, N. E., et al. (2018). Mapping the yearly extent of surface coal mining in Central Appalachia using Landsat and Google Earth Engine. PLoS ONE 13, e0197758. doi: 10.1371/journal.pone.0197758
Petersen, R. C. (1992). The RCE: a riparian, channel, and environmental inventory for small streams in the agricultural landscape. Freshw. Biol. 27, 295–306. doi: 10.1111/j.1365-2427.1992.tb00541.x
Pond, G. J., Passmore, M. E., Borsuk, F. A., Reynolds, L., and Rose, C. J. (2008). Downstream effects of mountaintop coal mining: comparing biological conditions using family- and genus-level macroinvertebrate bioassessment tools. J. North Am. Benthol. Soc. 27, 717–737. doi: 10.1899/08-015.1
Qualls, R. G., Haines, B. L., Swank, W. T., and Tyler, S. W. (2002). Retention of soluble organic nutrients by a forested ecosystem. Biogeochemistry 61, 135–171. doi: 10.1023/A:1020239112586
Rietz, D. N., and Haynes, R. J. (2003). Effects of irrigation-induced salinity and sodicity on soil microbial activity. Soil Biol. Biochem. 35, 845–854. doi: 10.1016/S0038-0717(03)00125-1
Rightmire, C. T. (1978). Seasonal variation in PCO2 and 13C content of soil atmosphere. Water Resour. Res. 14, 691–692. doi: 10.1029/WR014i004p00691
Roache, M. C., Bailey, P. C., and Boon, P. I. (2006). Effects of salinity on the decay of the freshwater macrophyte, Triglochin procerum. Aquat. Bot. 84, 45–52. doi: 10.1016/j.aquabot.2005.07.014
Robbins, L. L., Hansen, M. E., Kleypas, J. A., and Meylan, S. C. (2010). CO2calc: A User-Friendly Seawater Carbon Calculator for Windows, Mac OS X, and iOS (iPhone). Reston, VA. doi: 10.3133/ofr20101280
Ross, M. R. V., McGlynn, B. L., and Bernhardt, E. S. (2016). Deep impact: effects of mountaintop mining on surface topography, bedrock structure, and downstream waters. Environ. Sci. Technol. 50, 2064–2074. doi: 10.1021/acs.est.5b04532
Ross, M. R. V., Nippgen, F., Hassett, B. A., McGlynn, B. L., and Bernhardt, E. S. (2018). Pyrite oxidation drives exceptionally high weathering rates and geologic CO2 release in mountaintop-mined landscapes. Glob. Biogeochem. Cycles 32, 1182–1194. doi: 10.1029/2017GB005798
Saha, P., and Sarkar, S. (2019). Microbial degradation of coal into a value added product. Int. J. Coal Preparat. Utilizat. 39, 1–19. doi: 10.1080/19392699.2018.1448800
Sartory, D. P., and Grobbelaar, J. U. (1984). Extraction of chlorophyll a from freshwater phytoplankton for spectrophotometric analysis. Hydrobiologia 114, 177–187. doi: 10.1007/BF00031869
Sauer, F. G., Bundschuh, M., Zubrod, J. P., Schäfer, R. B., Thompson, K., and Kefford, B. J. (2016). Effects of salinity on leaf breakdown: dryland salinity versus salinity from a coalmine. Aquat. Toxicol. 177, 425–432. doi: 10.1016/j.aquatox.2016.06.014
Seitzinger, S., Harrison, J. A., Böhlke, J. K., Bouwman, A. F., Lowrance, R., Peterson, B., et al. (2006). Denitrification across landscapes and waterscapes: a synthesis. Ecol. Applic. 16, 2064–2090. doi: 10.1890/1051-0761(2006)016[2064:DALAWA]2.0.CO;2
Sharma, S., Sack, A., Adams, J. P., Vesper, D. J., Capo, R. C., Hartsock, A., et al. (2013). Isotopic evidence of enhanced carbonate dissolution at a coal mine drainage site in Allegheny County, Pennsylvania, USA. Appl. Geochem. 29, 32–42. doi: 10.1016/j.apgeochem.2012.11.002
Tien, C.-J., Wu, W.-H., Chuang, T.-L., and Chen, C. S. (2009). Development of river biofilms on artificial substrates and their potential for biomonitoring water quality. Chemosphere 76, 1288–1295. doi: 10.1016/j.chemosphere.2009.06.013
Trevors, J. T. (1984). The measurement of electron transport system (ETS) activity in freshwater sediment. Water Res. 18, 581–584. doi: 10.1016/0043-1354(84)90207-0
Truchy, A., Sponseller, R. A., Ecke, F., Angeler, D. G., Kahlert, M., Bundschuh, M., et al. (2022). Responses of multiple structural and functional indicators along three contrasting disturbance gradients. Ecol. Indic. 135, 108514. doi: 10.1016/j.ecolind.2021.108514
U.S. Energy Information Administration (2015). Coal Production Using Mountaintop Removal Mining Decreases by 62% Since 2008. Washington, D.C.: EIA. Available online at: https://www.eia.gov/todayinenergy/detail.php?id=21952 (accessed November 12, 2019).
U.S. Energy Information Administration (2019). Annual Coal Reports. U.S. Energy Information Administration. Available online at: https://www.eia.gov/coal/annual/ (accessed November 15, 2019).
Udy, J. W., Fellows, C. S., Bartkow, M. E., Bunn, S. E., Clapcott, J. E., and Harch, B. D. (2006). Measures of nutrient processes as indicators of stream ecosystem health. Hydrobiologia 572, 89–102. doi: 10.1007/s10750-005-9006-1
Unda-Calvo, J., Martínez-Santos, M., Ruiz-Romera, E., and Lechuga-Crespo, J. L. (2019). Implications of denitrification in the ecological status of an urban river using enzymatic activities in sediments as an indicator. J. Environ. Sci. 75, 255–268. doi: 10.1016/j.jes.2018.03.037
Vander Vorste, R., Timpano, A. J., Cappellin, C., Badgley, B. D., Zipper, C. E., and Schoenholtz, S. H. (2019). Microbial and macroinvertebrate communities, but not leaf decomposition, change along a mining-induced salinity gradient. Freshw. Biol. 64, 671–684. doi: 10.1111/fwb.13253
Vengosh, A., Lindberg, T. T., Merola, B. R., Ruhl, L., Warner, N. R., White, A., et al. (2013). Isotopic imprints of mountaintop mining contaminants. Environ. Sci. Technol. 47, 10041–10048. doi: 10.1021/es4012959
Venkiteswaran, J. J., Schiff, S. L., and Wallin, M. B. (2014). Large carbon dioxide fluxes from headwater boreal and sub-boreal streams. PLoS ONE 9, e101756. doi: 10.1371/journal.pone.0101756
Voss, K. A., and Bernhardt, E. S. (2017). Effects of mountaintop removal coal mining on the diversity and secondary productivity of appalachian rivers. Limnol. Oceanogr. 62, 1754–1770. doi: 10.1002/lno.10531
Wanninkhof, R. (1985). Kinetic fractionation of the carbon isotopes 13C and 12C during transfer of CO2 from air to seawater. Tellus B 37B, 128–135. doi: 10.3402/tellusb.v37i3.15008
Whiticar, M. J. (1996). Stable isotope geochemistry of coals, humic kerogens and related natural gases. Int. J. Coal Geol. 32, 191–215. doi: 10.1016/S0166-5162(96)00042-0
Wiley, J. B., Evaldi, R. D., Eychaner, J. H., and Chambers, D. B. (2001). Reconnaissance of Stream Geomorphology, Low Streamflow, and Stream Temperature in the Mountaintop Coal-Mining Region, Southern West Virginia, 1999–2000. Charleston, WV: Water-Resources Investigations Report.
Wondzell, S. M., and Ward, A. S. (2022). The channel-source hypothesis: empirical evidence for in-channel sourcing of dissolved organic carbon to explain hysteresis in a headwater mountain stream. Hydrol. Process. 36, e14570. doi: 10.1002/hyp.14570
Young, R. G., and Collier, K. J. (2009). Contrasting responses to catchment modification among a range of functional and structural indicators of river ecosystem health. Freshw. Biol. 54, 2155–2170. doi: 10.1111/j.1365-2427.2009.02239.x
Yu, H., Song, Y., Xi, B., Du, E., He, X., and Tu, X. (2012). Denitrification potential and its correlation to physico-chemical and biological characteristics of saline wetland soils in semi-arid regions. Chemosphere 89, 1339–1346. doi: 10.1016/j.chemosphere.2012.05.088
Zeebe, R. E., Bijma, J., and Wolf-Gladrow, D. A. (1999). A diffusion-reaction model of carbon isotope fractionation in foraminifera. Mar. Chem. 64, 199–227. doi: 10.1016/S0304-4203(98)00075-9
Keywords: ecological integrity, structural indicators, functional indicators, coal mining, streams
Citation: Burke RA, Fritz KM, Johnson BR and Price R (2023) Mountaintop removal coal mining impacts on structural and functional indicators in Central Appalachian streams. Front. Water 4:988061. doi: 10.3389/frwa.2022.988061
Received: 06 July 2022; Accepted: 15 December 2022;
Published: 19 January 2023.
Edited by:
William D. Burgos, The Pennsylvania State University (PSU), United StatesReviewed by:
Zhenduo Zhu, University at Buffalo, United StatesCarl Zipper, Virginia Tech, United States
Nicolas Zegre, West Virginia University, United States
Copyright © 2023 Burke, Fritz, Johnson and Price. This is an open-access article distributed under the terms of the Creative Commons Attribution License (CC BY). The use, distribution or reproduction in other forums is permitted, provided the original author(s) and the copyright owner(s) are credited and that the original publication in this journal is cited, in accordance with accepted academic practice. No use, distribution or reproduction is permitted which does not comply with these terms.
*Correspondence: Roger A. Burke,  YnVya2Uucm9nZXJAZXBhLmdvdg==
†Present address: Rachel Price, Federal Energy Regulatory Commission, Washington, DC, United States