 Phil Jordan
 Rachel Cassidy
- 1School of Geography and Environmental Sciences, Ulster University, Coleraine, United Kingdom
- 2Agri-Environment Branch, Agri-Food and Biosciences Institute, Belfast, United Kingdom
This review considers enhanced approaches to river water quality monitoring in north-western Europe following a series of study visits (11 sites in 7 countries). Based on the evidence gathered, options were identified and evaluated for their suitability to deliver specific water quality monitoring objectives and with a focus on effecting behavioral change. Monitoring programs were diverse, ranging from enhanced grab sampling and laboratory analysis to sub-hourly sampling of multiple parameters and nutrients in autonomous high-specification, bank-side or mobile laboratories. Only one program out of all the cases evaluated could readily identify influences that had produced behavioral change among stakeholders. This was principally because the other programs were focused on top-down policy change or surveillance rather than specifically focused on influencing behavior. Nevertheless, program researchers were clear that stakeholder engagement potential was very high and that the sites acted as important focus points for discussion on water quality issues, and so part of a suite of tools that might ultimately change behavior. This identifies a space where water quality monitoring solutions could be adapted for behavioral change research.
Introduction
In a review by Westerhoff et al. (2022), water quality “state” monitoring in regulatory programs is critiqued against alternative approaches that might often be required for “impact” monitoring. This can be especially evident with short term policy reviews, or mitigation actions that act on one upstream component or pathway of a polluting system, but which is monitored in toto at the outlet of the system (Thomas et al., 2016; Reaney et al., 2019). We argue that this critique can be extended to knowledge exchange issues where monitored water quality “state” variable are difficult to sell to water resources stakeholders (Blackstock et al., 2010) due to similar issues of sample resolution and temporal scale (Davis et al., 2021).
Two extreme river water monitoring schemes are firstly considered. First the usual statutory “state” monitoring scheme where variables are measured at many sites but a low resolution—often up to 10 yr−1 for physico-chemical variables (Wolfram et al., 2021), and <1 yr−1 for biological variables (OJEC, 2000). This “space for time” solution compares with “time for space” high-temporal resolution water quality monitoring for the capture and display of instantaneous water quality (generally physico-chemical) data and on a semi-continuous basis and normally at hourly or sub-hourly scales. While the latter can be operationally built into national sampling and analysis budgets, the former is based on a higher frequency data capture to show shorter to long term patterns and trends in detail at one site and which can be replicated at other sites as budgets and objectives allow.
As high-temporal resolution water quality monitoring has developed from vision (Kirchner et al., 2004) to adoption (Rode et al., 2016) over a relatively short time-period and expanded to include many of the water quality parameters noted as pressures from catchment sources, we provide a review of this technology and its potential for use in knowledge exchange activities. More so, we ask whether use of such datasets can persuade water resources stakeholders to change behavior if their actions are suspected of contributing to water quality problems. We frame our study in north-west Europe and alongside other enhanced water quality monitoring techniques. We finally provide an “options matrix” as the basis for optimizing monitoring between “state” and impact' objectives and with behavioral change potential as an outcome of knowledge exchange.
Overview of Monitoring Techniques
High-Temporal Water Quality Monitoring Technologies
Real-time water quality monitoring is possible using a range of sensors, probes and analyzers depending on the parameters being investigated.
Turbidity (a measure of opaqueness) monitoring in water using solid-state sensors is well established (Lawler et al., 2006; Thompson et al., 2014; Sherriff et al., 2015) and, following factory or field calibration, can be used as a surrogate for suspended sediment concentration. In catchment sciences, suspended sediment concentration is a biological pressure (Strand and Merritt, 1997; Jones et al., 2012; Conroy et al., 2016) and also, when combined with water discharge data, a metric of catchment soil erosion (Webb et al., 1997; Sherriff et al., 2016). In the water utilities industries, turbidity is a key parameter used to determine the level and success of water clarity treatment processes (Storey et al., 2011; WWT Online, 2013).
Temperature and conductivity measurements in water are generally based on electrical probe (thermistor or electrode) technology (EPA Catchments Unit, 2016). Certain chemicals can also be measured in water using ion specific electrode (ISE) probes, including pH and oxidation reduction potential. Nutrient parameters such as ammonium and nitrite can be measured using ISEs and these are the technology usually incorporated into water quality sondes (Kaelin et al., 2008).
Wet chemistry analyzers for use at “bank-side” have developed in recent years and notably for nutrient analysis in catchment science research. These are generally adapted from use in the water utilities industries or water treatment industries and include analysis for phosphorus (P) fractions (Jordan et al., 2007; Wade et al., 2012), nitrogen (N) fractions (Azzaro and Galletta, 2006) and carbon (C) (Guigues et al., 2019). Other parameters include iron and manganese, for example, but are not generally applied to catchment science programs.
More recent developments, specifically with objectives for catchment science and natural process understanding, include the use of continuous isotope analysis and ion chromatography for full anion/cation analysis in riverine settings (Floury et al., 2017).
Adoption of real-time water quality sensors and analyzers, specifically for nutrient concentrations, has enabled more detailed process understanding of chemical flows in and from catchments (Arnscheidt et al., 2007a; Jordan et al., 2012; Mellander et al., 2012, 2013; Neal et al., 2012; Wade et al., 2012). Phosphorus and N are the two most common nutrient parameters chosen, singularly or in combination and depending on the pressure(s) and dominant pathways (surface/groundwater) in the catchment. In agricultural catchment research projects, wet chemistry P analyzers and solid-state N sensors are a preferred option.
Enhanced Water Quality Datasets
Real-time water quality monitoring in rivers has an emphasis on enhanced datasets beyond the statutory methods used in the UK, Ireland and the EU. While real-time monitoring provides detailed data to understand processes and the influences of potential polluting sources in catchments on a fine temporal resolution, statutory chemical monitoring is linked to biological relationships and has been the mainstay of WFD water-body monitoring since inception (UKTAG, 2013; EPA, 2018; Tappin et al., 2018). However, problems with the lower resolution approach in river systems have been highlighted due to poor relationships with storm processes that are important factors in diffuse pollution events (Arnscheidt et al., 2007b; Bowes et al., 2009; Cassidy and Jordan, 2011; Wade et al., 2012; Meyer et al., 2019).
Load is defined as the mass of material lost from any catchment expressed in, for example, kilograms or tons and often normalized to the catchment area and a time frame (e.g., kg ha−1 yr−1 or t km−2 yr−1). As mass load is greatest during storm events, and these are often quite short in duration, the low frequency statutory approach tends not to capture these periods. Generally, however, load estimates of pollutants from rivers are not a statutory requirement under WFD reporting but do provide context for assessing the net and gross contributions of pollutant sources from catchments, via rivers, to lakes, estuaries and coastal waters, which can then be assessed as trends over time (Smith, 1998). The OSPAR initiative is an example of where catchment chemical load is important (Claussen et al., 2009) but which is only loosely represented with coarse water quality datasets (O'Boyle et al., 2016). Nevertheless, other methods can provide the means to provide enhanced data that are reflective of all river hydrological conditions and can be considered a compromise between the statutory and real-time monitoring methods. Three methods are considered here.
Composite Sampling
Flow-weighted composite sampling (FWCS) approaches provide a low-resolution final dataset from the integration of high-resolution sub-sampling into composite samples. Composite sampling is a means of reducing the analysis burden by sub-sampling small volumes of water into a large container, and then sampling the container for analysis after a deployment period. Time-weighted composite sampling (TWCS) methods collect sub-samples after a set time has elapsed, which are collated in a large container and then the container is sampled and the contents analyzed after an overall deployment time. For example, small sub-sample volumes can be collected regularly every several hours and the larger container can be sampled and taken for analysis at the end of 1 or 2 weeks, etc. However, as large pollution fluxes are related to short term storm events in agricultural catchments, time-weighted sampling can bias the analysis of water in large containers toward the conditions that have the longest duration in a period of time—generally the lower discharge conditions.
Flow-weighted composite sampling methods extract a sub-sample from the river after the passage of a set volume of water. Hence, time between sub-samples is long during lower discharge conditions and then decreases to short periods of time as discharge increases during storm events. In this way, the diffuse flux of nutrients from storm events can be captured proportionately into one container and which is then analyzed. The flow-proportional method is generally considered a better option for capturing diffuse pollution that is influenced by storm runoff events and where sample analysis needs to be optimized (Stone et al., 2000; Haraldsen and Stålnacke, 2006; Ulén et al., 2019). Data are expressed as a flow-weighted mean concentration (FWMC) over the deployment period (e.g., 1 or 2 weeks) and, when multiplied by the river discharge over the same period, expressed as a flow-weighted load. As the composite sample is kept on site and accumulated over the deployment period, containers must be kept in the dark and refrigerated. Even with these procedures, the most certain parameters are based on totals such as TP, TN and total suspended sediment. Soluble P and N fractions may be more uncertain due to the opportunities for chemical transformations during the deployment period.
Nevertheless, the FWCS approach is an option where long-term data are required from dynamic river systems and where diffuse pollution load (or periodic mean flow-weighted concentration) is important. Quality control of chemical data is retained in the laboratory and technical personnel scheduling is uncomplicated for sample collection. Station set-up can be adjacent to existing river-discharge stations or co-established with standard structures that are constructed with known stage-discharge relationships. Monitoring programs in Norway (Bechmann and Deelstra, 2013; Deelstra et al., 2013) and Sweden (Kyllmar, 2009; Kyllmar et al., 2014; Sandström et al., 2020) use this technique and have been tested for annual load certainty using modeling studies with Irish high-resolution datasets (Cassidy et al., 2018). As a consideration, TWCS may be more appropriate in less dynamic and groundwater driven river systems (smaller changes between low and high-water levels or discharges over short time periods) or where monitoring is relating to drinking water quality where there is a constant abstraction rate to a treatment plant. It may also be applicable in systems such as estuaries, lakes and groundwater and where total chemical parameters are also important.
The 24/7 Sampling Approach
The FWCS approach integrates multiple sub-samples to capture high flow storm events but without an ability to show the magnitude of instantaneous data—only the mean chemical concentration (or load) over a 1 or 2-week deployment period, for example. The real-time water quality monitoring method does provide that ability and an alternative challenge would be to optimize continuous data collection to enable both a good estimate of total load over a period and also a good representation of instantaneous chemical conditions. An approach developed by researchers at the long-term Plynlimon research catchment in the Wye and Severn headwaters in mid-Wales optimized this type of sample collection using a standard 24-bottle auto-sampler (Halliday et al., 2012; Neal et al., 2012). The objective was to provide a dataset to understand atmosphere-land-water interactions and processes, but which could be incorporated into the work program of technical and laboratory personnel. Therefore, in this approach, a sample is extracted by the auto-sampler every 7 h. The 24-bottle carousel is then full on day 7 and is changed with a new carousel without interruption of the sampling program. This enables a scheduled weekly visit to the site and 24 samples delivered to the laboratory on set days. The laboratory retains chemical quality control but, similar to composite sampling approaches, the most certain chemical parameters are those based on total species due to samples being stored for up to 1 week. Refrigeration is the better option for this type of nutrient sampling and some later (in the week) samples and/or river conditions may provide some more certain soluble chemical fractions, but this would require validation.
Using high-resolution surrogate datasets in modeling studies this approach has been shown to give very certain estimates of annual TP load (Jordan and Cassidy, 2011; Halliday et al., 2012) to encapsulate patterns related to processes at low flow (point-source patterns on a diurnal basis) and provide good coverage of higher flow events (relating to diffuse pollution). The 24/7 sampling approach has been selected as the water quality monitoring method of choice for amplified monitoring in support of the Nutrients Action Programme and the evaluation of Environmental Farming Scheme (a voluntary agri-environmental scheme) effectiveness in Northern Ireland for P and N in river water (DAERA E&I 18/4/03). It is also the MCPA herbicide monitoring method for the INTERREG Va Source to Tap project on the Derg and Finn cross-border catchments (www.sourcetotap.eu) (Morton et al., 2021). This is due to good coverage of dynamic (fast low to high flow to low flow) river conditions, parsimony when compared to higher resolution data and ease of operational planning and execution between capital equipment, technical personnel commitment and laboratory analysis.
Passive Sampling
Passive sampling, similar to the principles of composite approaches, integrates river chemical conditions over deployment periods into one sample. This sample is an extract from an adsorbent held within a cartridge that is deployed in a water body for a specific period (Müller et al., 2008). The extracted sample is expressed as a mean concentration of the chemical parameter in question, over the deployment period, and can be combined with the total discharge in a river setting to express load. Passive sampler adsorbents can measure nutrients, metals, pesticides and other contaminants (Allan et al., 2008; Schäfer et al., 2008; Rozemeijer et al., 2010; O'Brien et al., 2011; Knutsson et al., 2013; Sánchez-Bayo and Hyne, 2014). The most commonly used passive samplers are time-proportional—that is to say the sampler adsorbs chemicals according to the presence and exposure of the pollutant with an assumption that this adsorbing potential remains efficient for the period of the deployment. However, the resulting TWMC of the extracted chemical may suffer the same under-prediction noted in TWCS approaches. Other workers have attempted to overcome this issue by introducing a flow-proportional method into the passive sampler design. However, extensive testing against high-resolution data in flashy Irish rivers has indicated that the flow-proportional passive samplers generally yield a concentration that is equivalent to TWMC and so under-predict the true concentration/load (Jordan et al., 2013).
Nutrient Test Kits and Synoptic Surveys
In recent years, citizen science programs have used nutrient test kits to provide spatial and temporal water quality data in small to large scale projects. The most prominent program is linked to the EarthWatch Institute's FreshWater Watch (https://freshwaterwatch.thewaterhub.org/) where testing kits for nitrate and phosphate are used by trained citizen scientists. The data produced in “WaterBlitz” activities cover wide catchment areas (Hadj-Hammou et al., 2017) and can be used to gauge scale effects such as land use/land cover differences from up to downstream areas (Cunha et al., 2019) on the day of sampling and, with the development of a temporal dataset, over different hydrological conditions. This may be an advantage over statutory methods as a more intensive spatial coverage of nutrient conditions in water can be produced to isolate stepped changes in nutrient water quality from hot spots or hot sub-catchments.
The data produced by the testing kits are based on established colorimetric methods for both nutrients (Strickland and Parsons, 1972; Lawal and Adeloju, 2013) but with a reduced incremental range and so are considered as approximates. The literature does not show any systematic comparison with other established laboratory methods. However, the Northern Ireland Environment Agency (NIEA) has undertaken limited comparisons in a work-based learning project on the River Lagan (Mitchell, 2018) and which show reasonable recovery on the samples taken.
The approach used by the FreshWater Watch initiative, showing an instantaneous bird's eye view of nutrient concentrations, is similar to other “snap shot” or “synoptic” surveying undertaken by other projects in Ireland and in the Netherlands (https://publicwiki.deltares.nl/display/wqapp/Results). The Teagasc Agricultural Catchments Programme (www.teagasc.ie/agcatchments) undertakes a monthly “synoptic” survey of all tributaries and reaches at strategic points of interest for a suite of chemical parameters related to diffuse and point source pollution in small catchments (Melland et al., 2012). The Duncannon Blue Flag Farming and Communities Scheme has collected similar synoptic data on bacterial concentrations in two coastal agricultural catchments to create spatial and local awareness of fecal pollution pressures (@DuncannonEIP; EPA, personal communication, 22/10/18). “River walks” were employed in the INTERREG IIIa BlackwaterTRACE project with many water samples extracted for nutrient analysis over several kilometers to isolate stepped changes in water quality from rural point and diffuse source pressures in Irish border stream networks (Arnscheidt et al., 2007a). These three Irish examples are based on limited sampling opportunities (and laboratory analysis) built into work programs of employed personnel. The FreshWater Watch example is based on test kits that are used by large numbers of citizen scientists and linked to a global network. It is notable that the “synoptic” view of water quality status provided by data from all these examples are considered extremely important by the Irish EPA for engaging catchment inhabitants and stakeholders (EPA, personal communication, 22/10/2018) with issues related to water quality pressures and impacts.
High-Temporal Resolution Water Quality Proxies
Data from less complex sensors and probes have been used as proxies for specific parameters of interest and especially where these parameters are more complicated to capture in high-resolution. The most prominent of the complex real-time parameters in catchment science programs is P. The technique for continuous P analysis in rivers, and which displays data in real-time, is currently limited to a wet-chemistry method and requiring considerable resource in terms of capital costs, maintenance and data handling. The most common proxies for continuous P concentration in river water are turbidity, conductivity and, more recently, continuous multi-spectral spectrophotometry.
River turbidity measured continuously at high resolution has been used as a proxy for P data in several monitoring investigations around the world and with varying success (Jones et al., 2011; Minaudo et al., 2017; Schilling et al., 2017; Stutter et al., 2017). The issues are related to P fractionation and the specific land use environment where this proxy is being measured. For example, turbidity is mostly related to suspended sediment (with interferences from dissolved organic matter) and, in P fractionation theory, suspended sediment is most related to the particulate P fraction, i.e., P that is strongly or loosely bound to eroded sediment. In grassland agricultural settings, such as Ireland, P is considered mostly mobilized from soil surfaces due to desorption processes and so is not fully coupled to mobilization from erosion. Therefore, in theory, any changes to practices that reduce the desorption potential of soils, such as reduced soil P, may decrease the loss of P from land to water but without reducing the erosion potential of the land use. This soil P change and change in mobilized P would, therefore, not be measured by a turbidity signal and which would continue to measure the unchanged soil (or stream bank) erosion process. Stutter et al. (2017) also reported that calibration datasets between particulate P and turbidity were more likely catchment specific. Similarly, river discharge has been used as a predictor for continuous P datasets (Minaudo et al., 2017) but the uncertainty in the models used is most likely too high for large scale or continuous use and the before/after scenarios of land use change are similar to those with turbidity (soil P may change and so will mobilized P, but discharge patterns remain similar).
Nevertheless, over the shorter term, turbidity, river discharge and any other parameters that have a similar dynamic pattern to P when measured continuously, can be used to fill small gaps in continuous P datasets using linear and non-linear relationships. These proxies can also be used when the parameter of interest is more coupled to the measurement parameter both at source and in the river system (such as soil erosion from arable land).
Study Area and Scoping
In identifying a matrix of options for monitoring there are exemplars across Europe which can be used to inform on suitable approaches. In general, however, information relating to the practicalities, successes and the failures of such schemes are rarely publicly reported. Journal articles generally provide statements on the instrumentation, the data collected and relevant characteristics of the study area. To obtain the level of detail necessary to evaluate monitoring options a series of unstructured interviews and site visits were undertaken at current monitoring programs in North West Europe, selecting cases with similarities in terms of landscape and climate. These exemplar users were identified from the literature and from prior networks and collaboration fact-finding visits to European research and monitoring programs. Visits were made between October 2018 and March 2019 (Table 1). In addition to technological benefits and issues, researchers were asked specifically on the level of behavioral change the enhanced datasets has had.
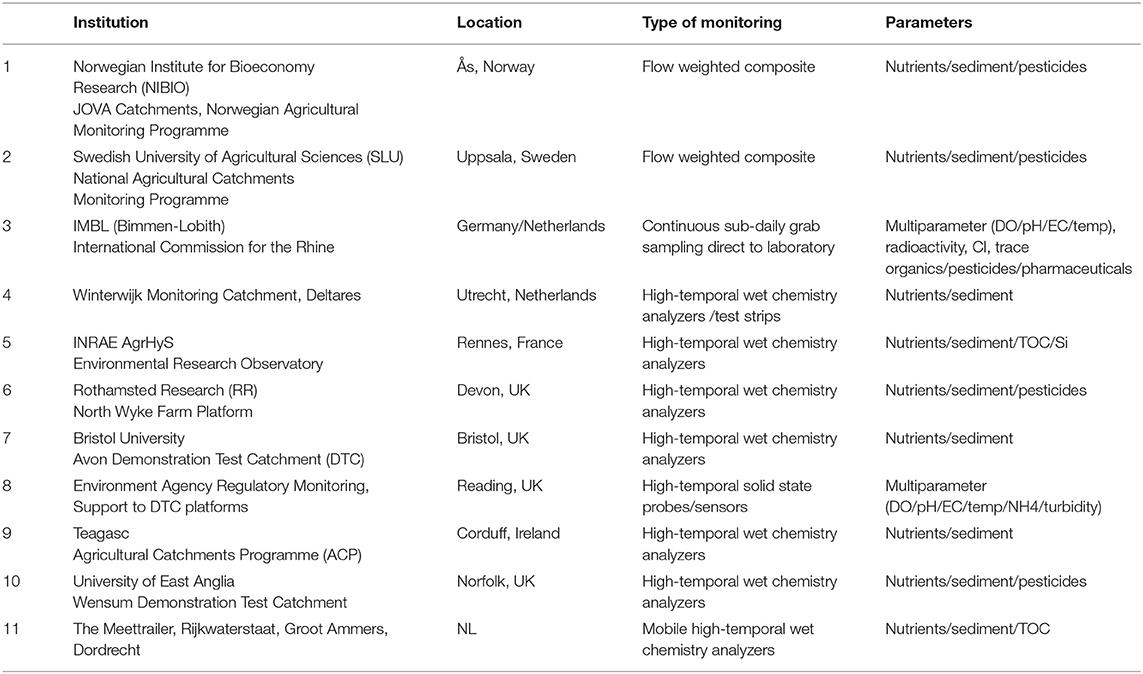
Table 1. Institutions visited using enhanced water quality monitoring techniques.
Considerations for Enhanced or High-Resolution Water Quality Data Collection
Enhanced environmental data collection offers utility beyond low-resolution methods and high-resolution data collection is an attractive solution owing to data being viewed in real-time, providing accurate load estimates and indicating clearly the linkages between weather events and land management, for example. However, this attractiveness is moderated by a range of issues and harsh lessons that have been gathered from the range of agencies and projects highlighted in this study. The installation of any enhanced data gathering method, including and especially real-time, high-resolution equipment, is not “plug-and-play” and will challenge the capacity and capability of agencies to sustain time-series data—even on small projects. Some of the issues are summarized here.
Define Clear Program Objectives
A common thread from experiences in this review was to carefully define program objectives where enhanced data collection is required. The summary learning is to fit the technology and approach directly to the objective of the program and discriminate between what is essential in terms of parameters, measurement frequency and accuracy for program delivery and what is desirable. For example if an objective within a project is to monitor chemical and sediment load to lakes or estuaries, a FWCS approach would be a cost-effective solution rather than real-time monitoring equipment collecting and analysis data at hourly or sub-hourly frequencies. If the objective is to define impacts and dynamics of suspended sediments in rivers, then a turbidity probe is essential and any ancillary probes that may be also included on sonde equipment are unnecessary. Surplus sensors and probes require maintenance, and their data require management and storage.
An additional consideration is the scale at which monitoring should be implemented and will vary depending on program objectives. For example, the appropriate scale to influence behavioral change should ensure that individual activities cannot be directly identified while ensuring that source pressures can be discriminated and compared.
Personnel
Modern water quality monitoring equipment, designed to fill gaps in data time series beyond normal (e.g., statutory) sampling and to provide long-detailed times series, requires an investment of personnel to be dedicated to servicing, maintenance, and troubleshooting. Examples reviewed here were able to maintain longer time-series data collection (from flow-weighted composite sampling programs to high-temporal resolution sampling) with dedicated technical and technological staff and with the addition of equipment service contracts from equipment suppliers. Conversely, some programs were unable to maintain longer-term time series if, for example, roles were shared between technical, data-management and/or research staff. Staff turnover was also an issue, with short-term contracts leading to poor retention and repeated training of new staff placing an additional burden on programs.
The summary learning is that equipment purchases and installation is only the first (and likely most straightforward) part of investment in enhanced water quality monitoring and particularly for high-temporal resolution monitoring. The complexity of the equipment used, and particularly wet-chemistry analyzers and sensitive ISE probes, requires ongoing attention from trained technical staff and the most successful examples of long-term data collection were evidenced when full-time, permanent staff had dedicated roles and responsibilities.
Data Management
Data management, including quality control and quality assurance, requires high investment and ongoing, regular checks. Any enhanced environmental data collection, from discharge measurements for FWCS approaches to fully developed real-time monitoring, generates many data points per year [for example, one Agricultural Catchment Programme (ACP) station operated by Teagasc generates ~450,000 data points per year]. Quality assurance includes regular calibration and validation of equipment (and adjustment if necessary), and quality control requires time and protocols to check datasets. Archiving, visualization, and reporting requires investment in complex database systems that may incur high investment and annual costs. Other examples identified within the interviews in this review used bespoke programming to access data from proprietary database software packages. Real-time monitoring and data visualization have potential for access to time-series data as trends (i.e., data from the previous day, week, month, etc.) via telemetered and SCADA/PLC systems. However, none of the programs reviewed were able to demonstrate this use for public access mostly due to lags with QA/QC protocols (which could be months and up to 1 year) to filter poor data and/or concerns over the sensitivity of the data and potential for misinterpretation.
A strong recommendation, and summary learning from two of the cases in this review, was to design the database management system and data handling protocols prior to the commencement of data collection from high-resolution water quality monitoring programs.
Technical
Sites and programs visited in this study had various technical issues and problems related to specific equipment ranging from breakdowns of moving parts or parts exposed to heat and pressure, pipe and pump blockage, seal damage, and data signal transfer. Some issues were related to the dynamic nature of river systems exposed to short-duration, sediment laden storm waters and heavy debris damage to in-stream ancillary equipment. While many of the issues encountered could be minimized or mitigated through on-site dedicated technical personnel, a net result was loss of data collection on at least some occasions and the risk was always highest for real-time data collection during the storm periods that the equipment was principally designed to monitor. These losses of data were often related to monitoring equipment or to the way in which water was delivered to the monitoring equipment through in-stream or ex situ pump periodic breakdown, and almost always related to the nature or velocity of river condition changes over short time scales.
For N fractions, analyzers, sensors, and probes can all be used and depending on the fraction and the objective. For operational monitoring of nitrate (and nitrite), for example, solid state sensors provide a robust and accurate option, including the measurement of low concentrations (see Burkitt et al., 2017 for Hach Nitratax tests in New Zealand with laboratory analyses). Total N is monitored using wet chemistry analyzers. For nitrate, nitrite and ammonium, ISEs are also available and can be linked to water quality sondes. While calibration, reliability and longevity are issues with ISEs when deployed in the natural environment, shorter term deployments and careful servicing may provide reliable data. Having said this, feedback from the interviews was cautionary regarding the performance of ammonium ISE probes with issues mainly correlated to levels and frequency of calibrations and probe replacement.
Summary learnings from this technical review are:
• determine the best way to deliver samples to the equipment being used (in situ or ex situ) and the trade-offs with these,
• evaluate equipment specifications for concentration range and limits of detection against the environmental conditions being monitored,
• determine what chemical fractions are essential to monitor and match these against monitoring equipment,
• define whether measured fractions require calibration against operational fractions (for precision and accuracy),
• determine whether data can be downloaded directly from equipment or whether there are issues with analog signal translation (and the alternative options available) and compatibility with data logging/telemetry options,
• determine whether the analyzer, sensor or probe is adequate for the monitoring required and this may be determined, for example, by considering environmental conditions (including in situ or ex situ deployments), and the duration of planned deployment periods,
• determine whether full after-sales support and contract servicing is available.
Science, Policy, Engagement, and Behavioral Change
Of the eleven enhanced water quality monitoring programs visited and interviewed in this review, all would identify as being developed to support agricultural and environmental policy. This ranged from enhanced surveillance (e.g., the International Monitoring Station Bimmen-Lobith) to evaluation (e.g., ACP Teagasc, Ireland) and change (Demonstration Test Catchment (DTC) networks, UK). One station set-up at the Kervidy-Naizin catchment in Brittany (INRAE) was also used for blue-skies research with the ability for full ion chromatographic analysis.
However, while this policy support has been and is currently delivered with the help of enhanced water quality monitoring programs, an evident outcome has been increased scientific understanding of environmental and agri-environmental processes. On consultation with program personnel, this has resulted in published papers both numerous and of the highest quality. In addition, higher degree graduates allocated to the programs, many of whom progress to work within agricultural advisory and catchment programs, engaging and transferring their knowledge to farmers, have added to the debate on policy development beyond the direct support that the programs were designed for.
The DTC program in the UK had a remit to use the catchment infrastructure (real-time and other equipment) to test the effects of new and alternative upstream mitigation measures on water quality and to influence behavioral change (McGonigle et al., 2014). For nutrients at least, the DTC Wensum catchment (Cooper et al., 2020) used real-time nutrient data to characterize the dynamics of nutrient transfers from mini-catchments and used these data to engage the farmer to consider changed practice to reduce nitrate losses. The success of these measures was more readily understood by edge of field monitoring methods (Cooper et al., 2017) but it was considered by Wensum researchers that the high-resolution nutrient data were a key influencing factor in making the land management changes (cover crops).
Engagement appeared to be a recurring theme in all instances where high resolution data gathered in real-time were captured. This was considered a great benefit and equipment sites acted as focus points for discussion and debate. The impact on behavioral change per se from these wider engagements is unquantified (as change was not a formalized objective)—but the perception from program researchers was of a positive impact overall. This also identifies a research gap; there is a difference in the engagement facilitated, for example, by researchers in a catchment characterization exercise to assess the risk of nutrient transfer and to plan actions for change, and the potential for behavioral change that consistent group engagement with farmers and other stakeholders has—and when this engagement is regarded as wholly positive. As a further reflection, considering this research gap and the potential for behavioral change through engagement, studies should be mindful of the benefits of participation as well as observation (Weiner et al., 2022). Citizen Science programs such as WaterBlitz type monitoring offer good opportunities in this regard, and especially in combination with other enhanced techniques.
Options Matrix for Enhanced Water Quality Monitoring
Based on the evidence gathered during this study, several options were identified and evaluated for suitability for future monitoring programs. These included:
1. Routine Grab Sampling (BUSINESS AS USUAL Option)
2. Routine Grab Sampling (nutrients) with an additional Citizen Science component
3. Routine Grab Sampling supplemented by minimal real-time monitoring at key sites:
4. Amplified grab sampling (nutrients) supplemented with low-level real-time monitoring
5. Automated sampling (24-7) with supplementary real-time monitoring
6. Full Real-time in-situ Monitoring Station
7. Mobile Real-time Monitoring Station.
An options matrix linked to these is provided in Table 2, and is intended to act as a guide to balancing monitoring ambitions with the operational realities of running such programs. Options (1–7) are ranked according to their potential to deliver behavioral change at stakeholder level, from the business as usual (Option 1) scenario with minimal behavioral impact to the mobile real-time systems (Option 7) which can be deployed at multiple locations and used to reach as many stakeholders as possible within different catchments and adapted to different combinations of source pressures for contaminants. For each option the considerations in terms of equipment/infrastructure, personnel, logistics and data handling are then identified. These general requirements should act as headings under which further planning and costing can be undertaken.
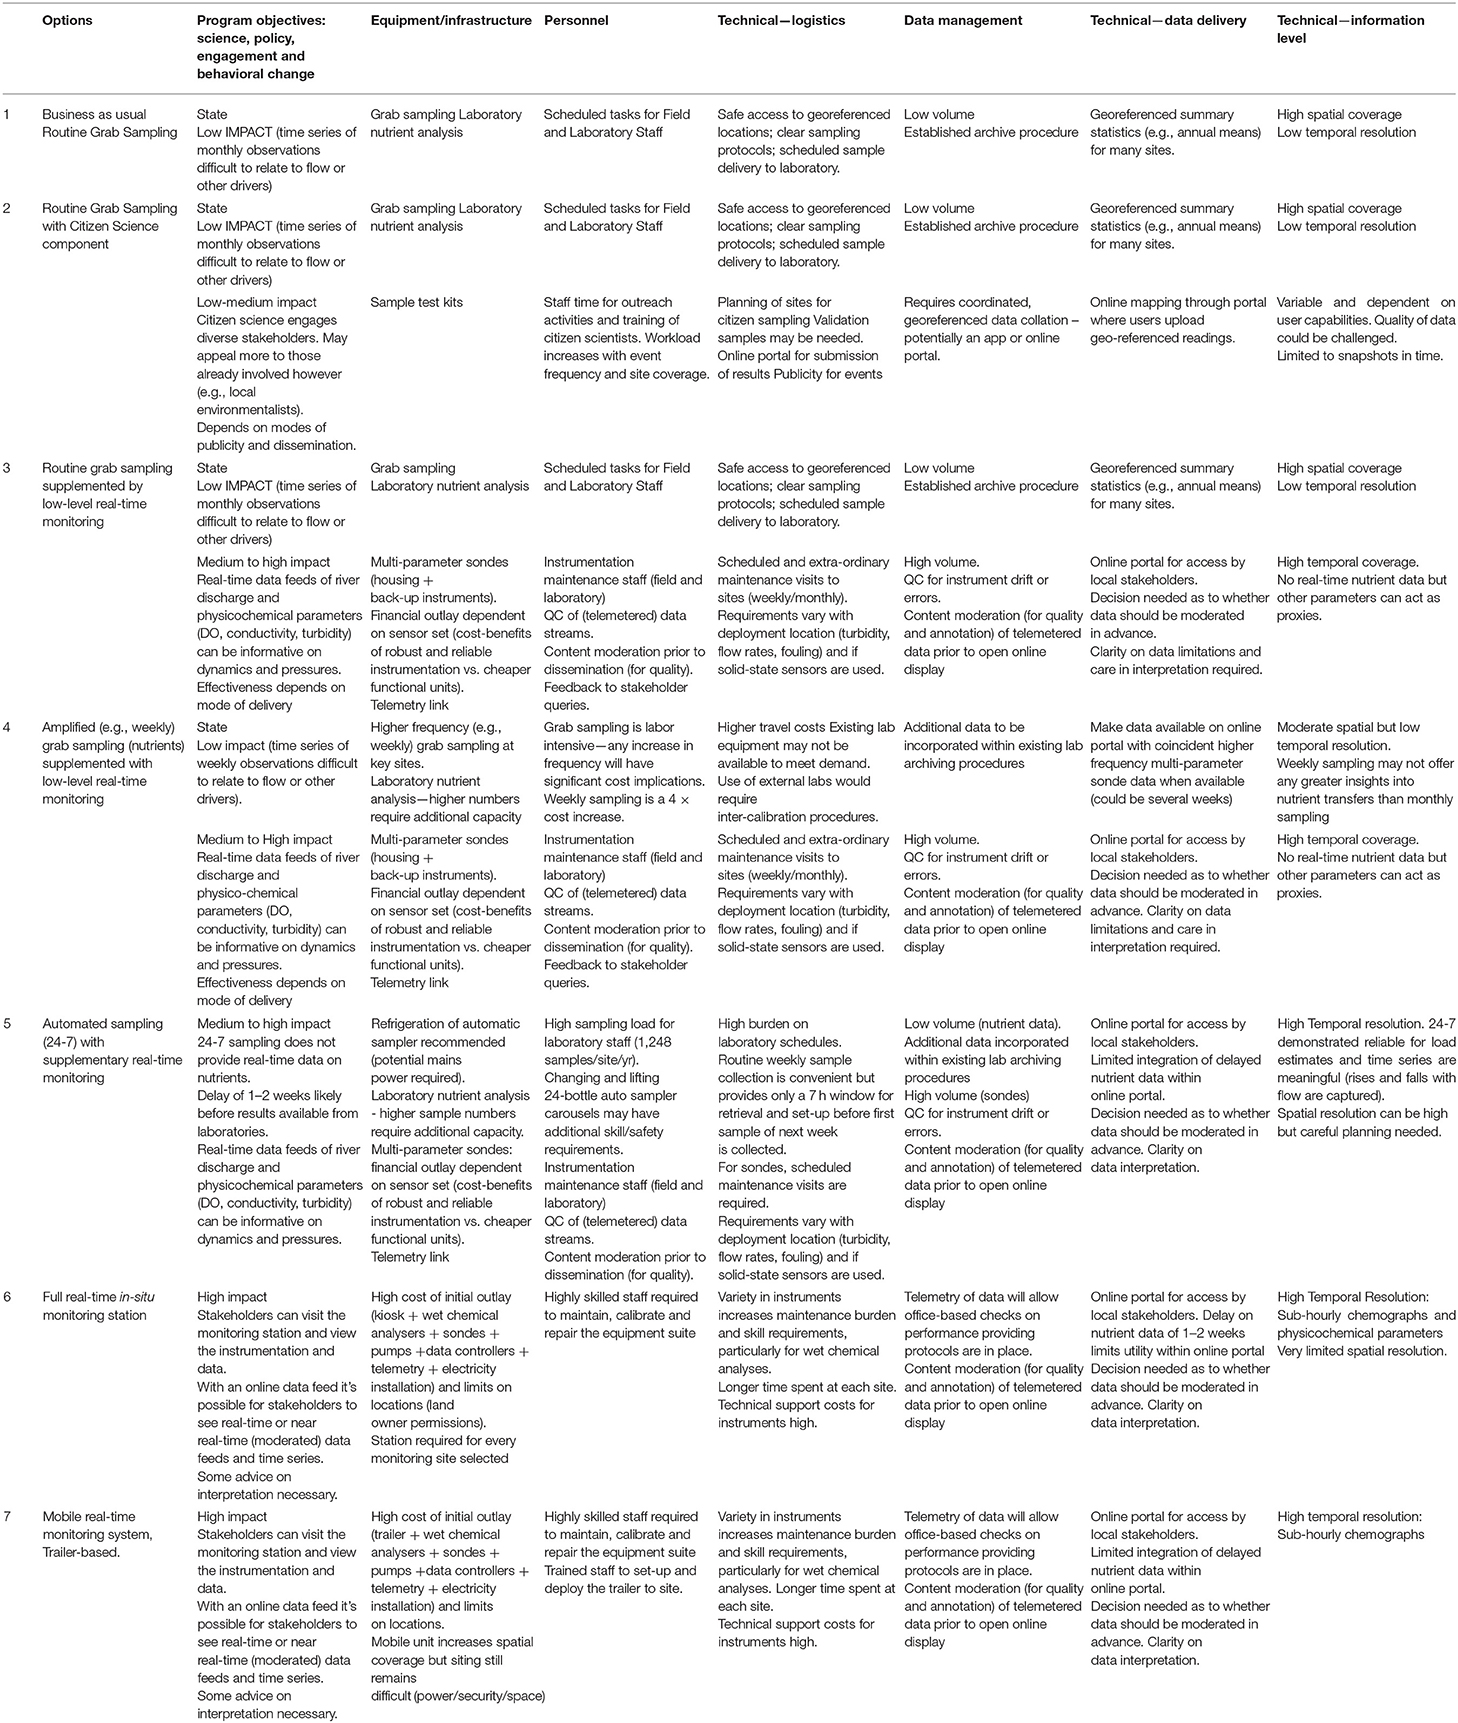
Table 2. Options matrix for enhanced water quality monitoring compared against a business as usual approach.
Conclusions
A review of technologies and operational considerations for enhanced water quality monitoring across NW Europe identified key considerations in establishing any program of observation in a catchment setting. While sub-hourly, multi-parameter, real-time data collections can deliver in certain settings the practicalities in terms of cost, maintenance and data management mean that their use over lower cost approaches needs strong justification.
Objectives for enhanced water quality surveillance beyond statutory monitoring practices can be made as effectively using, for example, the flow-weighted composite sampling approaches or 24/7 sampling approaches described in earlier parts of this review. These methods provide more meaningful data in terms of enhanced surveillance and can account for the hydrologically dynamic characteristics of catchments. These approaches are useful for subsequent reporting but do not appear, however, to provide the instantaneous and source apportionment data that are meaningful to farmers and possibly other stakeholders. The time delay from sample collection to laboratory analysis and availability to users is likely to be ~ >2 weeks from collection of the first sample in the sequence.
Synoptic surveys using Citizen Science approaches such as the Freshwater Watch WaterBlitz surveys are considered useful to engage farming groups within catchments and which provide “at a glance” opportunities to assess contributions to water quality. These can be implemented by farming discussion groups, catchment management coordinators and rivers stakeholder groups, and be meaningful during periods of stable flow to show stepped changes in water quality and/or vulnerable tributaries or land uses.
Most of the eleven programs visited in this study could not readily identify influences that had caused behavioral change as this had not been a primary objective. The Demonstration Test Catchment programs in England and Wales were an exception, where a primary remit was to influence both policy and farm practice change. One example in the Wensum-DTC program used high-resolution nutrient and discharge data to characterize nutrient transfer risk and these data were used to engage the farmer and to ultimately implement practice change.
The rest of the programs visited used data in a more top-down policy evaluation or surveillance approach where policy reviews (and change) could influence farm practice (or other industrial) change. Nevertheless, staff from programs using high-resolution real-time monitoring approaches in agricultural catchments were clear that the stakeholder engagement potential was very high and that the sites acted as important focus points for discussion on water quality issues for farmers, policy stakeholders and scientists alike, and so part of a suite of tools that might ultimately change behavior. The learnings from Sweden, was that there was a desire from farmers for meaningful data—of the instantaneous type generated at higher resolution—to demonstrate how their activities impacted water quality when compared with other pressures operating at the same time. The principle of the potential for behavioral change from access to meaningful data (as an objective), beyond the three yearly summaries provided by statutory reporting protocols, is something to consider further and particularly in combinations with other options. Our options matrix provides recommendations based on the findings of this study and applied to the objective for collecting meaningful data to enhance behavioral change potential.
Author Contributions
All authors listed have made a substantial, direct, and intellectual contribution to the work and approved it for publication.
Funding
This study was funded by the Department for Agriculture Environment and Rural Affairs, Belfast (Project 17/4/07).
Conflict of Interest
The authors declare that the research was conducted in the absence of any commercial or financial relationships that could be construed as a potential conflict of interest.
Publisher's Note
All claims expressed in this article are solely those of the authors and do not necessarily represent those of their affiliated organizations, or those of the publisher, the editors and the reviewers. Any product that may be evaluated in this article, or claim that may be made by its manufacturer, is not guaranteed or endorsed by the publisher.
Acknowledgments
We thank all scientists and technologists from institutions listed in Table 1 for hosting our visits, and for interesting discussions and site visits. Special thanks to Wendy McKinley, Water Management Unit, Northern Ireland Environment Agency (part of DAERA) for commissioning this study following the publication of the Sustainable Agricultural Land Management Strategy report (https://www.daera-ni.gov.uk/articles/sustainable-agricultural-land-management-strategy).
References
Allan, I. J., Knutsson, J., Guigues, N., Mills, G. A., Fouillac, A.-M., and Greenwood, R. (2008). Chemcatcher® and DGT passive sampling devices for regulatory monitoring of trace metals in surface water. J. Environ. Monit. 10, 821–829. doi: 10.1039/b802581a
Arnscheidt, J., Jordan, P., Li, S., Mccormick, S., Mcfaul, R., Mcgrogan, H. J., et al. (2007a). Defining the sources of low-flow phosphorus transfers in complex catchments. Sci. Total Environ. 382, 1–13. doi: 10.1016/j.scitotenv.2007.03.036
Arnscheidt, J., Jordan, P., Mcgrogan, H. J., Mccormick, S., and Ward, C. (2007b). “High resolution monitoring to characterise phosphorus transfers in complex catchments,” in The 5th International Phosphorus Workshop - IPW5 - Diffuse Phosphorus Loss, 149.
Azzaro, F., and Galletta, M. (2006). Automatic colorimetric analyzer prototype for high frequency measurement of nutrients in seawater. Mar. Chem. 99, 191–198. doi: 10.1016/j.marchem.2005.07.006
Bechmann, M., and Deelstra, J. (2013). Agriculture and Environment - Long Term Monitoring in Norway. Norway: Akademika Publishing.
Blackstock, K. L., Ingram, J., Burton, R., Brown, K. M., and Slee, B. (2010). Understanding and influencing behaviour change by farmers to improve water quality. Sci. Total Environ. 408, 5631–5638. doi: 10.1016/j.scitotenv.2009.04.029
Bowes, M. J., Smith, J. T., and Neal, C. (2009). The value of high-resolution nutrient monitoring: a case study of the River Frome, Dorset, UK. J. Hydrol. 378, 82–96. doi: 10.1016/j.jhydrol.2009.09.015
Burkitt, L. L., Jordan, P., Singh, R., and Elwan, A. (2017). High Resolution Monitoring of River Nitrate in Agricultural Catchments – A Case on the Manawatu River, New Zealand. New Zealand: An Envirolink report (MAUX1604/1720-HZLC135) prepared for Horizons Regional Council.
Cassidy, R., and Jordan, P. (2011). Limitations of instantaneous water quality sampling in surface-water catchments: comparison with near-continuous phosphorus time-series data. J. Hydrol. 405, 182–193. doi: 10.1016/j.jhydrol.2011.05.020
Cassidy, R., Jordan, P., Bechmann, M., Kronvang, B., Kyllmar, K., and Shore, M. (2018). Assessments of composite and discrete sampling approaches for water quality monitoring. Water Resources Manage. 32, 3103–3118. doi: 10.1007/s11269-018-1978-5
Claussen, U., Zevenboom, W., Brockmann, U., Topcu, D., and Bot, P. (2009). “Assessment of the eutrophication status of transitional, coastal and marine waters within OSPAR,” in Eutrophication in Coastal Ecosystems: Towards better understanding and management strategies Selected Papers from the Second International Symposium on Research and Management of Eutrophication in Coastal Ecosystems, 20–23 June 2006, Nyborg, Denmark, eds J. H. Andersen and D. J. Conley (Dordrecht: Springer Netherlands), 49–58.
Conroy, E., Turner, J. N., Rymszewicz, A., Bruen, M., O'sullivan, J. J., Lawler, D. M., et al. (2016). Evaluating the relationship between biotic and sediment metrics using mesocosms and field studies. Sci. Total Environ. 568, 1092–1101. doi: 10.1016/j.scitotenv.2016.06.168
Cooper, R. J., Hama-Aziz, Z., Hiscock, K. M., Lovett, A. A., Dugdale, S. J., Sünnenberg, G., et al. (2017). Assessing the farm-scale impacts of cover crops and non-inversion tillage regimes on nutrient losses from an arable catchment. Agric. Ecosyst. Environ. 237, 181–193. doi: 10.1016/j.agee.2016.12.034
Cooper, R. J., Hiscock, K. M., Lovett, A. A., Dugdale, S. J., Sünnenberg, G., and Vrain, E. (2020). Temporal hydrochemical dynamics of the River Wensum, UK: observations from long-term high-resolution monitoring (2011–2018). Sci. Total Environ. 724, 138253. doi: 10.1016/j.scitotenv.2020.138253
Cunha, D. G. F., Magri, R. A. F., Tromboni, F., Ranieri, V. E. L., Fendrich, A. N., Campanhão, L. M. B., et al. (2019). Landscape patterns influence nutrient concentrations in aquatic systems: citizen science data from Brazil and Mexico. Freshwater Sci. 38, 365–378. doi: 10.1086/703396
Davis, A. M., Webster, A. J., Fitch, P., Fielke, S., Taylor, B. M., Morris, S., et al. (2021). The changing face of science communication, technology, extension and improved decision-making at the farm-water quality interface. Mar. Pollut. Bull. 169, 112534. doi: 10.1016/j.marpolbul.2021.112534
Deelstra, J., Stenrød, M., Bechmann, M., and Eggestad, H. O. (2013). “Discharge measurement and water sampling,” in Agriculture and Environment - Long Term Monitoring in Norway, eds M. Bechmann and J. Deelstra (Trondheim, Norway: Akademika Publishing), 83–104.
EPA (2018). Local Catchment Assessments: Background, Process and Implementation (Volume 1), Guidance on Further Characterisation for Local Catchment Assessments, Version 1. Dublin: Environmental Protection Agency.
EPA Catchments Unit (2016). Technical Note: Electrical Conductivity – A Useful Tool for Investigating Catchment Hydrology. Dublin: EPA. Available online at: https://www.catchments.ie/technical-note-electrical-conductivity-useful-tool-investigating-catchment-hydrology/ (accessed September 26, 2019).
Floury, P., Gaillardet, J., Gayer, E., Bouchez, J., Tallec, G., Ansart, P., et al. (2017). The potamochemical symphony: new progress in the high-frequency acquisition of stream chemical data. Hydrol. Earth Syst. Sci. 21, 6153–6165. doi: 10.5194/hess-21-6153-2017
Guigues, N., Lepot, B., Cabillic, J., Raveau, S., Ferret, C., Marescaux, N., et al. (2019). Assessing the performance of measurement devices for continuously monitoring of organic matter and nutrient in river water. Accredit. Qual. Assur. 25, 7–22. doi: 10.1007/s00769-019-01408-5
Hadj-Hammou, J., Loiselle, S., Ophof, D., and Thornhill, I. (2017). Getting the full picture: assessing the complementarity of citizen science and agency monitoring data. PLoS ONE 12, e0188507. doi: 10.1371/journal.pone.0188507
Halliday, S. J., Wade, A. J., Skeffington, R. A., Neal, C., Reynolds, B., Rowland, P., et al. (2012). An analysis of long-term trends, seasonality and short-term dynamics in water quality data from Plynlimon, Wales. Sci. Total Environ. 434, 186–200. doi: 10.1016/j.scitotenv.2011.10.052
Haraldsen, T. K., and Stålnacke, P. (2006). Methods for water quality sampling and load estimation in monitoring of Norwegian agricultural catchments. Hydrol. Res. 37, 81–92. doi: 10.2166/nh.2006.0007
Jones, A. S., Stevens, D. K., Horsburgh, J. S., and Mesner, N. O. (2011). Surrogate measures for providing high frequency estimates of total suspended solids and total phosphorus concentrations. J. Am. Water Resources Assoc. 47, 239–253. doi: 10.1111/j.1752-1688.2010.00505.x
Jones, J. I., Murphy, J. F., Collins, A. L., Sear, D. A., Naden, P. S., and Armitage, P. D. (2012). The impact of fine sediment on macro-invertebrates. River Res. Appl. 28, 1055–1071. doi: 10.1002/rra.1516
Jordan, P., Arnscheidt, A., Mcgrogan, H., and Mccormick, S. (2007). Characterising phosphorus transfers in rural catchments using a continuous bank-side analyser. Hydrol. Earth Syst. Sci. 11, 372–381. doi: 10.5194/hess-11-372-2007
Jordan, P., and Cassidy, R. (2011). Technical Note: Assessing a 24/7 solution for monitoring water quality loads in small river catchments. Hydrol. Earth Syst. Sci. 15, 3093–3100. doi: 10.5194/hess-15-3093-2011
Jordan, P., Cassidy, R., Macintosh, K. A., and Arnscheidt, J. (2013). Field and laboratory tests of flow-proportional passive samplers for determining average phosphorus and nitrogen concentration in rivers. Environ. Sci. Technol. 47, 2331–2338. doi: 10.1021/es304108e
Jordan, P., Melland, A. R., Mellander, P. E., Shortle, G., and Wall, D. (2012). The seasonality of phosphorus transfers from land to water: implications for trophic impacts and policy evaluation. Sci. Total Environ. 434, 101–109. doi: 10.1016/j.scitotenv.2011.12.070
Kaelin, D., Rieger, L., Eugster, J., Rottermann, K., Bänninger, C., and Siegrist, H. (2008). Potential of in-situ sensors with ion-selective electrodes for aeration control at wastewater treatment plants. Water Sci. Technol. 58, 629–637. doi: 10.2166/wst.2008.433
Kirchner, J. W., Feng, X., Neal, C., and Robson, A. J. (2004). The fine structure of water-quality dynamics: the (high-frequency) wave of the future. Hydrol. Process. 18, 1353–1359. doi: 10.1002/hyp.5537
Knutsson, J., Rauch, S., and Morrison, G. M. (2013). Performance of a passive sampler for the determination of time averaged concentrations of nitrate and phosphate in water. Environ. Sci. Process. Impacts 15, 955–962. doi: 10.1039/c3em00038a
Kyllmar, K. (2009). Transporter av kväve och fosfor i vattendrag – inverkan av metodik vid vattenprovtagning. Jämförelse av vattenanalyser från manuell respektive flödesproportionell vattenprovtagning i åtta Intensivtypområden. Uppsala: Swedish University of Agricultural Sciences, Department of Soil and Environment.
Kyllmar, K., Forsberg, L. S., Andersson, S., and Mårtensson, K. (2014). Small agricultural monitoring catchments in Sweden representing environmental impact. Agric. Ecosyst. Environ. 198, 25–35. doi: 10.1016/j.agee.2014.05.016
Lawal, A. T., and Adeloju, S. B. (2013). Polypyrrole based amperometric and potentiometric phosphate biosensors: a comparative study B. Biosens. Bioelectron. 40, 377–384. doi: 10.1016/j.bios.2012.08.012
Lawler, D. M., Petts, G. E., Foster, I. D. L., and Harper, S. (2006). Turbidity dynamics during spring storm events in an urban headwater river system: the Upper Tame, West Midlands, UK. Sci. Total Environ. 360, 109–126. doi: 10.1016/j.scitotenv.2005.08.032
McGonigle, D. F., Burke, S., Collins, A. L., Gartner, R., Haft, M., Harris, R., et al. (2014). Developing demonstration test catchments as a platform for transdisciplinary land management research in England and Wales. Environ. Sc. Process. Impacts 16, 1618–1628. doi: 10.1039/C3EM00658A
Melland, A. R., Mellander, P. E., Murphy, P. N. C., Wall, D. P., Mechan, S., Shine, O., et al. (2012). Stream water quality in intensive cereal cropping catchments with regulated nutrient management. Environ. Sci. Policy 24, 58–70. doi: 10.1016/j.envsci.2012.06.006
Mellander, P.-E., Melland, A. R., Jordan, P., Wall, D. P., Murphy, P. N. C., and Shortle, G. (2012). Quantifying nutrient transfer pathways in agricultural catchments using high temporal resolution data. Environ. Sci. Policy 24, 44–57. doi: 10.1016/j.envsci.2012.06.004
Mellander, P. E., Jordan, P., Melland, A. R., Murphy, P. N. C., Wall, D. P., Mechan, S., et al. (2013). Quantification of phosphorus transport from a karstic agricultural watershed to emerging spring water. Environ. Sci. Technol. 47, 6111–6119. doi: 10.1021/es304909y
Meyer, A. M., Klein, C., Fünfrocken, E., Kautenburger, R., and Beck, H. P. (2019). Real-time monitoring of water quality to identify pollution pathways in small and middle scale rivers. Sci. Total Environ. 651, 2323–2333. doi: 10.1016/j.scitotenv.2018.10.069
Minaudo, C., Dupas, R., Gascuel-Odoux, C., Fovet, O., Mellander, P. E., Jordan, P., et al. (2017). Nonlinear empirical modeling to estimate phosphorus exports using continuous records of turbidity and discharge. Water Resour. Res. 53, 7590–7606. doi: 10.1002/2017WR020590
Mitchell, S. (2018). Investigation and Comparison of Citizen Science Methodology versus those of NIEA/DAERA via Nitrate and Phosphate Analysis of Sites within the Lagan Catchment. Lisburn: DAERA - Work Based Learning: Northern Ireland Environment Agency.
Morton, P. A., Cassidy, R., Floyd, S., Doody, D. G., Mcroberts, W. C., and Jordan, P. (2021). Approaches to herbicide (MCPA) pollution mitigation in drinking water source catchments using enhanced space and time monitoring. Sci. Total Environ. 755, 142827. doi: 10.1016/j.scitotenv.2020.142827
Müller, B., Stierli, R., and Gächter, R. (2008). A low-tech, low-cost passive sampler for the long-term monitoring of phosphate loads in rivers and streams. J. Environ. Monit. 10, 817–820. doi: 10.1039/b806465b
Neal, C., Reynolds, B., Rowland, P., Norris, D., Kirchner, J. W., Neal, M., et al. (2012). High-frequency water quality time series in precipitation and streamflow: from fragmentary signals to scientific challenge. Sci. Total Environ. 434, 3–12. doi: 10.1016/j.scitotenv.2011.10.072
O'Boyle, S., Quinn, R., Dunne, N., Mockler, E. M., and Longphuirt, S. N. (2016). What have we learned from over two decades of monitoring riverine nutrient inputs to Ireland's marine environment? Biol. Environ. Proc. R. Irish Acad. 116B, 313–327. doi: 10.1353/bae.2016.0009
O'Brien, D., Hawker, D., Shaw, M., and Mueller, J. F. (2011). The performance of passive flow monitors and phosphate accumulating passive samplers when exposed to pulses in external water flow rate and/or external phosphate concentrations. Adapt. Forest Ecosyst. Air Pollut. Clim. Change 159, 1435–1441. doi: 10.1016/j.envpol.2010.12.028
OJEC (2000). Directive, 2000/60/EC of the European Parliament and of the Council establishing a framework for community action in the field of water policy (water framework directive). Off. J. Eur. Commun. 22, 2000.
Reaney, S. M., Mackay, E. B., Haygarth, P. M., Fisher, M., Molineux, A., Potts, M., et al. (2019). Identifying critical source areas using multiple methods for effective diffuse pollution mitigation. J. Environ. Manage. 250, 109366. doi: 10.1016/j.jenvman.2019.109366
Rode, M., Wade, A. J., Cohen, M. J., Hensley, R. T., Bowes, M. J., Kirchner, J. W., et al. (2016). Sensors in the stream: the high-frequency wave of the present. Environ. Sci. Technol. 50, 10297–10307. doi: 10.1021/acs.est.6b02155
Rozemeijer, J., Van Der Velde, Y., De Jonge, H., Van Geer, F., Broers, H.-P., and Bierkens, M. (2010). Application and evaluation of a new passive sampler for measuring average solute concentrations in a catchment scale water quality monitoring study. Environ. Sci. Technol. 44, 1353–1359. doi: 10.1021/es903068h
Sánchez-Bayo, F., and Hyne, R. V. (2014). Detection and analysis of neonicotinoids in river waters – development of a passive sampler for three commonly used insecticides. Chemosphere 99, 143–151. doi: 10.1016/j.chemosphere.2013.10.051
Sandström, S., Futter, M. N., Kyllmar, K., Bishop, K., O'connell, D. W., and Djodjic, F. (2020). Particulate phosphorus and suspended solids losses from small agricultural catchments: links to stream and catchment characteristics. Sci. Total Environ. 711, 134616. doi: 10.1016/j.scitotenv.2019.134616
Schäfer, R. B., Paschke, A., Vrana, B., Mueller, R., and Liess, M. (2008). Performance of the Chemcatcher® passive sampler when used to monitor 10 polar and semi-polar pesticides in 16 Central European streams, and comparison with two other sampling methods. Water Res. 42, 2707–2717. doi: 10.1016/j.watres.2008.01.023
Schilling, K. E., Kim, S.-W., and Jones, C. S. (2017). Use of water quality surrogates to estimate total phosphorus concentrations in Iowa rivers. J. Hydrol. Region. Stud. 12, 111–121. doi: 10.1016/j.ejrh.2017.04.006
Sherriff, S., Rowan, J., Fenton, O., Jordan, P., and Hullacháin, D. (2016). “Targeting sediment management strategies using sediment quantification and fingerprinting methods,” in EGU General Assembly 2016. (Vienna).
Sherriff, S. C., Rowan, J. S., Melland, A. R., Jordan, P., Fenton, O., and huallacháin D.Ó., et al. (2015). Investigating suspended sediment dynamics in contrasting agricultural catchments using ex situ turbidity-based suspended sediment monitoring. Hydrol. Earth Syst. Sci. 19, 3349–3363. doi: 10.5194/hess-19-3349-2015
Smith, V. H. (1998). “Cultural eutrophication of inland, estuarine, and coastal waters,” in Successes, Limitations, and Frontiers in Ecosystem Science, eds M. L. Pace and P. M. Groffman (New York, NY: Springer New York), 7–49.
Stone, K. C., Hunt, P. G., Novak, J. M., Johnson, M. H., and Watts, D. W. (2000). Flow-proportional, time-composited, and grab sample estimation of nitrogen export from an eastern coastal plain watershed. Trans. ASAE 43, 281–290. doi: 10.13031/2013.2703
Storey, M. V., Van Der Gaag, B., and Burns, B. P. (2011). Advances in on-line drinking water quality monitoring and early warning systems. Water Res. 45, 741–747. doi: 10.1016/j.watres.2010.08.049
Strand, R. M., and Merritt, R. W. (1997). Effects of episodic sedimentation on the net-spinning caddisflies Hydropsyche betteni and Ceratopsyche sparna (Trichoptera: Hydropsychidae). Environ. Pollut. 98, 129–134. doi: 10.1016/S0269-7491(97)00099-7
Strickland, J. D. H., and Parsons, T. R. (1972). A Practical Handbook of Seawater Analysis. Ottowa, Canada: Fisheries Research Board of Canada.
Stutter, M., Dawson, J. J. C., Glendell, M., Napier, F., Potts, J. M., Sample, J., et al. (2017). Evaluating the use of in-situ turbidity measurements to quantify fluvial sediment and phosphorus concentrations and fluxes in agricultural streams. Sci. Total Environ. 607–608, 391–402. doi: 10.1016/j.scitotenv.2017.07.013
Tappin, A. D., Navarro-Rodriguez, A., Comber, S. D. W., and Worsfold, P. J. (2018). The role of alkalinity in setting water quality metrics: phosphorus standards in United Kingdom rivers. Environ. Sci. Process. Impacts 20, 1361–1372. doi: 10.1039/C8EM00262B
Thomas, I. A., Mellander, P. E., Murphy, P. N. C., Fenton, O., Shine, O., Djodjic, F., et al. (2016). A sub-field scale critical source area index for legacy phosphorus management using high resolution data. Agric. Ecosyst. Environ. 233, 238–252. doi: 10.1016/j.agee.2016.09.012
Thompson, J., Cassidy, R., Doody, D. G., and Flynn, R. (2014). Assessing suspended sediment dynamics in relation to ecological thresholds and sampling strategies in two Irish headwater catchments. Sci. Total Environ. 468, 345–357. doi: 10.1016/j.scitotenv.2013.08.069
UKTAG (2013). Updated Recommendations on Phosphorus Standards for Rivers; River Basin Management 2015-2021. U.T.a.G.O.T.W.F. Directive.
Ulén, B., Geranmayeh, P., Blomberg, M., and Bieroza, M. (2019). Seasonal variation in nutrient retention in a free water surface constructed wetland monitored with flow-proportional sampling and optical sensors. Ecol. Eng. 139, 105588. doi: 10.1016/j.ecoleng.2019.105588
Wade, A. J., Palmer-Felgate, E. J., Halliday, S. J., Skeffington, R. A., Loewenthal, M., Jarvie, H. P., et al. (2012). Hydrochemical processes in lowland rivers: insights from in situ, high-resolution monitoring. Hydrol. Earth Syst. Sci. 16, 4323–4342. doi: 10.5194/hess-16-4323-2012
Webb, B. W., Phillips, J. M., Walling, D. E., Littlewood, I. G., Watts, C. D., and Leeks, G. J. L. (1997). Load estimation methodologies for British rivers and their relevance to the LOIS RACS(R) programme. Sci. Total Environ. 194–195, 379–389. doi: 10.1016/S0048-9697(96)05377-6
Weiner, D., Bloomer, J., Ó., Conchúir, R., and Dalton, C. (2022). The role of volunteers and citizen scientists in addressing declining water quality in irish river catchments. Citizen Sci. Theory Pract. 7, 13. doi: 10.5334/cstp.447
Westerhoff, R., Mcdowell, R., Brasington, J., Hamer, M., Muraoka, K., Alavi, M., et al. (2022). Towards implementation of robust monitoring technologies alongside freshwater improvement policy in Aotearoa New Zealand. Environ. Sci. Policy 132, 1–12. doi: 10.1016/j.envsci.2022.01.020
Wolfram, J., Stehle, S., Bub, S., Petschick, L. L., and Schulz, R. (2021). Water quality and ecological risks in European surface waters – monitoring improves while water quality decreases. Environ. Int. 152, 106479. doi: 10.1016/j.envint.2021.106479
WWT Online (2013). Final Effluent Monitors Protect Treatment Efficiency. UK: Waste Waster and Treatment. Available online at: https://wwtonline.co.uk/features/final-effluent-monitors-protect-treatment-efficiency (accessed September 20, 2019).
Keywords: water quality, behavioral change, high resolution data, monitoring, rivers
Citation: Jordan P and Cassidy R (2022) Perspectives on Water Quality Monitoring Approaches for Behavioral Change Research. Front. Water 4:917595. doi: 10.3389/frwa.2022.917595
Received: 11 April 2022; Accepted: 07 June 2022;
Published: 01 July 2022.
Edited by:
Thad Scott, Baylor University Medical Center, United StatesReviewed by:
Marcela Brugnach, Basque Centre for Climate Change, SpainPatrick Thomson, University of Oxford, United Kingdom
Copyright © 2022 Jordan and Cassidy. This is an open-access article distributed under the terms of the Creative Commons Attribution License (CC BY). The use, distribution or reproduction in other forums is permitted, provided the original author(s) and the copyright owner(s) are credited and that the original publication in this journal is cited, in accordance with accepted academic practice. No use, distribution or reproduction is permitted which does not comply with these terms.
*Correspondence: Phil Jordan, cC5qb3JkYW5AdWxzdGVyLmFjLnVr