 Joshua K. Roundy
 Melissa A. Gallagher
 Jenny L. Byrd
- 1Department of Civil, Environmental, and Architectural Engineering, University of Kansas, Lawrence, KS, United States
- 2Department of Curriculum and Instruction, University of Houston, Houston, TX, United States
- 3Department of Civil Engineering, University of Louisiana at Lafayette, Lafayette, LA, United States
The interaction between climate and the hydrologic cycle is complex due to intricate feedback mechanisms that can have multiple impacts on key hydrologic variables. Under a changing climate, it is becoming increasingly important for undergraduate engineering students to have a better understanding of climate and the hydrologic cycle to ensure future engineering systems are more climate resilient. One way of teaching undergraduate students about these key interactions between climate and the hydrologic cycle is through numerical models that mimic these relationships. However, this is difficult to do in an undergraduate engineering course because these models are complex, and it is not feasible to devote class time and resources to teaching students the knowledge base required to run and analyze these numerical models. In addition, the recent COVID-19 pandemic required a rapid change to flexible teaching methods that can be implemented in online, hybrid, or in-person courses. To overcome these limitations, a backward design and constructive alignment approach was used to develop an active learning module in the HydroLearn framework that allows students to explore the connection between snow processes and streamflow and how this will change under different climate scenarios using numerical models and analysis. This learning module provides learning activities and tools that help the student develop a basic knowledge of snow formation and terminology, snow measurements, numerical models of snow processes, and changes in snow and streamflow under future climate. This module is particularly innovative in that it uses Google Colabs and an interactive user interface to facilitate the students' active learning in an environment that is accessible for all students and is sustainable for continued use and adaptation. This paper describes the approach, best practices and lessons learned in developing and implementing this active learning module in a remote and in-person course. In addition, it presents the results from motivation and student self-assessment surveys and discusses opportunities for improvement and further implementation that have implications for the future of hydrologic education.
Introduction
In a warming world, the frequency and patterns of precipitation have the potential to change due to changes in global circulation that may cause some areas of the world to see increases in drought and other areas to see increases in floods. In a warming climate, changes in atmospheric circulations patterns will lead to poleward displacement of storms that can produce subtropical dry zones (Marvel and Bonfils, 2013) and an enhancement of the rainfall response to El-Nino Southern Oscillation (ENSO) which amplifies rainfall extremes (Bonfils et al., 2015). The interaction between climate and the hydrologic cycle are complex due to intricate feedback mechanisms that can have varied impacts on key hydrologic variables in space and time. One area of the hydrologic cycle that is particularly sensitive to climate variability is seasonal snow pack. There has been extensive research showing changes to seasonal snow pack characteristics under a warming world. This includes less winter precipitation falling as snow, migration of snow pack to northern latitudes, changes in the timing and magnitude of spring peak runoff, and the intensification and increase in length of snow droughts (Barnett et al., 2005; Demaria et al., 2016; Huning and AghaKouchak, 2020). These feedbacks between climate and the hydrologic cycle will cause strain on existing water resources and water infrastructure and will be a generational challenge for future engineers. Therefore, it is becoming increasingly important for undergraduate engineering students to have a better understanding of climate and the hydrologic cycle to ensure future engineering systems are more climate resilient.
One way of teaching undergraduate students about these key interactions between climate and the hydrologic cycle is through measurements of key hydrologic variables and through numerical models that mimic these relationships through mathematical equations. Models allow students to test simple hypotheses and modify the assumed relationship between variables to determine the outcome. This exploration of the hydrologic cycle takes on real world meaning when the numerical models are validated and analyzed with key hydrologic variables such as streamflow, precipitation, and snow in order to assess and evaluate the extent to which the model mimics reality. This provides students with an intuitive way to learn how different processes interact within the hydrologic cycle and gives students an opportunity to actively explore parts of the hydraulic cycle and its interaction with climate. Yet, teaching students how to explore models and evaluate their ability to answer specific questions using real world data is not easily achieved (Lane et al., 2021).
Research has shown that active learning increases student performance on examination and concept inventories over traditional lecturing in Science, Technology, Engineering and Mathematics (STEM) fields (Freeman et al., 2014). Merck et al. (2021) showed that an active learning module allowed students to take part in the modeling process while helping students understand the mathematical models and develop their skill set. Specifically, within the hydrologic sciences, there has been a lot of work in creating online active learning modules to foster deeper conceptual knowledge of the students through a learning platform called HydroLearn (www.hydrolearn.org; Gallagher et al., 2021).
HydroLearn is a web-based platform that was developed with the primary purpose of supporting hydrology and water resources instructors in finding, adapting, and creating learning modules that integrate authentic problems, instructional content, real data, and modeling resources to create an active learning environment for students. More than just a repository for instructional materials, the modules housed within HydroLearn go through a rigorous development and review process based on research in curriculum design (Gallagher et al., Accepted). Modules include Development of Design Storms, Quantifying Runoff Generation, Developing Storm Inflow and Outflow Hydrographs, Culvert Design Using HEC-RAS, Physical Hydrology, and Detention Basin Design (Gallagher et al., 2021; Lane et al., 2021; Merck et al., 2021). All modules on the HydroLearn platform are freely available to students and instructors.
Even though online active learning modules have been shown to be an effective way to teach students new skills and deeper understanding of the subject, it is also important to recognize that technology and decisions relative to model selection can still be a barrier to student learning (Merck et al., 2021). Difficulties arise because models are complex and require a large amount of input data and a prior familiarity with running numerical models and using computer programming. Even after running the model, there is still a significant level of expertise needed to process and analyze the model results. While developing these technical computational skills can be an important part of students' education, it is not feasible to devote class time and resources to teaching students the knowledge base required to run and analyze numerical models in a course that is not focused on numerical analysis. As such, using coding-based solutions can sometimes lead to too much focus on the tools and syntax of implementing the module activity that limit the student's ability to explore the fundamental process (Lane et al., 2021). To help address this, we developed an active learning module using Jupyter Notebooks that allows students to explore the connection between numerical snow models and climate. The motivation for using Jupyter Notebooks is to strike a balance between a “black box” standalone applications and open access code development (Peñuela et al., 2021). The advantage of using a “black box” application is that students do not get lost in the coding and therefore are able to focus on utilizing the tools to solve the authentic problem. However, the downside is that the underlying codes and assumptions are not readily available and cannot be changed. In using widgets within Jupyter Notebooks, the module provides the students with a simple and intuitive way of analyzing the data without the requirement of needing to understand and manipulate computer code. At the same time, the computer code is readily available and can be manipulated or changed by the instructor or advance student to further develop and explore the data and the model. In this way, Jupyter Notebooks provide a flexible framework that is effective for both the instructor and the students. The purpose of this paper is to share how this active learning module was designed, as well as lessons learned from implementing it in an undergraduate class in order to add to the knowledge base in the field regarding the design of active learning modules. This work was also highly motivated by the COVID-19 pandemic and the sudden need for flexible teaching methods that utilize best practices and can be implemented for both in-person, hybrid and online courses. The remainder of this paper discusses the development of the Snow and Climate Module (Section Module development), the effectiveness of the module (Section Module effectiveness) and lessons learned from its implementation (Section Lessons learned).
Module development
The Snow and Climate Module (SCM) includes five sections. Each of the sections of the module are discussed following the same design structure of the module which includes an Overview (2.1), Snow Basics (2.2), Snow Measurements (2.3), Snow Modeling (2.4), and Snow and Climate (2.5). While this paper discusses the development of the module, the reader is strongly encouraged to explore the module itself at https://edx.hydrolearn.org/courses/course-v1:KU+CE552+Fall2021/about. Most of the module content can be explored without registering for an account, however, the “Check Your Understanding” activities can only be viewed by registered users.
Overview
The first section of the SCM discusses and presents the learning outcomes and objectives. The SCM was developed using a backwards design approach (Wiggins and McTighe, 2005), which means it starts with the learning outcomes and then the content is developed based on helping the student to achieve the learning outcomes. The SCM as a whole has four learning outcomes which are given below.
Given examples of various aspects of snow physics and snow dynamics, students will display a technical vocabulary of snow science and snow measurements.
Given snow measurements, the student will be able to analyze the difference in snow measurements and monthly and annual relationships between snow depth, Snow Water Equivalence (SWE), and streamflow at two locations in the US.
Given simulated snow estimates, the student will be able to contrast modeled and observed snow relationships while considering uncertainty.
Given simulated snow estimates based on projected climate, the student will be able to analyze the temporal change in snow due to climate projections and develop recommendations that consider uncertainties in the snow model and changes in climate.
While these outcomes are listed in the order they are presented in the module, it is important to note that in the backwards design approach, outcome 4 was the primary outcome identified and then outcomes 3, 2 and 1 were developed to support the achievement of outcome 4. This approach provides an intuitive progression of knowledge through the module that culminates with achieving the main learning objective.
While the structure of the module is driven by the learning outcomes, this module was also designed to be an active learning module. To help facilitate active learning within the module, the module learning outcome is presented to the students in the form of a problem and is the first thing presented in the module. The motivating problem for the module is given below.
“You work for a consulting company and one of your clients is expanding their snow centered business across the US and is interested in knowing how climate change will impact snow and streamflow in the intermountain west and the northeastern United States. They have hired you to project likely changes in future snow depth, snow duration and streamflow under climate change. The client would like your analysis presented in a report that analyzes the change in snow and streamflow for two 30-year periods (1991–2020 and 2021–2050) and includes a description of snow measurements, snow models, and climate projections used in the analysis and their associated uncertainties.”
In summary, after the first section the students have been given a problem that will help facilitate active learning and are given a road map of how they will learn the necessary knowledge and skills to complete the project and achieve the learning outcome.
Snow basics
This section of the module provides the foundational knowledge that is imperative for students to be able to begin to understand the snow-climate relationship. This section of the module introduces a wide range of snow-related science and terminology, including snowflake formation, types of snow, and snow meteorology. There are three main learning objectives associated with this section.
• The student will be able describe the characteristics and properties of snowflake formation.
• The student will be able to describe some of the meteorological processes that create snow, including, orographic effect, weather bombs, atmospheric rivers, and lake effect snow.
• The student will be able to identify key terminology related to snow types and climate from definitions from the National Snow and Ice Data Center.
The content in this section is presented using a variety of text, videos and activities to help the students check their level of understanding of the content. These activities are a nice way to keep the student engaged and actively learning in an online format. These activities include, true or false questions, multiple choice questions, and drag and drop matching. An example of one of these learning activities is shown in Figure 1, which shows the drag and drop activity associated with section Snow modeling in the module designed to facilitate student learning of snow terminology. All of these activities provide feedback to the students and the students are allowed to redo the activities as much as they like.

Figure 1. An example of a drag and drop learning activity in Section Snow Modeling in the module focused on facilitating learning and retention of key snow terminology.
Snow measurements
The snow measurements section of the module introduces the students to the various methods and agencies involved in snow measurement and provides an active learning opportunity for the student to analyze snow measurements at two locations in the U.S. This section has four learning objectives that are given below.
• The student will develop a technical vocabulary to describe snow states and measurement.
• The student will be able to describe how to dig and make measurements in a snow pit.
• The student will be able to describe how regular measurements of snow are made including SNOTEL and Snow Course monitoring network and where to access the data.
The student will be able to analyze snow measurements to assess the difference in snow measurements and monthly and annual relationships between snow depth, SWE, and streamflow at two locations in the US.
Like the previous section of the learning is done through a series of videos, text and learning activities that help the students understand the vocabulary and process of making snow measurements, but it also provides an opportunity for the students to analyze real snow measurements from two locations in the U.S. This is accomplished by using Google Colabs and programming a front-end user interface in python using the ipywidgets library which creates interactive HTML widgets within a Jupityer notebook. The way this technical activity is incorporated into this learning activity is one of the unique and innovative aspects of this module. A Jupyter Notebook is a combination of text and code within a single file. Google Colab provides the server on which the interface is run and is free and accessible for anyone with a google account. This setup provides a nice way to have all students running in a consistent computing environment that is easily accessed through a web browser. The notebook framework also provides a means to include formatted text alongside the computer code to provide a clear and easy to follow directions for the learning activity.
The Jupyter Notebooks used in SCM are designed to be used by anyone and require no prior knowledge of Python programming. This is achieved by making the Notebooks self-contained and self-initiating through detailed instructions, figures and code that automates setup and configuration of the user interface. This translates to the user only seeing a couple lines of code, while the backend of the learning activity is written in the Python programming language and consists of thousands of lines of code that set up the user interface and allows the students to explore the data and generate figures that can be used to complete the activity. Specifically, the first code block downloads the data and the user interface code and sets up the directory structure. This code can be run by simply pushing the run button in the top-left corner of the code block. Once the data is downloaded the student can move to the next section and run another code block that only has two lines of code, which generates the user interface. Figure 2 shows the first section of the snow measurements activity which includes a brief introduction that is followed by a description of setup and a small three-line code block that downloads the backend code and data and sets up the environment and directory structure. The code block can be run by clicking on the play button. The snow measurement activity includes four different interfaces that allows the students to explore snow depth, SWE and streamflow at the two measurement locations. These activities include (1) analyzing the daily timeseries of snow depth and SWE values, (2) analyzing the monthly timeseries of snow depth, SWE and streamflow, (3) analyzing the monthly relationship between snow depth, SWE and streamflow using scatter plots and (4) analyzing the annual relationship between snow depth, SWE and streamflow through scatter plots. In each of these activities the student has the option to save the figure as a PNG file for use in their report. This learning activity provides a simple and effective way for a student to explore snow measurement data without needing a technical background in data analysis.
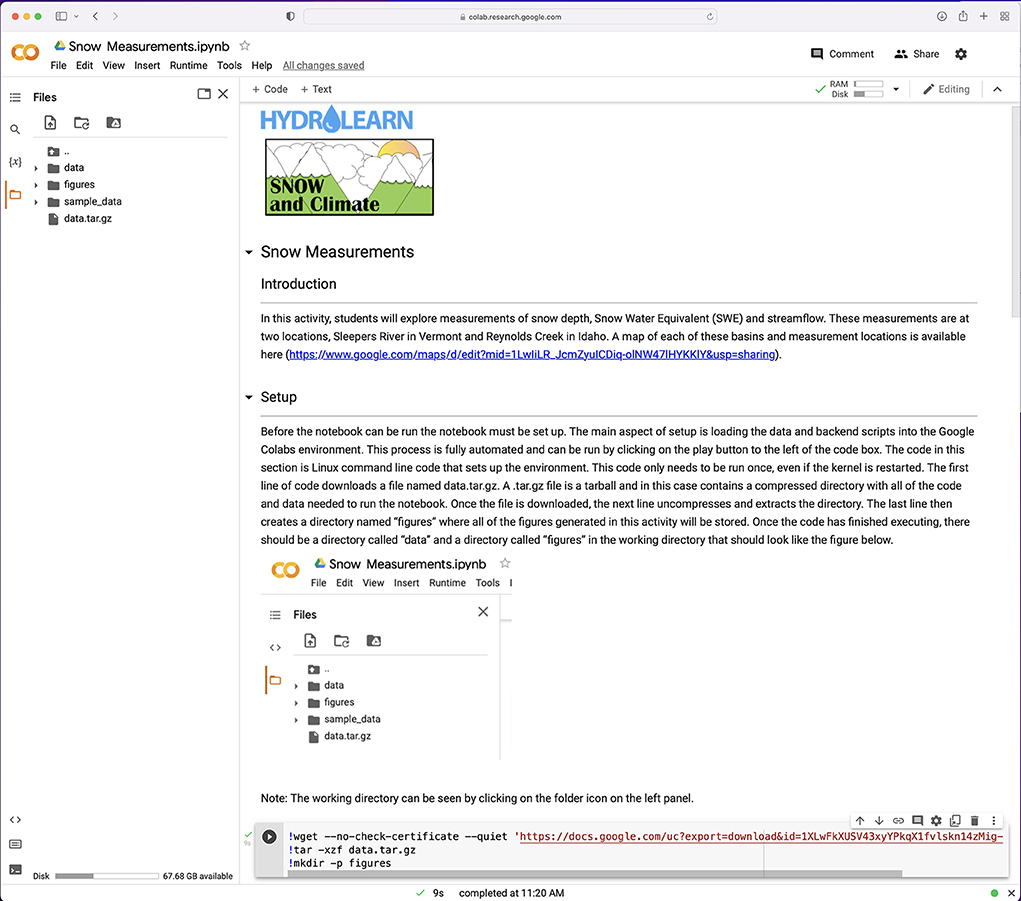
Figure 2. The first section of the learning activity for the snow measurement active learning module. This section includes a brief introduction, a description of how the notebook is set up and a small code block that downloads the backend code and data and sets up the environment and directory structure so that the activity can be easily run through an internet browser.
Snow modeling
The Snow Modeling section introduces the students to modeling snow accumulation, snow melt, streamflow, the importance of parameter estimation and the uncertainty associated with inputs, parameters, and model structure. There are six learning objectives in this section and include:
• The student will be able to describe the need for snow modeling.
• The student will be able to analyze model uncertainty.
• The student will be able to analyze model performance.
• The student will be able to list the key components of snow models.
• The student will be able to demonstrate the relationship of snow properties and streamflow in models.
• The student will be able to contrast modeled and observed snow relationships while considering uncertainty.
Just like previous sections, the content includes text, figures and videos that help the students learn about snow modeling. In the first section, students learn about numerical modeling, uncertainty and the importance of model validation and ways of assessing models through statistical summary measures such as the Nash Sutcliffe Efficiency (NSE) and the Kling-Gupta Efficiency (KGE; Gupta et al., 2009). This section ends with a series of True and False questions and a drag and drop activity to check the student's level of understanding. The next section introduces the snow model structure and includes a section on snow accumulation and snowmelt. Only one model for snow accumulation is presented but three different models are presented for snow melt. This includes the Temperature Index Model, Hybrid Model, and Energy Balance Model. Each of these three snowmelt models have varying levels of complexity and together provide a way for students to explore the impact of different model structures on the model outputs. The next section discusses model inputs or driving variables needed to run the snow models and different sources of these inputs. The different inputs provide another way for the students to actively understand the uncertainty and sensitivity of having different model inputs on the model outputs. The next section then focuses on identifying the key parameters in the snow accumulation and snowmelt models and discusses the importance of parameter estimation. This is then followed by three questions where students can apply what they have learned by using the three snowmelt model equations to estimate the snowmelt for a particular day. The snow modeling section then ends with a learning activity where the students get to run and analyze the snow models at the two study sites. The first part of this section provides some background information about the hydrologic model used with the snow model for this activity and includes a brief discussion of other processes such as infiltration, evaporation, and streamflow routing that are included in the hydrologic model. The learning activity is structured the same as the previous activity in that it is a self-contained Jupyter Notebook that seamlessly downloads the model and data and sets up the environment, directory structure, and each of the four individual learning components. The first learning component of the activity allows the students to explore the uncertainty in the model structure, inputs, and parameters by changing the snowmelt model, the input data and key parameters and see how these changes impact the snow depth, SWE, and streamflow from the model through an interactive user interface. The next part of the learning activity allows students to run different models and compare the models with observations to facilitate selecting a model that they think is best. An example of this is shown in Figure 3. Once the students have selected and run their model of choice, they can then do a detailed comparison between their model and the observed snow depth, SWE and streamflow using monthly and annual statistics in the last two sections. Just like the previous activity, students can download images they create to include in their report.
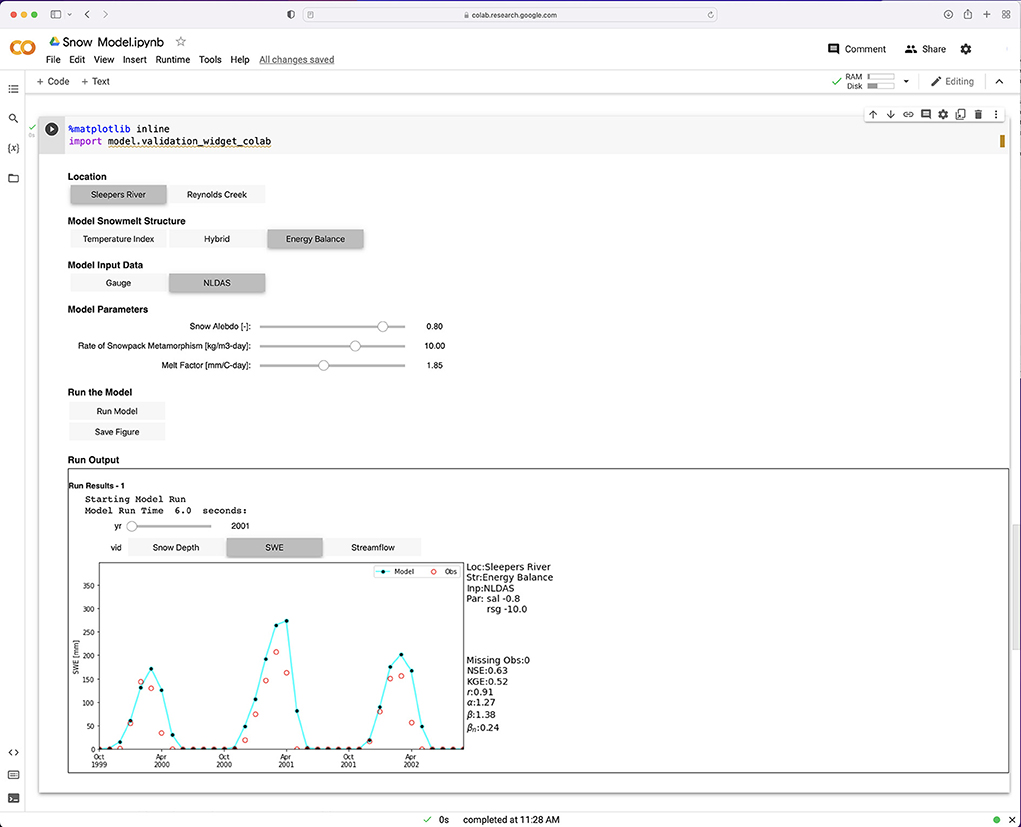
Figure 3. An example of a learning activity in the SCM that allows students to run different models and compare the model with observations in order to facilitate selecting a model that they will use for the final report.
Snow and climate
The Snow and Climate section introduces the students to climate modeling, the concept of downscaling climate models, using statistical tests to quantify statistically significant differences between two periods and analyzing temporal changes in snow due to climate. The five learning objectives for this section of the module are given below.
• Develop a technical vocabulary to describe climate models.
• Describe the downscaled climate model outputs used in the snow model.
• Utilize a difference in the means test to assess the statistical significance of model data over two different climate periods.
• An analysis of the temporal change of snow due to climate projections.
• Recommendations that are backed by both observations and models and that considers uncertainties in the snow model and changes in climate.
The same format of including text, figures, and videos is used in the final section of the module. The first part of this section uses several videos and figures to introduce the students to climate models and some of the key terminology. It also explicitly introduces the five climate models that will be used in the final learning activity. Next the module teaches the students about downscaling outputs from climate models and why it is important. The next section introduces using a difference in the means test to assess if there is a statistically significant difference in snow or climate variables between two periods. This is then followed by a series of questions to help students check their understanding. Like other learning activities throughout the module, students can complete these questions as many times as they need to ensure that they understand the key concepts. Lastly, the final learning activity is introduced using text and demonstration video. As with the other major learning activities, this last activity uses a self-contained Jupyter notebook to download the code and data needed to set up and configure the different components of the learning activity. This final learning activity includes three sections. The first section allows the student to explore the climate input data (Precipitation, Temperature, Humidity, Wind, Pressure, Shortwave Radiation, and Longwave Radiation) to the snow model by analyzing a timeseries from 1991 to 2050. In addition to downloading the figure, the students also have the option of downloading the data to a csv file so that they can perform statistical tests to determine which input variables show a significant change between the average value over the base period (1991–2020) and future climate (2021–2050). In the next section of the learning activity, the students can run the snow model from 1991 to 2050 using the climate forcing they explored and using the model structure and parameters that they identified in the snow modeling section. Once the students have run their snow model, they can download and analyze the changes in annual statistics of snow depth, SWE and streamflow using a difference in the means tests as well as using the figures generated in the final section of the learning activity. An example of this user interface is shown in Figure 4 which allows the students to explore the data and utilize the knowledge they gained in the module to complete the main objective in the form of a report that includes figures and analysis from all of the learning activities.
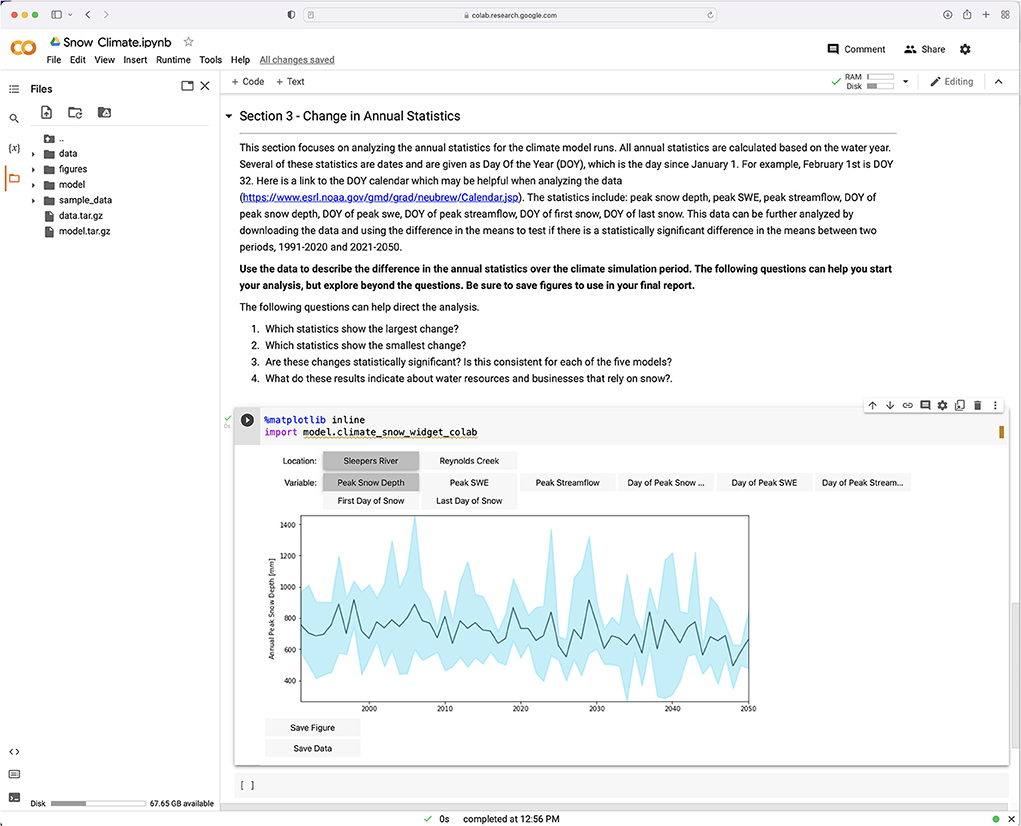
Figure 4. An example of the learning activity where students get to explore the change in the snow model outputs due to projected climate from 1991 to 2050. This final activity provides an opportunity for the students to apply the knowledge they gained throughout the entire learning module and complete the main objective.
Module effectiveness
Data collection
To determine the effectiveness of the module, we collected and analyzed data regarding students' self-assessed learning gains and their motivation for learning before implementing the module (pre) and immediately after (post). We then analyzed these data to see if there were statistically significant changes from pre to post. Additionally, students were given the choice of completing the module independently or in groups and so we also chose to analyze the data to see if there were statistically significant differences from pre to post for students who completed individually as compared to those who completed in groups.
Course description
The SCM was implemented in a senior design course at a mid-western university during the COVID-19 pandemic in 2020 and 2021. The senior design course requires students to have taken a course in both Fluid Mechanics and Hydrology. In 2020 there were 47 students enrolled in the course and in 2021 there were 53. Both courses took place during the COVID-19 pandemic and due to involving regulations in the classroom the learning environment was different for each year. In 2020, the module was implemented during the last 2 weeks of the course which were after the Thanksgiving break and University regulations required that all content be online to reduce transmission from students traveling for the holiday. Therefore, the students in 2020 worked on the module individually and it was implemented as a fully online course even though the course was hybrid before the break. In contrast, in 2021, the course was back to normal in-person delivery with the only regulations being that masks were required in the classroom. For consistency, the SCM was implemented during the last 2 weeks of the semester which again occurred after Thanksgiving break. However, in 2021 students were given an option to complete the module individually or in a group. Students who completed the module individually did it at their own pace and were not required to attend class during the module portion of the class. In this sense the individual students completed the module similar to what would be expected in an online course. The students who chose to work in groups were required to attend class and work with their groups on the learning activities. The group size ranged from 2 to 3 students. The group work format is consistent with the learning style of the course. Even though students were allowed to self-select between working individually or with a group, it was a fairly even separation with 31 students choosing to work individually and 22 students selecting to work in groups.
All students in the class, both semesters, were invited to participate in the study and 33 consented to participate and had complete data. Of the participants, 61% (n = 20) identified as male and 85% (n = 28) identified as White.
Student-assessment of their learning gains
The Student Assessment of their Learning Gains (SALG) survey was created in 1997 and has continually been upgraded to promote greater clarity, consistency of language, ease of student comprehension, and to make the instrument adaptable enough to suit different disciplines and learning objectives (Seymour et al., 2000). We modified the SALG survey used in this study to align with the learning objectives of the SCM. Students participated in the SALG survey at two-time points, as they were introduced to the module (pre) and after completing their final assignment (post). The survey consists of two parts that ask students to report their understanding of concepts and their proficiency in using technical skills pertaining to the module. The concepts items begin with, “Presently I understand the following concepts that will be explored in this module…” followed by items representing key concepts from the module. For example, in the Snow and Climate module, one concept item is “Snow terminology.” The skills portion follows the concepts portion of the survey. The skills statement begins with, “Presently, I can…” followed by items representing the skills students learn using the module. An example of a skills item is, “Use Jupyter notebooks.” Students rank each item on a 6-point Likert scale that ranges from 1-Not applicable to 6-A great deal. See Supplemental Materials for the full Likert scale and a list of the concepts and skills items for the Snow and Climate module.
Motivated strategies for learning questionnaire
Motivation is a key predictor of student learning (Caldwell and Obasi, 2010; Bong et al., 2012; Torenbeek et al., 2013). In particular, students can be extrinsically motivated by grades, rewards, or other external factors or they can be intrinsically motivated by their own interest in a subject or a personal desire to learn the content. Intrinsic motivation has been found to be a stronger predictor of student learning, as students are more able to use that internal motivation to persevere through challenges. The SCM was purposefully designed around an authentic problem to pique students' interest. Thus, we hypothesized that students would feel greater intrinsic value toward this problem as compared to traditional instruction. Additionally, students' motivation is also affected by their self-efficacy, their belief in their own ability to be successful (Schunk, 1989; Parker et al., 2014). The content in the SCM was carefully created to support students to be able to successfully complete the authentic problem by considering exactly what concepts and skills students would need exposure to before being asked to solve this problem. We hypothesized that these supports would enhance students' self-efficacy.
In addition to being purposefully designed to be motivating for students, the SCM also required students to engage in self-regulated learning. Self-regulated learning requires students to be proactive in determining what they know and do not know, and seeking out the support they need to master new content (Zimmerman, 1990). Students who are self-regulated use specific cognitive strategies, such as organizational strategies (Pintrich and de Groot, 1990). The SCM includes text, videos, and questions that support students' learning if those students are self-regulated and choose to take advantage of them. Therefore, students' success with the module depends on their ability to self-regulate and use cognitive strategies. We hypothesized that engaging with this module would support students' self-regulation skills and cognitive strategy use.
The Motivated Strategies for Learning Questionnaire (MSLQ) measures students' motivational beliefs and self-regulated learning strategies (Pintrich and de Groot, 1990). The survey consists of five factors, four of which we used in this study: self-efficacy, intrinsic value, cognitive strategy use, and self-regulation. The original MSLQ also contains a factor for measuring test anxiety; however, we chose to omit this scale because it does not apply to the SCM.
The two factors related to motivational beliefs are self-efficacy and intrinsic value. The self-efficacy scale has nine items that measure perceived confidence and ability in classwork performance (e.g., “My study skills are excellent compared with others in this class.”). Intrinsic value, which includes nine items, refers to a student's intrinsic interest in and perception of the relevance of coursework, as well as a desire for challenge and goal mastery. An example item is, “Understanding this subject is important to me.” Self-regulated Learning Strategies comprises two scales: cognitive strategy use and self-regulation. Elaboration strategies such as summarizing and paraphrasing, rehearsal strategies, and organization strategies are examples of cognitive strategy use. One example of the 13 items is, “When I study, I put important ideas into my own words.” Finally, self-regulation relates to students' planning, scanning, cognitive monitoring, perseverance, and dedicated effort on difficult or tedious tasks and includes (nine items. An example of a self-regulation scale item is, “I ask myself questions to make sure I know the material I have been studying.”
In total, students responded to 52 items that measure these four scales. We calculated each scale by taking the mean score of students' responses to items from each category. The order of survey items was randomized, and students ranked these items on a seven-point Likert scale (1 = not true of me at all to 7 = very true of me). The MSLQ used in this study is included in the Supplementary Materials Section.
Data analysis
We first conducted six paired samples t-tests to determine if there were statistically significant differences from pre to post on the two components of the SALG (i.e., the concepts and skills presented in the Snow and Climate module) and on the four factors of the MSLQ (i.e., self-efficacy, intrinsic value, cognitive strategy use, and self-regulation). We used paired samples t-tests to account for the dependence of observations (i.e., one student's scores from pre to post; Warner, 2012). To determine if there were statistically significant differences from pre to post based on whether the students chose to work independently or in groups, we first computed gain scores for each student and then examined two analyses of variance (ANOVAs), one each for gain scores on SALG concepts and SALG skills. We first examined the assumption of normality by examining histograms of all variables. All appeared normally distributed.
Results
Overall
On the SALG survey, we found statistically significant improvements for students in both concepts, t(47) = 15.05, p < 0.001, with a large effect size Cohen's d = 0.83 (Cohen, 1988), and skills, t(47) = 9.94, p < 0.001, with a large effect size Cohen's d = 0.74 (see Table 1). These findings suggest that not only did students improve in their self-reported learning of the concepts and skills in the module (which would be expected), but that the module had a very large effect on their learning, as indicated by the large effect sizes.

Table 1. Means, standard deviations, and sample size on the SALG and MSLQ factors from the student assessment.
With regard to students' motivation for learning, we found no statistically significant changes from pre to post. There are several possible explanations for this lack of change. It could be that undergraduate students' self-efficacy, intrinsic value, cognitive strategy use, and self-regulation are fairly fixed, it could be that the module did not target these specific aspects of students' motivation, or it could be that because the timing of the post administration of the survey was on the final day of class and students were not feeling motivated.
Individual vs. group
When we tested whether there were statistically significant differences in the gain scores (computed by subtracting pre scores from post scores) between the two groups of students (i.e., those who chose to complete the module individually vs. those who chose to complete it in groups), we found no statistically significant differences for gain in concepts, p = 0.39 (see Table 2). However, we did find statistically significant differences for skills, F(1, 46) = 4.27, p < 0.05, partial eta2 = 0.09 a medium effect size (Cohen, 1988). These findings suggest that students who chose to complete the SCM in groups self-reported a greater gain in skills as compared to those who chose to complete the module individually.
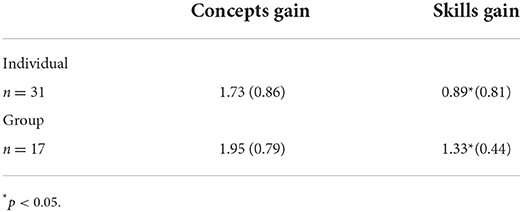
Table 2. Means, standard deviations, and sample size on the SALG gain scores for individuals vs. groups.
Lessons learned
In implementing the SCM in the classroom for a senior design course in Civil and Environmental Engineering majors there were several lessons learned. First, the interactive and self-contained nature of the SCM received an overwhelming positive response from the students. This was qualitatively assessed by a discussion period on the last day of the class where the students took the post survey and after the survey there was a general discussion about the module. One of the specific comments from the students was that they appreciated the change of pace and the freedom to complete the assignment either individually or in a group. This flexibility allowed students to choose the learning method that worked best for them. From an instructor point of view, this flexibility in implementation was greatly appreciated especially during 2020 when the University required that the last 2 weeks of the course be fully online. With the sudden switch to online, it was relatively simple to adapt the SCM to an online format. The overall flexibility for the students and the instructor is one of the main advantages of developing course content using the Hydrolearn platform.
Overall, students appreciated the fact that they did not need to manipulate or write computer code in order to complete the activities, however, there were still some technical challenges. One of the quirks with using the embedded widgets within a Jupyter Notebook is that it can sometimes glitch and the widget can crash. When this occurs, the widget cannot be fixed by simply reloading the widget, but the Notebook environment needs to be restarted and then the widget can be reloaded. Restarting the Notebook does not erase the underlying data that was generated by the student, but it can disrupt the workflow and was only a mild inconvenience for most. However, for a few of the students who worked individually this glitch in the widget kept them from finishing the module, despite the fact that instructions for fixing the glitch were provided within each of the Jupyter Notebooks and discussed in class before the students started their individual work. This problem was only seen for students that worked individually, as those who worked in groups were more likely to ask group members or the professor about this issue when they ran into this while working with the module. When students were asked about trouble shooting this error, most had forgotten that it was discussed and did not bother to read the instructions in the Jupyter Notebook file. This indicates that more effort needs to go into clearly directing students on how to troubleshoot the activity when they run into an issue. One way this could be done is to include a section in the Notebook that is specifically labeled troubleshooting so that students know exactly where to look when encountering problems with the activity.
Another major finding from this study is that students reported large gains in their conceptual understanding and technical skills after participating in the SCM. Such large effect sizes (concepts, d = 0.83, skills, d = 0.74) far exceed the average effect size in education research (d = 0.40; Hattie, 2009) and suggest that this module may be particularly impactful on students' acquisition of these concepts and skills. These gains in concepts and skills mirror gains found for undergraduates completing other HydroLearn modules (Byrd et al., under review). Additionally, given that this module takes only 2 weeks to complete, these findings suggest considerable learning in a short time. We also found that the students who chose to complete the SCM in groups gained more in skills as compared to those who chose to complete the module individually. Because of the small sample size and research design, we cannot infer causality from these findings (i.e., we cannot infer that working in groups impacted students' learning of skills). It may be that students who were more likely to gain skills were also those more likely to self-select into groups. It may also be that the additional time in class working with their groups enabled these students to learn more skills. Nevertheless, these findings are interesting and warrant further investigation.
This module also demonstrates the effectiveness for creating active learning modules to teach key concepts of the hydrologic cycle and has the potential to be expanded to include further components of the hydrologic cycle and the impact of a changing climate on engineering design. One way this could occur is to expand the module to include other key components of the hydrologic cycle such as rainfall, soil moisture, evaporation, streamflow and groundwater. In fact, several HydroLearn modules on these subjects already exists and could easily be integrated together to create a semester long course specifically focused on the hydrologic cycle. Furthermore, there are also several ways that the existing SCM could be expanded to provide a more complete coverage of the many impacts of snow on engineering design and how it may evolve under climate change. One such addition would be considering the impact of changes to snowpack on the water supply by adding a reservoir component to the module so that students can assess water storage and the impact of climate change. The module could also be expanded to include further analysis on the impact of snow on scheduling and carrying out of engineering works. The SCM module could also be expanded to include a broader set of statistical tools such as trend analysis and time series decomposition in order to provide students with greater set of tools that would have broader impacts for engineering design.
Another lesson learned is that the development of this active learning module was a significant time investment. The majority of the time was spent developing the Jupyter Notebook widgets and the backend codes that integrated the snow models with the simple hydrologic model and the climate simulations. However, since these codes are freely available, they can be used as a basic framework for implementing new and extensions modules. Thus, making the development of another module similar to the SCS significantly less time consuming. Furthermore, the significant time investment required to create an active learning module in general, further emphasizes the importance and necessity for a curriculum sharing web-based platform like HydroLearn. While an individual may invest a large amount of time in creating a module, the overall benefit of those efforts will be justified if the module is utilized in many courses around the world. This sharing of content also provides a means of standardizing best practice and facilitating new ideas into the broader hydrologic curriculum. In this vein, the authors welcome suggestions, bug reports and additional expansion ideas as others implement the module into their own curriculum.
Overall, this work shows that complex and data intensive model applications can successfully be brought into undergraduate courses through Jupyter Notebooks and Google Colabs without requiring students to edit or write computer code or create complex computing environments to run models. This provides students with a unique learning opportunity to expand their knowledge of the hydrologic cycle and its interaction with climate. While this work used both in-situ measurements and climate model simulations to create the learning activities, the underlying hydrologic model is very basic and is only a simple teaching model based on roughly connecting key components of the hydrologic cycle. In the future, these applications should include models that have undergone years of model development and continue to evolve and improve through community development such as the Noah-MP (Niu et al., 2011) or the Community Land Model (CLM; Lawrence et al., 2019) land surface models. These models would provide students with a more complete set of modeling tools to explore the hydrologic cycle and would give students access to the state of the art in land surface modeling. While there are still several challenges to overcome to make this happen, including streamlining data requirements, reducing runtimes through more efficient computations, and setting up a more complex computing environments, this work illustrates the feasibility and a path forward for making this happen.
Data availability statement
The original contributions presented in the study are included in the article/supplementary material, further inquiries can be directed to the corresponding author.
Author contributions
JR developed the Snow and Climate module and was the primary author of the paper. MG analyzed the data and helped write the paper and JB helped collect and process the data and helped write the paper. All authors contributed to the article and approved the submitted version.
Acknowledgments
We would like to thank David Chandler, Emad Habib and David Tarboton for their guidance and feedback while developing the Snow and Climate Module. We would like to acknowledge the support of the National Science Foundation (NSF) under collaborative awards DUE-IUSE 1726965 and 1725989 Collaborative Research: Improving Student Learning in Hydrology and Water Resources Engineering by Enabling the Development, Sharing, and Interoperability of Active Learning Resources, which funded the Hydrolearn fellowship that allowed Dr. Roundy to create this module during the summer of 2020.
Conflict of interest
The authors declare that the research was conducted in the absence of any commercial or financial relationships that could be construed as a potential conflict of interest.
Publisher's note
All claims expressed in this article are solely those of the authors and do not necessarily represent those of their affiliated organizations, or those of the publisher, the editors and the reviewers. Any product that may be evaluated in this article, or claim that may be made by its manufacturer, is not guaranteed or endorsed by the publisher.
Supplementary material
The Supplementary Material for this article can be found online at: https://www.frontiersin.org/articles/10.3389/frwa.2022.912776/full#supplementary-material
References
Barnett, T. P., Adam, J. C., and Lettenmaier, D. P. (2005). Potential impacts of a warming climate on water availability in snow-dominated regions. Nature. 438, 303–309. doi: 10.1038/nature04141
Bonfils, C. J. W., Santer, B. D., Phillips, T. J., Marvel, K., Ruby Leung, L., Doutriaux, C., et al. (2015). Relative contributions of mean-state shifts and ENSO-driven variability to precipitation changes in a warming climate. J. Clim, 28, 9997–10013. doi: 10.1175/JCLI-D-15-0341.1
Bong, M., Cho, C., Ahn, H. S., and Kim, H.J. (2012). Comparison of self-beliefs for predicting student motivation and achievement. J. Educ. Research. 105, 336–352. doi: 10.1080/00220671.2011.627401
Byrd, J., Gallagher, M. A., and Habib, E. (under review). Assessments of students' learning gains in HydroLearn online modules for teaching hydrology water resources. Frontiers in Educ: STEM Educ.
Caldwell, T., and Obasi, E.M. (2010). Academic performance in African American undergraduates: Effects of cultural mistrust, educational value, and achievement motivation. J. Career Dev. 36, 348–369. doi: 10.1177/0894845309349357
Cohen, J. (1988). The effect size index: Statistical power analysis for the behavioral sciences. New York, NY: Routledge Academic.
Demaria, E. M. C., Roundy, J. K., Wi, S., and Palmer, R. N. (2016). The effects of climate change on seasonal snowpack and the hydrology of the northeastern and upper midwest United States. J. Clim. 29, 6527–6541. doi: 10.1175/JCLI-D-15-0632.1
Freeman, S., Eddy, S. L., McDonough, M., Smith, M. K., Okoroafor, N., Jordt, H., et al. (2014). Active learning increases student performance in science, engineering, and mathematics. Proc. Natl. Acad. Sci. U S A. 111, 8410–8415. doi: 10.1073/pnas.1319030111
Gallagher, M. A., Habib, E., Tarboton, D., and Willson, C. S. (2021). HydroLearn: Improving Students' Conceptual Understanding and Technical Skills in a Civil Engineering Senior Design Course Paper presented at 2021 ASEE Virtual Annual Conference Content Access, Virtual Conference. Available online at: https://peer.asee.org/37265
Gallagher, M. A., Habib, E. H., Williams, D., Lane, B., Byrd, J., Tarboton, D, et al. (Accepted). Designing professional learning experiences to support hydrology water resources faculty to create high-quality curricular materials. Frontiers in Educ: STEM Educ.
Gupta, H. V., Kling, H., Yilmaz, K. K., and Martinez, G. F. (2009). Decomposition of the mean squared error and NSE performance criteria: Implications for improving hydrological modelling. J. Hydrol. 377, 80–91. doi: 10.1016/j.jhydrol.2009.08.003
Hattie, J. (2009). Visible learning: a synthesis of meta-analysis relating to achievement. New York, NY: Routledge.
Huning, L. S., and AghaKouchak, A. (2020). Global snow drought hot spots and characteristics. Proc. Natl. Acad. Sci., 117, 19753. doi: 10.1073/pnas.1915921117
Lane, B., Garousi-Nejad, I., Gallagher, M. A., Tarboton, D. G., and Habib, E. (2021). An open web-based module developed to advance data-driven hydrologic process learning. Hydrol. Process. 35, e14273. doi: 10.1002/hyp.14273
Lawrence, D. M., Fisher, R. A., Koven, C. D., Swenson, S. C., Bonan, G., Collier, N., et al. (2019). The community land model version 5: description of new features, benchmarking, and impact of forcing uncertainty. J. Adv. Model. Earth Syst. 11, 4245–4287. doi: 10.1029/2018MS001583
Marvel, K., and Bonfils, C. (2013). Identifying external influences on global precipitation. Proc. Natl. Acad. Sci. USA. 110, 19301–19306. doi: 10.1073/pnas.1314382110
Merck, M. F., Gallagher, M. A., Habib, E., and Tarboton, D. (2021). Engineering students' perceptions of mathematical modeling in a learning module centered on a hydrologic design case study. International Journal of Research in Undergraduate Mathematics Education. 7, 351–377. doi: 10.1007/s40753-020-00131-8
Niu, G-. Y., Yang, Z-L, Mitchell, K. E., Chen, F., Ek, MB, Barlage, M., et al. (2011). The community Noah land surface model with multiparameterization options (Noah-MP): 1. Model description and evaluation with local-scale measurements. J. Geophys. Res. 116, D12109. doi: 10.1029/2010JD015139
Parker, P. D., Marsh, H. W., Ciarrochi, J., Marshall, S., and Abduljabbar, A. S. (2014). Juxtaposing math self-efficacy and self-concept as predictors of long-term achievement outcomes. Educ Psychol. 34, 29–48. doi: 10.1080/01443410.2013.797339
Peñuela, A., Hutton, C., and Pianosi, F. (2021). An open-source package with interactive Jupyter Notebooks to enhance the accessibility of reservoir operations simulation and optimisation. Environ. Model. Softw. 145, 105188. doi: 10.1016/j.envsoft.2021.105188
Pintrich, P. R., and de Groot, E v. (1990). Motivational and self-regulated learning components of classroom academic performance. J. Educ. Psychol. 82, 33–40. doi: 10.1037/0022-0663.82.1.33
Schunk, D. H. (1989). Self-efficacy and achievement behaviors. Educ. Psychol. Rev. 1, 173–208. doi: 10.1007/BF01320134
Seymour, E., Wiese, D. J., Hunter, A-. B., and Daffinrud, S. (2000). Creating a Better Mousetrap: On-line student assessment of their learning gains. National Meeting of the American Chemical Society, 1–40.
Torenbeek, M., Jansen, E., and Suhre, C. (2013). Predicting undergraduates' academic achievement: the role of the curriculum, time investment and self-regulated learning. Studies in Higher Educ. 38, 1393–1406. doi: 10.1080/03075079.2011.640996
Warner, R. M. (2012). Applied statistics: From bivariate through multivariate techniques. Thousand Oaks, CA: Sage Publications.
Wiggins, G., and McTighe, J. (2005) Understanding by Design. Alexandria, VA: Association for Supervision Curriculum Development.
Keywords: snow, climate, modeling, Hydrolearn, active learning
Citation: Roundy JK, Gallagher MA and Byrd JL (2022) An innovative active learning module on snow and climate modeling. Front. Water 4:912776. doi: 10.3389/frwa.2022.912776
Received: 04 April 2022; Accepted: 28 June 2022;
Published: 19 July 2022.
Edited by:
Bridget Mulvey, Kent State University, United StatesReviewed by:
Georgia A. Papacharalampous, Czech University of Life Sciences, CzechiaFrancesca Pianosi, University of Bristol, United Kingdom
Copyright © 2022 Roundy, Gallagher and Byrd. This is an open-access article distributed under the terms of the Creative Commons Attribution License (CC BY). The use, distribution or reproduction in other forums is permitted, provided the original author(s) and the copyright owner(s) are credited and that the original publication in this journal is cited, in accordance with accepted academic practice. No use, distribution or reproduction is permitted which does not comply with these terms.
*Correspondence: Joshua K. Roundy, amtyb3VuZHlAa3UuZWR1