 Chen Niu1
 Jianxia Chang
- 1State Key Laboratory of Eco-Hydraulics in Northwest Arid Region of China, Xi'an University of Technology, Xi'an, China
- 2PowerChina Northwest Engineering Corporation Limited, Xi'an, China
With climate change, the amount of global water resources is decreasing and crop growth patterns are changing. Global food security will face severe challenges in future. Hence, it is of great significance to study the change in grain production under climate change and the water resources constraint to ensure national and regional food security. In this study, a complex system coupled with the hydrological model, crop model, and optimal regulation model of water resources has been constructed to explore the changes in future grain yield in the Yellow River Basin (YRB) under climate change and the water resources constraint, and further evaluate the future food security of the basin. The models show good adaptability. The results show that the precipitation and temperature in the YRB will be higher than the historical level and show an upward trend in future. On the contrary, runoff and irrigation water demand in the basin are lower than historical levels. Although the grain yield would decrease in future, the food security of YRB would be well-guaranteed. However, the level of food security in different provinces would be quite different. And some provinces will face serious food security problems without grain trade. This study will help relevant institutions in the YRB to deal with possible food security problems in future, and can also provide a reference for other countries and institutions in the world.
Introduction
Global climate change and population growth will seriously threaten food security (Wheeler and von Braun, 2013). According to the IPCC report on climate change and land in 2019, the global land temperature increased by an average of 1.31–1.51°C from 1880 to 2018. Climate change has changed the water cycle process and increased the frequency and intensity of extreme climate events and agricultural disasters, which has a serious impact on global food security (Smith and Archer, 2020; Lam et al., 2021; Ndiritu and Muricho, 2021). So far, about 820 million people around the world are still malnourished, and more than 2 billion people do not have access to stable and adequate food (FAO, 2019). Although global food production has increased significantly in the past half-century, with the growth of population and the improvement of human material needs, food security under climate change is still a common challenge facing all mankind (Godfray et al., 2010).
Food security is a systematic problem, which will be affected by social, economic, natural environment, and other factors (Zhu et al., 2013; Gohar and Cashman, 2016). Climate change is undoubtedly an important factor affecting crop yield. Qualitative and quantitative analyses of the impact of climate change in crop yield are the key to achieve sustainable agricultural development and ensure national and global food security (Xu et al., 2021). Many researchers use statistical methods to estimate the impact of climate change in crop yield based on historical measured data (Zhang et al., 2008; Lobell et al., 2011; Zhou and Turvey, 2014). These studies are qualitative analyses, which can clarify the changing trend of crop yield in future. In contrast, it is more intuitive to use the crop model to analyze the impact of climate changes in future crop yield (Rosenzweig and Tubiello, 1996; Saddique et al., 2020; Xu et al., 2021). Some key socio-economic factors other than climate variables in crop production are typically out of consideration (Challinor et al., 2009). To overcome the disadvantage, scholars began to consider social and economic factors in the mode (Challinor et al., 2010; Ye et al., 2013). Chou et al. combined climate factors and economic factors to construct an economy climate model (C-D-C), which can not only reveal the non-linear relationship between economic factors and natural factors but also quantitatively analyze the impact of climate change in food production from the perspective of socio-economic change (Chou and Ye, 2006).
Water resource is undoubtedly one of the important factors affecting crop yield. Water resources are the basis of agricultural production and important natural resources to ensure food security (Harmel et al., 2020). Compared with dryland or rain-fed agriculture, irrigation has the potential to increase the yield of most crops by 100–400%, contributing 40% of the world's food production on only 20% of the cultivated land (WWA., 2014). Agricultural production consumes about 70% of the world's freshwater resources, which is the industry with the largest consumption of freshwater resources in the world. In most developing countries, the proportion has reached 90% (Wisser et al., 2008; Harmel et al., 2020). The impact of climate change in the water cycle will affect the supply of irrigation water. The same is true of the management mode of agricultural water resources. These factors limit the irrigation water for crops (Bossio et al., 2010; Smilovic et al., 2019). With climate change and population growth, water scarcity will be a major constraint on food growth (ICA, 2012). Hence, the research on crop yield under climate change and water resources constraints in future is crucial for national and global food security. However, the current research is mostly statistical analysis. The goal of the research is to reveal the correlation and evolution trend between grain production and climate change. The lack of mechanism-level research cannot accurately reflect the real trend of future grain yield changes. The impact of water resource allocation on grain yield is also not considered in the crop model. In this study, a complex system coupled with the hydrological model, crop model, and optimal regulation model of water resources has been constructed considering the impact of water resources allocation and climate change, which can better reflect the change process of grain yield from the mechanism level.
In China, agricultural production is potentially threatened by climate change and related extreme weather events, especially in basins affected by water scarcity (Wang et al., 2009; Piao et al., 2010). The impact of climate change on food production in water shortage basins is often masked, as changes in national food production are not significant (Zhang et al., 2008). The Yellow River Basin (YRB) is an important food production area, which is facing a serious shortage of water resources. The cultivated area and population in the YRB account for ~13.0% and 8.6% of China, respectively, whereas the basin holds only 3% of the country's water resources (Cai and Rosegrant, 2004). The grain output of the nine provinces along the Yellow River reached 234.38 million tons in 2019, accounting for 35.31% of China's grain output. With climate change, the water resources in the YRB continue to decrease, and the share of agricultural water is often occupied by other departments (Yang et al., 2010, 2012). Climate change and water shortage are seriously threatening food security in the YRB and even in China. Hence, it is of great significance to explore the change in crop yield in the YRB under climate change and water resources constraints to ensure the future food security and water security of basin, and to promote the ecological protection and high-quality development and construction of the YRB.
Methodology
In this study, the hydrological and meteorological factors of the YRB under different climate models (CanESM2, GFDL_ESM2G, and MIROC_ESM_CHEM) and emission scenarios (rcp2.6, rcp4.5, and rcp8.5) were simulated based on the statistical down-scale model (SDSM) and ABCD model. The AquaCrop-OS model was used to calculate the future agricultural water demand of the YRB under climate change, and a water resources' optimization regulation model was established to maximize grain yield. The research route of this study is shown in Figure 1.
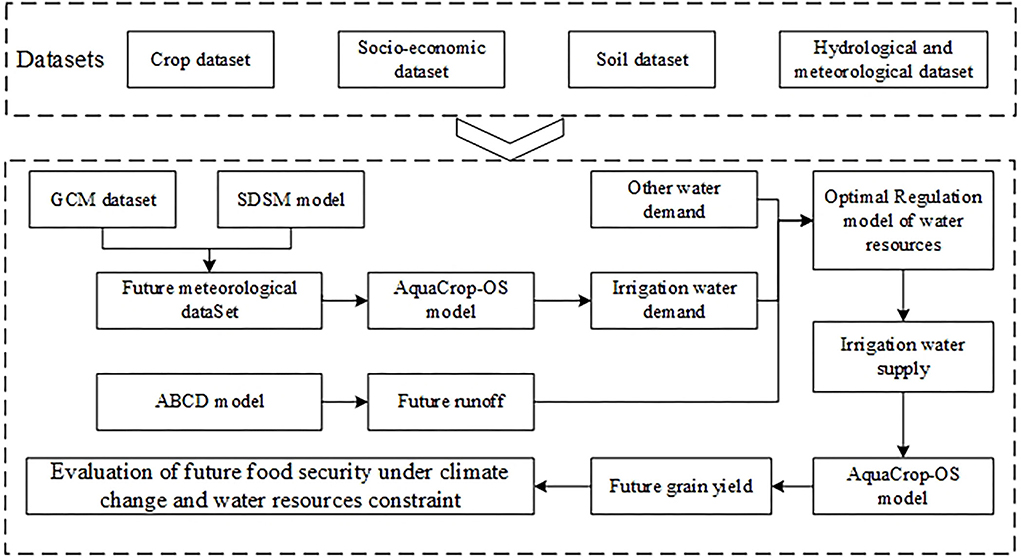
Figure 1. Sketch map of technical route.
Statistical downscaling model
SDSM is a decision support tool for the assessment of regional climate change impacts (Wilby et al., 1999, 2002). It is one of the most widely used statistical downscaling methods in the world (Tryhorn and DeGaetano, 2011; Hassan et al., 2014; González-Rojí et al., 2019). The SDSM model mainly consists of two parts. The first is the construction of the statistical relationship between regional or site-scale predictors (time series of site climate elements) and large-scale predictors (atmospheric general circulation factors, NCEP reanalysis data). Then, the future climate scenarios output by GCM are scaled down to each meteorological station in the region by using this statistical relationship, and the future climate variables (temperature and precipitation) series of each station are generated. The calculation method is as follows:
where ωt is the probability of precipitation at time t; α0 and αj are the regression coefficient of the least squares estimation; is the predictor at time t; αt−1 and ωt−1 are the probability of precipitation and the corresponding regression coefficient, respectively, at time t-1.
Set a random function of uniform distribution γt, when ωt ≤ γt, the precipitation occurs at time t. Precipitation can be reflected by the Z − score(Zt):
where β0 and βj are regression coefficients; βt−1 and Zt−1 are self-correlation coefficients of ωt−1 and αt−1; φ(Zt) is the normal cumulative distribution function; yt is the precipitation.
AquaCrop-OS model
The AquaCrop-OS model was used to simulate crop yields in the YRB under different climate models and emission scenarios in this study. AquaCrop-OS is the open source version of FAO's crop water productivity model, which can be run in multiple programming languages and operating systems. FAO developed AquaCrop in 2009 and it is a distributed multi-crop model that simulates the yield of herbaceous crop types under different biophysical and management conditions (Raes et al., 2009; Steduto et al., 2009). The model uses canopy coverage instead of leaf area index and distinguishes soil evaporation from crop transpiration, which can better evaluate the impact of water on yield and crop growth (Vanuytrecht et al., 2014). Compared with other crop simulation models that require highly detailed input data and information about crop growth, AquaCrop requires a relatively small number of parameters to be defined (Foster et al., 2017). The AquaCrop model has been widely used in various fields to improve farm irrigation management, to assess the potential increase in production by a different management, and assess the impact of climate change in crop production (García-Vila and Fereres, 2012; Shrestha et al., 2013; Vanuytrecht et al., 2014; Pirmoradian and Davatgar, 2019; Kim et al., 2021). The response of crop yield to water is described by the following equation:
where YX and Yp are potential yield and actual yield of crops, respectively, kg/m2; ETX and ETp are the potential evapotranspiration and actual evapotranspiration of crops, mm; Ky is the coefficient of yield response to water. Penman–Monteith formula recommended by FAO is selected to calculate reference evaporation ET in this study:
The simulated final yield was represented by aboveground biomass and harvest index:
where Y is the final crop yield, kg/m2; B is the biomass, kg/m2; HI is the harvest index; WP is the biomass water production efficiency, kg/(m2·mm); Tr is the crop transpiration, mm. ET0 is the evapotranspiration of reference crops, mm/d. Penman–Monteith formula recommended by FAO is used to calculate ET0 in this study.
ABCD model
The ABCD model proposed by Thomas in 1981 is a simple and efficient conceptual hydrological model with only four parameters (Thomas, 1981). The main input data of the model are rainfall and potential evapotranspiration, and the output data are runoff depth, soil water content, and groundwater content. ABCD model has the characteristics of the clear concept, few parameters, easy optimization, and high simulation accuracy, so it has been widely used in the world (Martinez and Gupta, 2010; Topalovic et al., 2020; Wang et al., 2020). ABCD model consists of two water storage components: soil aquifer and underground aquifer. Their water balance equation is as follows:
For soil aquifer,
where Pt is the precipitation at time t;ETt is the actual evaporation at time t; DRt is the surface runoff at time t; GRt is the groundwater recharge at time t; St and St−1 are the soil water content at time t and t-1, respectively.
For underground aquifer,
where GDt is the underground runoff at time t; Gt and GDt−1 are the groundwater storage at time t and t-1, respectively.
Optimal regulation model of water resources
In this study, a two-layer optimal regulation model of water resources was constructed to ensure the supply of irrigation water. The outer model is the optimal operation model of cascade reservoirs, which aims to realize the redistribution of water resources in space and time. The inner model is the optimal allocation model of water resources, which aims to allocate water resources reasonably to different sectors, such as industry and agriculture. Following the current water resources allocation principles in the YRB, the water supply priorities of different sectors are as follows: domestic, industry, ecology, and agriculture (Cai and Rosegrant, 2004; Yang et al., 2012; Wang et al., 2020). The inner model can be solved by the linear optimization method. Different coefficients were set in the process of linear optimization to reflect the water supply priorities of different sectors.
Based on the optimal regulation model of water resources and AquaCrop-OS model, taking the maximum grain yield of the basin as the goal, the objective function, and main constraints are as follows:
For the objective function,
where W is the objective function of the outer layer optimization model; Y is the total grain yields of all nodes in the basin; n is the number of nodes with irrigation water demand; xa,i,t is the irrigation water supply of node i at time t; f(xi,1, xi,2, …xi,t) is the grain yield of node i. Input the irrigation water supply series of node i into the AquaCrop-OS model to obtain the crop yield f(xi,1, xi,2, …xi,t) in its production cycle.
As the main constraints,
where Qout,t and Qin,t are the outflow and inflow of the basin, respectively; Qwc,t is the water consumption of water sector s in the basin; and VS,t and VE,t are the initial and end capacity of the cascade reservoirs at time t.
here, Zi,t is the water level of reservoir i at time t, and Zdi,t and Zui,t are the lower and upper limit water levels of reservoir i at time t, respectively.
here, Nmini and Nmaxi are the guaranteed output and installed capacity of reservoir i, respectively; Ni,t is the generated output of reservoir i at time t.
Here, qmin i,t is the minimum discharge of reservoir i at time t considering ecological base flow (Lu et al., 2021). qmax i,t is the maximum discharge of reservoir i at time t considering the maximum discharge capacity of reservoir and flood (ice) prevention (Jin et al., 2019).
Take three nodes at the downstream of reservoir A as an example. The water discharged from the reservoir flows through nodes 1, 2, and 3 in turn. The objective function and constraint conditions of the linear optimization model of water resources (inner optimization model) are as follows:
Objective function
Constraint conditions
Here, i = 1, 2, and 3 represent three nodes, respectively. k=d, i, e, or a represents domestic, industrial, ecological, and agricultural water sectors, respectively. αk,i is the weight coefficient of sector k of node i, αd,i > αi,i > αe,i > αa,i. xk,i,t is the water supply of sector k of node i at time t. RDt is the discharge flow of Reservoir A at time t. Ini,t is the self-produced water in the area where node i is located at time t. wdk,i,t is the water demand of sector k of node i at time t.
Study area and data
The Yellow River flows through the nine provinces of Qinghai, Sichuan, Gansu, Ningxia, Inner Mongolia, Shaanxi, Shanxi, Henan, and Shandong, and involves 68 municipalities and 45 catchment areas (Figure 2). The YRB is divided into 264 nodes according to administrative divisions and natural sub-basins. Among them, 183 nodes have water demand and 164 of these nodes have irrigation water demand.
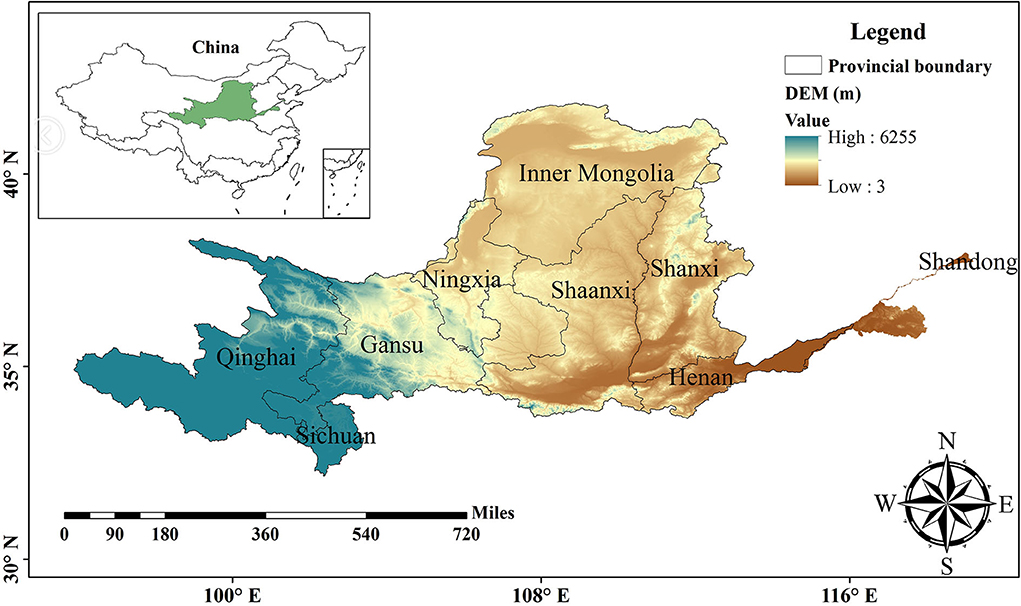
Figure 2. The map of YRB.
The meteorological data used in this study came from China Meteorological Sharing Network, and the missing data of some stations were interpolated and extended by the data of neighboring stations. The regional soil geological data in the basin are from the Institute of Geosciences and resources, Chinese Academy of Sciences (http://www.igsnrr.ac.cn/). The soil hydrological characteristics data are extracted from the soil–water characteristics module of SPAW software according to the soil texture.
The crop data mainly refer to China's Major Crop Water Requirement Isoline Map, China's Major Crop Water Requirement and Irrigation and China Water Saving and Irrigation Network (http://www.jsgg.com.cn/Index/Index.asp). Socio-economic data (population, grain yield, effective irrigated area, grain sown area, total power of agricultural machinery, etc.) come from the Yellow River Basin Agricultural Yearbook and the statistical yearbook of provinces and prefecture-level cities in the basin.
The data on water demand of the YRB in 2030 come from the Comprehensive Planning of Water Resources in the Yellow River Basin, and the data on historical water consumption come from the Bulletin of Water Resources of the Yellow River Basin. The runoff data are from the Third National Survey and Evaluation of Water Resources and are provided by the Yellow River Water Resources Commission (YRWRC).
Results and discussion
Validation and calibration of models
Validation of the SDSM model
In this study, the SDSM model was used to downscale the future climate scenario data output by GCM to generate the meteorological data series of each main station in the YRB. On the basis of existing studies, we selected CanESM2, GFDL_ESM2G, and MIROC_ESM_CHEM climate models. In order to verify the adaptability of the three climate models in the YRB, monthly precipitation, and maximum and minimum temperature of each model from 1970 to 2005 in the YRB were counted and compared with the measured meteorological data, as shown in Figure 3.
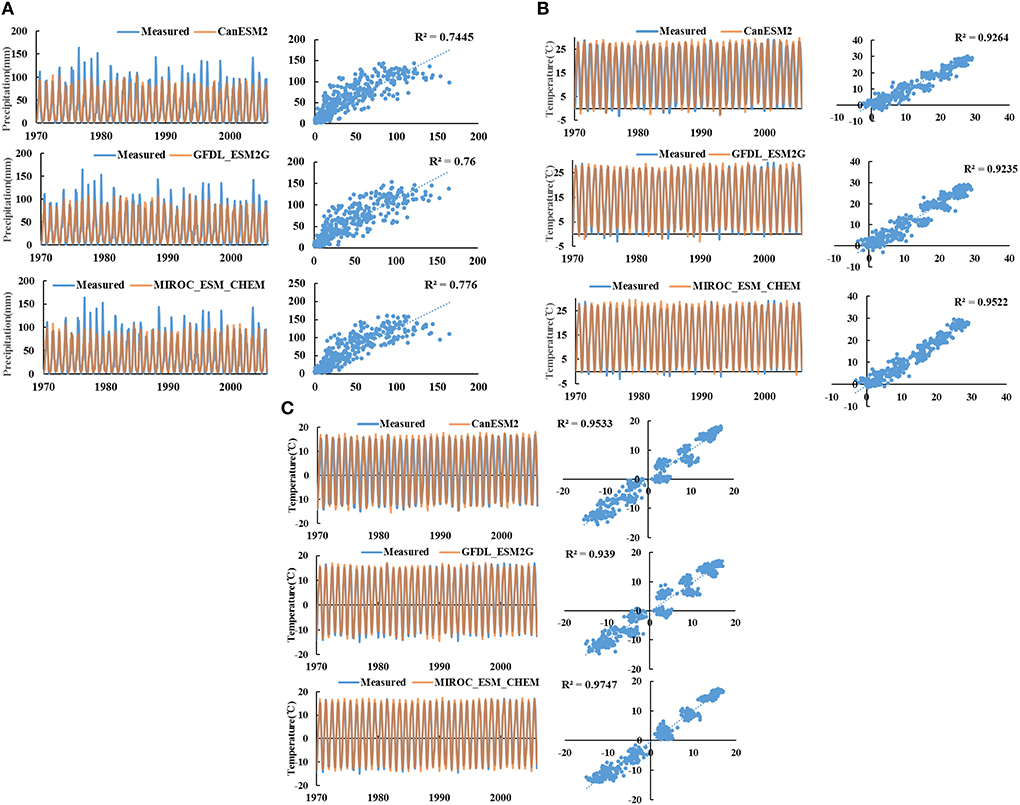
Figure 3. Comparison of measured and estimated values in the YRB from 1970 to 2005 in different models (A) monthly precipitation; (B) monthly maximum temperature; (C) monthly minimum temperature.
It can be seen that the correlation coefficients between the precipitation of the three climate models and measured precipitation in the YRB are all above 0.74, and the correlation coefficients between maximum and minimum temperature of the three climate models and measured temperature are all above 0.9. There is a high consistency between the data of the three climate models and measured data. The downscaling data of CanESM2, GFDL_ESM2G, and MIROC_ESM_CHEM models can well-characterize the climatic characteristics of the YRB.
Calibration and validation of the AquaCrop-OS model
Wheat, corn, and rice are the most important grain crops in China, accounting for 80–90% of China's grain output. The same is true in the YRB. Hence, this study takes wheat, corn, and rice as the research objects to predict the future grain yield of the YRB under climate change and water resources constraint. Wheat is divided into spring wheat and winter wheat according to its variety and planting period. Similarly, corn is divided into summer corn and spring corn. The AquaCrop-OS model was used to simulate the yields of these five crops under different climate models and emission scenarios in the YRB.
OAT (One factor at one time) method was used to analyze the sensitivity of various parameters of the model (Pujol, 2009; Saltelli and Annoni, 2010). Adjusting the more sensitive parameters can increase the efficiency of parameter adjustment.
Here, RS is the relative sensitivity of parameters; x is the value of a parameter; x is the variation of the parameter, x = 0.1x; y(x + x) and y(x) are the simulation values of the model before and after the parameter change, respectively.
Through parameter sensitivity analysis, 13 more sensitive parameters were selected, including duration from sowing to seedling emergence (Emergence), duration from sowing to senescence (Senescence), duration from sowing to maturity (Maturity), duration from sowing to yield formation (HIstart), duration of flowering (Flowering), crop coefficient from crop canopy formation to senescence (Kcb), maximum canopy coverage (CCx), maximum effective root depth (Zmax), number of crops per hectare (PlantPop), canopy growth coefficient (CGC), canopy damping coefficient (CDC), normalized water productivity (WP), and reference harvest index (HI0).
The above model parameters are calibrated by the manual trial and error method. Precipitation is one of the main factors affecting crop growth. The accuracy of the model was tested by comparing the simulated crop yield and statistical crop yield of YRB (68 Prefecture-level cities) under two precipitation frequencies (50% and 75% level years) and the same irrigation. The coefficient of determination (R2), standardized root mean square error (NRMSE), and synergy index (d) were used to evaluate the adaptability of the model to wheat, corn, and rice in the YRB. As shown in Table 1, only under 50% precipitation frequency, the determination coefficient R2 of simulated and measured spring maize yield is <0.9. Under 50% and 75% precipitation frequency, the standardized root mean square error NRMSE simulated and measured yield values of five crops are <20% and synergy index d of them is more than 0.9, which is considered to be a good fitting effect. The AquaCrop-OS model has good adaptability to wheat, corn, and rice in the YRB.
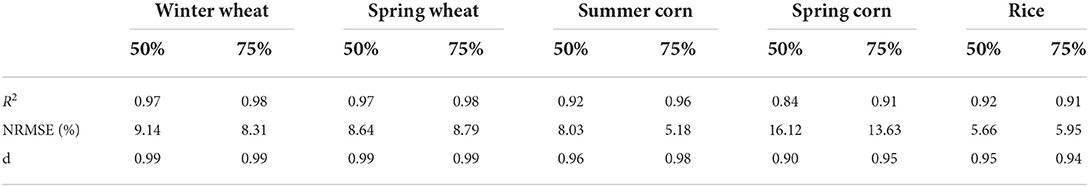
Table 1. The adaptability evaluation of the AquaCrop-OS model.
Calibration and validation of the ABCD model
The period from 1975 to 1990 is selected as the periodic rate and the period from 1991 to 2000 as the validation period to evaluate the adaptability of the ABCD model in the YRB. The Nash–Sutcliffe efficiency (NSE) and coefficient of determination (R2) of Tangnaihai, Lanzhou, Toudaoguai, and Lijin sections are shown in Table 2. The NSE of four sections is >0.6 and R2 is >0.75. It can be seen that the simulation accuracy of the calibration period is better than that of the validation period, which may be attributed to the fact that the ABCD model constructed in this study is a conceptual lumped hydrological model. With the in-depth influence of climate and underlying surface changes, the model performance changes, but better simulation accuracy can be obtained. In general, the ABCD model constructed in this study can better simulate the hydrological process of the basin. Because the influence of human activities on the underlying surface is not considered, the simulation accuracy is limited, but it can be used to simulate the hydrological process of the basin and scientifically and reasonably assess the amount of water resources in the basin.
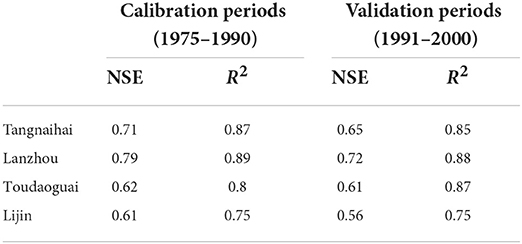
Table 2. The adaptability evaluation of the AquaCrop-OS model.
Evolution of climate and irrigation water demand under climate change
The change in precipitation and temperature under climate change
Considering the uncertainty of climate change, we selected three emission scenarios (RCP2.6, RCP4.5, and RCP8.5) to characterize the evolution of precipitation and temperature in the YRB in future. RCP2.6, RCP4.5, and RCP8.5 represent low, medium, and high emission scenarios, respectively. Under different emission scenarios of the three climate models, the annual precipitation and annual average temperature in the YRB from 2020 to 2050 are shown in Figure 4 and Table 3. Under different climate models and emission scenarios, the multi-year average annual precipitation and temperature in the YRB from 2020 to 2050 are higher than the reference period. The CV of annual precipitation and annual average temperature deviation coefficient is less than that of the reference period. It shows that the future precipitation and temperature will rise and become more stable. The annual precipitation and annual temperature under different climate models and emission scenarios all showed an increasing trend.
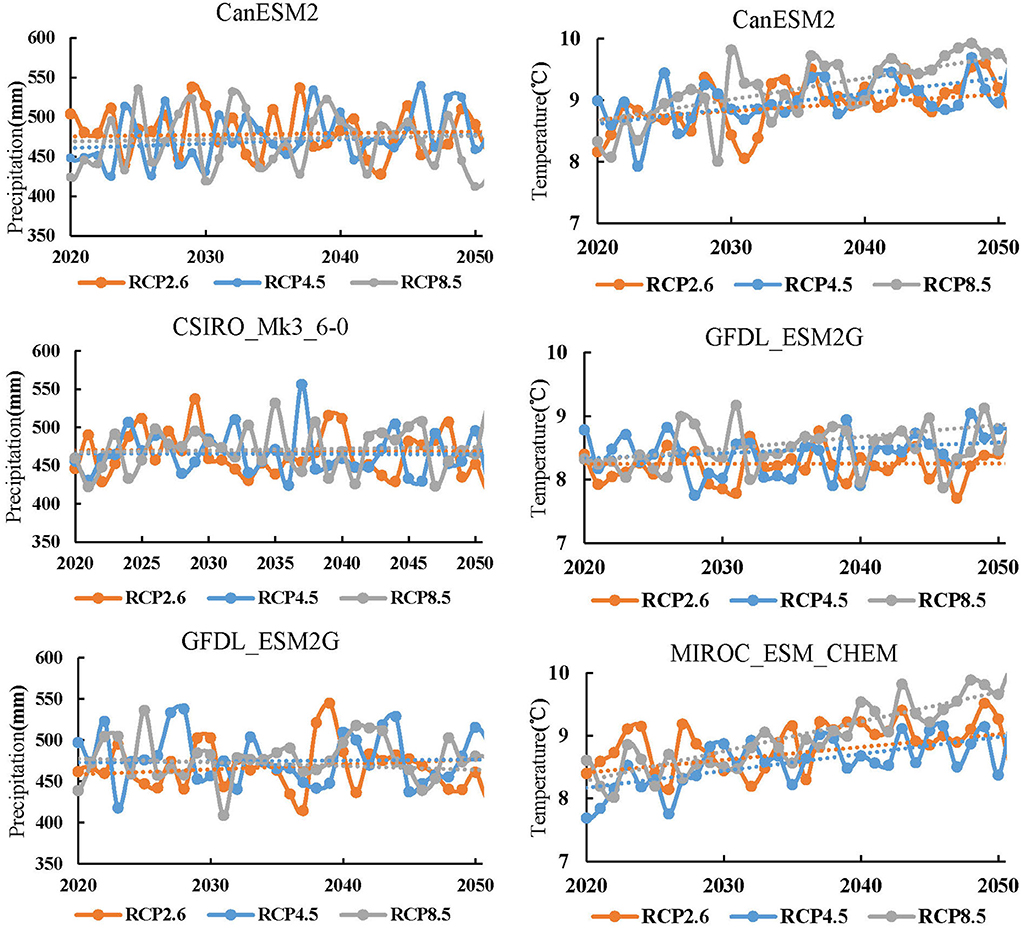
Figure 4. The annual precipitation and annual average temperature in the YRB for 2020–2050.
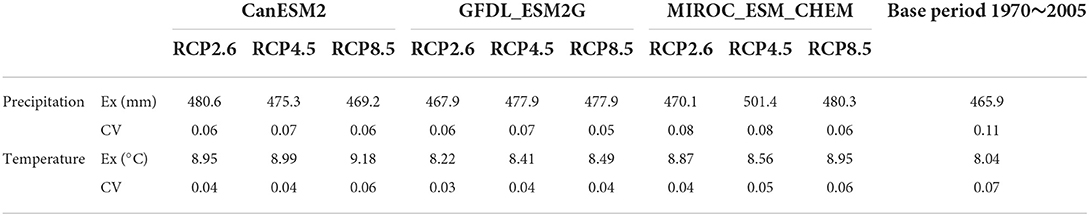
Table 3. The characteristic values of precipitation and temperature in the YRB for 2020–2050.
The change in runoff and irrigation demand under climate change
The ABCD model is used to predict the runoff of the YRB from 2020 to 2050. The annual runoff process is shown in Figure 5. The runoff of the YRB in future will be the largest under the MIROC_ESM_CHEM mode and the smallest under GFDL_ESM2G mode. The runoff of the YRB under the MIROC_ESM_CHEM mode shows an obvious upward trend, and the variation trend of runoff under other modes is not obvious. With strong consistency, the runoff of the YRB is significantly lower than the historical level under different climate models and emission scenarios. The reduction of runoff will undoubtedly aggravate the conflict of water resources in the basin. Agriculture with lower water supply priority will be more affected than the rest of the water sector. This will directly affect the future food security of the basin.
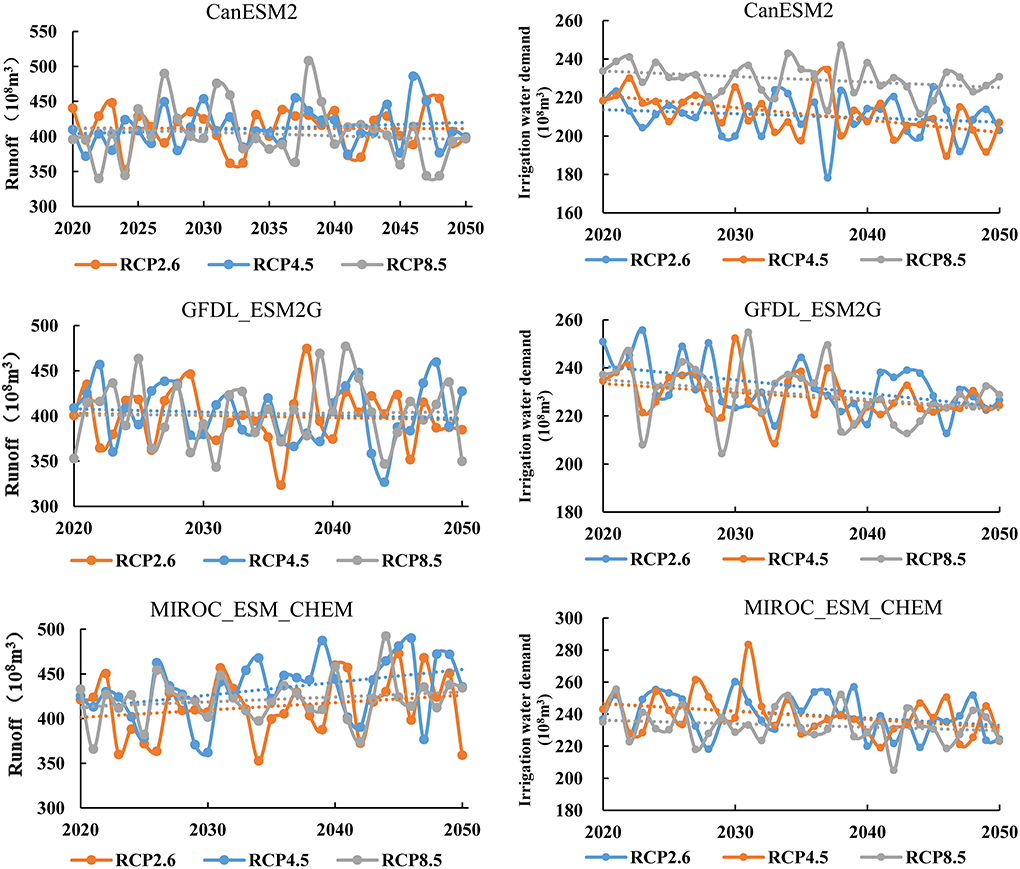
Figure 5. The annual runoff and annual irrigation water demand in the YRB for 2020–2050.
The irrigation mode of the AquaCrop-OS model was set as net irrigation to simulate the future agricultural irrigation water demand of the YRB. It should be noted that the irrigation water demand in the paper is the water demand of surface water after deducting the recoverable amount of groundwater. Under different emission scenarios of the three climate models, the irrigation water demand inside the YRB from 2020 to 2050 is shown in Figure 5 and Table 4. Irrigation water demand of the CanESM2 model is the smallest, mainly due to the highest precipitation of the CanESM2 model in the three climatic models. The greater the precipitation, the greater the effective precipitation, the smaller the irrigation water demand. The multi-year average irrigation water demand under the three climate models is less than the historical measured value of 25.71 billion cubic meters (1990–2016). The main reasons are as follows: referring to the Comprehensive Planning of Water Resources in the Yellow River Basin, the coefficient of utilization of irrigation water in the model is 0.61, which is higher than the historical value; precipitation increased in 2020–2050 under the three climatic models; with the increase of temperature, crop growth period and irrigation date will advance, and the number of days requiring irrigation will shorten, thus reducing irrigation water demand. And irrigation water demand showed a downward trend under different climatic patterns and discharge scenarios for the same reason from 2020 to 2050.
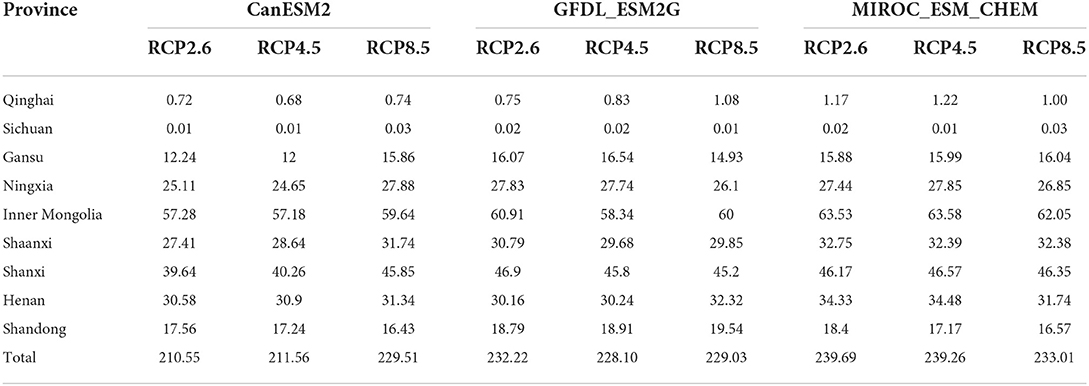
Table 4. The multi-year average irrigation water demand in YRB from 2020 to 2050 (108 m3).
Evaluation of future food security in the YRB under climate change and water resources constraint
In order to ensure food security as much as possible, this study constructed the optimal regulation model of water resources with the goal of maximum grain yield in the YRB. LYX, LJX, GX, and XLD on the mainstream of the Yellow River were selected to participate in the outer layer optimization model. The principles of optimal allocation of water resources are as follows: priority should be given to meeting the domestic, industrial, and ecological water demands of each node, and then irrigation and other agricultural water demands; when the high priority water demand of downstream node is not satisfied, water resources will not be used to meet the low priority water demand of upstream node. There is a time-scale mismatch between the optimal regulation model of water resources (monthly scale) and the AquaCrop-OS model (daily scale). Constrained by the monthly irrigation water supply, the irrigation water supply on each day of the month was optimized and the grain yield was calculated by the nested AquaCrop-OS model.
Optimal allocation of irrigation water
The year 2030 was selected as the representative year for the case study. The multi-year average proportion of irrigation water demand in agricultural water demand was used to estimate the agricultural water demand of each province. The data on domestic, industrial, and ecological water demand are derived from the Comprehensive Planning of Water Resources in the Yellow River Basin. The agricultural water supply of the YRB is shown in Table 5. It can be seen that under different climate models and emission scenarios, the agricultural water supply in Sichuan Province is the smallest, all below 5 million m3; Shandong Province has the largest agricultural supply, exceeding 3.9 billion m3, mainly due to large amount of water supply outside the YRB. Due to the high irrigation demand index of Inner Mongolia, its agricultural water supply is second only to Shandong Province. The decrease in irrigation water will seriously affect grain production in Inner Mongolia and threaten food security; Hebei and Tianjin are located outside the river basin. The water supply to Hebei and Tianjin belongs to the water supply outside the basin.
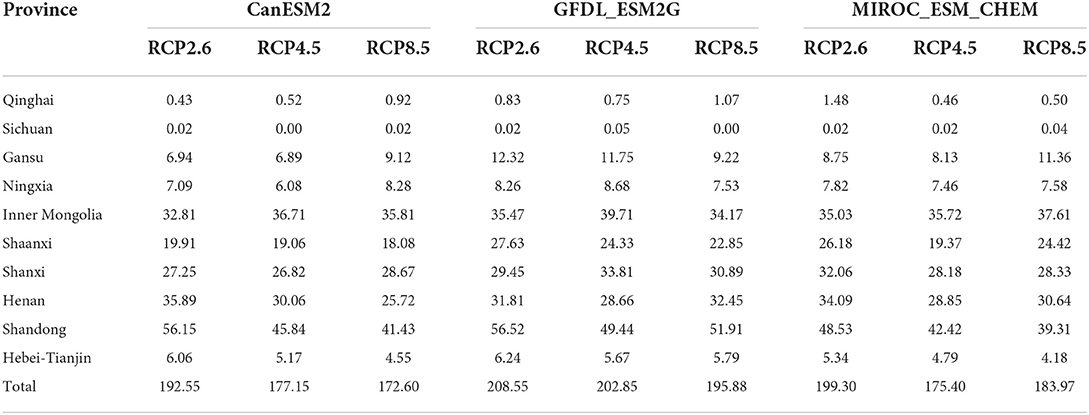
Table 5. The agricultural water supply in the YRB.
Evaluation of future grain yield and grain security
According to the Comprehensive Planning of Water Resources in the Yellow River Basin, by 2030, the effective irrigation area of farmland in the YRB will reach 5.798 million hectares. The population of the YRB in 2030 is calculated by using the average annual population growth rate of 0.25% (Guo et al., 2021; Meng et al., 2021). It is assumed that the grain sowing area and planting structure in 2030 are the same as those in 2017, and the cultivated land planted with other crops (such as potato, pea, etc.) is changed to corn. The standards of food security level are shown in Table 6 (Yao et al., 2015). The standard has good universality in China and is based on the research on national conditions. Table 7 shows the grain yield and food security level under different scenarios of three climate models of YRB in 2030. It can be seen that the grain yield under GFDL_ESM2G mode is the largest, while that under the MIROC_ESM_CHEM mode is the smallest. The grain yield under the RCP2.6 scenario was the highest, followed by the RCP8.5 scenario. Grain yield in 2030 is lower than historically. There are many factors affecting grain yield. Global warming will further worsen the soil environment and reduce grain yield. Climate change has a complex impact on grain yield. Increased CO2 concentration will inhibit crop respiration consumption, thus accumulating more photosynthates and increasing crop yield. However, higher temperature will shorten the growth period and vegetative growth period of crops, reduce the accumulation of dry matter, and reduce grain yield. On the whole, climate change has a more negative impact on grain yield than a positive impact. Although the future grain production will decrease due to climate change, for the YRB, the per capita share of grain under all climate models and emission scenarios is >400 kg/p, and the food security level reaches a security or well-off level.
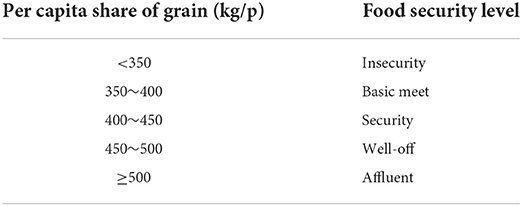
Table 6. The grading of food security.
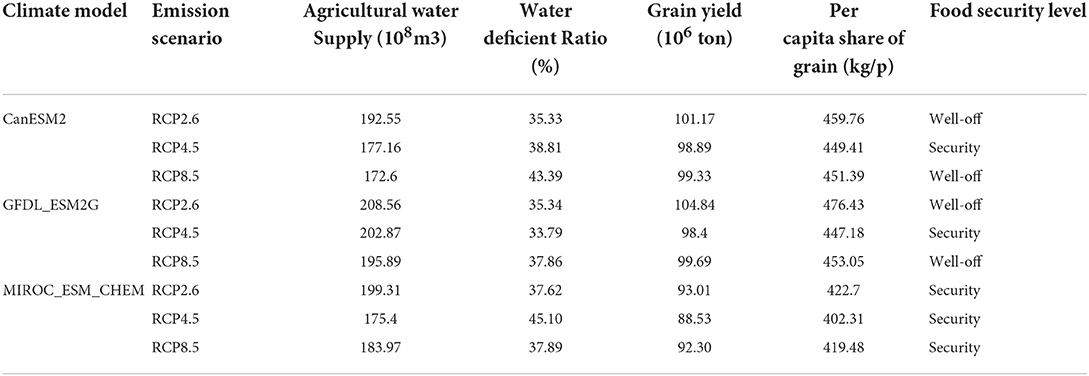
Table 7. The grain yield and food security evaluation of YRB.
Food security evaluation of provinces
There are huge differences in natural endowments and socio-economic development among the provinces in the YRB. Although in the case of YRB, the food security level is reached at security and above in future, the situation in some provinces within YRB is not optimistic. As shown in Table 8, under different climate models and emission scenarios, the per capita grain occupancy in Qinghai, Sichuan, and Shaanxi is <350 kg/ person in 2030, indicating that the food security level is insecurity. The food security level in Shanxi Province also just reached the Basic meet. On the contrary, the food security level in Ningxia, Inner Mongolian, Shandong, and Henan Provinces is maintained at security and above.

Table 8. The per capita share of the grain of provinces in YRB.
Water resources are more abundant in the upstream YRB, but from Figure 6, the future food security level in provinces located upstream is insecure. Upstream provinces, although vast, have very little cultivated land in the province due to ecological conservation and so on. As shown in Figure 7, the proportion of the population in Qinghai Province, Sichuan Province, and Gansu Province is higher than that of cultivated land. This is the main reason for the low level of food security. The situation is the same in Shaanxi and Shanxi Provinces. On the contrary, Ningxia and Inner Mongolia are vast and sparsely populated, the proportion of cultivated land is greater than that of population, and the food security of the two provinces will remain at a high level in future.
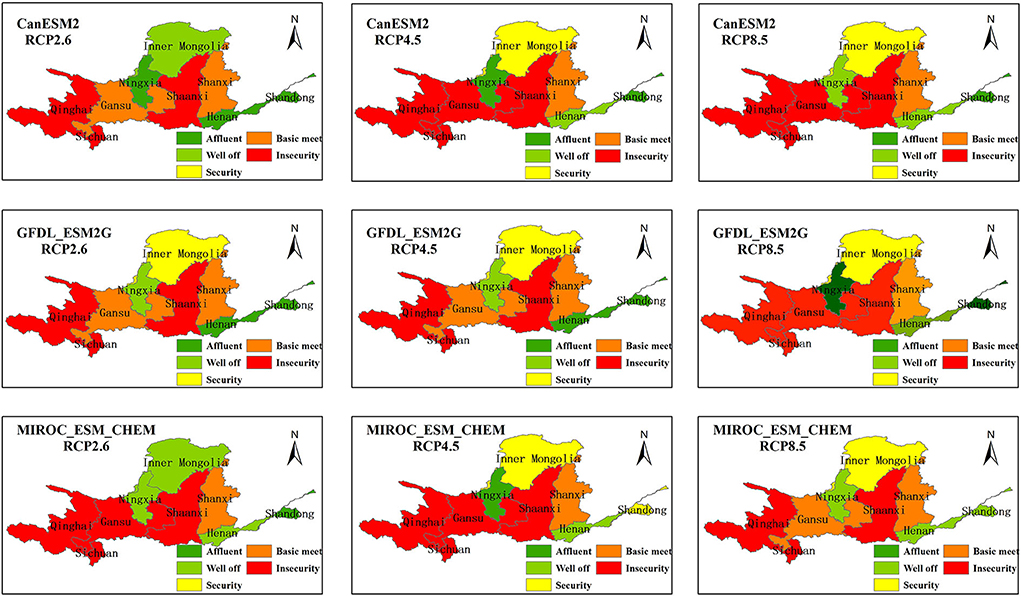
Figure 6. The spatial food security level in the YRB in 2030.
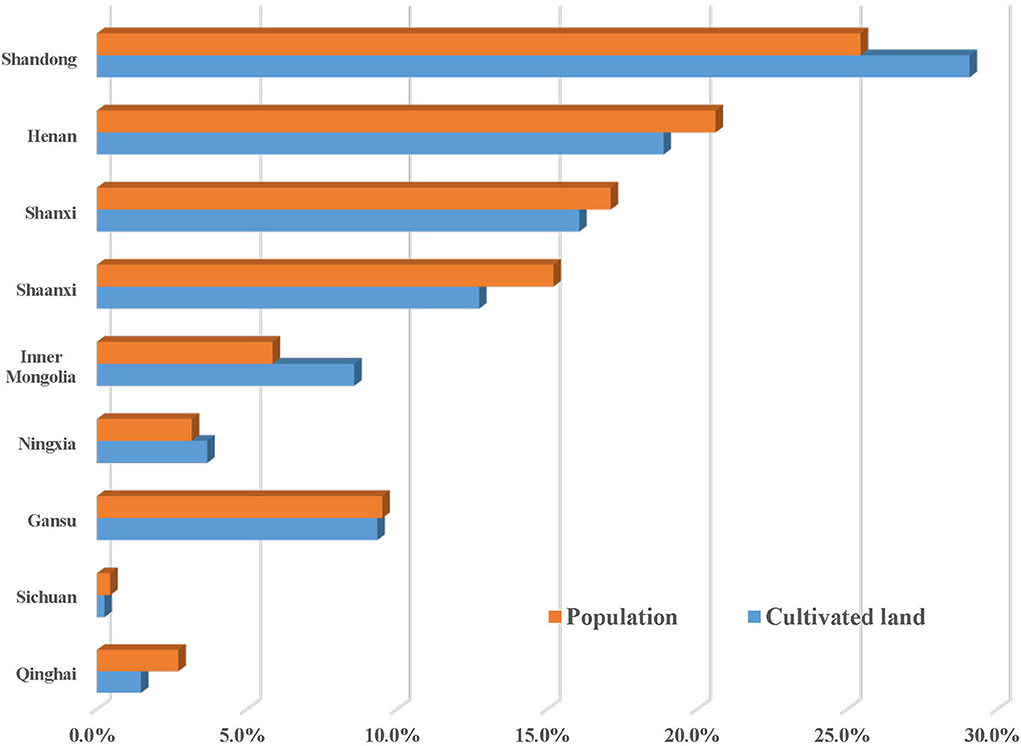
Figure 7. Proportion of population and cultivated land area of provinces in the YRB.
Water resources are also the main factor affecting grain production. Although Qinghai and Gansu Provinces are rich in water resources, due to the high terrain and the lack of necessary water diversion projects, these have caused great difficulties for irrigation. In contrast, Inner Mongolia and Ningxia Provinces are short of water resources, with an annual average runoff of <200 million cubic meters. However, there are many water diversion projects in Inner Mongolia and Ningxia Provinces. Although the irrigation water requirement is very large, it can be well-guaranteed, thus the food security of the two provinces is also well-guaranteed. Of course, there are many factors that affect food production. For example, Henan Province has a higher proportion of the population than cultivated land, but its productivity is developed and it is an important grain-producing province in China. Therefore, its food security level is high. The mismatch of water resources population and cultivated land is also a key problem in the YRB. The rational development of the upstream cultivated land resources and the construction of water diversion projects are the key to solving the problem of food security in the YRB.
Conclusion
Food security has always been a hot topic in the world, which has a great impact on social stability and development. In this study, a complex system coupled with the hydrological model, crop model, and optimal regulation model of water resources has been constructed to explore the changes in future grain yield in the YRB under climate change and the water resources constraint, and further evaluate the future food security of the basin. Compared with the traditional statistical analysis, this study considers the impact of water resources allocation and climate change in grain yield, which can better reflect the change process of grain yield from the mechanism level, rather than simply statistical correlation. The main conclusions of the study are as follows:
(1) The results show that each model shows good adaptability. The temperature and precipitation in the YRB show an upward trend in future under different climate models and emission scenarios. However, the runoff in the basin, that is, the amount of surface water resources, will decline in future and show a downward trend.
(2) Affected by climate change, the irrigation water demand in the basin shows a downward trend and is lower than the historical level. In addition to climate change, the progress of water-saving irrigation technology and the improvement of irrigation water utilization coefficient may be the main reasons for the reduction of irrigation water demand.
(3) Despite the reduction of food production, the future food security of the YRB can be basically guaranteed, and the food security level is at or above the Security level under different climate models and emission scenarios. But it does not mean we can rest easy. Due to the mismatch of water resources population and cultivated land and the difference in production capacity, some provinces in the basin will still face serious food security problems in future. This problem can be solved through grain trade between provinces, but it undoubtedly needs to pay additional costs, such as transportation costs. And there are many uncertainties and human impacts in the grain trade.
This study will help relevant institutions in the YRB to deal with possible food security problems in future, and can also provide a reference for other countries and institutions in the world. However, some limitations of this study need to be addressed. We chose nine scenarios to simulate future climate change, which cannot fully characterize the possibility of future climate change. It is assumed that the grain sowing area and planting structure in 2030 are the same as those in 2017, and the cultivated land planted with other crops is changed to corn. Different models have differences in time scales, which we have simply dealt with. Grain trade is not taken into account in this study. These deficiencies will be improved in further research.
Data availability statement
The raw data supporting the conclusions of this article will be made available by the authors, without undue reservation.
Author contributions
CN: data analysis and article writing. JC: putting forward the idea of the paper and revision of the article. YQ: construction of crop models. AG: construction of hydrological models. All authors contributed to the article and approved the submitted version.
Funding
This study is supported by the National Natural Science Foundation of China (U2003204 and 51879214) and the National Key Research and Development Program of China (2021YFC3000203).
Acknowledgments
The authors would like to thank other researchers and institutions involved in the study.
Conflict of interest
Author YQ was employed by PowerChina Northwest Engineering Corporation Limited.
The remaining authors declare that the research was conducted in the absence of any commercial or financial relationships that could be construed as a potential conflict of interest.
Publisher's note
All claims expressed in this article are solely those of the authors and do not necessarily represent those of their affiliated organizations, or those of the publisher, the editors and the reviewers. Any product that may be evaluated in this article, or claim that may be made by its manufacturer, is not guaranteed or endorsed by the publisher.
References
Bossio, D., Geheb, K., and Critchley, W. (2010). Managing water by managing land: addressing land degradation to improve water productivity and rural livelihoods. Agric. Water Manag. 97, 536–542. doi: 10.1016/j.agwat.2008.12.001
Cai, X., and Rosegrant, M. W. (2004), Optional water development strategies for the Yellow River Basin: Balancing agricultural ecological water demands. Water Resour. Res. 40, W08S04. doi: 10.1029/2003WR002488
Challinor, A. J., Ewert, F., Arnold, S., Simelton, E., and Fraser, E. (2009). Crops and climate change: progress, trends, and challenges in simulating impacts and informing adaptation. J. Exp. Bot. 60, 2775–2789. doi: 10.1093/jxb/erp062
Challinor, A. J., Simelton, E. S., Fraser, E., Hemming, D., and Collins, M. (2010). Increased crop failure due to climate change: assessing adaptation options using models and socio-economic data for wheat in China. Environ. Res. Lett. 5, 034012. doi: 10.1088/1748-9326/5/3/034012
Chou, J., and Ye, D. (2006). Assessing the effect of climate changes on grains yields with a new economy-climate model. Clim. Environ. Res. 11, 347–353. doi: 10.3878/j.issn.1006-9585.2006.03.11
FAO (2019). The State of Food Security and Nutrition in the World 2019: Safeguarding Against Economic Slowdowns and Downturns, United Nations. Rome: FAO.
Foster, T., Brozović, N., Butler, A. P., Neale, C. M. U., Raes, D., Steduto, P., et al. (2017). AquaCrop-OS: an open source version of FAO's crop water productivity model. Agric. Water Manag. 181, 18–22. doi: 10.1016/j.agwat.2016.11.015
García-Vila, M., and Fereres, E. (2012). Combining the simulation crop model AquaCrop with an economic model for the optimization of irrigation management at farm level. Eur. J. Agron. 36, 21–31. doi: 10.1016/j.eja.2011.08.003
Godfray, H., Beddington, J. R., Crute, I. R., Haddad, L., Lawrence, D., Muir, J. F., et al. (2010). Food security: the challenge of feeding 9 billion people. Science 327, 812–818. doi: 10.1126/science.1185383
Gohar, A. A., and Cashman, A. (2016). A methodology to assess the impact of climate variability and change on water resources, food security and economic welfare. Agric. Syst. 147, 51–64. doi: 10.1016/j.agsy.2016.05.008
González-Rojí, S., Wilby, R., Sáenz, J., and Ibarra-Berastegi, G. (2019). Harmonized evaluation of daily precipitation downscaled using SDSM and WRF+WRFDA models over the Iberian Peninsula. Clim. Dyn. 53, 1413–1433. doi: 10.1007/s00382-019-04673-9
Guo, X. J., Zhang, R., Xie, N. M., and Jin, J. L. (2021). Predicting the population growth and structure of china based on grey fractional-order models. J. Math. 2021, 7725125. doi: 10.1155/2021/7725125
Harmel, R. D., Chaubey, I., Ale, S., Nejadhashemi, A. P., Irmak, S., DeJonge, K. C., et al. (2020). Perspectives on global water security. Trans. ASABE 63, 69–80. doi: 10.13031/trans.13524
Hassan, Z., Shamsudin, S., and Harun, S. (2014). Application of SDSM and LARS-WG for simulating and downscaling of rainfall and temperature. Theor. Appl. Climatol. 116, 243–257. doi: 10.1007/s00704-013-0951-8
Jin, W., Chang, J., Wang, Y., and Bai, T. (2019). Long-term water-sediment multi-objectives regulation of cascade reservoirs: a case study in the Upper Yellow River, China. J. Hydrol. 577, 123978. doi: 10.1016/j.jhydrol.2019.123978
Kim, D., Chun, J. A., and Inthavong, T. (2021). Managing climate risks in a nutrient-deficient paddy rice field using seasonal climate forecasts and AquaCrop. Agric. Water Manag. 256, 107073. doi: 10.1016/j.agwat.2021.107073
Lam, S., Dodd, W., Berrang-Ford, L., Ford, J., Skinner, K., Papadopoulos, A., et al. (2021). How are climate actions evaluated? A review of United Nations food security evaluations. Glob. Food Security Agric. Policy Econ. Environ. 28, 100509. doi: 10.1016/j.gfs.2021.100509
Lobell, D. B., Schlenker, W., and Costa-Roberts, J. (2011). Climate trends and global crop production since 1980. Science 333, 616–620. doi: 10.1126/science.1204531
Lu, S. B., Cai, W. T., Shao, W., Taghizadeh-Hesary, F., Faisal, M., Zhang, H. B., et al. (2021). Ecological water requirement in upper and middle reaches of the yellow river based on flow components and hydraulic index. Int. J. Environ. Res. Public Health 18, 10956. doi: 10.3390/ijerph182010956
Martinez, G. F., and Gupta, H. V. (2010), Toward improved identification of hydrological models: A diagnostic evaluation of the “abcd” monthly water balance model for the conterminous United States. Water Resour. Res. 46, W08507. doi: 10.1029/2009WR008294
Meng, X. M., Tu, L. P., Yan, C., and Wu, L. F. (2021). Forecast of annual water consumption in 31 regions of China considering GDP and population. Sust. Prod. Consumpt. 27, 713–736. doi: 10.1016/j.spc.2021.01.036
Ndiritu, S. W., and Muricho, G. (2021). Impact of climate change adaptation on food security: evidence from semi-arid lands, Kenya. Clim. Change. 167, 24–28. doi: 10.1007/s10584-021-03180-3
Piao, S., Ciais, P., Huang, Y., Shen, Z., Peng, S., Li, J., et al. (2010). The impacts of climate change on water resources and agriculture in China. Nature 467, 43–51. doi: 10.1038/nature09364
Pirmoradian, N., and Davatgar, N. (2019). Simulating the effects of climatic fluctuations on rice irrigation water requirement using AquaCrop. Agric. Water Manag. 213, 97–106. doi: 10.1016/j.agwat.2018.10.003
Pujol, G. (2009). Simplex-based screening designs for estimating metamodels. Reliability Eng. Syst. Saf. 94, 1156–1160. doi: 10.1016/j.ress.2008.08.002
Raes, D., Steduto, P., Hsiao, T. C., and Fereres, E. (2009). AquaCrop—the FAO Crop model to simulate yield response to water: II. main algorithms and software description. Agron. J. 101, 438–447. doi: 10.2134/agronj2008.0140s
Rosenzweig, C., and Tubiello, F. N. (1996). Effects of changes in minimum and maximum temperature on wheat yields in the central US A simulation study. Agricultural and Forest Meteorology 80, 215–230. doi: 10.1016/0168-1923(95)02299-6
Saddique, Q., Khan, M. I., Habib Ur Rahman, M., Jiatun, X., Waseem, M., Gaiser, T., et al. (2020). Effects of elevated air temperature and CO2 on maize production and water use efficiency under future climate change scenarios in Shaanxi Province, China. Atmosphere 11, 843.doi: 10.3390/atmos11080843
Saltelli, A., and Annoni, P. (2010). How to avoid a perfunctory sensitivity analysis. Environ. Modell. Softw. 25, 1508–1517. doi: 10.1016/j.envsoft.2010.04.012
Shrestha, N., Raes, D., Vanuytrecht, E., and Sah, S. K. (2013). Cereal yield stabilization in Terai (Nepal) by water and soil fertility management modeling. Agric. Water Manag. 122, 53–62. doi: 10.1016/j.agwat.2013.03.003
Smilovic, M., Gleeson, T., Adamowski, J., and Langhorn, C. (2019). More food with less water - optimizing agricultural water use. Adv. Water Resour. 123, 256–261. doi: 10.1016/j.advwatres.2018.09.016
Smith, G. R., and Archer, R. (2020). Climate, population, food security: adapting and evolving in times of global change. Int. J. Sust. Dev. World Ecol. 27, 419–423. doi: 10.1080/13504509.2020.1712558
Steduto, P., Hsiao, T. C., Raes, D., and Fereres, E. (2009). AquaCrop—the FAO Crop model to simulate yield response to water: I. concepts and underlying principles. Agron. J. 101, 426–437. doi: 10.2134/agronj2008.0139s
Thomas, H. A. (1981). Improved methods for national water assessment: Final report. Washington, DC: Center for Integrated Data Analytics Wisconsin Science Center.
Topalovic, Z., Todorovic, A., and Plavsic, J. (2020). Evaluating the transferability of monthly water balance models under changing climate conditions. Hydrol. Sci. J. 65, 928–950. doi: 10.1080/02626667.2020.1725238
Tryhorn, L., and DeGaetano, A. (2011). A comparison of techniques for downscaling extreme precipitation over the Northeastern United States. Int. J. Climatol. 31, 1975–1989. doi: 10.1002/joc.2208
Vanuytrecht, E., Raes, D., Steduto, P., Hsiao, T. C., Fereres, E., Heng, L. K., et al. (2014). AquaCrop: FAO's crop water productivity and yield response model. Environ. Modell. Softw. 62, 351–360. doi: 10.1016/j.envsoft.2014.08.005
Wang, J., Mendelsohn, R., Dinar, A., Huang, J., Rozelle, S., and Zhang, L. (2009). The impact of climate change on China's agriculture. Agric. Econ. 40, 323–337. doi: 10.1111/j.1574-0862.2009.00379.x
Wang, X., Gao, B., and Wang, X. (2020). A modified ABCD model with temperature-dependent parameters for cold regions: application to reconstruct the changing runoff in the headwater catchment of the Golmud River, China. Water 12, 1812. doi: 10.3390/w12061812
Wheeler, T., and von Braun, J. (2013). Climate change impacts on global food security. Science 341, 508–513. doi: 10.1126/science.1239402
Wilby, R. L., Dawson, C. W., and Barrow, E. M. (2002). sdsm — a decision support tool for the assessment of regional climate change impacts. Environ. Modell. Softw. 17, 145–157. doi: 10.1016/S1364-8152(01)00060-3
Wilby, R. L., Hay, L. E., and Leavesley, G. H. (1999). A comparison of downscaled and raw GCM output: implications for climate change scenarios in the San Juan River basin, Colorado. J. Hydrol. 225, 67–91. doi: 10.1016/S0022-1694(99)00136-5
Wisser, D., Frolking, S., Douglas, E. M., Fekete, B. M., Vorosmarty, C. J., and Schumann, A. H. (2008). Global irrigation water demand: variability and uncertainties arising from agricultural and climate data sets. Geophys. Res. Lett. 35. doi: 10.1029/2008GL035296
WWA. (2014). The United Nations World Water Development Report 2014: Water and Energy, UNESCO. Paris: WWA.
Xu, Y., Chou, J. M., Yang, F., Sun, M. Y., Zhao, W. X., and Li, J. N. (2021). Assessing the sensitivity of main crop yields to climate change impacts in China. Atmosphere 12, 172. doi: 10.3390/atmos12020172
Yang, Y. E., Zhao, J., and Cai, X. (2010). “A multi-agent system based model for water allocation management in the yellow river basin,” in World Environmental and Water Resources Congress Conference (Providence, RI: ASCE). doi: 10.1061/41114(371)273
Yang, Y. E., Zhao, J., and Cai, X. (2012). Decentralized optimization method for water allocation management in the Yellow River Basin. J. Water Resour. Plann. Manag. 138, 313–325. doi: 10.1061/(ASCE)WR.1943-5452.0000199
Yao, C., Teng, Y., and Huang, L. (2015). Evaluation index system construction and empirical analysis on food security in China. Trans. Chin. Soc. Agric. Eng. 31, 1–10. doi: 10.3969/j.issn.10026819.2015.04.001
Ye, L., Xiong, W., Li, Z., Yang, P., Wu, W., Yang, G., et al. (2013). Climate change impact on China food security in 2050. Agron. Sustain. Dev. 33, 363–374. doi: 10.1007/s13593-012-0102-0
Zhang, T., Zhu, J., Yang, X., and Zhang, X. (2008). Correlation changes between rice yields in North and Northwest China and ENSO from 1960 to 2004. Agric. Forest Meteorol. 148, 1021–1033. doi: 10.1016/j.agrformet.2008.01.018
Zhou, L., and Turvey, C. G. (2014). Climate change, adaptation and China's grain production. China Econ. Rev. 28, 72–89. doi: 10.1016/j.chieco.2014.01.001
Keywords: climate change, water resources constraint, grain yield (GY), food security, yellow river basin
Citation: Niu C, Qi Y, Guo A and Chang J (2022) Grain yield and food security evaluation in the yellow river basin under climate change and water resources constraints. Front. Water 4:908945. doi: 10.3389/frwa.2022.908945
Received: 31 March 2022; Accepted: 01 August 2022;
Published: 25 August 2022.
Edited by:
Tiesong Hu, Wuhan University, ChinaCopyright © 2022 Niu, Qi, Guo and Chang. This is an open-access article distributed under the terms of the Creative Commons Attribution License (CC BY). The use, distribution or reproduction in other forums is permitted, provided the original author(s) and the copyright owner(s) are credited and that the original publication in this journal is cited, in accordance with accepted academic practice. No use, distribution or reproduction is permitted which does not comply with these terms.
*Correspondence: Jianxia Chang, Y2h4aWFuZ0B4YXV0LmVkdS5jbg==