 Jinhui Zhou
 Laura Scherer
 Peter M. van Bodegom
 Arthur H. W. Beusen
 José M. Mogollón
95% of researchers rate our articles as excellent or good
Learn more about the work of our research integrity team to safeguard the quality of each article we publish.
Find out more
ORIGINAL RESEARCH article
Front. Water , 30 June 2022
Sec. Environmental Water Quality
Volume 4 - 2022 | https://doi.org/10.3389/frwa.2022.894604
This article is part of the Research Topic Nutrient Dynamics in the Modern Hydrosphere View all 8 articles
Against the backdrop of increasing agricultural production, population, and freshwater/coastal eutrophication, studies are aiming to understand the behavior of nitrogen (N) and phosphorus (P) in the global freshwater system. Global nutrient models are typically used to quantify the nutrient amount and content in freshwater systems across different river orders and catchments. Such models typically use empirically derived nutrient retention equations for predicting nutrient fate, and these equations may be derived using data from a specific region or environment or for a specific context. Here we used IMAGE-GNM, a spatially explicit nutrient model at a half-degree resolution, to examine the performance of several well-known empirical equations by comparing the respective model outcomes with observed data on a global scale. The results show that (1) globally, the empirical retention equations work better for predicting N fate than P fate; (2) hydraulic drivers are the most important factor affecting the residual of total N and P concentrations, compared with the functional forms and the coefficients in the empirical equations. This study can aid in assessing the variability and accuracy of various retention equations from regional to global scales, and thus further strengthen our understanding of global eutrophication.
During the twentieth century, the global cycles of nitrogen (N) and phosphorus (P) have shown a rapid acceleration due to increasing nitrogen fixation and phosphate mining (Jenny et al., 2016). Over the twentieth century, humans have almost doubled the global N and P delivery to freshwater systems from 34 to 64 Tg N yr−1, and 5 to 9 Tg P yr−1, respectively (Beusen et al., 2016). Due to a combination of N and P excessive nutrient loading, the global freshwater and coastal system has seen a major increase in eutrophication. Eutrophication can lead to the proliferation of algae blooms and hypoxia (Müller et al., 2012; Chislock et al., 2013), which consequently threatens the balance of environmental and ecological systems (Schindler and Vallentyne, 2008; Vonlanthen et al., 2012; Jenny et al., 2016). Toward the future, the rising trend of nutrient accumulation in freshwater systems is set to continue due to the increase of fertilizer application and global population growth (Mogollón et al., 2018). Moreover, warmer climates can lead to an acceleration of the hydrological cycle, which signifies both increasing evaporation and freshwater advection, and thus likely to exacerbate change in global nutrient cycles (Bouraoui et al., 2004; Statham, 2012). Thus, while global in-stream nutrient retention tends to vary slightly and stay stable under various future scenarios, N export to oceans is set to increase by up to 20% under future scenarios, unless human strictly takes sustainable practices in nutrient application and water use (i.e., Shared Socio-economic Pathway SSP1) (Beusen et al., 2022).
To better curb the increasing trend of eutrophication over the global aquatic system, the first step is to assess the fate of N and P, which requires regional to global nutrient models.
Despite the various modeling efforts, global estimates of nutrient exports are still highly variable. For instance, the estimated total phosphorus (TP) export of NEWS-2 (9 Tg yr−1) is almost double the export of IMAGE-GNM (4 Tg yr−1, Harrison et al., 2019), and total nitrogen (TN) of NEWS-2 (45 Tg yr−1) is also higher than that of IMAGE-GNM (37 Tg yr−1, van Vliet et al., 2019). van Vliet et al. (2019) and Grizzetti et al. (2015) reckoned that this issue results from the discrepancy in hydrological input data, spatial resolution, and the method used to calculate retention. Retention indicates the difference between nutrient input and output within a river segment or a lake. N retention includes the removal processes of denitrification, sedimentation, and uptake by aquatic vegetation (Saunders and Kalff, 2001), while P retention is affected by entrainment, sedimentation, sorption, as well as by uptake by plants and organisms (Reddy et al., 1999). Historically, retention is modeled through empirical equations based on regression analyses of localized nutrient input-output data (Kelly et al., 1987; Behrendt and Opitz, 1999). These regression analyses are based on localized studies (Kirchner and Dillon, 1975; Seitzinger et al., 2002). So far, current studies have never compared the performance of the various retention models globally. Identifying the best-performing retention models for global nutrient models can contribute to the future knowledge of eutrophic impacts (e.g., nutrient loading/export to aquatic systems) (Jeppesen et al., 2009).
Kelly et al. (1987) proposed a mass balance model for N denitrification loss, and Howarth et al. (1997) employed this model to estimate N retention. Later on, Behrendt and Opitz (1999) found that this model can also be applied to P. They investigated 100 European rivers and developed a regression between retention and different hydraulic drivers, including hydraulic load and specific runoff. De Klein (2008) discovered large monthly variability in retention and the necessity to distinguish among drivers for N and P (e.g., P is highly related to temperature while N is not) after studying 13 catchments in the Netherlands and Germany. Furthermore, in contrast to N, P is susceptible to water body types due to its susceptibility to sedimentation and sorption (Reddy et al., 1999). Thus, the estimation of P retention should be based on different drivers for lakes vs. rivers. By analyzing 15 lakes in Canada, Kirchner and Dillon (1975) posited that the major driver of P retention was the areal water load (as opposed to the hydraulic load, the areal water load is related to specific runoff, Equation 4), whereas Chapra (1975) argued that P retention could be better represented by apparent settling velocity in these lakes. Brett and Benjamin (2008) examined 305 input/output data of lakes and reservoirs in the USA and Canada and concluded that the main driver of lake P retention is residence time. In these studies, retention is dominated by hydrological drivers, i.e., hydraulic load and specific runoff. These drivers can only be converted from one into the other if the information of additional variables (i.e., water volume and depth) is provided. Such information is highly uncertain, which could potentially lead to biased estimates and increased uncertainties. Investigating this key feature was at the core of our study.
The aim of this study is to identify the best-performing retention model or set of regional retention models to assess the fate of global nutrients in freshwater systems. We adapted IMAGE-GNM to include a comprehensive set of retention equations. The retention models were examined by comparing the respective model outcomes with observed data. The model performance was also analyzed for different geographical zones (Geographical Zone, 2009), including the North Frigid Zone, the North Temperate Zone, the Torrid Zone, and the South Temperate Zone to discover the response of nutrient retention to hydrological conditions. The set of best-performing retention models can be applied to improve the accuracy of global nutrient models, which helps to better understand the global states of water quality.
In this study, we choose to use IMAGE-GNM (Beusen et al., 2015) as it is the best-fit nutrient model for our study among the most widely recognized nutrient models reviewed in MIPs (van Vliet et al., 2019). Of these, MARINA is a downscaled application of NEWS-2 to China and has not been employed for worldwide modeling (Strokal et al., 2016). HYPE has been used to estimate global hydrology (Arheimer et al., 2020), while for nutrients, this model was only developed at the regional scale, such as Europe (Strömbäck et al., 2019). Similarly, SPARROW was localized to the USA (McCrackin et al., 2013) and New Zealand (Alexander et al., 2002). Globally, NEWS-2 is differentiated at the watershed scale, while the resolution of IMAGE-GNM is gridded (0.5 × 0.5°). Thus, compared to NEWS-2, IMAGE-GNM captures the inner-basin information, which is unneglectable since the geographical variation of nutrients within large watersheds is highly uneven. This spatial delineation allows validating nutrient data since the measurement stations are scattered over the watersheds and cannot reflect the estimation of the whole watershed.
IMAGE-GNM is a dynamic distributed model that depicts nutrient flow and delivery processes in soils, freshwater systems, and export to coasts. A detailed description and the code (written in Python 2.7) of IMAGE-GNM can be found in Beusen et al. (2015). In this study, different retention equations were implemented into IMAGE-GNM (section Global Nutrient Model). The simulated concentration of TN/TP in rivers and TP in lakes were compared with respective observed data (described in section Retention Models). We distinguished between lakes and rivers when validating P estimates to account for the strong links between P fate and lake ecology (Brett and Benjamin, 2008). For N, we deemed this distinction unnecessary since N retention can be entirely represented by the water discharge difference between these water bodies (Saunders and Kalff, 2001). Due to a lack of TN observations in global lakes, the performance of simulated TN in lakes was not assessed in this study.
Load-weighted nutrient water body retention (RL, dimensionless) indicates the proportion of retention load (RN,P, kg yr−1) to the load of nutrients transported to the freshwater system (LN,P, kg yr−1).
where ON,P (kg yr−1) denotes the export of nutrients at the outlet of the water body.
In our study, we only included strictly empirical models of mostly pure hydrological nature. Some empirical models also account for ecological nature, namely hydro-ecological retention models, whereas in this study the only two models that may be considered hydro-ecological models are the model of Wollheim et al. (2006) [section Hydraulic-Load-Driven Models (1)] and De Klein (2008) [for P, section Specific-Runoff-Driven Models (2)]. In this study, however, we only focused on the hydrological part and represented ecological impacts by temperature factors. The hydrological drivers in retention models are represented by the empirical function of hydraulic drivers, including hydraulic load (Equation 2) and specific runoff (Equation 3). We elaborate on these functions raised in literature in sections 3.1.1–3.1.2 and summarize all models in Table 1.
where HL (m yr−1) is the hydraulic load represented by quotient between the depth (D, m) and residence time (tr, yr) of the water body; q (L km−2 s−1) is the catchment area-specific runoff, which equals the discharge (Q, L s−1) divided by catchment area (A, km2).
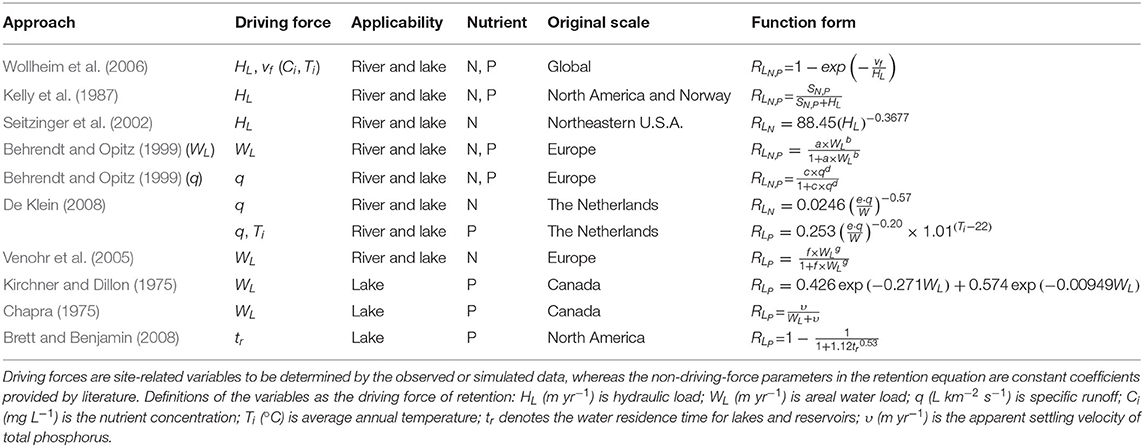
Table 1. Summary of retention models proposed by previous studies.
The specific runoff can also be expressed as areal water load WL(m yr−1, Equation 4), which denotes the annual value of the water column height per water surface area in the unit of specific flow:
where q (L km−2 s−1) is the specific runoff introduced in Equation (3), W (%) is a ratio of the surface water area to the watershed area, and 8.64 × 0.365 is a coefficient to convert the unit from L km−2 s−1 to m yr−1.
(1) Wollheim et al. (2006, 2008)
Current IMAGE-GNM employs Wollheim et al.'s (2006, 2008) equation as the retention model. Here, the retention RLN,P is defined as a first-order degradation process (Equation 5).
where vf (m yr−1) indicates the net uptake velocity expressing the biochemical features of a nutrient. vf for P (Equation 6) takes a basic value of 44.5 m yr−1 (Behrendt and Opitz, 1999) and is modified by the temperature factor f(T) (Equation 8):
For N, vf (Equation 7) is initialized to 35 m yr−1 (Wollheim et al., 2006, 2008) and modified by the temperature factor and concentration factor f (CN), which is proposed by Beusen et al. (2015):
where f (CN) represents the effect of concentration on denitrification resulting from electron donor limitation if excessive N is transported into the water (Mulholland et al., 2008). f (CN) was calculated as an approximation of a hyperbolic function which contains the following points: 7.2 at CN = 0.0001 mg L−1 and 1 at a turning point CN = 1 mg L−1, and continues to decline mildly to 0.37 at CN = 100 mg L−1 and keep constant for a higher concentration (Marcé and Armengol, 2009).
where α is 1.06 for P (Marcé and Armengol, 2009) and 1.0717 for N (Mulholland et al., 2008); T is average annual temperature (°C).
Kelly et al. (1987) proposed a simple mass balance model for the N denitrification losses in lakes and Howarth et al. (1997) used this mass transfer model to estimate the N retention of rivers. Behrendt and Opitz (1999) found this equation can be used to estimate phosphorus retention. Their studies have shown that this function form can be applied to both river systems and lakes.
where SN,P is an average mass transfer coefficient given in m yr−1. Behrendt and Opitz (1999) estimated the mass transfer coefficient SN for nitrogen (N) as 11.9 and SP for phosphorus (P) as 16.1.
Seitzinger et al. (2002) combined N observations from 10 rivers and 23 lakes in the USA. This study provided the equation of N retention as Equation (10) and proved it applies to rivers, lakes, and reservoirs:
Behrendt and Opitz (1999) investigated Dissolved Inorganic N (DIN) measurements and provided two correlation equations for nutrients. While IMAGE-GNM calculates TN, DIN is the major component of TN. We, therefore, included these two equations in our research. Note that they defined “emission” as the inflow flux of nutrients to the aquatic system, which is equivalent to “load (LN,P)” in IMAGE-GNM, while the term “load” used in their study indicated the nutrient exported at the outlet of the river, which equals the “output (ON,P)” defined in IMAGE-GNM. Therefore, it necessitates a conversion from the output-weighted retention RON,P to load-weighted RLN,P (Equation 11).
The first statistical equation is expressed by a power function of areal water load WL:
where a and b are statistical coefficients. For N, a equals 5.9 and b equals −0.75; for P, a and b are 13.3 and and −0.93, respectively.
The second retention equation, in which the driving force is the catchment area-specific runoff q, can be expressed as:
where c and d are statistical coefficients. For N, c is 6.9 and d is −1.10; for P, c and d are 26.6 and −1.71, respectively.
Behrendt and Opitz (1999) (WL) and Behrendt and Opitz (1999) (q) were used to identify the retention equations driven by areal water load WL and the catchment area-specific runoff q, respectively, in the following sections.
(2) De Klein (2008)
De Klein (2008) studied monthly TN retention for catchments whose areas ranged from 20.8 to 486 km2. The results of this study showed that load-weighted nitrogen retention RL is inversely related to surface water area-specific runoff (SR, m3 ha−1 s−1). The SR can be expressed as a ratio of specific runoff to the surface water area.
De Klein (2008) gave a retention equation based on the monthly time step. It was then aggregated to an annual scale by summing the monthly inputs and the estimation of monthly exports. De Klein (2008) argued that the difference between monthly retention and annual retention of N was negligible, whereas, for P, the status remains uncertain. However, we assume that the equation still works for P at an annual time step.
Herein, the retention equation of N can be expressed as:
where e is a unit conversion coefficient of 107, W (%) is the percentage of surface water area to watershed area (including land area and water area).
Besides SR, P retention is also determined by temperature:
where Ti is the average water temperature (°C).
Venohr et al. (2005) provided another group of statistical coefficients for TN retention based on the same dataset as Behrendt and Opitz (1999). Venohr et al. (2005) distinguished water bodies by assigning different coefficients for lakes, rivers, and reservoirs (Equation 16):
where f and g are statistical coefficients. F is 1.9 and g is −0.49 for rivers; f is 7.279 and g is −1 for lakes and reservoirs.
(1) Kirchner and Dillon (1975)
By analyzing nutrient budget information from 15 Canadian lakes, Kirchner and Dillon (1975) developed an empirical equation for the retention of phosphorus in lakes:
(2) Chapra (1975)
In contrast to Chapra (1975), Kirchner and Dillon (1975) argued that the retention of P can be more precisely related to both the areal water load WL and the settling velocity of P-contained particles (υ), assuming the lake is at a steady state:
where υ (m yr−1) is the apparent settling velocity of TP, which was estimated as 16 m yr−1.
Brett and Benjamin (2008) conducted a statistical reassessment of total phosphorus (TP) input/output data to determine which hydraulic driver is most strongly associated with lake phosphorus concentration and retention. They provided the best-fit equation as Equation (19):
where tr (yr) denotes the water residence time of lakes and reservoirs.
Water quality sample data, including TN and TP concentrations, were obtained from the Global Freshwater Quality Database (GEMStats, UNEP GEMS/Water Programme, 2007), Global River Chemistry Database (GLORICH, Hartmann et al., 2019), and United States Geological Survey (USGS, Aulenbach et al., 2007). We downloaded the datasets on September 17, 2021. The sample data from literature covers the main rivers of Africa and Asia, including the Nile River (El-Sadek, 2011; Sinada and Yousif, 2013), the Pearl River (Liu et al., 2009), the Yangtze River (Sun C. C. et al., 2013; Sun C. et al., 2013; Maotian et al., 2014; Liu et al., 2018), and the Yellow River (Chen et al., 2004; Tao et al., 2010). We used a DIN/TN ratio of 50% to transform dissolved inorganic nitrogen (DIN) into TN for the Yangtze River (Yan et al., 2001; Liu et al., 2018) and took a DIN/TN (the same as NO3/TN, since nitrite NO2 occupies less than 1% of DIN and the ammonium concentration is low in rivers) ratio of 77% for the Nile River, the Yellow River, and the Pearl River (Turner et al., 2003). For computing TP, we used a ratio of 62% to transfer PO4 into TP data (Turner et al., 2003).
We selected the data reported in the year 2000 since it is the last representative (most recent) year of IMAGE-GNM (Beusen et al., 2015). The samples include 9,770 items of TN data from 1,199 river stations, 19,701 items of TP data from 2,261 river stations, and 141 items of TP data from 23 stations of 7 lakes. The depth and residence time of lakes were derived from the World Lake Database (Herschy, 2012) except for Ashkui at narrows in Seal Lake and Wuchusk Lake, which lack measured data. For these two lakes, we applied the prediction of PCR-GLOBWB, the global hydrological model running on a grid cell level that has been integrated into IMAGE-GNM. Note that in the validation of lake retention equations, including Chapra (1975), Kirchner and Dillon (1975), and Brett and Benjamin (2008), we apply Wollheim et al.'s (2006) equation to calculate river retention in the cells that contain no lakes or reservoirs.
For validation, the cells with an invalid hydrological parameter (i.e., zero discharge and zero volume) were removed. To avoid errors raised by inadequate spatial data representation, basins with fewer than 10 grid cells were also excluded (Beusen et al., 2015). Consequently, 82% of the river sample items from 1,157 river stations for TN and 91% of the river sample items from 2,185 river stations for TP were included in the analysis (Figure 1). The validation was conducted based on a 0.5 × 0.5° grid-cell scale based on the resolution of predicted results of IMAGE-GNM. When stations were located within the same cell, the average of the samples was taken as observed data.
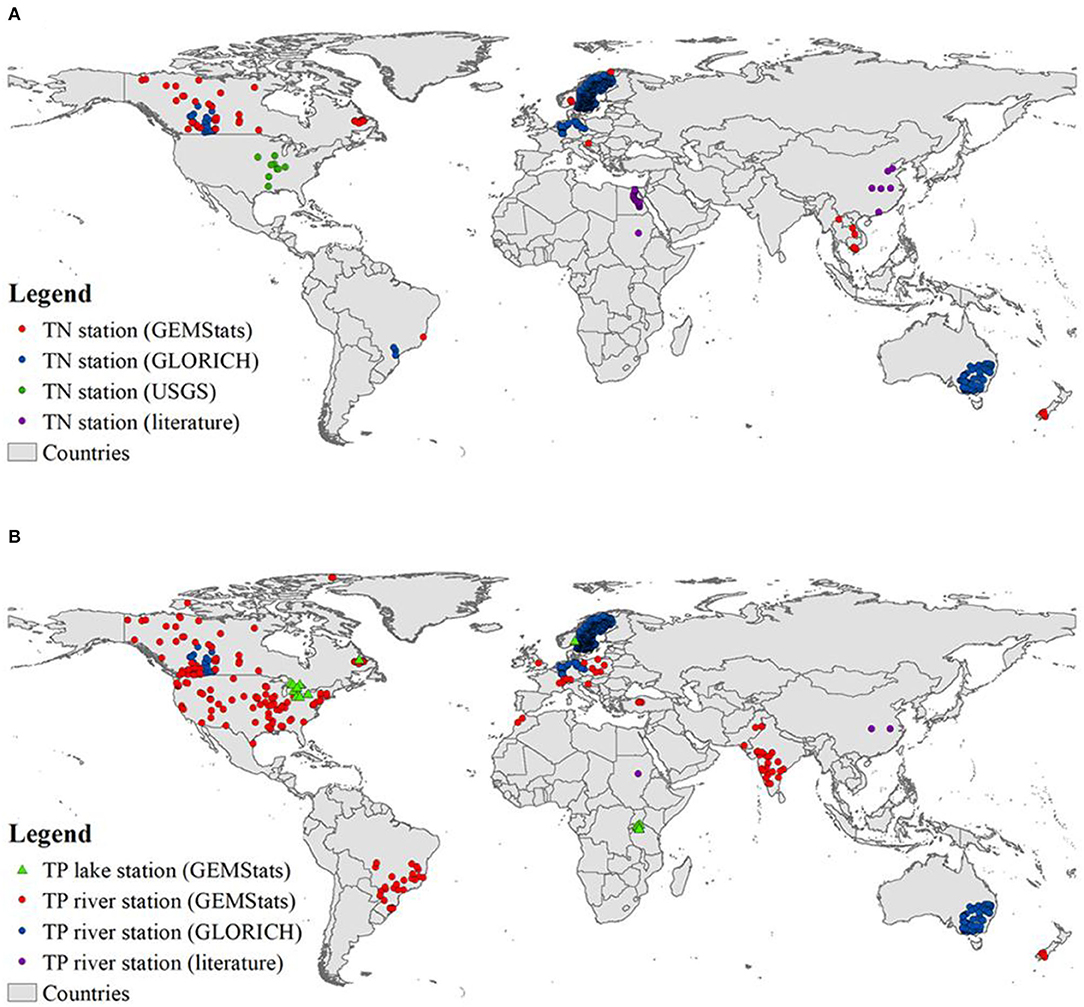
Figure 1. Sampling stations of (A) TN and (B) TP concentration over the globe. For N, all the stations are river stations. Note that (1) due to a lack of TN observations in global lakes, lake TN was not assessed in this study; (2) for TP, GEMStats has included USGS data. (3) in total, there are 1,157 TN river stations including 63, 823, 261, and 10 stations distributed in North Frigid Zone, North Temperate Zone, South Temperate Zone, and Torrid Zone, respectively; for TP, the respective geographical zone contains 68, 1,535, 493, and 89 river stations (2,185 TP river stations globally).
We used the interquartile range (IQR = Q3–Q1) to describe the dispersion and employed Yule's coefficient (Yule's coefficient = ) to depict the skewness of simulated retention through non-parametric coefficient (Yule and Kendall, 1968); where Q1, Q2, Q3 denote the 25th percentile, 50th percentile, and 75th percentile respectively.
We employed the mean-Normalized Root Mean Square Error (NRMSE) to evaluate the error between predicted and observed nutrient concentrations of each retention model.
where Ō is the average of observations; n is the number of pairs of predicted-observed data; Oi and Pi are the observed value and predicted value of the ith cell, respectively.
The retention model that has a minimal NRMSE generates the lowest discrepancy between predicted values and observed values. NRMSE is a widely used criterion for the validation of nutrient concentrations (e.g., Beusen et al., 2015; Liu et al., 2018). However, NRMSE is quite sensitive to extremes, in particular to extremely high values. The Pearson correlation coefficient (r) is complementary to it and assesses the dynamic behavior of the model rather than the bias.
We used a logarithmic transformation to linearize the pairwise data and use r to evaluate the correlation between predictions and observations. Meanwhile, taking r of logarithmic data into account also lessens the likelihood risk of misjudging the performance of right-skewed residuals.
Ideally, NRMSE is close to zero (on a range from 0 to unlimited) and r close to 1 (on a range from −1 to 1).
We applied one-way Analysis of variance (ANOVA) to evaluate the significance of differences in performance among retention models. Here, as a measure of performance, the difference in simulated and observed concentration in a sampled grid cell was taken. The mean difference (i.e., whether a model consistently over- or underestimated retention and corresponding concentration) was evaluated.
To verify normality, the distribution of residuals of each model was judged based on probability plots. Then, we examined the homoscedasticity with the Brown–Forsythe test (Brown and Forsythe, 1974) due to its robustness and its maintenance of good statistical power (Derrick et al., 2018). TP showed heteroscedasticity and was analyzed with Welch's ANOVA instead. To evaluate the differences in retention between specific pairs, we conducted a pairwise comparison using Tukey's honestly significant difference (HSD) for homoscedastic data and a Games-Howell post-hoc test for heteroscedastic data between pairs of samples.
The analysis was accomplished using Python 3.7. Details of packages/versions/functions are listed in Supplementary Table S1.
The plots of riverine simulation against observations show that the empirical equations perform better for TN than for TP (Figures 2, 3). Furthermore, the NRMSE of TN outcomes ranges from 1.62 to 2.31, which is much smaller than the NRMSE of TP whose interval is between 4.97 and 13.84. The Pearson's r of TN is higher than that of TP (Tables 2, 3).
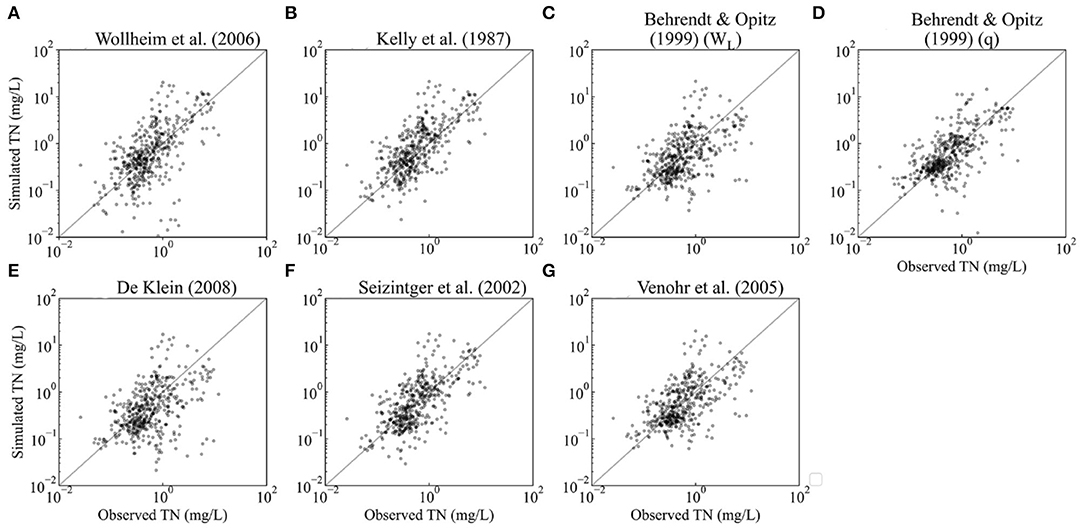
Figure 2. Validation of predicted values against observations of annual average concentration for riverine N (each dot represents the predicted values against average observed N concentration of the measurement stations within the same cell). The sample size is 449, the number of grid cells covered by measurement stations. (A–G) indicate the plots of different retention models.
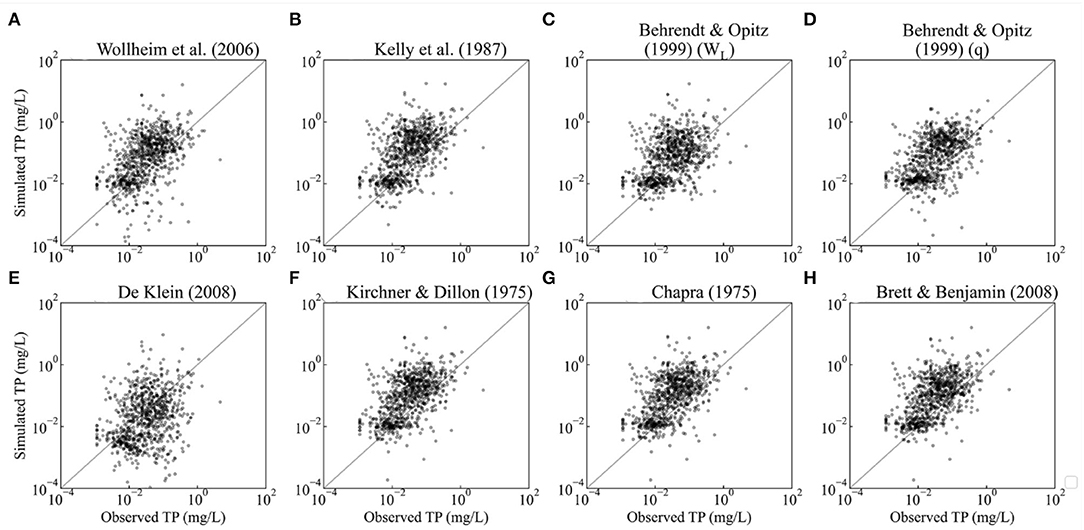
Figure 3. Validation of predicted values against observations of annual average concentration for riverine P (each dot represents the predicted values against average observed P concentration of the measurement stations within the same cell). The sample size is 849, the number of grid cells covered by measurement stations. (A–H) indicate the plots of different retention models.
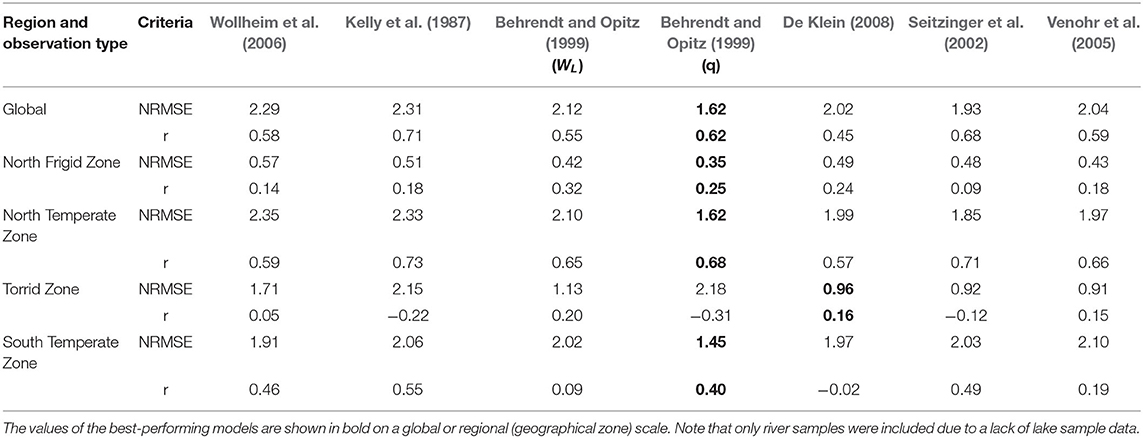
Table 2. Assessment of the performance of N retention models for rivers.

Table 3. Assessment of the performance of P retention models for rivers and lakes.
The retention models of Behrendt and Opitz (1999) (q) generated the lowest NRMSE and a satisfactory Pearson's r (>0.5) for both N and P, being the best option for estimating riverine retention of TN/TP.
Among TN retention models, with the exception of Behrendt and Opitz (1999) (q) and Seitzinger et al. (2002), the models' NRMSEs are higher than 2. The largest NRMSE (2.31) was generated by the retention model of Kelly et al. (1987) despite having the largest r value of 0.71. Behrendt and Opitz's (1999) (q) r is 0.62, which shows an acceptable correlation between the simulated and observed concentrations. Hence, the retention model of Behrendt and Opitz (1999) (q) performs best for TN according to our analyses and validation dataset. Compared with Wollheim et al. (2006), which is the currently used retention equation in IMAGE-GNM [see section Hydraulic-Load-Driven Models (1)], Behrendt and Opitz (1999) (q) can reduce the NRMSE by 41% for estimating riverine TN concentration globally.
The retention model of Behrendt and Opitz (1999) (q) also simulated the lowest NRMSE (4.97) for P retention, followed by that of De Klein (2008) (6.40), whose Pearson's r is the lowest (0.26). Excepting the retention model of De Klein (2008), the difference in Pearson's r among the models is quite minor, ranging from 0.42 to 0.54. However, aside from Behrendt and Opitz (q) and De Klein (2008), the NRMSEs of the models exceed 10. The best-performing model, Behrendt and Opitz (1999) (q), can reduce the NRMSE of Wollheim et al. (2006) by 107%.
The comparison between simulated and observed TP concentrations in lakes is shown in Figure 4. Since the measurements vary considerably across the locations of stations within a lake, we plotted measurements as boxplots to show the variation. In Mjøsa and Wuchusk Lake, the simulations of all the models are higher than the observed TP concentration, while in other lakes, simulated TP is closer to the observations. De Klein's (2008) residuals (i.e., the difference between simulated and average observed concentration in a lake) in Mjøsa and Wuchusk Lake are the smallest among empirical equations. Besides, De Klein's (2008) simulations of other lakes do not deviate from the observed measurement intervals, yielding the best performing empirical equation.
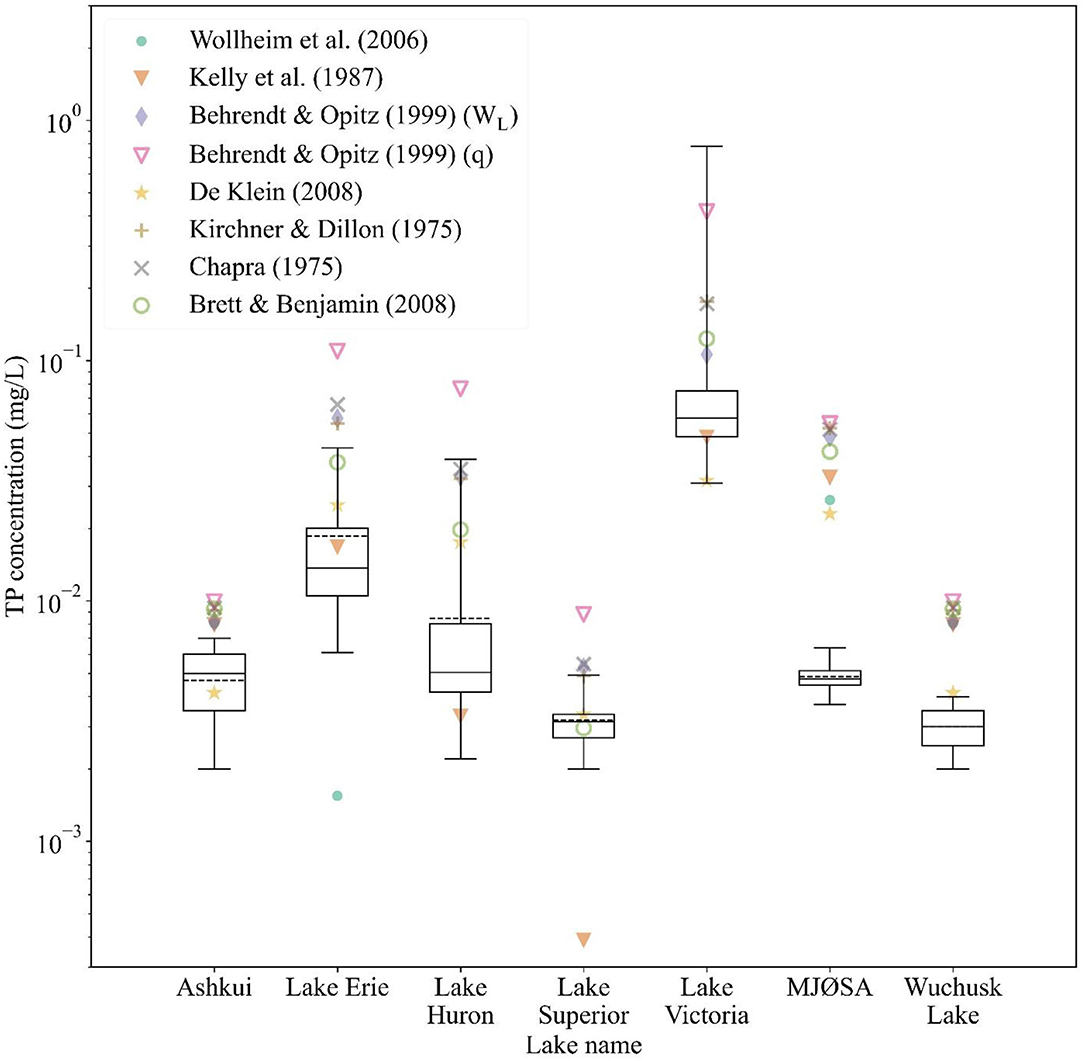
Figure 4. Simulated TP concentration of lakes compared with observed values. The boxplot shows the range of observed TP concentrations of each lake: the dark solid lines in the boxes are the median value of observations; the dark dash lines are the average of observations; the upper and lower borders of the boxes indicate 75th percentile and 25th percentile of observations; the whiskers denote upper and lower extremes of observations. IMAGE-GNM simulates lake concentration at the outlet cell of the lake, providing one value (average concentration) for each lake. Note that Wollheim et al.'s (2008) simulation of Lake Huron, Lake Superior, and Lake Victoria is not shown in the log-scaled figure, as it predicted an extremely low concentration (<0.0001 mg/L) for these lakes.
The NRMSE and Pearson's r of De Klein (2008) are 1.09 and 0.77 (Table 3). De Klein (2008) has the second-lowest NRMSE following Kelly et al. (1987) (0.89), but Kelly et al.'s (1987) r shows the second-worst performance (0.59). Behrendt and Opitz (1999) (q) has the highest Pearson's of 0.92 as well as the highest NRMSE (8.18). NRMSE and r of Wollheim et al. (2006) are 1.81 and −0.47, respectively, both of which perform worse than Kelly et al. (1987), Behrendt and Opitz (1999) (WL), De Klein (2008), and Brett and Benjamin (2008). Replacing the retention equation of De Klein (2008) with Wollheim et al. (2006) in IMAGE-GNM can reduce the NRMSE in lakes by 66%.
The performance of empirical equations differs by geographical zone (Tables 2, 3). For the N retention models, Behrendt and Opitz (1999) (q) obtained the lowest NRMSE in the North Frigid Zone, North Temperate Zone, and South Temperate Zone, which can lower the NRMSE by Wollheim et al. (2006) by 63, 45, and 32% in the respective regions. In the Torrid Zone, Venohr et al. (2005) performed the best, as it reduces the NRMSE by 88% compared with the currently used retention equation. For P, Behrendt and Opitz (1999) (q) is the best-performing retention model in North Temperate Zone and Torrid zone, reducing the NRMSE of Wollheim et al. (2006) by 132 and 146%, whereas the riverine retention model Wollheim et al. (2006) combined with the lake retention models of Kirchner and Dillon (1975) or Chapra (1975) provides the best fit of retention in the North Frigid Zone. Wollheim et al. (2006) is also recommended in the South Temperate Zone, as it has both the second-lowest NRMSE and the second-highest r. The best retention models of different geographical zones are presented in bold in Tables 2, 3 and listed in Supplementary Table S2.
Figure 5 (TN) and Figure 6 (TP) show that different retention models generate similar hotspot distributions. The hydraulic-load-driven models [i.e., retention models of Kelly et al. (1987), Seitzinger et al. (2002), and Wollheim et al. (2006)] predicted relatively lower retention than specific-runoff-driven models [i.e., retention models of Behrendt and Opitz (1999), Venohr et al. (2005), and De Klein (2008)].

Figure 5. N retention for different models at a half-degree resolution (Retention is dimensionless, and the unit was labeled as “-”). (A–G) indicate the plots of different retention models.
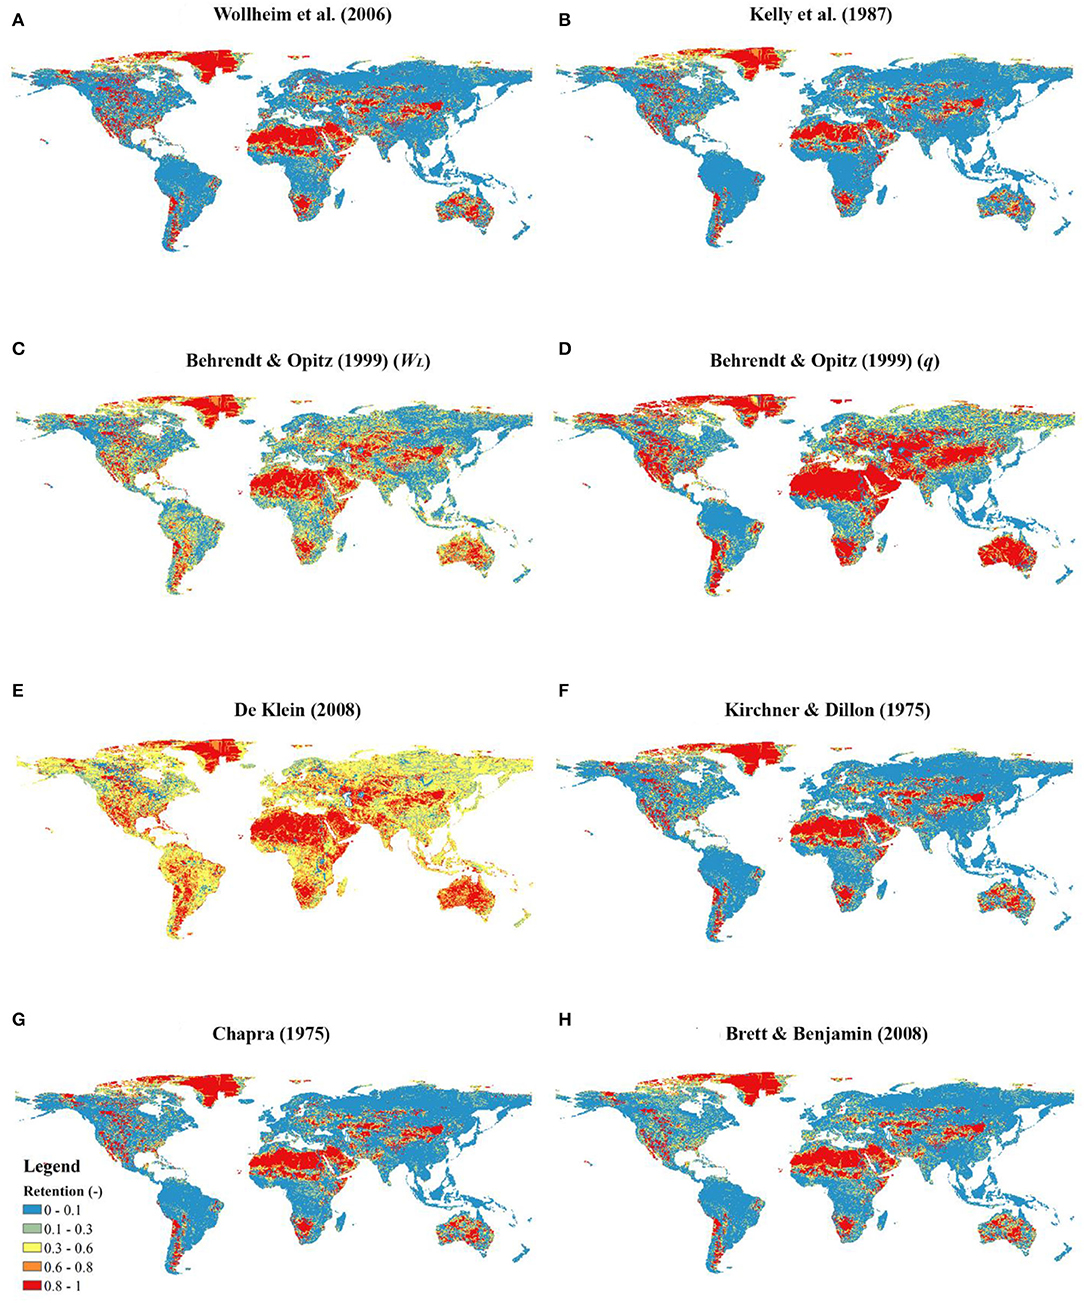
Figure 6. P retention maps for different models at a half-degree resolution (Retention is dimensionless, and the unit was labeled as “-”). (A–H) indicate the plots of different retention models.
Despite different hydraulic driving forces among retention models, the hotspots of all the models are located in arid zones, South Africa, West Argentina, Mississippi River Basin, and Colorado River Basin. However, low retention values are quite distinct. For N, retention values under or equal to 0.1 cover over 50% of the global area in hydraulic-load-driven models [i.e., the retention models of Kelly et al. (1987), Seitzinger et al. (2002), and Wollheim et al. (2006)]. In contrast, in specific-runoff driven models [i.e., the retention models of Behrendt and Opitz (1999), Venohr et al. (2005), and De Klein (2008)], low retention (≤0.1) occurs in only 24–30% of the global area. For P, regions with retention under or equal to 0.1 calculated by hydraulic-load-driven models [i.e., retention models of Kelly et al. (1987) and Wollheim et al. (2006)] occupy 58 and 66% of the global area, respectively. In contrast, low retention values (≤0.1) in specific-runoff driven models [i.e., the retention models of Behrendt and Opitz (1999) (WL), Behrendt and Opitz (1999) (q), and De Klein (2008)], occur in <36%. In particular De Klein's (2008) model only generated 5% low-value retention globally.
The dispersion (represented by IQR) and skewness (represented by Yule's coefficient) between N and P retention showed only minor differences except for De Klein (2008) (Tables 4, 5), which predicted a much smaller dispersion and skewness for P when compared with N.
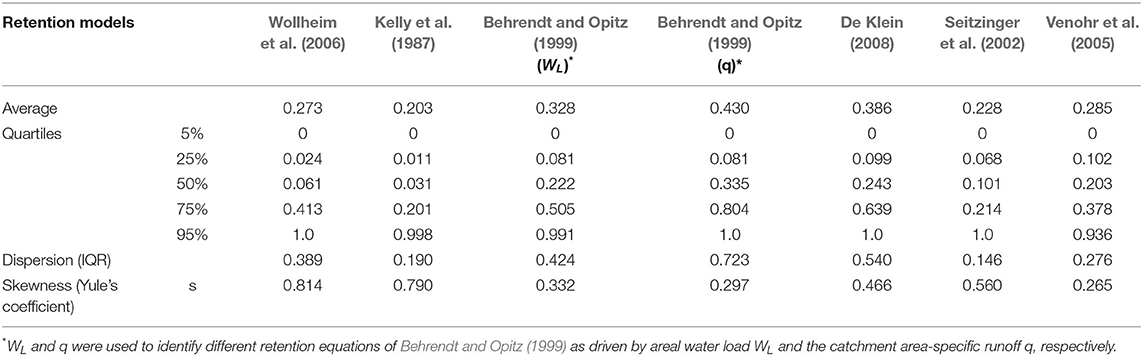
Table 4. Descriptive statistics of N retention of different retention models.
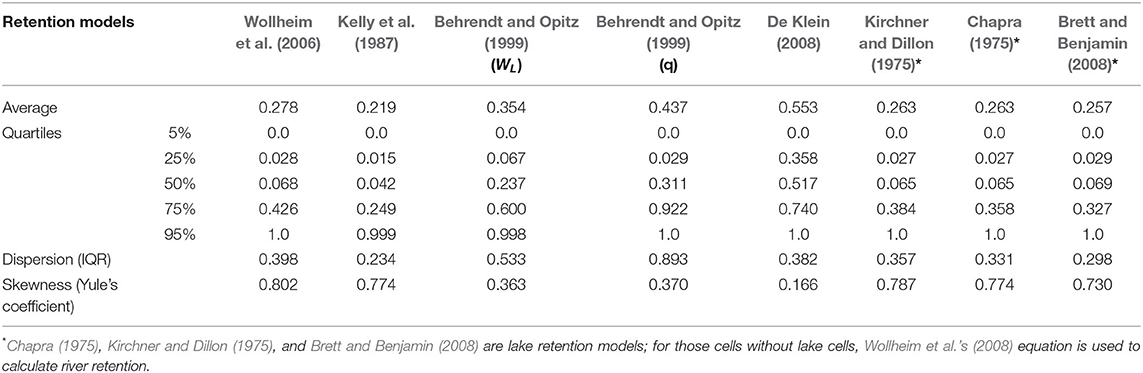
Table 5. Descriptive statistics of P retention of different retention models.
For both N and P, the retention from hydraulic-load-driven models displayed larger skewness than specific-runoff-driven models. Yule's coefficient of retention predicted by hydraulic-load-driven models is larger than 0.5, while Yule's coefficients of specific-runoff-driven models range from 0 to 0.5. Thus, the retention simulated by models with a driving force of hydraulic load is more asymmetrically distributed than that of runoff-driven models. Nevertheless, the retention from all the models is positively skewed.
For N, the retention model of Behrendt and Opitz (1999) (q) predicted the largest average retention globally, followed by the simulation of De Klein (2008) and Behrendt and Opitz (1999) (WL), while those models with a driving force of hydraulic load predicted relatively smaller average retention. The IQR of the simulation following Behrendt and Opitz (1999) (q) is the highest, revealing that the model simulates more dispersed retention than other models.
For P, the retention model of De Klein (2008) predicted the largest average retention globally, with the second and third largest average retention modeled by Behrendt and Opitz (1999) (q) and Behrendt and Opitz (1999) (WL), respectively. In contrast, the retention models of Wollheim et al. (2006) and Kelly et al. (1987) with a hydraulic load driver simulated smaller average retention. Lake retention models including Chapra (1975), Kirchner and Dillon (1975), and Brett and Benjamin (2008) cause little impact on global riverine retention. Thus, the prediction of these models is close to that of Wollheim et al. (2006) on a global scale. Larger difference in IQR was found between different specific-runoff-driven models, as IQRs of modeled retention following Behrendt and Opitz (1999) (q) and De Klein (2008) are 0.893 and 0.382 respectively, while IQRs of hydraulic-load-driven models range from 0.234 to 0.398.
Both TN and TP showed significant differences in their mean subtraction between simulated and observed concentration among the retention models. For TN, Tukey's HSD showed a clear distinction between hydraulic load-driven models on the one hand and specific-runoff-driven models on the other hand (Figure 7A, Supplementary Table S3). The Games-Howell post-hoc tests showed similar differences in model groups for TP (Figure 7B, Supplementary Table S4). Particularly, the retention models of De Klein (2008) deviated strongly in performance, which may relate to the difference of their coefficients and the consideration of temperature in De Klein (2008).

Figure 7. Difference score between simulated and observed concentration for (A) TN and (B) TP among different retention models. Black points are the average difference. The length of the “wings” (shown as black lines around the average) equals SE · qα,k,ν with critical value qα,k,ν and standard error SE determined by Tukey's HSD or Games-Howell post-hoc test. The solid lines show the minimal SEi,j · qα,k,ν and the dashed lines of the wings indicate the range of pairwise SEi,j · qα,k,ν from the minimum to the maximum. Different letters a, b, c on top of the wings identify significant differences (p < 0.05) in concentration among the retention models.
Generally, the average difference between observed and simulated concentration is lower for specific-runoff-driven models than for hydraulic-load-driven models. Note that concentration is inversely proportional to the estimation of retention. A positive average difference between simulated and observed concentrations signifies an overestimation of concentration and thus an underestimation of retention. For both TN and TP, retention models, except for the TN equations of De Klein (2008), tended to underestimate retention, particularly in low-retention regions (retention ≤ 0.1).
As far as we are aware, this is the first study to assess the performance of empirical retention equations for global nutrient models and to investigate the role of driving forces, function form, and equation coefficients. The strengths of this study include its analyses on the global and regional performance of retention equations using multiple criteria (NRMSE, Pearson's r, and relative bias, i.e., average difference score shown in Figure 7) and the comparison of model residuals for different water bodies based on abundant samples from diverse sources.
We applied NRMSE and Pearson's r as the performance criteria and used an ANOVA and a post-hoc test to investigate the performance of (and differences between) retention models. The results revealed that the impact of function form and coefficients are inferior to the hydraulic driver. Since most of these models were developed based on a local dataset (Table 1), the coefficients and function forms were expected to represent the corresponding local systems better than the globe. However, our results show that some of these local studies perform better globally than those developed at global scales (i.e., Wollheim et al., 2008). Particularly, empirical retention equations whose driving force is hydraulic load predicted relatively lower retention than specific-runoff driven models. Hydraulic-load-driven models tended to underestimate retention and overestimate concentration, particularly for TN. The specific-runoff driven equations of Behrendt and Opitz (1999) (q) and De Klein (2008) provided the best fit for the simulation of riverine nutrient retention and P retention in lakes, respectively.
Our study reinforced the importance of temperature as a secondary driving force of P retention (D'angelo et al., 1991; Jensen and Andersen, 1992; Kim et al., 2003), since the retention models of De Klein (2008) lowered the difference between simulations and observations and is the only model that considered temperature. Our results were also in line with the discovery that riverine N and P retention depends on the specific runoff rather than hydraulic load (Behrendt and Opitz, 1999) and predicted P values disperse more than predicted N values using empirical equations to estimate retention (Hejzlar et al., 2009).
Using the best combination of retention models for geographical zones (Supplementary Table S2), we simulated the global export to coastal waters of N and P are 30.5 and 5.8 Tg P yr−1. For the global N export, our estimation is lower than those of NEWS-2 (45 Tg N yr−1, Mayorga et al., 2010) and IMAGE-GNM (37 Tg N yr−1, Beusen et al., 2016). The combination of retention models for various zones can better represent the realistic retention and results in a lower global export that is closer to observations. For P, our estimation falls between the global export of NEWS-2 (9 Tg P yr−1, Mayorga et al., 2010) and IMAGE-GNM (4 Tg P yr−1, Beusen et al., 2016). Moreover, the best combination of P retention models avoids the bias caused by Wollheim et al. (2006) to predict zero P loads in the high-retention regions.
Our assessment of lake P retention differs from the multiple comparison results of Brett and Benjamin (2008), who compared and optimized the retention equation for lake TP in the USA and Canada and regarded Brett and Benjamin's (2008) equation, a residence-time-driven equation, as the best fit. We identify the reason as the difference of performance criteria and spatial coverage of sample data. Brett and Benjamin (2008) used the logarithm coefficient of determination r2 as the performance criterion, which is equivalent to the square of Pearson's r of linearized log-transformed data. Indeed, the model of Brett and Benjamin (2008) got high r scores among all the models in our research, but their model performs worse than De Klein (2008) and Kelly et al. (1987) if we consider NRMSE. In conclusion, our use of multiple criteria shows the advantage of providing more information of both correlation and errors between simulations and observations.
Uncertainty may arise from a lack of data availability and data representativeness. For instance, when assessing model performance in different geographical zones, retention models perform worse in the Torrid Zone than at the global level, which might be due to a misrepresentation of the nutrient states throughout the Torrid Zone (it covers only 1.5% of all TN samples and 3.4% of TP samples). In the South Temperate Zone, despite a sufficient amount of data, the data lack representativeness, as most of the samples were collected in the Murray Darling Basin in Australia. We included NO3/DIN and PO4 data and used nutrient ratios to deal with a lack of data availability. However, the imposed nutrient ratio may introduce uncertainty into observation data as well. For instance, Meybeck (1982), Goolsby et al. (1999), and Turner et al. (2003) estimated global NO3/TN ratios to vary from 59 to 86% and PO4/TP ratios from 46 to 70% by investigating world's rivers. However, other literature (e.g., Yan et al., 2001; Liu et al., 2018) provided specific ratios for different rivers. To lower the uncertainty raised by these ratios, we used specific ratios firstly, and if no specific ratios were found, we employed the recommended global ratio from Turner et al. (2003). As more data become available, these retention models can be further evaluated and improved.
The ability of the model to reproduce the hydrological conditions is also crucial for the performance of modeled retention. For instance, although the Torrid Zone and the North Frigid Zone had almost the same amount of data, the performance of these two regions was quite different. Better retention predictions in the North Frigid Zone are related to more accurate PCR-GLOBWB discharge simulations in Europe, North America, and monsoon-dominated regions due to more precise meteorological forcing. In contrast, the least accurate results in the Torrid Zone are probably linked to the unsatisfactory simulation of discharge in African rivers since PCR-GLOBWB likely overestimates the groundwater recession rates and underestimates African inland delta evaporation (Sutanudjaja et al., 2018). In addition, due to faster rates of hydrological change in humid tropics, the hydrological condition is harder to describe precisely by a yearly-step model (Wohl et al., 2012).
On the other hand, the processing of water storage in PCR-GLOBWB introduced more uncertainties into the estimation of the hydraulic load than of specific runoff that was only affected by the discharge. Assuming reservoirs serve hydropower generation, PCR-GLOBWB overestimates the real reservoir volume by maximizing storage capacity under full power generation due to a lack of data from power plants on a global scale (Haddeland et al., 2006; Adam and Lettenmaier, 2008). However, PCR-GLOBWB sometimes underestimates the total water volume by ignoring small reservoirs when combining multiple water bodies located within the same cell (Beusen et al., 2015). These uncertainties may explain why retention estimates from hydraulic-load-driven retention equations deviate more from observations than when based on specific-runoff-driven equations.
The reason that specific-runoff-driven models perform better than hydraulic-load-driven models lies mainly in accuracy of the predictions on their driving force. IMAGE-GNM can better predict specific runoff that is composed of discharge and area since discharge was validated with observation in PCR-GLOBWB and area was obtained from geo-information (Van Beek et al., 2011). In contrast, hydraulic load works worse due to the uncertainties of reproducing water volume and water body depth.
Temperature has been shown to be an important driving force of P retention (D'angelo et al., 1991) to compensate for the difference between predicted and observed concentration but works secondary to hydraulic drivers, as Figure 7 shows those retention models considering temperature factor (i.e., Wollheim et al., 2006; De Klein, 2008) lower the difference between predictions and observations within the models with the same hydraulic drivers. The effect of temperature works via influencing PO4 release from sediments in streams and lakes (Fillos and Swanson, 1975; Holdren and Armstrong, 1980; Jensen and Andersen, 1992; Kim et al., 2003) and the physical properties of the water (Jeppesen et al., 2009). In contrast, N retention may also be affected by temperature, given NH4 release from sediments (Shinohara et al., 2021), but the temperature effect on N is less substantial than P, since the N content ratio between sediments and other mediums (e.g., water) was found to be much lower than P (Downing and McCauley, 1992).
Future scenarios point to a global temperature increase due to greenhouse gas emissions (Intergovernmental Panel on Climate Change (IPCC), 2018). Under a warmer climate, higher water temperature increases the time windows of biological activities and intensifies the interaction of the physical environment and the biogeochemical properties in the hydrosphere (Withers and Jarvie, 2008; Jeppesen et al., 2009). This would likely lead to more nutrient release from aerobic sediments and an increase in nutrient concentrations in freshwaters.
River damming causes a decrease in the specific runoff and the hydraulic load, which leads to sediment trapping and an increase in nutrient retention (Maavara et al., 2015). While empirical equations capture the effects of changing hydrological parameters, they do not include biogeochemical mechanisms. These limitations act on both N and P. With respect to biogeochemical mechanisms, limitations relate to the lack of accounting for interactions among nutrient species, interactions with other elements, and for instance remobilization of P into water bodies due to the long-term accumulation of anthropogenic P retention in sediments. The errors between modeled and observed riverine P are larger than for N in our study. The larger error of P may result from the complexity of P transformations between unneglectable particle forms and dissolvable species, and the complex exchange between the water column and the sediment, which statistical regression equations of TP cannot reproduce or predict.
As such, model developers should search for ways to incorporate mechanistic geochemical dynamics into modeling nutrient retention in aquatic systems, so that models can better estimate N/P fate by distinguishing the specific forms and by including the transformations among different nutrient species. For instance, Vilmin et al. (2020) proposed a framework to describe the interactive processes between nutrient species and examined the model performance of N fate by splitting TN into ammonium (), nitrate (), nitrite (), and organic nitrogen. Future research into process-based biogeochemical dynamics is needed to better assess P retention.
The global assessment of retention equations that was conducted in our study can improve the accuracy of global nutrient models: compared to the currently used retention equation, applying the best-fit retention equation can reduce the NRMSE of riverine N, lake P, and riverine P in IMAGE-GNM by 41, 66, and 107%, respectively. By comparing the performance of empirical equations in different geographical regions, our study provided a possible way for model developers to further consider integrating regional retention modeling into global nutrient simulations. Further, the analyses of errors in performance, having distinguished the role of driving forces, function form, and equation coefficients, can constitute a step forward to the future development of empirical retention equations.
In this study, we used NRMSE to evaluate the error of model outcomes and Pearson's r of log-transformed data. We employed ANOVA and post-hoc analyses to evaluate the under- or overestimates of different retention models.
Our results showed that global retention derived from different retention equations generates different patterns: the hydraulic-load-driven equations differ considerably from specific-runoff driven models and predicted relatively lower retention. The hydraulic driver is thus the most important factor that affects predicted TN/TP concentrations. Globally, empirical equations perform better for N than P. The retention models of Behrendt and Opitz (1999) (q) generate the lowest NRMSE for both N and P, being the best option for estimating riverine retention of TN/TP, while De Klein's (2008) model is recommended for simulating P retention in lakes and reservoirs.
This global assessment allows model developers to choose empirical retention equations that best fit their region, thus improving the accuracy of modeling global nutrient fate and the N or P exports to coastal waters. Such improvements provide a better insight into the eutrophication in aquatic systems and support decision-makers to formulate environmental policies. The analysis on the driving force of retention constitutes a basis for the development of retention models for future nutrient fate and waterborne eutrophication-related studies.
The original contributions presented in the study are included in the article/Supplementary Materials, further inquiries can be directed to the corresponding author.
JZ developed the retention models based on the work of AB and JM, who developed IMAGE-GNM. AB and JM also provided data and technical support of IMAGE-GNM. JZ, LS, and JM compiled the measurement data and analyzed model results. JZ, LS, and PB conducted statistical analysis including ANOVA and post-hoc tests. JZ wrote the manuscript with input from all authors. All authors contributed to the article and approved the submitted version.
JZ was supported by the China Scholarship Council (Grant No. 201908430153).
The authors declare that the research was conducted in the absence of any commercial or financial relationships that could be construed as a potential conflict of interest.
All claims expressed in this article are solely those of the authors and do not necessarily represent those of their affiliated organizations, or those of the publisher, the editors and the reviewers. Any product that may be evaluated in this article, or claim that may be made by its manufacturer, is not guaranteed or endorsed by the publisher.
We gratefully acknowledge that this work was performed using the ALICE compute resources provided by Leiden University.
The Supplementary Material for this article can be found online at: https://www.frontiersin.org/articles/10.3389/frwa.2022.894604/full#supplementary-material
Adam, J. C., and Lettenmaier, D. P. (2008). Application of new precipitation and reconstructed streamflow products to streamflow trend attribution in Northern Eurasia. J. Clim. 21, 1807–1828. doi: 10.1175/2007JCLI1535.1
Alexander, R. B., Elliott, A. H., Shankar, U., and McBride, G. B. (2002). Estimating the sources and transport of nutrients in the Waikato River Basin, New Zealand. Water Resources Res. 38, 4-1–4-23. doi: 10.1029/2001WR000878
Arheimer, B., Pimentel, R., Isberg, K., Crochemore, L., Andersson, J. C. M., Hasan, A., et al. (2020). Global catchment modelling using World-Wide HYPE (WWH), open data, and stepwise parameter estimation. Hydrol. Earth Syst. Sci. 24, 535–559. doi: 10.5194/hess-24-535-2020
Aulenbach, B. T., Buxton, H. T., Battaglin, W. A., and Coupe, R. H. (2007). Streamflow and Nutrient Fluxes of the Mississippi-Atchafalaya River Basin and Subbasins for the Period of Record Through 2005. Reston, VA: US Geological Survey. doi: 10.3133/ofr20071080
Behrendt, H., and Opitz, D. (1999). “Retention of nutrients in river systems: dependence on specific runoff and hydraulic load,” in Man and River Systems (Dordrecht: Springer Netherlands), 111–122.
Beusen, A. H. W., Bouwman, A. F., Van Beek, L. P. H., Mogollón, J. M., and Middelburg, J. J. (2016). Global riverine N and P transport to ocean increased during the 20th century despite increased retention along the aquatic continuum. Biogeosciences 13, 2441–2451. doi: 10.5194/bg-13-2441-2016
Beusen, A. H. W., Doelman, J. C., van Beek, L. P. H., van Puijenbroek, P. J. T. M., Mogollón, J. M., van Grinsven, H. J. M., et al. (2022). Exploring river nitrogen and phosphorus loading and export to global coastal waters in the Shared Socio-economic pathways. Global Environ. Change 72, 102426. doi: 10.1016/j.gloenvcha.2021.102426
Beusen, A. H. W., Van Beek, L. P. H., Bouwman, L., Mogollón, J. M., and Middelburg, J. B. M. (2015). Coupling global models for hydrology and nutrient loading to simulate nitrogen and phosphorus retention in surface water-description of IMAGE-GNM and analysis of performance. Geosci. Model. Dev. 8, 4045–4067. doi: 10.5194/gmd-8-4045-2015
Bouraoui, F., Grizzetti, B., Granlund, K., Rekolainen, S., and Bidoglio, G. (2004). Impact of climate change on the water cycle and nutrient losses in a Finnish catchment. Clim. Change 66, 109–126. doi: 10.1023/B:CLIM.0000043147.09365.e3
Brett, M. T., and Benjamin, M. M. (2008). A review and reassessment of lake phosphorus retention and the nutrient loading concept. Freshw. Biol. 53, 194–211. doi: 10.1111/j.1365-2427.2007.01862.x
Brown, M. B., and Forsythe, A. B. (1974). Robust tests for the equality of variances. J. Am. Stat. Assoc. 69, 364–367. doi: 10.1080/01621459.1974.10482955
Chapra, S. C. (1975). Comment on 'An empirical method of estimating the retention of phosphorus in lakes' by WB Kirchner and PJ Dillon. Water Resour. Res. 11, 1033–1034. doi: 10.1029/WR011i006p01033
Chen, J., He, D., Zhang, N., and Cui, S. (2004). Characteristics of and human influences on nitrogen contamination in Yellow River system, China. Environ. Monit. Assess. 93, 125–138. doi: 10.1023/B:EMAS.0000016796.51583.80
Chislock, M. F., Doster, E., Zitomer, R. A., and Wilson, A. E. (2013). Eutrophication: causes, consequences, and controls in aquatic ecosystems. Nat. Educ. Knowl. 4, 10. doi: 10.1007/978-90-481-9625-8
D'angelo, D. J., Webster, J. R., and Benfield, E. F. (1991). Mechanisms of stream phosphorus retention: an experimental study. J. North Am. Benthol. Soc. 10, 225–237. doi: 10.2307/1467596
De Klein, J. J. M. (2008). From Ditch to Delta, nutrient retention in running waters. (PhD thesis). Wageningen University, Wageningen, Netherlands.
Derrick, B., Ruck, A., Toher, D., and White, P. (2018). Tests for equality of variances between two samples which contain both paired observations and independent observations. J. Appl. Quantitative Methods 13, 36–47. doi: 10.20982/tqmp.13.2.p120
Downing, J. A., and McCauley, E. (1992). The nitrogen: phosphorus relationship in lakes. Limnol. Oceanogr. 37, 936–945. doi: 10.4319/lo.1992.37.5.0936
El-Sadek, A. (2011). Spatial and temporal analysis of nitrogen transport and transformation in surface water. Arab Gulf J. Sci. Res. 29, 51–58. doi: 10.51758/AGJSR-1/2-2011-0005
Fillos, J., and Swanson, W. R. (1975). The release rate of nutrients from river and lake sediments. J. Water Pollut. Control Feder. 47, 1032–1042.
Geographical Zone (2009). New World Encyclopedia. Available online at: https://www.newworldencyclopedia.org/entry/Geographical_zone
Goolsby, D. A., Battaglin, W. A., Lawrence, G. B., Artz, R. S., Aulenbach, B. T., Hooper, R. P., et al. (1999). Flux and sources of nutrients in the Mississippi-Atchafalaya River Basin. Washington, DC: National Oceanic and Atmospheric Administration; National Ocean Service Coastal Ocean Program. Available online at: http://hdl.handle.net/1969.3/27186
Grizzetti, B., Passy, P., Billen, G., Bouraoui, F., Garnier, J., and Lassaletta, L. (2015). The role of water nitrogen retention in integrated nutrient management: assessment in a large basin using different modelling approaches. Environ. Res. Lett. 10, 65008. doi: 10.1088/1748-9326/10/6/065008
Haddeland, I., Skaugen, T., and Lettenmaier, D. P. (2006). Anthropogenic impacts on continental surface water fluxes. Geophys. Res. Lett. 33, 1–4. doi: 10.1029/2006GL026047
Harrison, J. A., Beusen, A. H. W., Fink, G., Tang, T., Strokal, M., Bouwman, A. F., et al. (2019). Modeling phosphorus in rivers at the global scale: recent successes, remaining challenges, and near-term opportunities. Curr. Opin. Environ. Sustain. 36, 68–77. doi: 10.1016/j.cosust.2018.10.010
Hartmann, J., Lauerwald, R., and Moosdorf, N. (2019). GLORICH-Global River Chemistry Database. PANGAEA. doi: 10.1594/PANGAEA.902360
Hejzlar, J., Anthony, S., Arheimer, B., Behrendt, H., Bouraoui, F., Grizzetti, B., et al. (2009). Nitrogen and phosphorus retention in surface waters: an inter-comparison of predictions by catchment models of different complexity. J. Environ. Monitor. 11, 584–593. doi: 10.1039/b901207a
Herschy, R. W. (2012). “World Lake Database: International Lake Environment Committee Foundation (ILEC),” in Encyclopedia of Lakes and Reservoirs (Dordrecht: Springer Netherlands), 920–921.
Holdren, G. C., and Armstrong, D. E. (1980). Factors affecting phosphorus release from intact lake sediment cores. Environ. Sci. Technol. 14, 79–87. doi: 10.1021/es60161a014
Howarth, R. W., Billen, G., and Swaney, D. (1997). Regional nitrogen budgets and riverine N and P fluxes for the drainages to the North Atlantic Ocean: natural and human influences. Oceanographic Literature Rev. 5, 448. doi: 10.1007/978-94-009-1776-7_3
Intergovernmental Panel on Climate Change (IPCC) (2018). Global Warming of 1.5° C: An IPCC Special Report on the Impacts of Global Warming of 1.5° C Above Pre-Industrial Levels and Related Global Greenhouse Gas Emission Pathways, in the Context of Strengthening the Global Response to the Threat of Climate Change. Intergovernmental Panel on Climate Change.
Jenny, J., Francus, P., Normandeau, A., Lapointe, F., Perga, M., Ojala, A., et al. (2016). Global spread of hypoxia in freshwater ecosystems during the last three centuries is caused by rising local human pressure. Glob. Chang. Biol. 22, 1481–1489. doi: 10.1111/gcb.13193
Jensen, H. S., and Andersen, F. O. (1992). Importance of temperature, nitrate, and pH for phosphate release from aerobic sediments of four shallow, eutrophic lakes. Limnol. Oceanogr. 37, 577–589. doi: 10.4319/lo.1992.37.3.0577
Jeppesen, E., Kronvang, B., Meerhoff, M., Søndergaard, M., Hansen, K. M., Andersen, H. E., et al. (2009). Climate change effects on runoff, catchment phosphorus loading and lake ecological state, and potential adaptations. J. Environ. Qual. 38, 1930–1941. doi: 10.2134/jeq2008.0113
Kelly, C. A., Rudd, J. W. M., Hesslein, R. H., Schindler, D. W., Dillon, P. J., Driscoll, C. T., et al. (1987). Prediction of biological acid neutralization in acid-sensitive lakes. Biogeochemistry 3, 129–140. doi: 10.1007/BF02185189
Kim, L.-H., Choi, E., and Stenstrom, M. K. (2003). Sediment characteristics, phosphorus types and phosphorus release rates between river and lake sediments. Chemosphere 50, 53–61. doi: 10.1016/S0045-6535(02)00310-7
Kirchner, W. B., and Dillon, P. J. (1975). An empirical method of estimating the retention of phosphorus in lakes. Water Resour. Res. 11, 182–183. doi: 10.1029/WR011i001p00182
Liu, S. M., Hong, G.-H., Zhang, J., Ye, X. W., and Jiang, X. L. (2009). Nutrient budgets for large Chinese estuaries. Biogeosciences 6, 2245–2263. doi: 10.5194/bg-6-2245-2009
Liu, X., Beusen, A. H. W., Van Beek, L. P. H., Mogollón, J. M., Ran, X., and Bouwman, A. F. (2018). Exploring spatiotemporal changes of the Yangtze River (Changjiang) nitrogen and phosphorus sources, retention and export to the East China Sea and Yellow Sea. Water Res. 142, 246–255. doi: 10.1016/j.watres.2018.06.006
Maavara, T., Parsons, C. T., Ridenour, C., Stojanovic, S., Dürr, H. H., Powley, H. R., et al. (2015). Global phosphorus retention by river damming. Proc. Nat. Acad. Sci. U.S.A. 112, 15603–15608. doi: 10.1073/pnas.1511797112
Maotian, L., Qianli, S., and Hong, W. (2014). The filter effect of big reservoirs on dissolved silicate flux decrease in the Yangtze River drainage basin. J. Lake Sci. 26, 505–514. doi: 10.18307/2014.0403
Marcé, R., and Armengol, J. (2009). Modeling nutrient in-stream processes at the watershed scale using Nutrient Spiralling metrics. Hydrol. Earth Syst. Sci. 13, 953. doi: 10.5194/hess-13-953-2009
Mayorga, E., Seitzinger, S. P., Harrison, J. A., Dumont, E., Beusen, A. H. W., Bouwman, A. F., et al. (2010). Global nutrient export from WaterSheds 2 (NEWS 2): model development and implementation. Environ. Model. Softw. 25, 837–853. doi: 10.1016/j.envsoft.2010.01.007
McCrackin, M. L., Harrison, J. A., and Compton, J. E. (2013). A comparison of NEWS and SPARROW models to understand sources of nitrogen delivered to US coastal areas. Biogeochemistry 114, 281–297. doi: 10.1007/s10533-012-9809-x
Meybeck, M. (1982). Carbon, nitrogen, and phosphorus transport by world rivers. Am. J. Sci. 282, 401–450. doi: 10.2475/ajs.282.4.401
Mogollón, J. M., Beusen, A. H. W., Van Grinsven, H. J. M., Westhoek, H., and Bouwman, A. F. (2018). Future agricultural phosphorus demand according to the shared socioeconomic pathways. Glob. Environ. Change 50, 149–163. doi: 10.1016/j.gloenvcha.2018.03.007
Mulholland, P. J., Helton, A. M., Poole, G. C., Hall, R. O., Hamilton, S. K., Peterson, B. J., et al. (2008). Stream denitrification across biomes and its response to anthropogenic nitrate loading. Nature 452, 202–205. doi: 10.1038/nature06686
Müller, B., Bryant, L. D., Matzinger, A., and Wüest, A. (2012). Hypolimnetic oxygen depletion in eutrophic lakes. Environ. Sci. Technol. 46, 9964–9971. doi: 10.1021/es301422r
Reddy, K. R., Kadlec, R. H., Flaig, E., and Gale, P. M. (1999). Phosphorus retention in streams and wetlands: a review. Crit. Rev. Environ. Sci. Technol. 29, 83–146. doi: 10.1080/10643389991259182
Saunders, D. L., and Kalff, J. (2001). Nitrogen retention in wetlands, lakes and rivers. Hydrobiologia 443, 205–212. doi: 10.1023/A:1017506914063
Schindler, D. W., and Vallentyne, J. R. (2008). Over Fertilization of the World's Freshwaters and Estuaries. Edmonton, AB: University of Alberta Press.
Seitzinger, S. P., Styles, R. V., Boyer, E. W., Alexander, R. B., Billen, G., Howarth, R. W., et al. (2002). “Nitrogen retention in rivers: model development and application to watersheds in the northeastern USA,” in The Nitrogen Cycle at Regional to Global Scales (Springer), 199–237. doi: 10.1007/978-94-017-3405-9_6
Shinohara, R., Tsuchiya, K., and Kohzu, A. (2021). Warming of water temperature in spring and nutrient release from sediment in a shallow eutrophic lake. J. Water Climate Change. 12, 3178–99. doi: 10.2166/wcc.2021.145
Sinada, F., and Yousif, S. (2013). Water Chemistry and Quality of the Blue Nile at Khartoum. Sudan Journal of Science. 5, 31–43. Available online at: https://onlinejournals.uofk.edu/index.php/sjs/article/view/391/232
Statham, P. J. (2012). Nutrients in estuaries-an overview and the potential impacts of climate change. Sci. Total Environ. 434, 213–227. doi: 10.1016/j.scitotenv.2011.09.088
Strokal, M., Kroeze, C., Wang, M., Bai, Z., and Ma, L. (2016). The MARINA model (Model to Assess River Inputs of Nutrients to seAs): model description and results for China. Sci. Total Environ. 562, 869–888. doi: 10.1016/j.scitotenv.2016.04.071
Strömbäck, L., Pers, C., Strömqvist, J., Lindström, G., and Gustavsson, J. (2019). A web based analysis and scenario tool for eutrophication of inland waters for Sweden and Europe. Environ. Model. Softw. 111, 259–267. doi: 10.1016/j.envsoft.2018.07.012
Sun, C., Shen, Z., Liu, R., Xiong, M., Ma, F., Zhang, O., et al. (2013). Historical trend of nitrogen and phosphorus loads from the upper Yangtze River basin and their responses to the Three Gorges Dam. Environ. Sci. Pollut. Res. 20, 8871–8880. doi: 10.1007/s11356-013-1859-7
Sun, C. C., Shen, Z. Y., Xiong, M., Ma, F. B., Li, Y. Y., Chen, L., et al. (2013). Trend of dissolved inorganic nitrogen at stations downstream from the Three-Gorges Dam of Yangtze River. Environ. Pollut. 180, 13–18. doi: 10.1016/j.envpol.2013.05.003
Sutanudjaja, E. H., Van Beek, R., Wanders, N., Wada, Y., Bosmans, J. H. C., Drost, N., et al. (2018). PCR-GLOBWB 2: a 5 arcmin global hydrological and water resources model. Geoscientific Model Dev. 11, 2429–2453. doi: 10.5194/gmd-11-2429-2018
Tao, Y., Wei, M., Ongley, E., Li, Z., and Jingsheng, C. (2010). Long-term variations and causal factors in nitrogen and phosphorus transport in the Yellow River, China. Estuar. Coast. Shelf Sci. 86, 345–351. doi: 10.1016/j.ecss.2009.05.014
Turner, R. E., Rabalais, N. N., Justic, D., and Dortch, Q. (2003). Global patterns of dissolved N, P and Si in large rivers. Biogeochemistry 64, 297–317. doi: 10.1023/A:1024960007569
Van Beek, L. P. H., Wada, Y., and Bierkens, M. F. P. (2011). Global monthly water stress: 1. Water balance and water availability. Water Resources Res. 47, 1–25. doi: 10.1029/2010WR009791
van Vliet, M. T. H., Flörke, M., Harrison, J. A., Hofstra, N., Keller, V., Ludwig, F., et al. (2019). Model inter-comparison design for large-scale water quality models. Curr. Opin. Environ. Sustain. 36, 59–67. doi: 10.1016/j.cosust.2018.10.013
Venohr, M., Donohue, I., Fogelberg, S., Arheimer, B., Irvine, K., and Behrendt, H. (2005). Nitrogen retention in a river system and the effects of river morphology and lakes. Water Sci. Technol. 51, 19–29. doi: 10.2166/wst.2005.0571
Vilmin, L., Mogollón, J. M., Beusen, A. H. W., van Hoek, W. J., Liu, X., Middelburg, J. J., et al. (2020). Modeling process-based biogeochemical dynamics in surface freshwaters of large watersheds with the IMAGE-DGNM framework. J. Adv. Model. Earth Syst. e2019MS001796. 12, 1–19. doi: 10.1029/2019MS001796
Vonlanthen, P., Bittner, D., Hudson, A. G., Young, K. A., Müller, R., Lundsgaard-Hansen, B., et al. (2012). Eutrophication causes speciation reversal in whitefish adaptive radiations. Nature 482, 357–362. doi: 10.1038/nature10824
Withers, P. J. A., and Jarvie, H. P. (2008). Delivery and cycling of phosphorus in rivers: a review. Sci. Total Environ. 400, 379–395. doi: 10.1016/j.scitotenv.2008.08.002
Wohl, E., Barros, A., Brunsell, N., Chappell, N. A., Coe, M., Giambelluca, T., et al. (2012). The hydrology of the humid tropics. Nat. Clim. Chang. 2, 655–662. doi: 10.1038/nclimate1556
Wollheim, W. M., Vörösmarty, C. J., Bouwman, A. F., Green, P., Harrison, J., Linder, E., et al. (2008). Global N removal by freshwater aquatic systems using a spatially distributed, within-basin approach. Global Biogeochem. Cycles 22, 1–14. doi: 10.1029/2007GB002963
Wollheim, W. M., Vörösmarty, C. J., Peterson, B. J., Seitzinger, S. P., and Hopkinson, C. S. (2006). Relationship between river size and nutrient removal. Geophys. Res. Lett. 33, 1–4. doi: 10.1029/2006GL025845
Keywords: retention, global nutrient model, nitrogen, phosphorus, ANOVA
Citation: Zhou J, Scherer L, van Bodegom PM, Beusen AHW and Mogollón JM (2022) A Comparison Between Global Nutrient Retention Models for Freshwater Systems. Front. Water 4:894604. doi: 10.3389/frwa.2022.894604
Received: 11 March 2022; Accepted: 03 June 2022;
Published: 30 June 2022.
Edited by:
Karsten Rinke, Helmholtz Association of German Research Centres (HZ), GermanyReviewed by:
Xiangzhen Kong, Helmholtz Association of German Research Centres (HZ), GermanyCopyright © 2022 Zhou, Scherer, van Bodegom, Beusen and Mogollón. This is an open-access article distributed under the terms of the Creative Commons Attribution License (CC BY). The use, distribution or reproduction in other forums is permitted, provided the original author(s) and the copyright owner(s) are credited and that the original publication in this journal is cited, in accordance with accepted academic practice. No use, distribution or reproduction is permitted which does not comply with these terms.
*Correspondence: Jinhui Zhou, ai56aG91LjEyQGNtbC5sZWlkZW51bml2Lm5s
Disclaimer: All claims expressed in this article are solely those of the authors and do not necessarily represent those of their affiliated organizations, or those of the publisher, the editors and the reviewers. Any product that may be evaluated in this article or claim that may be made by its manufacturer is not guaranteed or endorsed by the publisher.
Research integrity at Frontiers
Learn more about the work of our research integrity team to safeguard the quality of each article we publish.