 Shiba Shankar Acharya
 Valens Hishamunda
 Ramananda Chakrabarti1,2
- 1Centre for Earth Sciences, Indian Institute of Science, Bangalore, India
- 2Interdisciplinary Centre for Water Research, Indian Institute of Science, Bangalore, India
The Mahanadi River ranks second among the rivers in the peninsular India in terms of water potential and flows through a geologically heterogeneous terrain. The present study uses a multiproxy approach, involving concentrations of major ions, and 87Sr/86Sr of the dissolved phases in seasonally collected river water and groundwater samples from the Lower Mahanadi Basin to investigate the sources of ions, the Cl-enrichment in the river water, the influences of the man-made structures like the Naraj Barrage, and the role of fertilizers on the chemistry of the river water. This study also provides the first estimate of the radiogenic Sr-flux of the Mahanadi River to the Bay of Bengal. Both inverse and forward models were used to evaluate the contributions of different sources to the dissolved ions of the Mahanadi River over different seasons. The results suggest that even in the predominantly silicate watershed of the Lower Mahanadi River, the riverine chemistry is modulated primarily by carbonate dissolution farther upstream followed by silicate weathering although, the contributions vary seasonally. The Naraj Barrage, which divides the main channel of the Lower Mahanadi River into several distributaries marks a divide between the less polluted upstream and the more polluted downstream. The radiogenic 87Sr/86Sr of the Mahanadi River water can be explained by mixing of four endmembers: Proterozoic carbonates, Archean silicates, rainwater, and fertilizers. The dominance of agricultural input during monsoon is consistent with high loadings of nitrates and phosphates used as fertilizers in the Mahanadi River basin along with a strong positive relationship between phosphate concentrations and 87Sr/86Sr of the river water samples. The flux-weighted averages of Sr concentration and 87Sr/86Sr to the Bay of Bengal were found to be 1.03 μmol/l and 0.72154, respectively. The groundwater composition of the Lower Mahanadi Basin is modulated by the mixing of four endmembers, viz. weathering of silicate and carbonate rocks, Bay of Bengal seawater, and fertilizer inputs. The groundwater samples of the Mahanadi basin show an average Sr concentration of 5.45 μmol/l and an average 87Sr/86Sr of 0.71772.
Introduction
The geochemical and isotopic compositions of dissolved and particulate phases in river water carry the imprints of the continental weathering, specifically, the sources of the ions, the rates of chemical weathering of minerals, and fluxes of dissolved materials to the ocean (e.g., Stallard and Edmond, 1983; Gaillardet et al., 1999a; Dalai et al., 2002). The rate of chemical weathering and associated CO2 consumption depend on several factors like geology of the basin, relief, precipitation, runoff, temperature variation, and vegetation cover (Roy et al., 1999; Dessert et al., 2003; Millot et al., 2003; Bastia and Equeenuddin, 2016). Therefore, each riverine system has a unique mechanism by which it interacts with the bedrocks and modulates the climatic conditions through the weathering of different lithologies. Several studies have investigated the roles of different lithologies to the sources of dissolved ions in rivers and have demonstrated that basalts weather more readily than the other silicate rocks (e.g., Meybeck, 1986; Amiotte Suchet and Probst, 1993; Dessert et al., 2001; Amiotte Suchet et al., 2003). However, by coupling the global lithological map with the GEM-CO2 model, Amiotte Suchet et al. (2003) estimated that the dissolution of carbonates and the erosion of shales consume 80% of the total CO2 uptake by continental weathering process, which is significantly higher than the uptake by the weathering of volcanic rocks (8%).
The Mahanadi River ranks second among the rivers in the peninsular India in terms of water potential (Bastia and Equeenuddin, 2016) and flows through a geologically heterogeneous terrain (Chakrapani and Subramanian, 1990; Figure 1A). Earlier studies on the Mahanadi River have attempted to understand the sources of ions (Chakrapani and Subramanian, 1990; Panigrahy and Raymahashay, 2005; Bastia and Equeenuddin, 2016, 2019; Bastia et al., 2020) and associated chemical weathering rates (Bastia and Equeenuddin, 2019). However, the results of these studies have been interpreted very differently in terms of the sources of ions and the extent of anthropogenic contribution to the major element budgets. Chakrapani and Subramanian (1990) as well as Panigrahy and Raymahashay (2005) suggested the dominance of carbonate rock weathering on the water chemistry of the Mahanadi River which contrasts with the recent study of Bastia and Equeenuddin (2019), who suggested that silicate weathering is the dominant process that controls the major ion chemistry of this river with limited contribution from the carbonate weathering. Interestingly, Panigrahy and Raymahashay (2005) argued that carbonate weathering dominates the water chemistry even in the downstream portion of the river, which is beyond the limestone terrain in this basin (Figure 1A). Another discrepancy in the published results is the drastically different Cl−/Na+ molar ratios reported for the Mahanadi River water samples. Chakrapani and Subramanian (1990) reported high (average = 1.39 ± 1.01) Cl−/Na+ molar ratios which cannot be explained by simple mixing between sea salt (Cl−/Na+ = 1.16) and halite (Cl−/Na+ = 1), which are the most common sources of Cl− in rivers. In contrast, Bastia and Equeenuddin (2019) reported much lower Cl−/Na+ values (average = 0.46 ± 0.17) for the Mahanadi River. Additionally, the effect of the Naraj Barrage (Figure 1B), beyond which, the Mahanadi River segregates into several distributaries to form a coastal delta, on the chemical composition of the river water has never been explored. Furthermore, the contribution of groundwater to the Mahanadi River water chemistry has been speculated by both Chakrapani and Subramanian (1990) as well as by Bastia and Equeenuddin (2019), but not studied systematically.
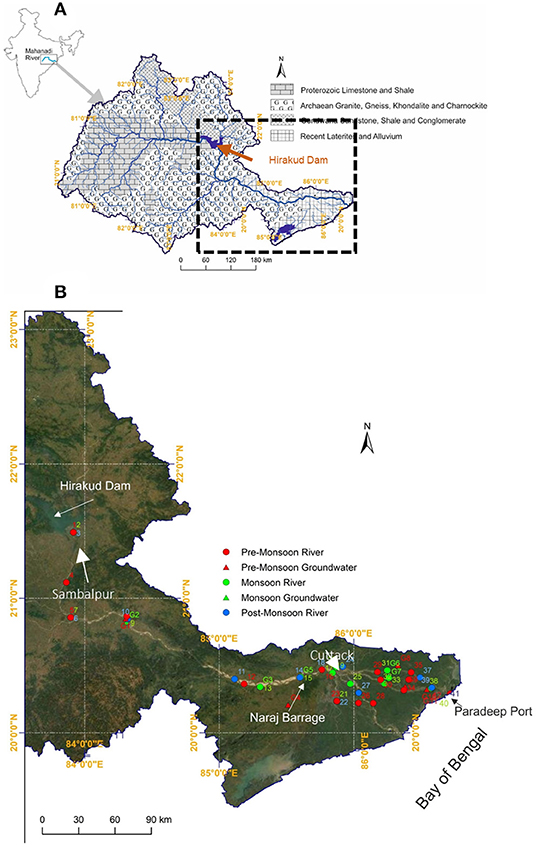
Figure 1. (A) Geological Drainage map of the Mahanadi River Basin of eastern India showing the various bedrock lithologies (modified after Panigrahy and Raymahashay, 2005). Also shown is the location of the Hirakud Dam. (B) Map showing sampling locations of Mahanadi River water and groundwater during different seasons. While river water samples (circles) were collected during pre-monsoon (red), monsoon (green), and post-monsoon (blue) seasons, groundwater samples (triangles) were collected only during pre-monsoon (red) and monsoon (green). Also shown is the location of the Naraj Barrage.
In this study, river water and groundwater samples from the Lower Mahanadi Basin were collected over a distance of ~490 km downstream from the Hirakud Dam (Figure 1B) during three different seasons. The present study focuses on the spatio-temporal variations in the concentrations of the dissolved ions and mechanisms that control their distributions. Unlike the previous studies, this study uses both the forward and inverse modeling approach to decipher the contributions of different sources to the Mahanadi River water composition across different seasons. Additionally, the present study also documents the spatial and seasonal variations in the radiogenic Sr-isotopic compositions of the Mahanadi River. To the best of our knowledge, this study provides the first estimate of the radiogenic Sr flux of the Mahanadi River to the global ocean and the 87Sr/86Sr signatures of groundwater from the Mahanadi basin. Furthermore, the effect of the Naraj Barrage on the geochemistry of the river and the chemical interaction of groundwater and river water in the deltaic part of the basin have also been investigated. Overall, this study provides deeper insights into the processes that occur in a drainage basin, establishes the criteria to differentiate the major sources of ions in a heterogeneous geological terrain, and investigates the role of a man-made barrage on the river water chemistry.
Study Area
The Mahanadi River Basin is the 8th largest river basin in India that extends over an area of about 141,600 km2 (CWC, 2014; Figure 1A). It flows eastward over a distance of ~850 km and finally drains into the Bay of Bengal (Bastia and Equeenuddin, 2016, 2019). The Hirakud Dam controls the flow of the Mahanadi from the upper catchment into the downstream part of the river. Downstream of the Naraj Barrage (Figure 1B), the Mahanadi River forms a delta by segregating into several distributaries and channels. The bed rock lithology in this basin primarily consists of Precambrian granites, khondalites, charnockites, and gneiss, Proterozoic limestones and shales, Gondwana-age sandstones, shales and conglomerates and recent laterites and deltaic alluvium (Chakrapani and Subramanian, 1990; Panigrahy and Raymahashay, 2005; Bastia and Equeenuddin, 2019; Bastia et al., 2020). The basin is characterized by a tropical climate with average annual rainfall ranging from 1,200 to 1,400 mm. Although, the rainfall occurs in spells of varying intensities and durations, more than 90% of the total precipitation occurs during the monsoon season that commences in June and lasts till October (CWC, 2014). The Mahanadi Basin is divided into three sub-basins namely the Upper (21.34%), Middle (37.16%), and Lower Mahanadi (41.5%). In the present study, the Lower Mahanadi Basin has been investigated, which covers an area of about 57,960 km2.
Methodology
Materials and Methods
River water samples were collected from the Lower Mahanadi Basin during May-June 2017, September-October 2017, and February 2018, during the pre-monsoon, monsoon, and post-monsoon seasons, respectively (Figure 1B). River water samples were collected from the midstream at a depth of approximately 2 feet from the surface. The groundwater samples were collected from the tube-wells adjacent to the river channels during pre-monsoon and monsoon seasons mostly from the Mahanadi deltaic region (Figure 1B). River water as well as the groundwater samples were filtered through 0.22 μm Millipore® cellulose nitrate filters. On-site, measurements of physical parameters such as temperature, pH, and electrical conductivity (EC) were performed using a portable Eutech (PCSTestr 35) multiparameter probe. The precision of the temperature measurements is ± 0.5°C, that of EC is ± 1% and that of pH is ± 0.01 units. The filtered water samples were stored in pre-cleaned high-density polyethylene (HDPE) bottles for chemical and isotopic analyses. Alkalinity of filtered samples was measured by acid titration (with 0.15 N HCl, end point at pH = 4.30). The filtered samples were split into two aliquots in the field. One fraction was not acidified and used for the anion analyses (F−, Cl−, , , and ) by ion chromatography (Metrohm 861) at the Indo-French Cell for Water Sciences, Indian Institute of Science (IISc), Bangalore. The quality of the analysis was checked using international standards ION 915 and ION 96.4. The uncertainties in the concentrations of all the ions are within 5% based on multiple measurements of these standards. The second fraction was acidified with double distilled HNO3 to pH ~2 and was used for the analyses of major cations and trace elements (Sr and Rb) using an Inductively Coupled Plasma Mass Spectrometer (ICPMS, Thermo Scientific X-Series II) at the Center for Earth Sciences (CEaS), IISc. The accuracy of the data measured by ICPMS was tested by analyzing USGS rock standards AGV-2 and one custom matrix matched multi-ion standard interspersed with the samples. The uncertainties of these measurements for most elements are better than 5%. Reproducibility of measurements for various cations and anions were determined by multiple repeat analyses of both samples and standards. These repeat measurements indicate that the precision of the reported data is better than ± 5%. For Sr-isotopic measurements, Sr was separated from a known volume of filtered and acidified water sample containing about 2 μg of Sr using cation-exchange chromatography following established protocols (Banerjee et al., 2016). The purified Sr was loaded on a single degassed Ta filament and measured using a thermal ionization mass spectrometer (TIMS, Thermo Scientific Triton Plus) at CEaS, IISc. The measured 87Sr/86Sr ratios were corrected for instrumental mass fractionation using an exponential law and 86Sr/88Sr = 0.1194. The uncertainty in the measured 87Sr/86Sr was better than 9 ppm (internal precision) representing 2σ of the mean. The NIST SRM 987 Sr isotopic standard analyzed during this study yielded 87Sr/86Sr = 0.710264 ± 15 (2SD, n = 17). Additional technical details of the geochemical and isotopic measurements are described in Banerjee et al. (2016).
Data Processing
Charge Balance
The total cationic (TZ+) and anionic (TZ−) charge of samples were determined based on the following equations:
The balance between these charges were determined using normalized inorganic charge balance (NICB) (e.g., Dalai et al., 2002), where
Pollution Index
The impact of anthropogenic activities on the dissolved load was evaluated using the pollution index as proposed by Pacheco and van der Weijden (1996), which is based on the molar concentration of , , and Cl− ions that are sensitive to human activities. Pollution index was calculated using the following equation:
where, all concentrations are expressed in μmol/l.
Silicate and Carbonate Fractions
In the present study, the relative contributions of the different sources of the dissolved ions to the Mahanadi River have been evaluated based on both forward and inverse models. The key difference between these two models is that in the forward model the release ratios of various major ions from the sources to the rivers is assumed, whereas in the inverse model, the best fit derived from the iteration of measured data gives the different source contributions.
The forward modeling approach assumes that the atmospheric and halite corrected fractions of the measured Na and K are derived from silicate weathering (Moon et al., 2007). The atmospheric input correction of ions (X*) has been evaluated using the following equation:
where, (X/Cl) seawater is the Cl− normalized element (X) ratio in the seawater. This correction assumes that atmospheric input has a sea salt-like composition, where the Cl− content would only come from the seawater (Meunier et al., 2015 and references therein). Applying this marine component dominated correction to the dissolved load of the Mahanadi River implies that excesses of Na, Ca, Mg, K, and Sr in rainwater, that will originate within the drainage basin itself, are derived from the continental weathering flux (Gaillardet et al., 1997).
The carbonate (carb) (∑Catcarb) and silicate (sil) (∑Catsil) contributions were calculated on an equivalent basis following the approach of Galy and France-Lanord (1999) and Quade et al. (2003) using the equations listed below.
In these equations (Equations 6, 7).
where, (Ca/Na)sil and (Mg/Na)sil are the molar ratios of Ca/Na and Mg/Na released to the river water from chemical weathering of silicates in the drainage basin. In the present study, the chemical compositions of the river bed sediments of Tel, Ib, and Ong tributaries of the Mahanadi River (Bastia and Equeenuddin, 2019) traversing only through monolithic silicate terrains have been used to estimate (Ca/Na)sil and (Mg/Na)sil.
The Ca and Mg contributions from carbonates were determined as the difference between the cyclic salt corrected ions and the silicate fractions.
The inverse model calculates the contributions from different sources based on the mass balance equations of Na-normalized elemental ratios of specific ions (X e.g., Cl−, Ca2+, Mg2+, , Sr, and ). The mass balance equations can be expressed as,
where the subscript i indicates the four endmembers: rain, silicate, carbonate and agriculture; (X/Na)i represents the Na-normalized ratios of the four endmembers, and αi,Na represents the mixing proportions of Na from these sources. The a priori ranges of (X/Na)I are listed in Table 2 while the best a posteriori values of (X/Na)i and αi,Na have been calculated iteratively by minimizing the reduced chi-squared misfits using the Microsoft Excel Solver. The present approach is adopted from Moon et al. (2014). The model sensitivity was estimated by running the model with two different scenarios: (i) running all the samples together, and (ii) running the seasonal samples separately. The results of this model sensitivity analysis show a variation of maximum 10% in the contributions of sources to the dissolved loads.
Saturation Indices of Calcite and Dolomite
Saturation indices for calcite (CSI) and dolomite (DSI) at ambient river water temperatures (25°C on average) were calculated with PHREEQC software v. 3.6.2 (Parkhurst and Appelo, 2013) using pH, temperature, and measured solute concentrations as input data and wateq4f.dat as the database.
Results
A total of 42 river water and 12 groundwater samples, collected over three seasons, were analyzed. The concentrations of major ions and radiogenic Sr isotope ratios (87Sr/86Sr) of the water samples collected are reported in Table 1. The compositions of three river water samples (samples # 40, 41, 42) collected from Paradeep (Figure 1B), located at the confluence of the Mahanadi River and Bay of Bengal, show distinctly different compositions, suggesting the influence of seawater. Hence, these samples have not been considered further for any statistical calculations. Additionally, one sample collected during post monsoon (sample # 39) also shows anomalous values for all the measured parameters and is hence, excluded from further discussions. The statistical data reported in this article are in the form of average ± 1 standard deviation, unless mentioned otherwise.
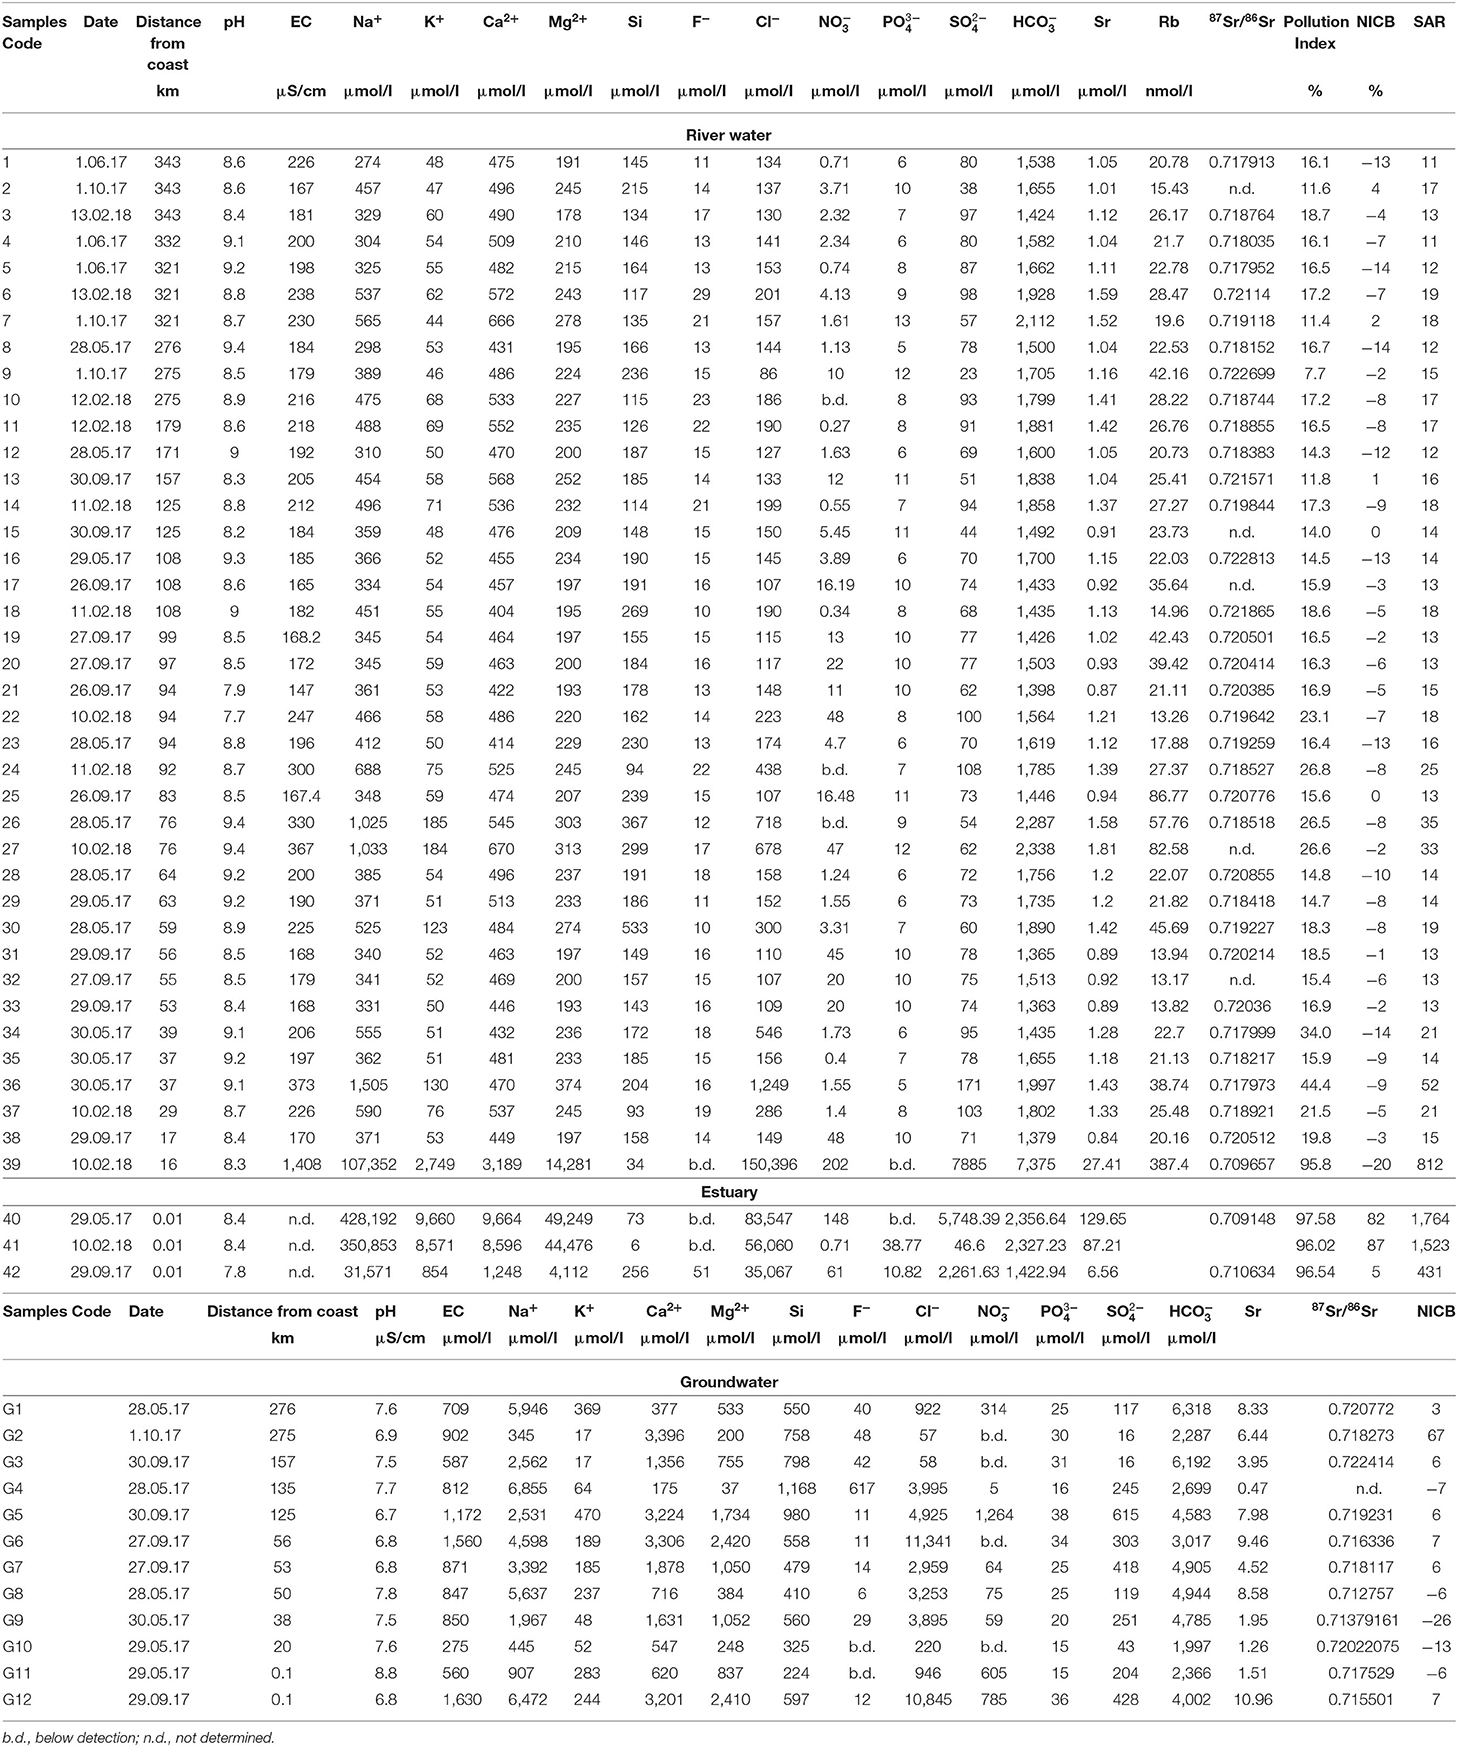
Table 1. Sampling details, major ion chemistry, strontium isotopic composition (87Sr/86Sr), pollution index, Sodium Adsorption Ratio (SAR), and Normalized Inorganic Charge Balance (NICB) in the river water and groundwater samples of the Lower Mahanadi basin.
River Chemistry
Major ion Chemistry
The pH values of the river water samples vary from 8.6 to 9.4, from 7.9 to 8.7, and from 7.7 to 9.4 during pre-monsoon, monsoon, and post-monsoon, respectively (Figure 2, Table 1). The Electrical Conductivity (EC) values range from 184 to 373 μScm−1 in pre-monsoon, from 147 to 230 μScm−1 during monsoon and from 180 to 367 μScm−1 during the post-monsoon season. The TDS values range from 129 to 265 ppm during pre-monsoon, 118 to 162 ppm during monsoon and 128 to 261 ppm during post-monsoon. The total cationic charge (TZ+) varies from 1.6 to 3.3 meq/L (milli-equivalent per liter) whereas the total anionic charge (TZ−) varies from 1.8 to 3.6 meq/L. For most of the samples, the TZ+ and TZ− were balanced to within ± 10% of the normalized inorganic charge balance (NICB) (Table 1; Edmond et al., 1995; Dalai et al., 2002; Zhang et al., 2019). The balanced charges corroborate the high analytical precision of the ion concentration measurements and imply that the contribution of organic ligands and/or unmeasured ions to the charge balance is insignificant. Most of the samples have high bicarbonate () concentrations that account for more than 80% of TZ−, whereas the Ca2+ and Na+ dominate the TZ+. The major cations for most of the samples from all sampling seasons generally follow decreasing order: Ca2+ > Na+ > Mg2+ > K+. In few samples collected during non-monsoon months, Na concentration (molar) was found to be higher than that of the Ca (Table 1). The anion concentrations follow the following decreasing order: > Cl− > > F− > > . Most of the river water samples are supersaturated (SI > 0) with respect to calcite and dolomite particularly during non-monsoon seasons. During monsoon, the river water samples record relatively low saturation indices while highest values are observed during the pre-monsoon season.
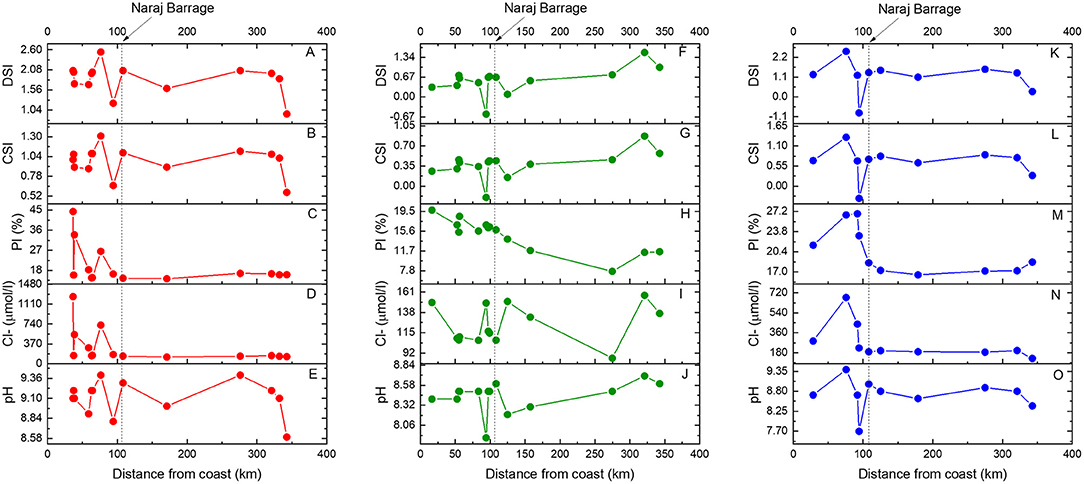
Figure 2. Distributions of pH, Cl, pollution index (PI), calcite saturation index (CSI), and dolomite saturation index (DSI) in the Mahanadi River water samples collected during pre-monsoon (red circles), monsoon (green circles), and post-monsoon season (blue circles) and plotted relative to the distance of the sampling locations from the coast toward inland. The vertical dotted line denotes the location of the Naraj Barrage (See Figure 1). Distinct changes in Mahanadi water compositions are observed across the Barrage.
Sr Concentration and Radiogenic Sr Isotopes
The 87Sr/86Sr of the pre-monsoon samples range from 0.70915 to 0.72281 with a mean of 0.718 ± 0.003, where the lowest values were recorded for the samples collected near the confluence of the Mahanadi River and Bay of Bengal. Excluding the sample collected from near the coast (sample #40, Table 1), having high Sr concentration of 132 μmol/l, the molar Sr concentration in the pre-monsoon samples varies from 1.04 to 1.58 μmol/l with a mean concentration of 1.20 ± 0.17 μmol/l. During the monsoon season, most of the water samples show relatively more radiogenic 87Sr/86Sr (0.71063–0.72269) and lower Sr concentrations (0.84–1.52 μmol/l) (Table 1). The above values exclude the sample collected near coast having Sr concentration of 6.56 μmol/l. Water samples collected during the post-monsoon show relatively less radiogenic 87Sr/86Sr (0.70923–0.72186), where the lowest value is observed in a sample collected close to the confluence of the Mahanadi River with the Bay of Bengal (Table 1). The Sr concentrations in the post-monsoon range from 1.12 to 87.2 μmol/l, where the highest value was recorded for the sample collected near the coast. The molar Rb/Sr ratios in the studied samples range from 11 to 62 (nmol/μmol).
Groundwater Chemistry
The pH values of the groundwater samples range from 7.5 to 8.8 during pre-monsoon, whereas during monsoon, the pH ranges from 6.7 to 7.5. The , Na+, and Cl− ions dominate the chemical composition of these samples. Except few samples collected from the downstream part of the basin, most of the samples show NICB <10%. The 87Sr/86Sr ratio varies from 0.71275 to 0.72241, and Sr concentrations vary between 0.48 and 10.76 μmol/l. Unlike the river water samples, no clear seasonal trends are observed in 87Sr/86Sr ratios of groundwater samples.
Discussion
The geochemical signatures of the Mahanadi River water, which vary both spatially and seasonally, reflect the cumulative responses of: (i) weathering reactions taking place in its drainage basin, (ii) atmospheric precipitations of sea salt and continental dust, and (iii) anthropogenic input. Hence, to delineate the contribution from silicate vs. carbonate dissolution, the river water chemistry has been corrected for the anthropogenic as well as the atmospheric inputs.
Anthropogenic Interference
Sambalpur, Cuttack, and Paradeep are the three major urban settlements located on the banks of the Mahanadi River that use the river water for agricultural, domestic, and industrial purposes. A thermal power plant, Aluminum industries near Hirakud, article and textiles industries near Cuttack, and two fertilizer plants at Paradeep are some of the major industries present in the Lower Mahanadi basin whose discharges can potentially affect the water chemistry of the Mahanadi River. To decipher the influence of anthropogenic impact on the Mahanadi River chemistry, pollution indices (Equation 4, Pacheco and van der Weijden, 1996) of the samples have been calculated (Table 1). Although, the pollution indices in some samples reach ~40% during the pre-monsoon season, the average of the pollution indices in the studied samples for three seasons is ≤20% (Figure 2), which suggests a weathering-dominated water chemistry (Pacheco and van der Weijden, 1996). This inference is also in line with the recent observations of Konhauser et al. (1997) and Bastia and Equeenuddin (2019) who reported low enrichments in anthropogenically-sourced element concentrations in the lower reaches of the Mahanadi River. The low pollution signatures of the Mahanadi River water probably reflect significant dilution of pollutants from their sources by the high river water flux and/or subsequent precipitation of ions from the river water column. The samples also show significant effect of seasonal dilution on the pollution indices. The values of the pollution indices for most of the sampling locations generally follow the decreasing order: post-monsoon > pre-monsoon > monsoon. This variation reflects the combination of near invariable effluent fluxes from industries throughout the year with a largely variable seasonal water flux. The spatial distribution of pollution indices shows a rise in the pollution downstream of the Naraj Barrage (Figure 2), where the river mostly traverses through a densely populated region with vast agricultural lands.
Additionally, there are discrepancies related to the Cl− ion concentrations in the Mahanadi River. Chakrapani and Subramanian (1990) reported very high Cl− concentration with Cl−/Na+ molar ratio of 1.39 ± 1.01, which is higher than sea-salt and halite, thereby suggesting high anthropogenic input (Gaillardet et al., 1999b). However, the average molar ratio of Cl−/Na+ of the water samples of this study collected over three different seasons is much lower (0.44 ± 0.15, 1SD) which is consistent with the reports of Bastia and Equeenuddin (2019) who also reported Cl−/Na+ molar ratios of 0.46 ± 0.17 in the Mahanadi water samples. The measured Cl−/Na+ values further rule out any major anthropogenic influence on the Mahanadi River water chemistry, which contrasts with the inference of Chakrapani and Subramanian (1990).
Further, Roy et al. (1999) suggested that /Na+ close to 10, and K+/Na+ close to 0.3-0.4 can be used to suggest pollution from agriculture/fertilizers. However, the low /Na+ (0.024 ± 0.04) and K+/Na+ (0.144 ± 0.03) in the water samples of the present study suggest negligible impact from agricultural inputs, which is also consistent with the observations of Bastia and Equeenuddin (2019).
Overall, based on the major ion chemistry, significant contributions from anthropogenic and/or agricultural sources to the Mahanadi River can be ruled out. However, in a later section we will show that the radiogenic Sr isotopic ratios can help to trace the inputs from fertilizers which may not always be reflected in the major ion chemistries of river water samples.
Sources of Ions
Atmospheric Supply vs. Chemical Weathering
Sea-salt aerosols and atmospheric dust mainly govern the atmospheric contribution of ions to the riverine chemistry. The removal of atmospheric solute contributions from riverine composition, i.e., cyclic-salt correction can be estimated from the chloride concentrations in the local rainwater compositions (e.g., Das A. et al., 2005; Jha et al., 2009; Pattanaik et al., 2013; Bastia and Equeenuddin, 2019). The choice of chloride as a proxy of atmospheric contribution is based on two of its characteristics: (i) it is not a part of biogeochemical cycling in most drainage basins and (ii) it reacts very little with other ions and does not form complexes (Viers et al., 2001 and references therein). The concentration of Cl− shows a steep decrease with increasing distance from the coast (Figure 2) suggesting a decrease in the marine sea-salt contribution to the river water via rain. This lowering of Cl− concentration with distance from the coast is prominent during non-monsoon seasons, whereas during monsoon (high runoff) all the samples show the effect of rainwater dilution, leading to low Cl− concentrations. These trends in Cl− concentrations (Figure 2) rule out any pervasive encroachment of seawater in the river and suggest that the decreasing Cl− concentrations across all seasons reflect contributions of sea salt via rain. Additionally, the progressive decrease of Cl− concentrations with increasing distance from the coast during all three seasons suggests absence of evaporite occurrences in the Lower Mahanadi basin which is consistent with the known lithological occurrences in this drainage basin (Figure 1A). There is also an increase in Cl− concentration downstream of the Naraj Barrage (Figure 2), which implies both increase in sea-salt and anthropogenic contributions. However, this increasing trend observed across seasons downstream from the Naraj Barrage is not uniform and shows abrupt high and low values. This pattern is a result of different distributaries flowing through various terrains having different influence of natural and anthropogenic impacts.
The non-cyclic correction (Equation 5) relies on the hypothesis that atmospheric input has a composition like sea salt, where the Cl− content would only come from the seawater (e.g., Meunier et al., 2015 and references therein). Applying this marine component dominated correction to the dissolved load of the Mahanadi River implies that excesses in Na, Ca, Mg, K, and Sr in rainwater that originate within the drainage basin itself are part of continental weathering flux (Gaillardet et al., 1997). The normalized Na+/Cl− and Ca2+/Cl− ratios [(X/Cl)river)/(X/Cl)seawater)] in Figure 3A shows distinctly higher values (>1) for most of the samples of all seasons except for few that were collected closer to the coast. This suggests that significant amount of Na and Ca of the Mahanadi River can be attributed to the chemical weathering of minerals. Furthermore, the samples collected during the monsoon season display predominantly higher Na+/Cl− and Ca2+/Cl− ratios, which suggest that chemical weathering is dominant during high run-off conditions. This interpretation reemphasises the dominant role of runoff in regulating the chemical weathering rates, which is also true for other large rivers around the world (Gaillardet et al., 1999b; Kump et al., 2000). This inference is further strengthened by the distribution of all samples above the 1:1 trendline in a plot of Na+ + K+ vs. Cl− (Figure 3B) which reflects the dominance of chemical weathering of silicates over that of evaporites and/or seawater input. These trends in the Mahanadi River water also suggest that chloride normalization can be used to correct for atmospheric contributions to river water (Viers et al., 2000).
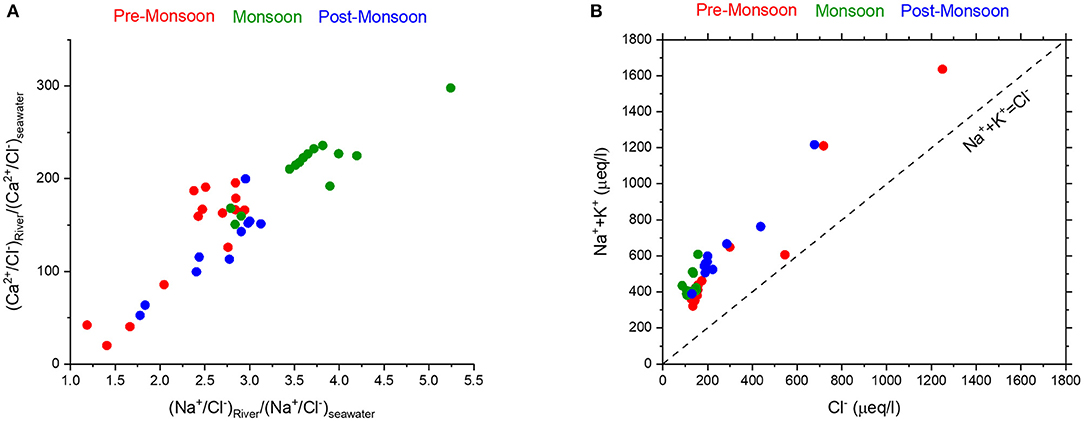
Figure 3. (A) High values (>1) of normalized Na+/Cl− and Ca2+/Cl− ratios in the Mahanadi River water samples, particularly those collected during monsoon (green circles), suggest higher contribution from mineral dissolution due to chemical weathering. (B) In a plot of (Na++K+) vs. Cl−, the Mahanadi River water samples display higher (Na++K+) than Cl− which suggests greater influence of chemical weathering compared to contributions from evaporites and seawater.
To further strengthen this argument of chemical weathering dominance in the Mahanadi River Basin, the concentrations of uncorrected total dissolved solids (TDS) are plotted vs. the ratios of Na+ and Na+ + Ca2+ (Gibbs, 1970; Figure 4). Here, Na concentrations represent the saline water endmember (e.g., ocean), whereas Ca represents for the fresh surface water bodies (e.g., rivers). Therefore, larger marine contribution, either by seawater mixing or atmospheric inputs of sea-salt will drive the ratio [Na+/(Na+ + Ca2+)] toward unity but with different TDS values. For the Mahanadi River, most of the water samples plot near the rock-weathering dominance region (Gibbs, 1970) with few samples, collected near the coast plotting in the seawater/evaporation dominated region (Figure 4). The results of the present study are also consistent with the earlier reported values of Chakrapani and Subramanian (1990) and that of Bastia and Equeenuddin (2019; Figure 4A). The distribution of the Mahanadi water samples in the Gibb's plot shows the dominance of chemical weathering over atmospheric inputs. When the cyclic salt corrected compositions were plotted in the Gibb's plot (Figure 4B), very little changes are observed in the distribution pattern and the samples plot in the chemical weathering dominated region. If the atmospheric contribution to the samples was significant, the samples would have plotted in the bottom left like that of the samples collected near the coast (Figure 4B). Therefore, it can be concluded that the atmospheric contribution to the studied samples is insignificant and the chemical weathering of different lithologies dominate the water chemistry of the samples.
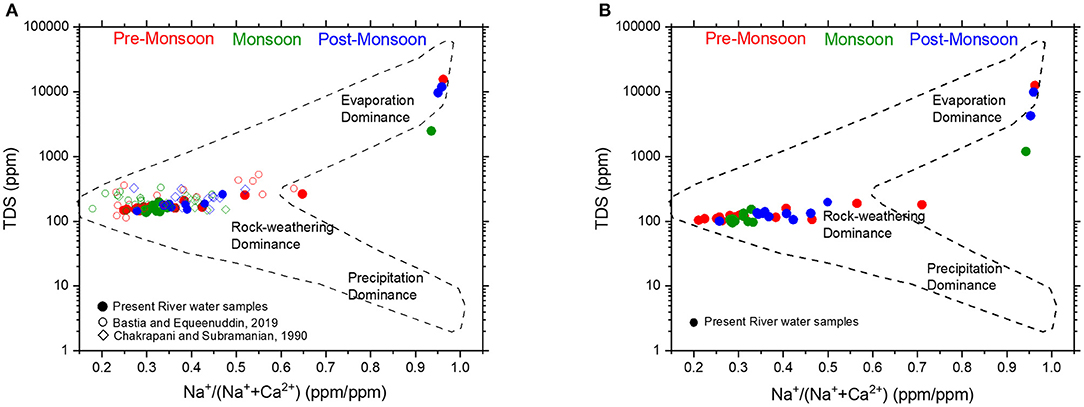
Figure 4. Gibb's plot for cyclic-salt uncorrected (A) and corrected (B) Mahanadi River water samples. Majority of the samples plot close to the rock-weathering dominated region which suggests that the water chemistry is dominated by rock weathering relative to cyclic-salt and evaporites. Our data (filled circles) are consistent with published data for the Mahanadi River water from Chakrapani and Subramanian (1990) (open diamonds) and Bastia and Equeenuddin (2019) (open circles). If sea salt contribution from rainwater (cyclic-salt correction) was large, the Mahanadi River water samples in (B) would have plotted further down and left relative to their position in (A). However, very little differences in their positions relative to (A) was observed, which suggests negligible sea salt contribution in the samples of this study.
Silicate vs. Carbonate Weathering
Major ion Chemistry
The bedrock of the Mahanadi River primarily consists of Proterozoic limestones in the upstream whereas downstream from the Hirakud Dam, the river traverses through granites and gneisses and coastal alluvium (e.g., Bastia et al., 2020). An interesting aspect related to the Mahanadi River chemistry is the contrasting interpretations of earlier studies regarding the dominant source of ions to the river. Based on two seasons of sampling, Chakrapani and Subramanian (1990) reported the dominance of carbonates over the silicates in the chemistry of the Mahanadi River, irrespective of the fact that downstream of the Hirakud Dam, this bedrock is devoid of any known carbonate lithology. A similar conclusion was reached by Panigrahy and Raymahashay (2005) based on analyses of a database from 13 locations acquired from the Central Water Commission with 5 stations downstream of the Hirakud Dam. These interpretations reflect the higher susceptibility of carbonates to weathering compared to granites and gneisses (Meybeck, 1987; Amiotte Suchet et al., 2003). In contrast, Bastia and Equeenuddin (2019) analyzed the water samples of the Mahanadi River collected over two seasons and reported that silicate weathering is the dominant source of ions to the Mahanadi River. Therefore, the major source of ions to the Mahanadi River is still unresolved.
If the carbonates (calcite and dolomite) control the ionic composition of the river water, then the following set of reactions (Equations 17–20) are expected to take place in the Mahanadi Basin, where carbonic and sulfuric acids would be the source of protons.
The role of nitric acid in these weathering processes has been ignored because of the low concentration of nitrate in the river water (Table 1). If the carbonates of the Mahanadi basin were the most dominant sources of the ions governed by these reactions, as suggested by Chakrapani and Subramanian (1990) as well as Panigrahy and Raymahashay (2005), the Ca2+ and Mg2+ concentrations should be higher and should balance the and concentrations. The data from the present study show the dominance of Ca2+ and Mg2+ ions (Table 1). The higher average molar (Ca2+ + Mg2+)/(Na+ + K+) cyclic salt corrected ratios in the studied samples (2.21 ± 0.6), irrespective of the sampling season, suggest the dominance of carbonate contributions in the lower basin, despite the lack of any carbonate lithology in the Lower Mahanadi Basin.
Further, the tight coupling of Ca2+ + Mg2+ with (r = 0.92) and Ca2+ + Mg2+ with + (r = 0.92) (Figures 5A,B) are consistent with the origin of these ions dominantly by carbonate dissolution. However, all these samples fall below the 1:1 line (Figures 5A,B) which suggests that the additional contribution from non-carbonate sources are required to balance the alkalinity and sulfate ions. Further, the molar Ca2+/ ratios of all the samples were found to be >1 (7.2 ± 3.2), which suggests that H2SO4 has no major control over the rock weathering in the studied samples (Stallard and Edmond, 1983). This latter observation is consistent with the results of Bastia and Equeenuddin (2019). Therefore, in the following discussions only has been used to evaluate the weathering mechanisms and the source of ions. These interpretations are further corroborated by the molar (Ca2+ + Mg2+)/ ratios of studied samples (0.44 ± 0.02), which display limited variation and are lower than the theoretical value of 0.5 which is suggested for H2CO3 mediated carbonate weathering.
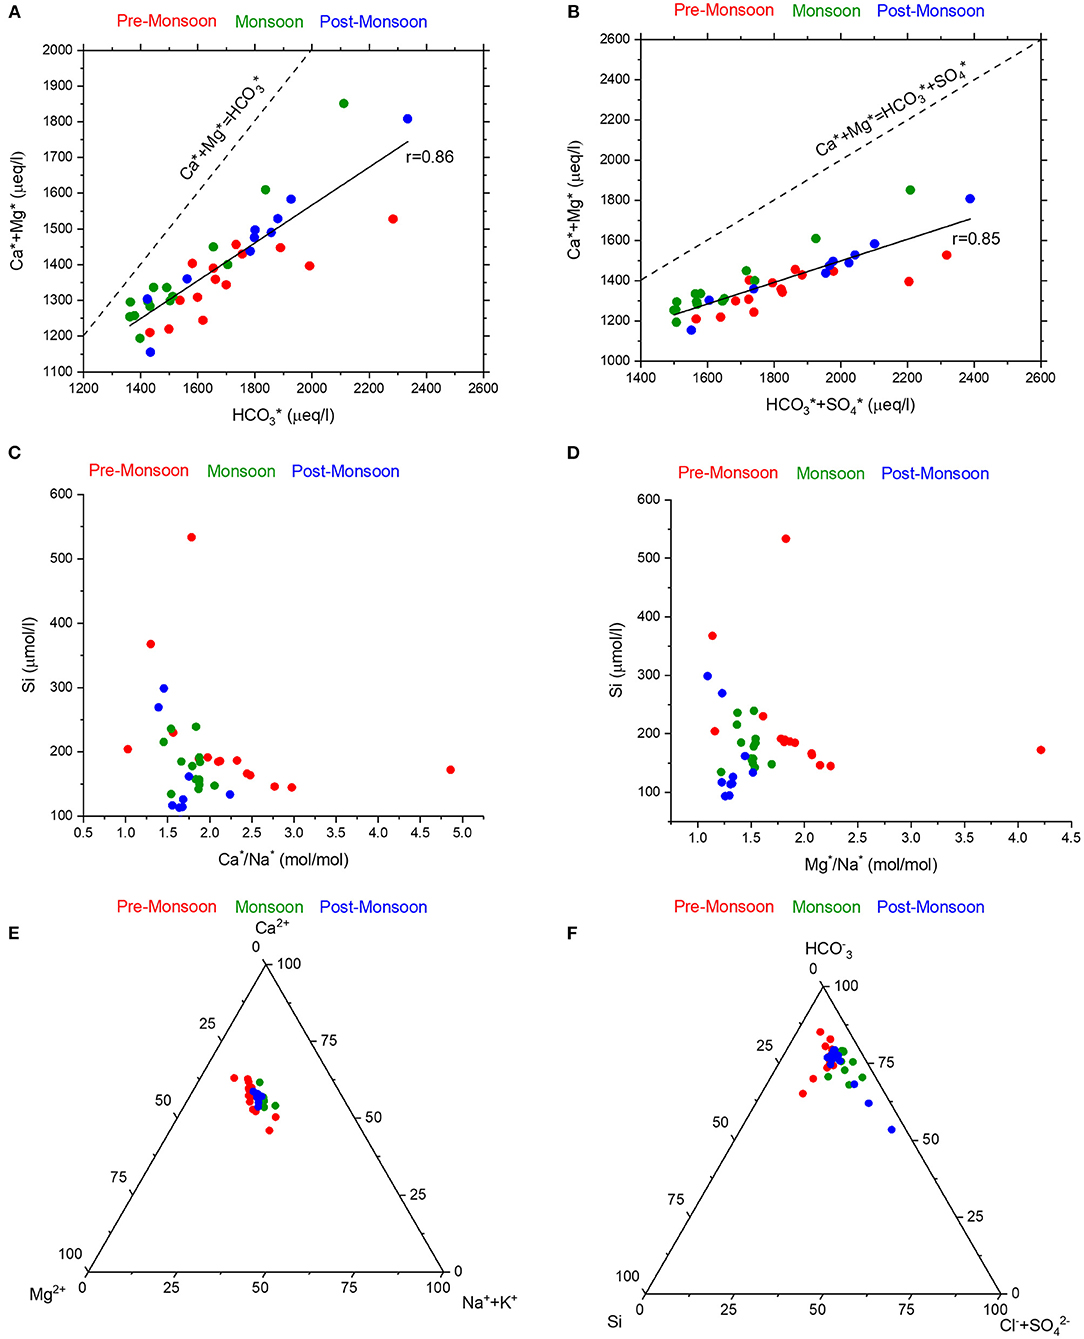
Figure 5. The good positive correlations of cyclic salt corrected Ca2++Mg2+ with (A) and (B) suggests significant contribution from carbonate dissolution. The samples below the 1:1 line, which suggests additional contributions from the silicate weathering. The same information can be derived from the cyclic-salt corrected (C) Ca2+/Na+ and (D) Mg2+/Na+ variations with Si concentrations as well as ternary plots of (E) Ca2+-Mg2+-Na++K+ and (F) -Si-Cl−+ where the samples plot closer to the Ca2+ and apices, respectively.
Most of the studied water samples (Figure 2) are supersaturated with respect to calcite and dolomite, which suggest that these ions (Ca2+ and Mg2+ ions) are in excess and dominate the water chemistry of the Mahanadi River. The sources of these ions could be both silicate weathering and/or carbonate dissolution. To further ascertain the origin of these ions, Ca*/Na* and Mg*/Na* ratios were compared with Si concentrations (Figures 5C,D). The identical broad negative trends across seasons in the distribution of these ions reflect that high cyclic salt corrected Ca/Na and Mg/Na ratios are associated with low silica concentrations and hence, rule out the dominance of silicate weathering to the river water chemistry. The same inference can be drawn from the ternary plots of cyclic salt corrected molar fractions of major cations (Ca*-Mg*-Na*+K*) and major anions (-Si-Cl−+), (Figures 5E,F) where the samples plot closer to the Ca and apices, respectively, suggesting dominance of water chemistry by calcite weathering. A closer evaluation of these plots also reveals that the samples collected during the pre-monsoon season seem to have more carbonate fractions than silicate ones.
The cyclic-salt corrected elemental ratios (Ca2+/Na+, /Na+, Mg2+/Na+, and Sr2+/Na+) (Figure 6) were used to understand the mixing of dominant endmembers. However, the direct comparison of these elemental ratios in the water samples with that of the local representative rocks is not possible as incongruent chemical weathering might fractionate the elemental ratios (e.g., Ca2+/Na+ molar ratios, Oliva et al., 2004). Therefore, the best probable way to relate these endmember compositions with that of the samples is to compare with the compositions of the rivers flowing through the single lithology as used by Négrel et al. (1993) and further modified by Gaillardet et al. (1997, 1999b). In the plots between cyclic salt corrected molar ratios of (Ca2+/Na+)/(Mg2+/Na+), (Ca2+/Na+)/(/Na+), and (Ca2+/Na+)/(Sr2+/Na+) (Figures 6A–C), Mahanadi water samples across different sampling seasons plot on mixing trends between silicate and carbonate endmembers and do not show any prominent contribution from evaporites. In addition, the compositions of the Mahanadi water samples suggest contributions from of limestone rather than dolomite (Figure 6D).
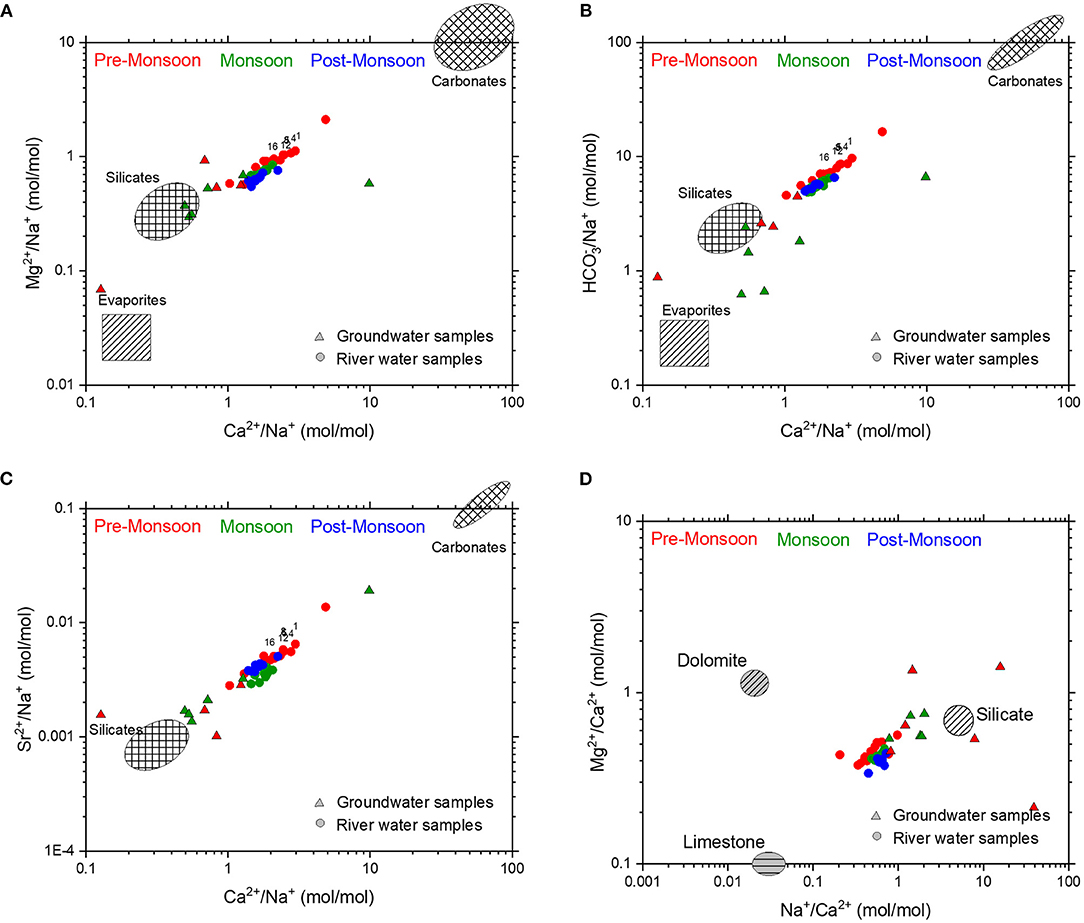
Figure 6. In plots of (A) Ca2+/Na+ vs. /Na+, (B) Ca2+/Na+ vs. Mg2+/Na+, (C) Ca2+/Na+ vs. Sr2+/Na+, and (D) Na+/Ca2+ vs. Mg2+/Ca2+ ratios, the Mahanadi River water samples plot closer to the silicate endmember. Selected samples collected during the pre-monsoon season (red) from upstream of the Naraj Barrage, display greater carbonate influence. The carbonate (limestone, dolomite), silicate, and evaporite endmember values are taken from Gaillardet et al. (1999b) and Négrel et al. (1993). Compositions of the groundwater samples broadly overlap with those of the river water samples and typically show greater influence of silicate rocks. Some of the groundwater samples plot closer to the evaporite endmember which possibly reflects the signature of seawater mixing.
The higher saturation indices of calcite along with the higher Ca2+/Na+ and /Na+ ratios show a relatively greater weathering of carbonates as compared to that of the silicates.
Radiogenic Sr Isotopes
The 87Sr/86Sr of the Mahanadi River water samples display significant variability (0.71791–0.72281, Table 1, Figure 7A). This range does not include two samples showing the least radiogenic 87Sr/86Sr (0.70989), which were collected from the estuary zone near the Paradeep port and reflect influence of seawater. Although no major seasonal differences exist in the 87Sr/86Sr of the water samples, the average 87Sr/86Sr (0.72066, n = 10) of the water samples collected during monsoon was found to be more radiogenic than the water samples collected during pre-monsoon (0.71926, n = 15) and post-monsoon (0.71959, n = 9) (Figure 7A). This is in accordance with the discussions on the major ion chemistry of the river, where the silicate contribution was found to be relatively higher during monsoon than non-monsoon seasons and carbonate contribution was found to be the major source of dissolved ions, particularly during the non-monsoon seasons.
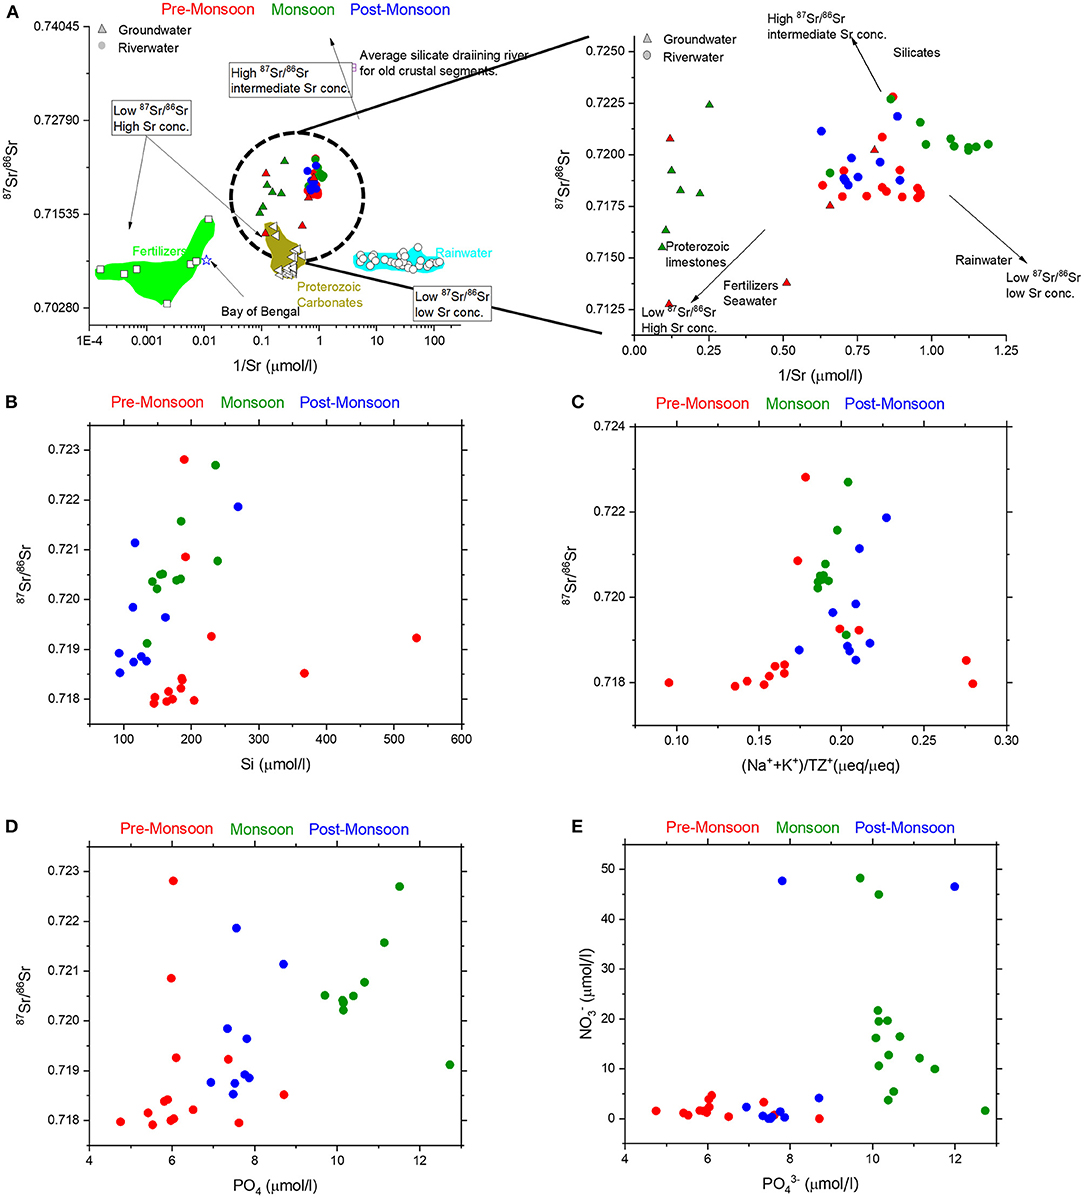
Figure 7. Bivariate plots of 87Sr/86Sr ratios with (A) 1/Sr, (B) Si, (C) cyclic salt corrected (Na++K+)/TZ+ showing compositions of the river water (circles) and groundwater (triangles) as well as the broad compositional domains of carbonates, silicates, rainwater, and fertilizers (see text for details). (D) Strong positive trend between 87Sr/86Sr ratios and during monsoon can be explained by contributions from silicate weathering as well as phosphate fertilizers inputs. (E) High concentrations of () and () during monsoon suggests the influence of fertilizers to the river water samples.
In the bivariate plot of 87Sr/86Sr vs. 1/Sr (Figure 7A) no definite trends were observed during the pre-monsoon and post-monsoon seasons, but during the monsoon season, the water samples display an overall negative trend, which reflects that relatively more radiogenic 87Sr/86Sr ratios are associated with the low Sr concentrations, which is a signature of silicate weathering. Additionally, high Rb/Sr ratios (average 27.6 ± 13 nmol/μmol) are associated with the radiogenic 87Sr/86Sr ratios during monsoon, compared to the lower Rb/Sr in the pre-monsoon (average 22.6 ± 9 nmol/μmol) and post-monsoon (average 19.8 ± 8 nmol/μmol) seasons. Higher silicate weathering is expected to increase the concentration of silica along with the contribution of Na+ and K+ in the total cations (TZ+). The broad positive trends in plots of Si vs. 87Sr/86Sr and (Na* + K*)/TZ+* vs 87Sr/86Sr (Figures 7B,C) during monsoon further confirm the above interpretation that the silicate weathering is dominant during monsoon and modulates the chemistry of the river as compared to the non-monsoon seasons; during the pre-monsoon season both carbonate and silicate dissolution control the Mahanadi River chemistry.
However, a close inspection of the bivariate plot of 87Sr/86Sr vs. 1/Sr (Figure 7A) reveals the effect of three endmembers: two endmembers with less-radiogenic 87Sr/86Sr but having high and low Sr concentrations and the third endmember with more radiogenic 87Sr/86Sr and intermediate Sr concentration. The less-radiogenic sources are potentially the Proterozoic carbonates present in the upper Mahanadi Basin, various fertilizers used in the agricultural fields having variable Sr concentrations, and rainwater, whereas the radiogenic source is most likely the silicate rocks (granites, gneisses, and Charnockites) present in the Lower Mahanadi River basin. However, given the varied lithology of this basin, pinpointing the silicate source is not straight forward. For instance, the Proterozoic granite gneisses of Odisha, record a wide range of 87Sr/86Sr. The Sambalpur Granites record an average 87Sr/86Sr of 0.71299 whereas the Angul gneisses show higher values of 0.78159 (Mohanty, 2002 and references therein). The 87Sr/86Sr of Charnockites also show a wide range of variation from 0.70213 to 0.74787 (Bhattacharya et al., 2001). Despite the wide range of 87Sr/86Sr for the silicate rocks, the global average of 87Sr/86Sr ratio for the silicate-draining rivers varies from 0.705 for recent magmatic provinces up to 0.735 for old crustal segments with average Sr concentration around 0.18 μmol/l (Figure 7A; Gaillardet et al., 1999b). Therefore, a source having an intermediate concentration of Sr and highly radiogenic 87Sr/86Sr has been envisaged as silicate endmember that contributes seasonally varied signatures to both the river water and groundwater. The contribution from a radiogenic source having intermediate Sr concentration is quite evident from the bivariate plot of 87Sr/86Sr ratios and 1/Sr (Figure 7A). A moderately good positive trend between Si concentration and 87Sr/86Sr ratios (Figure 7B) confirms the contribution from the silicates.
One of these two less-radiogenic sources having very high Sr concentration could be the Proterozoic carbonates, fertilizers, or combination of both. The Sr concentrations and 87Sr/86Sr of the Proterozoic carbonates in the upper reaches of the Mahanadi River, which are a part of Chhattisgarh supergroup show average values of 3.39 ± 1.22 mmol/l and 0.70892 ± 0.002 (George et al., 2019). The other plausible non-radiogenic source with high Sr concentration could be the fertilizers used in the agricultural fields in most part of the Mahanadi delta. Studies have shown that the 87Sr/86Sr of most of the fertilizers used in different agricultural fields vary between 0.7066 and 0.7095 (Zou et al., 2018; Thomsen and Andreasen, 2019) with very high Sr concentrations. Except muriate of potash (87Sr/86Sr ratios = ~0.749), Trivedi et al. (1995) reported very low 87Sr/86Sr ratios (~0.708) together with a wide range of Sr concentrations for all the other phosphates fertilizers that are commonly used in India. The Sr ions derived from fertilizers are typically retained in soils before being released in dissolved form into groundwater and river waters via cation exchange processes (Zou et al., 2018 and references therein). Because of the similar isotopic ratios of the Proterozoic carbonates and fertilizers, it is difficult to isotopically distinguish the contributions of both these sources. To ascertain the contribution of fertilizers in the studied water samples, bivariate plots of 87Sr/86Sr vs. phosphate () concentrations (Figure 7D) and vs. concentrations (Figure 7E) were considered. High loading of nitrates and phosphates are present during monsoon (Figure 7E) and significant positive correlation exist between and 87Sr/86Sr ratios (Figure 7D) in the same monsoonal samples, both suggesting contributions of fertilizers. This interpretation is consistent with the earlier findings of Sundaray et al. (2006) who reported high levels of organic pollution as indicated by Nitrogen and Phosphorus loading during peak monsoon season in the Mahanadi River. Additionally, Sundaray et al. (2012) also reported the high loading of metals like Fe, Cu, and Pb in the Mahanadi River during the monsoon season and their relationship with the agricultural runoff. However, Bastia and Equeenuddin (2019) refuted any major contributions from the agricultural activities, interpreted through the major ion chemistry.
The other less-radiogenic source having very low Sr concentration could be the rainwater. This hypothesis can be ascertained by the distribution of the monsoon samples in the bivariate plots of 87Sr/86Sr ratios and 1/Sr (Figure 7A), where the monsoon samples show a negative trend as well as form a separate cluster than the non-monsoon samples. This distribution of monsoon samples cannot be explained by the mixing between silicates and carbonates/fertilizers having high Sr concentrations. The average Sr isotopic composition of rainwater is 0.709 (Moon et al., 2007). Therefore, rainwater dilution seems to have prominent effect on the Sr signatures of the river water samples during high runoff period.
To summarize, the Mahanadi River chemistry in the lower basin is modulated by contributions from four sources, viz. silicates, carbonates, fertilizers, and rainwater. The non-monsoon water samples show dominant controls from carbonate and silicate weathering, whereas the monsoon samples are mostly modulated by the silicate weathering and agricultural inputs along with the dilution effect of rainwater. Major ion indices for agricultural inputs such as /Na+, and K+/Na+ in the present study are not consistent with the signature of fertilizer inputs unlike in the Seine River (Roy et al., 1999) and the Changjiang Basin rivers (Chetelat et al., 2008). However, 87Sr/86Sr provides strong constraints on the agricultural/fertilizer inputs to the Mahanadi River.
Quantification of Silicate and Carbonate Fractions
Evaporation of river water, flood water, and groundwater lead to precipitation of solutes and formation of different types of sodium salts leading to the formation of alkaline/saline soils (Datta et al., 2002; Rai et al., 2010). This phenomenon is reported in the Indo-Gangetic plains (Datta et al., 2002). The presence of such alkaline soils can affect the release of Na+ to the riverine water, which complicates the use of Na+ as a silicate weathering proxy. To estimate the influence of such soils in the water chemistry of the Mahanadi River, sodium adsorption ratio (SAR) was estimated using the following equation (e.g., Sundaray et al., 2009):
Where, Na+, Ca2+, and Mg2+ are in meq/l. These SAR values are related to the exchangeable sodium percentages in the soil. The results of our study show consistently lower values (average 17 ± 7, Table 1), which are considerably lower than the SAR values reported for the water leachates of the saline-alkaline soils from the Ganges River system (Chatterjee and Singh, 2022), which rules out the presence of any alkaline soils in the studied region. This interpretation is consistent with the results of Sundaray et al. (2009), who also studied this exchangeable sodium percentages in the Mahanadi lower basin. Therefore, the Na composition of the Mahanadi River is dominantly derived from the silicate weathering, as has been used in the earlier study of Bastia and Equeenuddin (2019).
The relative proportions of the silicate and carbonate fractions in the samples of the Mahanadi River were evaluated using the Equations 6, 7 through the forward modeling approach. The accuracy of this quantification depends on the precise definitions of the endmembers Ca2+/Na+ and Mg2+/Na+ ratios. However, it is difficult to ascertain these endmembers ratios accurately in a basin having a heterogeneous lithology like the Mahanadi Basin. In the forward model approach, the (Ca2+/Na+)sil and (Mg2+/Na+)sil ratios (0.61 and 0.27, respectively), were taken from the average compositions of the river bed sediments of the three tributaries the Tel, Ong and Ib data from Bastia and Equeenuddin (2019), which flow primarily over silicate rocks of the Mahanadi basin, following the approaches of Blum et al. (1998) and Wu et al. (2008). After removing some outliers' estimations statistically, the average values for the silicate and carbonate contributions to the water chemistry of the Mahanadi River were found to be 28 ± 4 and 56 ± 6%, respectively. The contributions from the silicate weathering during monsoon (30 ± 2 %) was found to be higher than that of the pre-monsoon season (26 ± 3 %) (Figure 8A), which were in accordance with the earlier discussions.
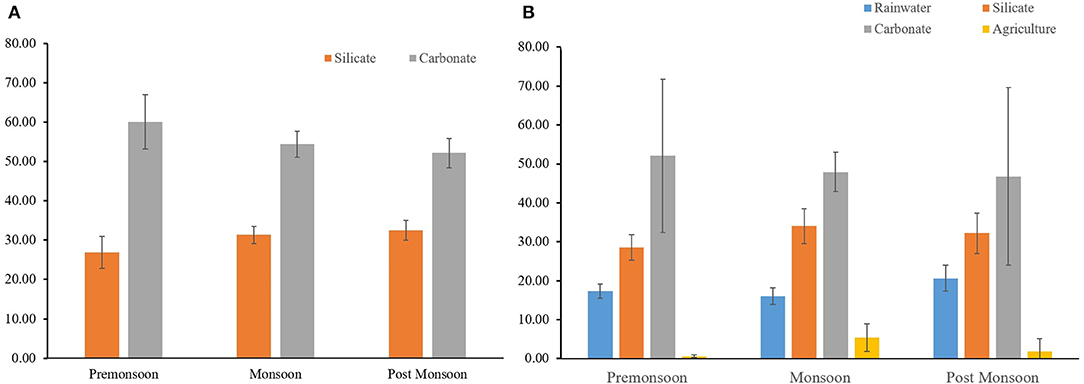
Figure 8. Percentage source contributions of different endmembers to the water chemistry of the Mahanadi River from the (A) Forward model and (B) Inverse model. The error bars are the 1σ standard deviation values. In the inverse model, the contributions from the agricultural runoff have been increased by a factor of 10 for better graphical representation. See text for details.
In the inverse model estimation, the set of a priori endmember values (Table 2) are used from the available literature that are best suited for the Mahanadi River drainage basin. The Na-normalized major ions ratios (Cl−/Na+, Ca2+/Na+, Mg2+/Na+, /Na+) for the rainwater endmember were taken from the mean rainwater data reported for an urban site (Bhubaneswar) situated over the Lower Mahanadi Drainage Basin (Das R. et al., 2005). The 87Sr/86Sr for the rainwater was taken from Moon et al. (2007). The global average Na-normalized ratios and 87Sr/86Sr for the carbonates (Moon et al., 2007) were considered in the present study. In addition, estimations from the Millot et al. (2003) and Moon et al. (2007) have been considered for the silicate endmember, since the Na-normalized Ca2+ and Mg2+ ratios of this endmember are closer to the surface sediments of the tributaries of the Mahanadi River traversing through a silicate terrain (Bastia and Equeenuddin, 2019). For the chemical signature of the agriculture endmember, the estimations from the Roy et al. (1999) and Chetelat et al. (2008) have been considered, assuming that agricultural inputs are only affecting the compositions of Na+, Cl− and and all in river water are derived from agricultural runoff (e.g., Roy et al., 1999).
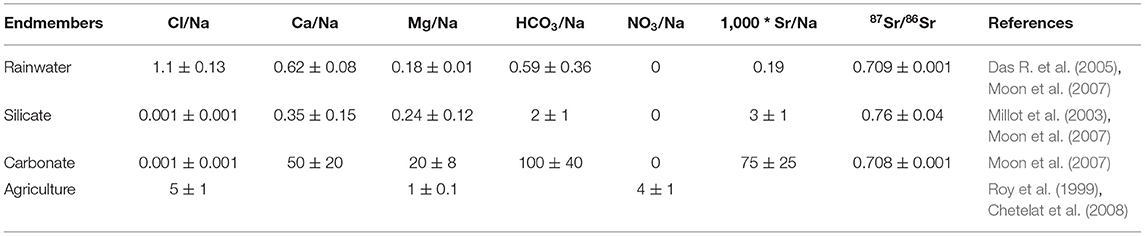
Table 2. A priori molar ratios and 87Sr/86Sr for the various end-members used in the inverse model and associated uncertainties.
The inverse model results for the Mahanadi River (Figure 8B) show that the dissolution of carbonates dominates the water chemistry of the Lower Mahanadi basin followed by the weathering of silicates. These results from the inverse model broadly overlap with the results of the forward model (Figure 8A). The average silicate and carbonate contributions to the Mahanadi River chemistry were found to be (31 ± 4 and 45 ± 17%, respectively), which are comparable to that of the forward model as discussed above (Figure 8A). The agricultural input to the Mahanadi River chemistry were found to be low (<2%) in comparison to the other global rivers. This is consistent with the observed low values in most of the locations throughout the studied period. However, a seasonal variation was observed in the studied samples where, the contributions during the Monsoon season (Figure 8B) were higher than that of the non-monsoon seasons for most of the studied locations. This observation supports our earlier claim that the water samples during the monsoon season are influenced by the fertilizer inputs. The minor discrepancies between the forward and inverse model results can be attributed to the differences in the release ratios of the major ions between the two models, which has also been observed in the earlier studies (e.g., Wu et al., 2005; Tripathy and Singh, 2010).
Overall, the major source of ions to the lower catchment of the Mahanadi River is the dissolution of carbonates followed by the contribution from silicate weathering and fertilizers. No significant contribution from evaporites were observed in the studied samples. Distinct seasonal changes in the source rocks contributions modulate the distribution of ions and 87Sr/86Sr.The pre-monsoon samples represent more carbonate component, and the monsoon samples record more contributions from silicate weathering compared to the other seasons.
Characteristics of Denudation Regime
Based on the above discussions, the ionic compositions in the dissolved component of the Mahanadi lower basin are primarily modulated by the chemical weathering of rocks; contributions from carbonate components outpace that of the silicate components in most of the samples. The silicate component in the Mahanadi River is primarily derived from the granites, gneisses, and charnockites, which are present in the lower reaches of the basin. Therefore, the dominance of the carbonate component in the river water composition might be due to the high susceptibility of carbonates to weathering and/or the transport-limited weathering regime. In later case, contributions to the river loads by different lithologies are proportional only to their area of exposure. In the Lower Mahanadi Basin, most of the drainage area is covered with thick alluvium, a signature of transport-limited denudation where the maximum erosion rate exceeds the ability of transport processes to remove the material (Stallard and Edmond, 1983). Therefore, the contributions of different lithologies to the dissolved loads of the river should be proportional to the area of exposure and independent of their relative susceptibility to weathering. Hence, the chemical weathering intensity is expected to be low to moderate in these weathering regimes (Stallard and Edmond, 1983; Murnane and Stallard, 1990).
To validate the characteristics of the denudation regime (transport-limited), the degree of weathering in the studied drainage basin, the molecular ratio between the dissolved silica and cations resulting from silicate rock weathering has been evaluated. In this study, the Re molar index (Equation 18), initially proposed by Tardy (1971) and later modified by Boeglin and Probst (1998) has been used.
where the superscript * denotes the cyclic salt corrected concentrations of major ions. In the present study, instead of the cyclic salt corrected values, the silicate fractions obtained from the inverse model were used to evaluate the Re index for the samples. This modified approach was used to rule out the influence of the carbonate fractions on this index, which is primarily designed to evaluate the rock weathering in a granite and gneiss terrains (Boeglin and Probst, 1998). The value of Re decreases with increase in the weathering rates. The average Re molar index in the present studied samples, is 2.6 ± 0.6, which suggests that the weathering intensity is moderate, as inferred earlier, and favor the formation of more kaolinite with less smectite (Boeglin and Probst, 1998; Meunier et al., 2015). This interpretation is further corroborated by the mineral chemistry of the bedrocks, which is primarily dominated by the kaolinite and illite, having low to moderate chemical index of alteration (Bastia et al., 2020; Babu et al., 2021).
Effect of Naraj Barrage on Riverine Chemistry
In the upstream of the Naraj Barrage, the Mahanadi River flows as a single channel, but downstream of the Naraj Barrage, it segregates into several canals and channels (Figure 1). Therefore, between the locations of the Hirakud dam and the Naraj Barrage the effect of sources and processes are expected to be coherent and represent a definite trend in all the samples, which gets perturbed in the river section between the Naraj Barrage and the Paradeep port (Figure 1). The distinct changes in the spatial distribution patterns of chemical compositions have been observed, for example, the sudden changes in the concentrations of Cl− ion and pH along with the pollution index (Figure 2), which possibly reflect the increase in the anthropogenic contribution in the downstream part of the river after the Naraj Barrage. These changes are also reflected in the saturation indices of calcite and dolomite, which mimic the pH distribution patterns in all seasons (Figure 2).
The effect of this Barrage on the contribution of carbonate and silicate fractions to the riverine chemistry has also been observed. For instance, in the bivariate plots of (Ca2+/Na+)/(Mg2+/Na+), (Ca2+/Na+)/(/Na+), and (Ca2+/Na+)/(Sr2+/Na+) (Figure 6), the samples of the pre-monsoon season having more carbonate contributions are mostly from the upstream of the Naraj Barrage. In the downstream section of the river after the Naraj Barrage, the pre-monsoon samples show the mixed contribution but having the dominance of more silicate weathering (Figure 9A). The results from the inverse model also validate the above interpretation. The samples from the downstream of the Naraj Barrage during pre-monsoon have more silicate contributions (~28% ± 3) than that of the samples collected from the upstream of the Barrage (~23% ± 0.56). However, these trends were absent in the ionic ratios of the samples collected during monsoon, where the spatial distinction between silicate and carbonate contributions is not evident. The negative trend between the Ca*/Na* and 87Sr/86Sr ratios (Figure 9B) in the upstream of the Naraj Barrage is consistent with the dissolution of carbonates as the dominant sources of ions. However, downstream of the Naraj Barrage, the relationship between Ca*/Na* and 87Sr/86Sr (Figure 9A) shows a positive trend for most of the samples. However, the obscured nature of this relationship in the downstream possibly reflects the effects of agricultural inputs as discussed earlier.
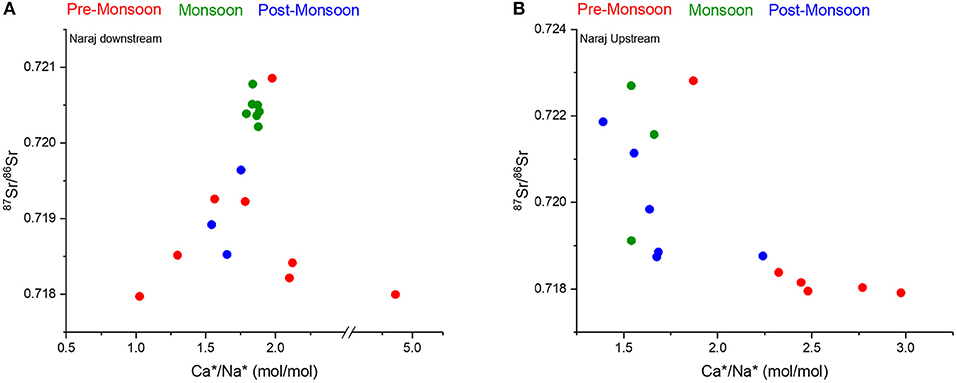
Figure 9. Distinct differences in the trends of cyclic salt corrected Ca2+/Na+ and 87Sr/86Sr in the Mahanadi water samples collected (A) downstream and (B) upstream of the Naraj Barrage. The negative trends observed in samples collected from upstream of the Naraj Barrage (B) suggest the dominance of carbonate dissolution, which is contrasts with the samples collected downstream of the Naraj Barrage (A).
Groundwater, River Water, and Seawater Interaction
One distinct trend observed in the groundwater samples was comparatively low pH and high EC during monsoon relative to pre-monsoon (Table 1). These trends are just opposite to the trends observed in the river waters. The high EC of river water samples during pre-monsoon can be the result of evaporation and/or the groundwater discharge into the river as speculated also by Chakrapani and Subramanian (1990). Interestingly, three groundwater samples collected during monsoon (G5, G6, and G12) and one during pre-monsoon season (G9) show very low Na+/Cl− ratios (<0.65) (Figure 10A), which cannot be solely explained by seawater and fresh groundwater mixing. A major source of chloride ions to these groundwater samples would be the seawater. The distributions of groundwater samples in the Piper diagram (Figure 10B) suggest that some of the samples are characterized by Ca-Mg-Na-HCO3 water type, which represent a typical coastal aquifer system (Figure 10B). Some of these samples adjacent to the coast (G12, G6) represent Na-Mg-Ca-Cl water type representing the intrusion of seawater. The strong positive correlation of chloride ion with the EC (r2 = 0.96) during monsoon confirms the above interpretation. Surprisingly, the sample collected close to the Naraj Barrage(G5), which was collected during the monsoon also record the seawater ionic signature with very low Na+/Cl− ratio (0.51) (Figure 10A). A moderate negative correlation between the sampling distance from the coast and chloride ion (r2 = 0.77) and Ca-Cl water type (Figure 10A) suggest that the composition of G5, most likely represents a seawater mixing signature. The other probable source of chloride ion would be the fertilizers from the agricultural fields. As discussed in earlier sections, the monsoon samples show signatures of fertilizer inputs. Hence, the same fertilizer can also be the source of these excess chloride ions in the groundwater samples. The distribution of 87Sr/86Sr in the groundwater samples during monsoon season show the mixing between surface water and another source having less radiogenic 87Sr/86Sr and high Sr (Figure 7A). This latter less radiogenic 87Sr/86Sr source is presumed to be the seawater and/or fertilizers as explained for the river water chemistry (Section Silicate vs. Carbonate Weathering). However, it is difficult to quantify the groundwater-river water interaction because no definite relationships in terms of elemental or isotopic ratios were observed between the groundwater and nearby river water samples in the studied region (Figure 7A). The lack of a distinct trend is possibly the result of the complex distribution pattern of hydrogeological zones in the deltaic region of the Mahanadi River as outlined by Radhakrishna (2001).
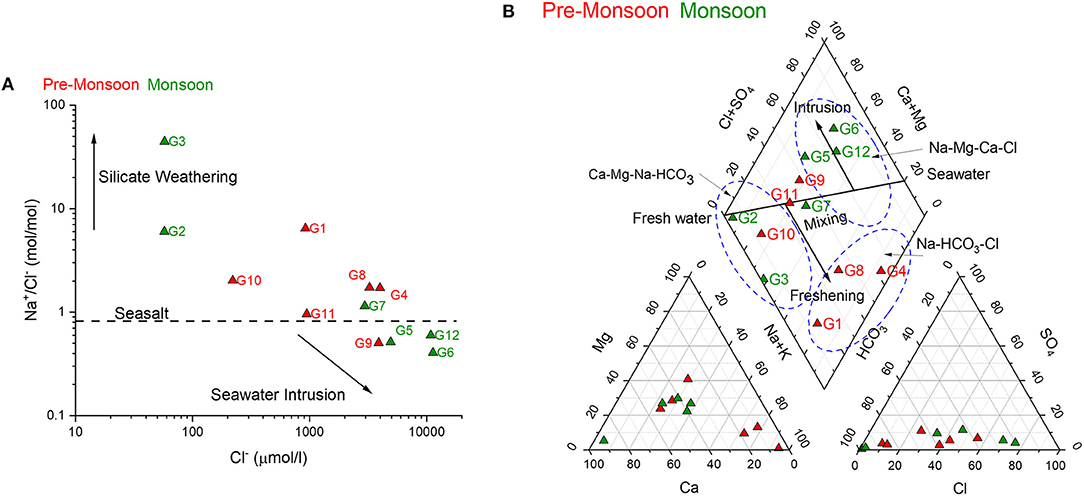
Figure 10. Distributions of groundwater samples in (A) Na+/Cl− vs. Cl− bivariate plot and (B) Piper plot. These plots suggest influence of seawater intrusion in the studied samples.
Sr-Flux From the Mahanadi Basin to the Global Ocean
The 87Sr/86Sr of river waters reflect their source rock compositions and modulate the global Sr-budget. Changes in the 87Sr/86Sr of marine sediments reflect the tectonic history of the continents (e.g., Richter et al., 1992) and can be used to establish the source rock composition of the sediments (e.g., Acharya and Chakrabarti, 2019). Variations of 87Sr/86Sr in seawater primarily depend on the continental weathering rates that vary from one riverine basin to others. Therefore, it is of prime-importance to estimate the Sr-flux from different riverine systems to the oceanic realm, especially for major rivers like Mahanadi, which is traversing through heterogeneous lithologies.
The average water discharge of the Mahanadi River to the Bay of Bengal is 49 ± 16 × 1012 liter/year (Bastia and Equeenuddin, 2016). The average Sr concentration and 87Sr/86Sr of this river are 1.17 ± 0.24 μmol/l and 0.71959 ± 0.001, respectively. Therefore, the annual flux of Sr to the Bay of Bengal from the Mahanadi River varies from 30.7 × 10¹² μmol/year to 91.7 × 10¹² μmol/year, which is ~0.1–0.3% of global average riverine flux (3.3 × 10¹⁶ μmol/year) to the global ocean (Basu et al., 2001). Considering the riverine flux near the Hirakud dam, Boudh and Naraj Barrage (India-WRIS, 2019), the flux-weighted averages of Sr concentration and 87Sr/86Sr were found to be 1.03 μmol/l and 0.72154, respectively. The Sr-flux of the Mahanadi basin is around 12% of the combined Ganges-Brahmaputra flux (Basu et al., 2001) to the Bay of Bengal. The 87Sr/86Sr of the Mahanadi basin exceeds the average global runoff value of 0.7119 (Krishnaswami et al., 1992; Richter et al., 1992; Basu et al., 2001) and falls within the range of 0.7170–0.7300 of Ganges-Brahmaputra system. The groundwater samples of the Mahanadi basin show an average Sr concentration of 5.45 ± 3.64 μmol/l having an average 87Sr/86Sr of 0.71772 ± 0.003, which is comparatively higher than the reported Sr concentrations (4.5 μmol/l) and 87Sr/86Sr ratios (0.715–0.720) from the groundwater samples of the Ganges basin (Basu et al., 2001). This finding has implications for the submarine groundwater discharge derived Sr flux to the Bay of Bengal (Chakrabarti et al., 2018).
Conclusions
1. Lower pollution index (average 20%) suggests that the major ion chemistry of the Mahanadi River is less affected by anthropogenic pollution, despite the presence of some major industries and densely populated cities along its course. Rapid dilution away from the source of the pollutants and subsequent precipitation can explain the low pollution in the dissolved load of the river.
2. Major ion chemistry and 87Sr/86Sr of the river water samples indicate that seasonally mediated carbonate dissolution and silicate weathering modulate the chemistry of the Lower Mahanadi River Basin. Both forward and inverse model results show that the dissolution of carbonates influence the water chemistry of the Mahanadi River, followed by the contributions from the silicate weathering. These contributions vary seasonally and during the monsoon, the contributions from the silicate weathering is relatively high compared to the pre-monsoon season.
3. A strong relationship between the and 87Sr/86Sr was observed in the samples collected during the monsoon season, which suggests significant contributions from fertilizers to the river water during the monsoon in addition to silicate weathering. The high loading of nitrate and phosphates during the monsoon season is consistent with high agricultural inputs.
4. The Naraj Barrage, an artificial water barrier separates the dominance regimes of silicate and carbonate dissolution, even though no carbonate lithology is present in the Lower Mahanadi Basin. Water samples collected from upstream of the Naraj Barrage show dominance of carbonate dissolution especially in the pre-monsoon season, while those collected farther downstream, the signatures of silicate weathering were prominent especially during the monsoon season along with the contribution from the fertilizers.
5. The groundwater composition of the Lower Mahanadi Basin was found to be modulated by the mixing of four endmembers, viz. weathering of silicate and carbonate rocks, the mixing of Bay of Bengal seawater and fertilizer inputs. Most of the groundwater samples are characterized by Ca-Mg-Na-HCO3 and Na-Mg-Ca-Cl compositions, which are the characteristic of coastal groundwater and seawater intrusion, respectively.
6. The flux-weighted averages of Sr concentration and 87Sr/86Sr were found to be 1.03 μmol/l and 0.72154, respectively, and the latter was found to exceed the average global runoff value of 0.7119 and overlaps the range of Ganges-Brahmaputra system. The groundwater samples show relatively higher Sr concentrations and radiogenic 87Sr/86Sr compared to groundwater from the Ganges Basin, which has implications for submarine groundwater derived Sr flux to the Bay of Bengal.
Data Availability Statement
The original contributions presented in the study are included in the article/supplementary material, further inquiries can be directed to the corresponding author/s.
Author Contributions
SA and RC were involved in conceptualization of the study. SA, VH, and RC were involved in drafting the manuscript and interpretation of the data. SA collected all the samples used in this study. SA and VH analysed the samples. RC supervised this study. All authors reviewed and approved the manuscript.
Funding
SA acknowledges the Science & Engineering Research Board, Government of India for providing financial support through National Post-Doctoral Fellowship (N-PDF) grant (PDF/2016/000411). VH acknowledges partial salary support from the Ministry of Earth Sciences, India (MOES/PAMC/H&C/41/2013-PC-II).
Conflict of Interest
The authors declare that the research was conducted in the absence of any commercial or financial relationships that could be construed as a potential conflict of interest.
Publisher's Note
All claims expressed in this article are solely those of the authors and do not necessarily represent those of their affiliated organizations, or those of the publisher, the editors and the reviewers. Any product that may be evaluated in this article, or claim that may be made by its manufacturer, is not guaranteed or endorsed by the publisher.
Acknowledgments
The authors acknowledge Dr. Jean Riotte and Hemanth Moger of Indo French Cell for Water Sciences, Indian Institute of Science (IISc), Bangalore for helping with the measurements of anion concentrations. We thank the editor and the two reviewers for their comments and suggestions.
References
Acharya, S. S., and Chakrabarti, R. (2019). Variations in trace metal concentrations and Sr, Nd isotopic compositions in sediments from two contrasting settings in the Eastern Arabian Shelf: Implications for provenance and paleoclimate reconstruction. Chem. Geol. 509, 134–151. doi: 10.1016/j.chemgeo.2019.01.016
Amiotte Suchet, P., Probst, J.-L., and Ludwig, W. (2003). Worldwide distribution of continental rock lithology: implications for the atmospheric/soil CO 2 uptake by continental weathering and alkalinity river transport to the oceans: world wide distribution of continental rock lithology. Glob. Biogeochem. Cycles 17, 1038. doi: 10.1029/2002GB001891
Amiotte Suchet, P., and Probst, J. L. (1993). Modelling of atmospheric CO2 consumption by chemical weathering of rocks: application to the Garonne, Congo and Amazon basins. Chem. Geol. 107, 205–210. doi: 10.1016/0009-2541(93)90174-H
Babu, S. S., Rao, V. P., Satyasree, N., Ramana, R. V., Mohan, M. R., and Sawant, S. (2021). Mineralogy and geochemistry of the sediments in rivers along the east coast of India: inferences on weathering and provenance. J Earth Syst Sci 130, 60. doi: 10.1007/s12040-020-01551-5
Banerjee, A., Chakrabarti, R., and Mandal, S. (2016). Geochemical anatomy of a spheroidally weathered diabase. Chem. Geol. 440, 124–138. doi: 10.1016/j.chemgeo.2016.07.008
Bastia, F., Equeenuddin, S., Roy, P. D., and Hernández-Mendiola, E. (2020). Geochemical signatures of surface sediments from the Mahanadi river basin (India): chemical weathering, provenance, and tectonic settings. Geol. J. 55, 5294–5307. doi: 10.1002/gj.3746
Bastia, F., and Equeenuddin, S.k. (2019). Chemical weathering and associated CO2 consumption in the Mahanadi river basin, India. J. Asian Earth Sci. 174, 218–231. doi: 10.1016/j.jseaes.2018.12.010
Bastia, F., and Equeenuddin, S. K. (2016). Spatio-temporal variation of water flow and sediment discharge in the Mahanadi River, India. Glob. Planet. Change 144, 51–66. doi: 10.1016/j.gloplacha.2016.07.004
Basu, A. R., Jacobsen, S. B., Poreda, R. J., Dowling, C. B., and Aggarwal, P. K. (2001). Large groundwater strontium flux to the oceans from the bengal basin and the marine strontium isotope record. Science 293, 1470–1473. doi: 10.1126/science.1060524
Bhattacharya, S., Kar, R., Misra, S., and Teixeira, W. (2001). Early archaean continental crust in the Eastern Ghats granulite belt, India: isotopic evidence from a charnockite suite. Geol. Mag. 138, 609–618. doi: 10.1017/S0016756801005702
Blum, J. D., Gazis, C. A., Jacobson, A. D., and Chamberlain, C. P. (1998). Carbonate versus silicate weathering in the raikhot watershed within the high himalayan crystalline series. Geology 26, 411–414. doi: 10.1130/0091-7613(1998)026<0411:CVSWIT>2.3.CO;2
Boeglin, J.-L., and Probst, J.-L. (1998). Physical and chemical weathering rates and CO2 consumption in a tropical lateritic environment: the upper Niger basin. Chem. Geol. 148, 137–156. doi: 10.1016/S0009-2541(98)00025-4
Chakrabarti, R., Mondal, S., Acharya, S. S., Lekha, J. S., and Sengupta, D. (2018). Submarine groundwater discharge derived strontium from the Bengal Basin traced in Bay of Bengal water samples. Sci. Rep. 8, 4383. doi: 10.1038/s41598-018-22299-5
Chakrapani, G. J., and Subramanian, V. (1990). Preliminary studies on the geochemistry of the Mahanadi river basin, India. Chem. Geol. 81, 241–253. doi: 10.1016/0009-2541(90)90118-Q
Chatterjee, J., and Singh, S. K. (2022). Impact of dissolution of saline-alkaline soils on the hydrochemistry and erosion rates of the ganga river system. Geochem. Geophys. Geosyst. 23, e2021GC009914. doi: 10.1029/2021GC009914
Chetelat, B., Liu, C.-Q., Zhao, Z. Q., Wang, Q. L., Li, S. L., Li, J., et al. (2008). Geochemistry of the dissolved load of the Changjiang basin rivers: anthropogenic impacts and chemical weathering. Geochim. Cosmochim. Acta 72, 4254–4277. doi: 10.1016/j.gca.2008.06.013
CWC (2014). Mahanadi Basin. Ministry of Water Resources, Govt. of India, New Delhi. Available online at: https://indiawris.gov.in/downloads/Mahanadi%20Basin.pdf (accessed June 12, 2021).
Dalai, T. K., Krishnaswami, S., and Sarin, M. M. (2002). Major ion chemistry in the headwaters of the Yamuna river system: chemical weathering, its temperature dependence and CO2 consumption in the Himalaya. Geochim. Cosmochim. Acta 66, 3397–3416. doi: 10.1016/S0016-7037(02)00937-7
Das, A., Krishnaswami, S., Sarin, M. M., and Pande, K. (2005). Chemical weathering in the Krishna Basin and Western Ghats of the Deccan Traps, India: rates of basalt weathering and their controls. Geochim. Cosmochim. Acta 69, 2067–2084. doi: 10.1016/j.gca.2004.10.014
Das, R., Das, S. N., and Misra, V. N. (2005). Chemical composition of rainwater and dustfall at Bhubaneswar in the east coast of India. Atmos. Environ. 39, 5908–5916. doi: 10.1016/j.atmosenv.2005.06.030
Datta, S., Thibault, Y., Fyfe, W. S., Powell, M. A., Hart, B. R., Martin, R. R., et al. (2002). Occurrence of trona in alkaline soils of the IndoGangetic plains of Uttar Pradesh (U.P.), India. Episod. J. Int. Geosci. 25, 236–239. doi: 10.18814/epiiugs/2002/v25i4/003
Dessert, C., Dupré, B., François, L. M., Schott, J., Gaillardet, J., Chakrapani, G., et al. (2001). Erosion of deccan traps determined by river geochemistry: impact on the global climate and the 87 Sr/86 Sr ratio of seawater. Earth Planet. Sci. Lett. 188, 459–474. doi: 10.1016/S0012-821X(01)00317-X
Dessert, C., Dupré, B., Gaillardet, J., François, L. M., and Allègre, C. J. (2003). Basalt weathering laws and the impact of basalt weathering on the global carbon cycle. Chem. Geol. 202, 257–273. doi: 10.1016/j.chemgeo.2002.10.001
Edmond, J. M., Palmer, M. R., Measures, C. I., Grant, B., and Stallard, R. F. (1995). The fluvial geochemistry and denudation rate of the Guayana Shield in Venezuela, Colombia, and Brazil. Geochim. Cosmochim. Acta 59, 3301–3325. doi: 10.1016/0016-7037(95)00128-M
Gaillardet, J., Dupré, B., and Allègre, C. J. (1999a). Geochemistry of large river suspended sediments: silicate weathering or recycling tracer? Geochim. Cosmochim. Acta 63, 4037–4051. doi: 10.1016/S0016-7037(99)00307-5
Gaillardet, J., Dupre, B., Allegre, C. J., and Négrel, P. (1997). Chemical and physical denudation in the Amazon river basin. Chem. Geol. 142, 141–173. doi: 10.1016/S0009-2541(97)00074-0
Gaillardet, J., Dupré, B., Louvat, P., and Allègre, C. J. (1999b). Global silicate weathering and CO2 consumption rates deduced from the chemistry of large rivers. Chem. Geol. 159, 3–30. doi: 10.1016/S0009-2541(99)00031-5
Galy, A., and France-Lanord, C. (1999). Weathering processes in the ganges–Brahmaputra basin and the riverine alkalinity budget. Chem. Geol. 159, 31–60. doi: 10.1016/S0009-2541(99)00033-9
George, B. G., Ray, J. S., and Kumar, S. (2019). Geochemistry of carbonate formations of the Chhattisgarh Supergroup, central India: implications for mesoproterozoic global events1. Can. J. Earth Sci. 56, 201–208. doi: 10.1139/cjes-2018-0144
Gibbs, R. J. (1970). Mechanisms controlling world water chemistry. Science 170, 1088–1090. doi: 10.1126/science.170.3962.1088
India-WRIS (2019). What is India-WRIS. Available online at: https://indiawris.gov.in/wris/#/ (accessed December 2, 2019).
Jha, P. K., Tiwari, J., Singh, U. K., Kumar, M., and Subramanian, V. (2009). Chemical weathering and associated CO2 consumption in the Godavari river basin, India. Chem. Geol. 264, 364–374. doi: 10.1016/j.chemgeo.2009.03.025
Konhauser, K. O., Powell, M. A., Fyfe, W. S., Longstaffe, F. J., and Tripathy, S. (1997). Trace element chemistry of major rivers in Orissa State, India. Environ. Geol. 29, 132–141. doi: 10.1007/s002540050111
Krishnaswami, S., Trivedi, J. R., Sarin, M. M., Ramesh, R., and Sharma, K. K. (1992). Strontium isotopes and rubidium in the Ganga-Brahmaputra river system: Weathering in the Himalaya, fluxes to the Bay of Bengal and contributions to the evolution of oceanic87Sr/86Sr. Earth Planet Sci. Lett. 109, 243–253. doi: 10.1016/0012-821X(92)90087-C
Kump, L. R., Brantley, S. L., and Arthur, M. A. (2000). Chemical weathering, atmospheric CO2, and climate. Annu. Rev. Earth Planet. Sci. 28, 611–667. doi: 10.1146/annurev.earth.28.1.611
Meunier, J. D., Riotte, J., Braun, J. J., Sekhar, M., Chalié, F., Barboni, D., et al. (2015). Controls of DSi in streams and reservoirs along the Kaveri River, South India. Sci. Total Environ. 502, 103–113. doi: 10.1016/j.scitotenv.2014.07.107
Meybeck, M. (1986). Composition chimique des ruisseaux non pollués en France. Chemical composition of headwater streams in France. Sci. Géol. Bull. Mém. 39, 3–77. doi: 10.3406/sgeol.1986.1719
Meybeck, M. (1987). Global chemical weathering of surficial rocks estimated from river dissolved loads. Am. J. Sci. 287, 401–428. doi: 10.2475/ajs.287.5.401
Millot, R., Gaillardet, J., Dupré, B., and Allègre, C. J. (2003). Northern latitude chemical weathering rates: clues from the Mackenzie River Basin, Canada. Geochim. Cosmochim. Acta 67, 1305–1329. doi: 10.1016/S0016-7037(02)01207-3
Mohanty, S. P. (2002). “Proterozoic granites of Orissa: a compilation,” in Proterozoic Granites and Crustal Evolution (Jaipur). Available online at: https://www.researchgate.net/publication/331895910_Proterozoic_granites_of_Orissa_a_compilation (Accessed March 13, 2020).
Moon, S., Chamberlain, C. P., and Hilley, G. E. (2014). New estimates of silicate weathering rates and their uncertainties in global rivers. Geochim. Cosmochim. Acta 134, 257–274. doi: 10.1016/j.gca.2014.02.033
Moon, S., Huh, Y., Qin, J., and van Pho, N. (2007). Chemical weathering in the Hong (Red) River basin: rates of silicate weathering and their controlling factors. Geochim. Cosmochim. Acta 71, 1411–1430. doi: 10.1016/j.gca.2006.12.004
Murnane, R. J., and Stallard, R. F. (1990). Germanium and silicon in rivers of the Orinoco drainage basin. Nature 344, 749–752. doi: 10.1038/344749a0
Négrel, P., Allègre, C. J., Dupré, B., and Lewin, E. (1993). Erosion sources determined by inversion of major and trace element ratios and strontium isotopic ratios in river water: the congo basin case. Earth Planet. Sci. Lett. 120, 59–76. doi: 10.1016/0012-821X(93)90023-3
Oliva, P., Dupré, B., Martin, F., and Viers, J. (2004). The role of trace minerals in chemical weathering in a high-elevation granitic watershed (Estibère, France): chemical and mineralogical evidence. Geochim. Cosmochim. Acta 68, 2223–2243. doi: 10.1016/j.gca.2003.10.043
Pacheco, F., and van der Weijden, C. H. (1996). Contributions of water-rock interactions to the composition of groundwater in areas with a sizeable anthropogenic input: a case study of the waters of the fundão area, central Portugal. Water Resour. Res. 32, 3553–3570. doi: 10.1029/96WR01683
Panigrahy, B. K., and Raymahashay, B. C. (2005). River water quality in weathered limestone: a case study in upper Mahanadi basin, India. J. Earth Syst. Sci. 114, 533–543. doi: 10.1007/BF02702029
Parkhurst, D. L., and Appelo, C. A. J. (2013). Description of Input and Examples for PHREEQC Version 3-A Computer Program for Speciation, Batch-Reaction, One-Dimensional Transport, and Inverse Geochemical Calculations. New York, NY: U.S. Geological Survey Techniques and Methods. p. 497. Available online at: https://pubs.usgs.gov/tm/06/a43/
Pattanaik, J. K., Balakrishnan, S., Bhutani, R., and Singh, P. (2013). Estimation of weathering rates and CO2 drawdown based on solute load: significance of granulites and gneisses dominated weathering in the Kaveri river basin, Southern India. Geochim. Cosmochim. Acta 121, 611–636. doi: 10.1016/j.gca.2013.08.002
Quade, J., English, N., and DeCelles, P. G. (2003). Silicate versus carbonate weathering in the Himalaya: a comparison of the Arun and Seti river watersheds. Chem. Geol. 202, 275–296. doi: 10.1016/j.chemgeo.2002.05.002
Radhakrishna, I. (2001). Saline fresh water interface structure in Mahanadi delta region, Orissa, India. Environ. Geol. 40, 369–380. doi: 10.1007/s002540000182
Rai, S. K., Singh, S. K., and Krishnaswami, S. (2010). Chemical weathering in the plain and peninsular sub-basins of the Ganga: Impact on major ion chemistry and elemental fluxes. Geochimica et Cosmochimica Acta 74, 2340–2355. doi: 10.1016/j.gca.2010.01.008
Richter, F. M., Rowley, D. B., and DePaolo, D. J. (1992). Sr isotope evolution of seawater: the role of tectonics. Earth Planet Sci. Lett. 109, 11–23. doi: 10.1016/0012-821X(92)90070-C
Roy, S., Gaillardet, J., and Allègre, C. J. (1999). Geochemistry of dissolved and suspended loads of the Seine river, France: anthropogenic impact, carbonate and silicate weathering. Geochim. Cosmochim. Acta 63, 1277–1292. doi: 10.1016/S0016-7037(99)00099-X
Stallard, R. F., and Edmond, J. M. (1983). Geochemistry of the Amazon: 2. The influence of geology and weathering environment on the dissolved load. J. Geophys. Res. Oceans 88, 9671–9688. doi: 10.1029/JC088iC14p09671
Sundaray, S. K., Nayak, B. B., and Bhatta, D. (2009). Environmental studies on river water quality with reference to suitability for agricultural purposes: Mahanadi river estuarine system, India – a case study. Environ. Monit. Assess. 155, 227–243. doi: 10.1007/s10661-008-0431-2
Sundaray, S. K., Nayak, B. B., Kanungo, T. K., and Bhatta, D. (2012). Dynamics and quantification of dissolved heavy metals in the Mahanadi river estuarine system, India. Environ. Monit. Assess. 184, 1157–1179. doi: 10.1007/s10661-011-2030-x
Sundaray, S. K., Panda, U. C., Nayak, B. B., and Bhatta, D. (2006). Multivariate statistical techniques for the evaluation of spatial and temporal variations in water quality of the Mahanadi river–estuarine system (India) – a case study. Environ. Geochem. Health 28, 317–330. doi: 10.1007/s10653-005-9001-5
Tardy, Y. (1971). Characterization of the principal weathering types by the geochemistry of waters from some European and African crystalline massifs. Chem. Geol. 7, 253–271. doi: 10.1016/0009-2541(71)90011-8
Thomsen, E., and Andreasen, R. (2019). Agricultural lime disturbs natural strontium isotope variations: implications for provenance and migration studies. Sci. Adv. 5, eaav8083. doi: 10.1126/sciadv.aav8083
Tripathy, G. R., and Singh, S. K. (2010). Chemical erosion rates of river basins of the Ganga system in the Himalaya: reanalysis based on inversion of dissolved major ions, Sr, and 87 Sr/ 86 Sr: chemical erosion in ganga headwaters. Geochem. Geophys. Geosyst. 11, Q03013. doi: 10.1029/2009GC002862
Trivedi, J. R., Pande, K., Krishnaswami, S., and Sarin, M. M. (1995). Sr isotopes in rivers of India and Pakistan: a reconnaissance study. Curr. Sci. 69, 171–178.
Viers, J., Dupre, B., Braun, J.-J., Deberdt, S., Angeletti, B., Ngoupayou, J. N., et al. (2000). Major and trace element abundances, and strontium isotopes in the Nyong basin rivers ŽCameroon/ : constraints on chemical weathering processes and elements transport mechanisms in humid tropical environments. Chem. Geol. 169, 211–241. doi: 10.1016/S0009-2541(00)00298-9
Viers, J., Dupre, B., Braun, J.-J., Greenberg, S., Ngoupayou, J. N., and Nkamdjou, L. S. (2001). Evidence for non-conservative behaviour of chlorine in humid tropical environments. Aquat. Geochem. 7, 127–154. doi: 10.1023/A:1017930106507
Wu, L., Huh, Y., Qin, J., Du, G., and van Der Lee, S. (2005). Chemical weathering in the Upper Huang He (Yellow River) draining the eastern Qinghai-Tibet Plateau. Geochim. Cosmochim. Acta 69, 5279–5294. doi: 10.1016/j.gca.2005.07.001
Wu, W., Xu, S., Yang, J., and Yin, H. (2008). Silicate weathering and CO2 consumption deduced from the seven Chinese rivers originating in the Qinghai-Tibet Plateau. Chem. Geol. 249, 307–320. doi: 10.1016/j.chemgeo.2008.01.025
Zhang, X., Xu, Z., Liu, W., Moon, S., Zhao, T., Zhou, X., et al. (2019). Hydro-Geochemical and Sr isotope characteristics of the Yalong river basin, eastern tibetan plateau: implications for chemical weathering and controlling factors. Geochem. Geophys. Geosyst. 20, 1221–1239. doi: 10.1029/2018GC007769
Keywords: Mahanadi River, groundwater, Sr isotope, anthropogenic sources, fertilizer, seasonal variation
Citation: Acharya SS, Hishamunda V and Chakrabarti R (2022) Natural Sources and Anthropogenic Influences on the River Water and Groundwater Chemistry of the Lower Mahanadi Basin: Insights From Radiogenic Sr Isotopes and Major Ion Chemistry. Front. Water 4:846438. doi: 10.3389/frwa.2022.846438
Received: 31 December 2021; Accepted: 25 February 2022;
Published: 19 April 2022.
Edited by:
Soumendra Nath Bhanja, Oak Ridge National Laboratory (DOE), United StatesReviewed by:
K. Sreelash, National Centre for Earth Science Studies, IndiaH. M. Zakir Hossain, Jashore University of Science and Technology, Bangladesh
Copyright © 2022 Acharya, Hishamunda and Chakrabarti. This is an open-access article distributed under the terms of the Creative Commons Attribution License (CC BY). The use, distribution or reproduction in other forums is permitted, provided the original author(s) and the copyright owner(s) are credited and that the original publication in this journal is cited, in accordance with accepted academic practice. No use, distribution or reproduction is permitted which does not comply with these terms.
*Correspondence: Shiba Shankar Acharya, c2hpYmEuZ2VvbG9neUBnbWFpbC5jb20=; c2hpYmEuZ2VvbEBwcmVzaXVuaXYuYWMuaW4=
†Present addresses: Shiba Shankar Acharya, Department of Geology, Presidency University, Kolkata, India
Valens Hishamunda, Water Resources Sciences and Technology, Texas A&M University, San Antonio, TX, United States