
95% of researchers rate our articles as excellent or good
Learn more about the work of our research integrity team to safeguard the quality of each article we publish.
Find out more
ORIGINAL RESEARCH article
Front. Water , 19 May 2022
Sec. Environmental Water Quality
Volume 4 - 2022 | https://doi.org/10.3389/frwa.2022.841144
This article is part of the Research Topic Current Challenges to Characterizing the Fate and Transport of Environmental Contaminants in Water Systems View all 4 articles
 Ravindra Dwivedi1*
 Christopher Eastoe2John F. Knowles3Jennifer McIntosh1Thomas Meixner1Paul A. Ty Ferre1Rebecca Minor4Greg Barron-Gafford5,6Nathan Abramson1Michael Stanley7Jon Chorover8
Current understanding of the dynamic and slow flow paths that support streamflow in mountain headwater catchments is inhibited by the lack of long-term hydrogeochemical data and the frequent use of short residence time age tracers. To address this, the current study combined the traditional mean transit time and the state-of-the-art fraction of young water (Fyw) metrics with stable water isotopes and tritium tracers to characterize the dynamic and slow flow paths at Marshall Gulch, a sub-humid headwater catchment in the Santa Catalina Mountains, Arizona, USA. The results show that Fyw varied significantly with period when using sinusoidal curve fitting methods (e.g., iteratively re-weighted least squares or IRLS), but not when using the transit time distribution (TTD)-based method. Therefore, Fyw estimates from TTD-based methods may be particularly useful for intercomparison of dynamic flow behavior between catchments. However, the utility of 3H to determine Fyw in deeper groundwater was limited due to both data quality and inconsistent seasonal cyclicity of the precipitation 3H time series data. Although a Gamma-type TTD was appropriate to characterize deep groundwater, there were large uncertainties in the estimated Gamma TTD shape parameter arising from the short record length of 3H in deep groundwater. This work demonstrates how co-application of multiple metrics and tracers can yield a more complete understanding of the dynamic and slow flow paths and observable deep groundwater storage volumes that contribute to streamflow in mountain headwater catchments.
Globally, mountain headwater catchments are critical sources of water to downstream valley-fill aquifers (Viviroli et al., 2003, 2007; Kohler and Marselli, 2009; Harpold et al., 2012; Carroll et al., 2019; Milly and Dunne, 2020; Bryan, 2021; Eppolito and Fonseca, 2021). Consequently, accurate characterization of the dynamic and slow flow components of streamflow is needed to more thoroughly understand and predict water quantity and quality derived from these headwater catchments. The current study couples the transit time distribution (TTD)-based mean transit time (mTT) metric and the state-of-the-art fraction of young water (Fyw) metric to stable water isotopes and tritium tracers in order to address this challenge.
Deep groundwater is a critical component of catchment hydrology because it supports baseflow under dry conditions. However, the contribution of deep groundwater is hard to determine using stable water isotope data alone. Therefore, the literature on tracing old groundwater suggests using tritium as a tracer (Stewart et al., 2010, 2012). This recommendation is corroborated by previous work indicating that mTTs based on stable water isotopes alone may be underestimated because the TTDs have tails that correspond to longer transit times that can become truncated (DeWalle et al., 1997; Stewart et al., 2010, 2012; Frisbee et al., 2013). Additionally, certain model performance criteria (e.g., Nash-Sutcliffe Efficiency) that are used to evaluate TTDs based on stable water isotope data can become insensitive to longer transit times (Seeger and Weiler, 2014).
The Fyw is defined as the fraction of water younger than a certain threshold age. Stable water isotope data and synthetic numerical models suggest that the dynamic nature of flowpaths and the hydrogeochemical behavior of a catchment can be more accurately characterized by the Fyw metric than by the mTT (Kirchner, 2016a,b). Principal reasons for this include significant spatiotemporal aggregation errors associated with mTT estimates from heterogeneous catchments, and the fact that the Fyw metric is largely insensitive to spatial and temporal aggregation errors when evaluated for annual tracer cycles in inflow and outflow. Given the scarcity of long duration tracer time series data, Fyw-based work typically fits annual or seasonal sinusoidal cycles to catchment tracer data (Jasechko, 2016, Stockinger et al., 2016, 2019; Jasechko et al., 2017; Clow et al., 2018; Jacobs et al., 2018; von Freyberg et al., 2018; Gallart et al., 2020) such that it remains unknown how Fyw may vary with period in either tracer concentrations or tracer flux cycles. However, at basin-floor elevation in the Tucson Basin watershed, Arizona, which includes the present study area, the time series of water isotopes in precipitation spans four decades, and the seasonal tritium time series spans two decades. In both cases, annual and multi-annual cycles are present (Eastoe et al., 2012; Eastoe and Dettman, 2016; Supplementary Figure 1), and similar patterns, adjusted for altitude, are likely in the surrounding mountains. If Fyw varies significantly with period without an identifiable trend, both intercomparison of Fyw estimates and differences in the dynamic nature of flow paths between catchments will be affected, even when using the same method (e.g., sinusoidal curve fitting) (see also Stockinger et al., 2019). Therefore, examination of the dependence of Fyw on period for a study area with long-term tracer time series data represents an opportunity to gain transferrable information about hydrological cycling in mountain headwater catchments.
At Marshall Gulch, Arizona, USA, previous work has reported TTDs and mTTs from high-density stable water isotope data (Heidbüchel et al., 2012; Dwivedi et al., 2021) and tritium-based transit times based on the implicit, a priori assumption of a piston-flow type TTD (Dwivedi et al., 2019a). To compliment this work and provide new insight into the nature of dynamic and slow flow paths, the current study presents an original evaluation of TTD type based on tritium data at Marshall Gulch (MGC). We specifically considered the following questions: (i) What is the appropriate TTD type and mTT for characterization of deep groundwater at MGC? (ii) How does Fyw vary with period when using stable water isotope data? And (iii), how does Fyw vary with period when using tritium data? We rely on previously collected stable water isotope data in precipitation and streamflow and tritium data collected from streamflow under low flow conditions and from deep groundwater at MGC to address these questions. The tritium-based TTD and mTT are estimated by objectively evaluating various TTD types with set criteria, whereas the Fyw estimates are generated from stable water isotope data using both the sinusoidal curve fitting method for periods ranging from 2 days to 5 years and an alternative method that used TTD type and parameters from a previous study (Dwivedi et al., 2021). The tritium-based Fyw was estimated using the TTD-based method only.
Marshall Gulch (MGC) is a 1.55 km2 headwater catchment located within the Santa Catalina Mountains ~26 km northeast of Tucson in southeast Arizona, USA (Figure 1). The elevation at MGC ranges from 2,285 to 2,632 m above sea level (asl) with a mean of 2,428 m asl and a mean topographic slope of 22° (or ~40%). Bedrock at the field site is mostly granite at upper elevations and micaceous schist at lower elevations (Dickinson et al., 2002). The prevailing soil texture is sandy loam (Holleran, 2013) with soil depth varying from 0 to 1.5 m (Pelletier and Rasmussen, 2009). Soils overlying micaceous schist are generally deeper and have a higher clay content than soils overlying granite (Heidbüchel et al., 2013; Holleran, 2013a). Based on a 30-year (1981–2010) record, the long-term average annual precipitation at MGC is 920 mm (PRISM Climate Group, 2018). The catchment received an average of 654 mm ± 158 mm (mean ± one standard deviation) of precipitation per year between water years (WY) 2008 through 2017; the mean annual streamflow for the same period was 247 mm ± 138 mm. WY n is defined here as the period from July 1 of year n-1 through June 30 of year n. Instrumentation relevant to this study (Figure 1) is described in detail in the following sections.
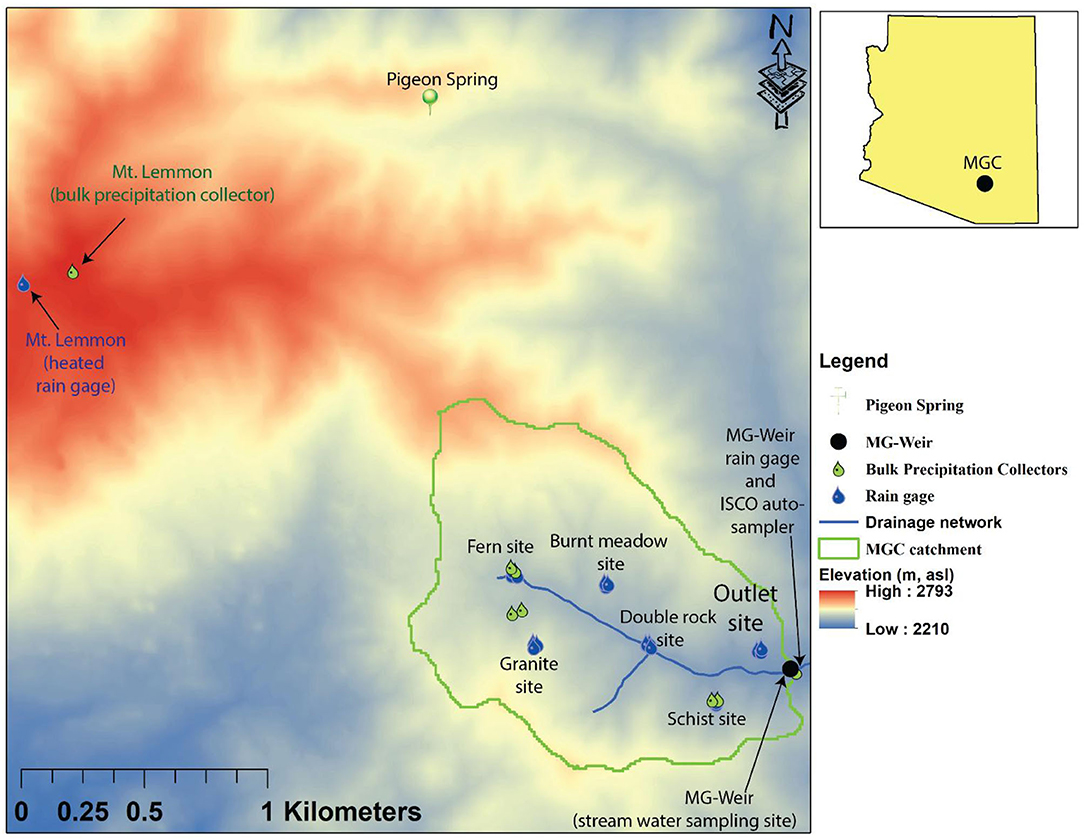
Figure 1. Marshall Gulch Catchment (MGC; the catchment boundary is shown in green), located within the Santa Catalina Mountains Critical Zone Observatory (SCM-CZO) in southeast Arizona, USA (inset map), and the precipitation, stream water, and deep groundwater collection sites used in this study. The source of the digital elevation model is U.S. Geological Survey (2021a) and the source for the drainage network data is U.S. Geological Survey (2021b).
The MGC-scale daily precipitation (P) and streamflow (Q) data were calculated between WY 2008 and 2017 (Figures 2A,B; Dwivedi et al., 2019b, 2021). Precipitation was observed at 15-min intervals at eight measurement sites equipped with tipping bucket precipitation gages at seven locations and a heated precipitation gage at the remaining site (Figure 1). From the precipitation time series, Thiessen polygon-derived weights were used to estimate daily catchment-scale mean precipitation (Dwivedi et al., 2019b). Streamflow was measured at 30-min intervals at the MG-Weir site (Figure 1) using a pressure transducer (HOBO by Onset U20-001-01; Onset Computer Corporation) with maximum error of 0.62 kPa and accuracy of 0.02 kPa, and a previously derived stage-discharge relationship (Heidbüchel et al., 2012).
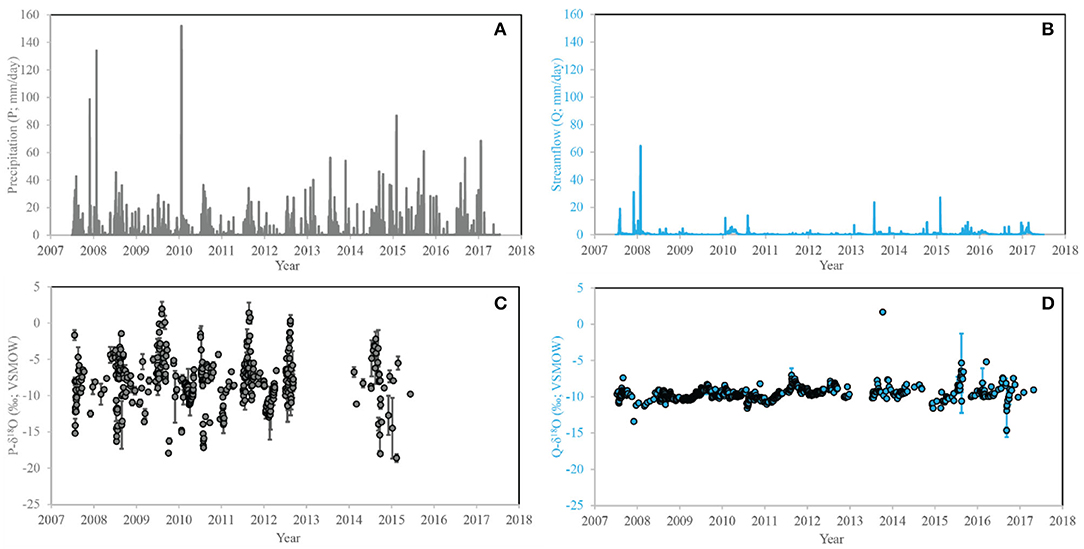
Figure 2. Timeseries plots of daily precipitation [P; (A)]; streamflow [Q; (B)]; δ18O in P (C) and Q (D) from water year (WY) 2008 through WY 2017. The error bars in (C,D) show one standard deviation.
The precipitation bulk samples at MGC were collected using: (i) bulk samplers at the Schist, Fern Valley, and Granite stations and (ii) autosamplers at the MG-Weir and Mt. Lemmon stations (Figure 1). At the Fern Valley, Granite, and Schist stations, two collectors were installed at each station and bulk samples were collected every 5–7 d (Lyon et al., 2009; Heidbüchel et al., 2012). Daily bulk precipitation samples were also collected from the Mt. Lemmon and MG-Weir stations (Figure 1). At the Mt. Lemmon station, sampling mainly focused on the summer monsoon season (Heidbüchel et al., 2012), whereas continuous samples were collected beginning in December 2009 at the MG-Weir station. At all stations, the data density decreased after 2012 due to logistical constraints (see Figure 2C). All samples were analyzed using a DLT-100 laser spectrometer, Los Gatos Research, Inc., model # 908-0008 with analytical precisions (1σ) of 0.37% for δ2H and 0.12% for δ18O, respectively (Lyon et al., 2009). The catchment-scale time series of δ18O in precipitation was calculated as the unweighted mean of results from all stations and was characterized by irregular time intervals between WY 2008 through WY 2012 (Heidbüchel et al., 2012; Dwivedi et al., 2021).
Stream water samples were collected using a Teledyne ISCO autosampler (model 6712c) installed at the MG-Weir site prior to 2012 and by grab sampling after 2012 [Figure 2D; see also Heidbüchel et al. (2012) for more details]. While the stream water autosampler collected daily samples, sub-daily samples were also collected on the rising and falling limbs of the hydrograph during large runoff events (Heidbüchel et al., 2012). In the current study, sub-daily samples are volume-weighted to daily resolution (Dwivedi et al., 2021).
We calculated the amount-weighted time series of Tritium (3H) in Tucson precipitation since 1992 using the following: (i) Eastoe et al. (2004), (ii) unpublished data of the Environmental Isotope Laboratory, The University of Arizona (access date: December 13, 2021); and (iii) C. Eastoe, unpublished data. At low levels of 3H concentration in precipitation, the data had a 1 standard deviation (σ) precision of ±0.5 TU (tritium units) or less. Annual concentration cycles in the 3H data were best captured by the post-2001 period in which semi-annual aggregates represent all precipitation events, and demonstrated a prominent 2–4 year cycle between 2001 and 2009 (Supplementary Figure 1). Between 1992 and 2001, the data represented only large precipitation events. Prior to 1992, mean annual 3H concentrations in Tucson precipitation were obtained using the Doney et al. (1992) model (gray points in Supplementary Figure 2A) as well as log-linearly interpolated values (orange points in Supplementary Figure 2A) between observed or modeled values to obtain amount-weighted precipitation 3H concentrations at the half-yearly time scale (Supplementary Figure 2A). All data were corrected for the elevation difference between the Tucson (747 m asl) and MGC (mean elevation 2,428 m asl) by using the 3H concentrations in three simultaneous precipitation samples (Supplementary Figure 2B) from Tucson and the Palisades Ranger Station (2,422 m asl), Santa Catalina Mountains. Amount-weighted precipitation 3H concentration time series data are shown in Figure 3 and Supplementary Figure 2C.
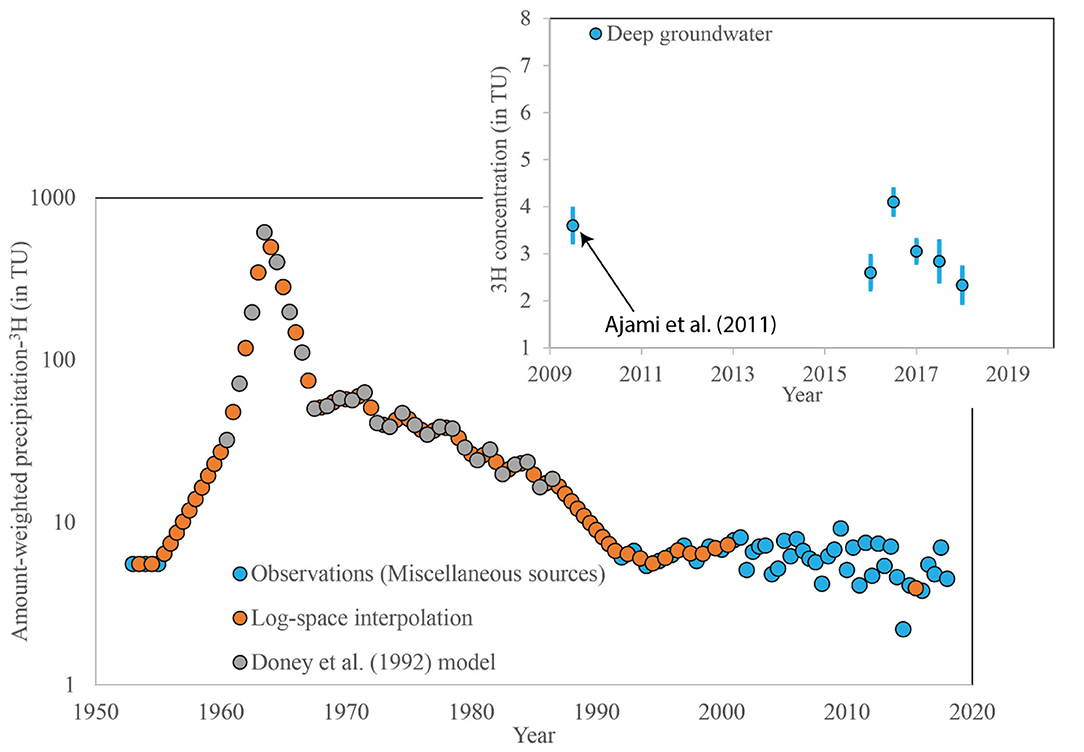
Figure 3. Amount-weighted 3H concentration in precipitation (data from Eastoe et al., 2004; Eastoe, unpublished data; Supplementary Figure 2; The Environmental Isotope Laboratory, The University of Arizona), and 3H concentrations in deep groundwater (blue points; a combination of MG-Weir site and Pigeon Spring; see Figure 1 for their locations). Different colored points in the base plot show data sources (see also Supplementary Figure 2).
The 3H time series data for deep groundwater, i.e., the groundwater residing in the fractured bedrock aquifer at MGC, was assembled from observations in streamflow (baseflow conditions; n = 9) and groundwater from Pigeon Spring (n = 5; Supplementary Table 1 and Figure 3 inset). The five discharge measurements from Pigeon Spring (Figure 1) were considered representative of deep groundwater (Dwivedi et al., 2019a). Data are grouped into half-yearly brackets using the following criteria: (i) sampling months 6–10 of year n, and (ii) sampling months 11 of year n-1 to 5 of year n. For groups with three or more measurements, the data are expressed as a mean ± 1σ (Figure 3 inset).
In this study, stable water isotope-based TTD and mTT estimates are based on our previous work (Dwivedi et al., 2021) that estimated TTD and mTT from long-term stable water isotope data in precipitation and streamflow. Using wavelet analysis of tracer flux (i.e., a product of tracer concentration and hydrologic flux for precipitation and stream water), TTD and mTT values were obtained from objectively evaluating the following TTD types: Exponential (Exp), Gamma (Gam), Fixed-path one-dimensional advection-dispersion model [ADE-1x; Maloszewski and Zuber (1982)], Multiple-paths advection-dispersion model [ADE-nx; Kirchner et al. (2001)], and Piston flow (PF). More details are provided in Dwivedi et al. (2021).
The 3H time series data were used in conjunction with the Stewart et al. (2017) method, i.e., Equation (1) of their work, to estimate the mTT and best fitting TTD for deep groundwater. Previous work at MGC determined that deep groundwater was recharged at a time scale of 0.5 years or less (Ajami et al., 2011; Dwivedi et al., 2019a). Because the half-life of 3H is 12.32 years (Lucas and Unterweger, 2000), decay of 3H during recharge was insignificant relative to analytical precision (± 0.5 TU). Therefore, the 3H time series in precipitation was used as the 3H time series in recharge to deep groundwater (Figure 3).
The TTD types evaluated using 3H data had the following fitting parameters: Exp- mTT; Gam- shape parameter (α) and mTT; ADE-1x- Péclet number (Pe) and mTT; ADE-nx- Péclet number (Pe) and mTT; and PF- mTT. The following ranges of TTD model parameters were considered: mTT: 1–50 years when using tritium, which serves as a groundwater age tracer at a time scale of 1–50 years (Aggarwal, 2013; Suckow, 2014; Gleeson et al., 2015); shape parameter (α) for the Gamma TTD: 0.1–15 (Stewart et al., 2017); average catchment-scale Péclet number (Pe): 0.1–100 (Kirchner et al., 2001; Kirchner and Neal, 2013). When evaluating TTD types, the Downhill Simplex method (Nelder and Mead, 1965; Gupta, 2016) was used to search for optimal model parameters and the modified Kling Gupta efficiency or KGE' (Gupta et al., 2009; Kling et al., 2012) was used as the model performance criterion. A perfectly fitting model will have a KGE' value of zero and the worst fitting model will have a KGE' value of ∞. Following Godsey et al. (2010), the KGE' criterion was estimated in a log-transformed space. Both KGE' and the characteristics of the criterion response surface were utilized to search for the optimum model parameters (Dwivedi et al., 2021). Furthermore, additional tests were also conducted to constrain how uncertainty in amount-weighted precipitation and stream water 3H concentrations affected both TTD types and its parameters. In these tests, various combinations of uncertainty in amount-weighted precipitation and stream water 3H concentrations were considered with respect to their means (μ) ± one standard deviation (σ) (see Figure 3), i.e., μ-σ, μ, and μ + σ were specifically related to three possible cases of deep groundwater 3H concentration uncertainty (Supplementary Table 2). Subsequently, both TTD type and TTD parameters were objectively estimated using the previously mentioned TTD types. The same allowable parameter space for all model parameters was used to evaluate the most suitable TTD type and parameters.
Fyw can be estimated from the amplitude ratio of tracer concentrations in outflow and inflow for any tracer (Kirchner, 2016a; von Freyberg et al., 2018). Thus, if the amplitudes of the tracer concentrations in outflow and inflow for period λ are AQ(λ) and AP(λ), respectively, then:
This method is preferred when sufficient long-term tracer data are available and can be applied without a priori knowledge of the TTD type (Kirchner, 2016a). However, if a TTD h(τ) is known, Fyw can also be estimated using Equation (2), in which Tyw is the threshold age for young water, defined as the upper limit in Equation (2) for which both Equations (1) and (2) provide equivalent values of Fyw(λ):
For a Gamma type TTD, Equation (2) can be simplified to Equation (3) where β is defined as the ratio of mTT (y) to the shape parameter (α, unitless), κ is the decay constant for a tracer [loge(2)/half-life; 0 for stable water isotope and 0.056 yr−1 for 3H], and ω is defined as 2 π/λ:
In this study, δ18O-based Fyw calculations were based on tracer fluxes in precipitation and streamflow, whereas the 3H-based Fyw estimates were based on tracer concentrations in recharging and discharging deep groundwater. For consistency with the literature, we express tracer flux-based fraction of young water values as and tracer concentration-based fraction of young water values as Fyw.
The Fyw or are typically estimated by fitting sinusoidal curves to long-term tracer data in precipitation and streamflow (e.g., Jasechko, 2016; von Freyberg et al., 2018). In the current study, stable water isotope-based was specifically estimated using the iteratively re-weighted least squares (IRLS) method that determines tracer cycle amplitude by fitting sinusoidal functions to tracer flux data in precipitation and streamflow (Equation 1; Kirchner, 2016a; von Freyberg et al., 2018), and the TTD method (Equation 3). The tracer flux is the product of tracer concentration and hydrologic flux, and daily precipitation (aggregated into time intervals corresponding to the availability of isotope data in precipitation) and streamflow data are used to calculate the fraction of precipitation contributing to streamflow. The IRLS method was specifically applied to estimate for periods ranging from 2 days to 5 years.
The 3H tracer data in precipitation and deep groundwater at MGC were sparse relative to δ18O, especially for deep groundwater (Figure 3). As a result, application of sinusoidal curve fitting methods such as IRLS to deep groundwater 3H data was unsatisfactory i.e., fitting a sinusoidal function to the data resulted in significant amplitude uncertainty at a period of 1 year. Therefore, the 3H Fyw estimates were based on the TTD method (Equations 2 and 3 above).
When using stable water isotope data, the temporal variability of δ18O in precipitation was addressed by means of uncertainty analyses where the temporal variability of δ18O was expressed as three statistics: daily mean, mean + 1σ, and mean −1σ calculated for both precipitation (P) and stream water (Q); consideration of all pair combinations resulted in nine scenarios. For each period, the minimum, mean (referred to as the ensemble mean below), maximum, and 1σ of the results were computed for all nine scenarios. Finally, the ensemble means for Fyw estimates from 3H data were calculated similarly, using mean, mean + 1σ, and mean −1σ of the Gamma TTD parameters α and mTT.
Piston-flow (PF) and Gamma (Gam) TTD types performed adequately and yielded TTD parameters within permissible parameter spaces (Table 1, Figure 4), whereas the other TTD types (Exp, ADE-1x, ADE-nx) did not. In addition, the response surfaces for certain TTD types were found to be rough (e.g., Figure 4E), and therefore, the model parameters for each TTD type were estimated from three separate model runs (Figure 4 and Supplementary Table 3). The model performance expressed in terms of KGE' was slightly better for the PF relative to the Gam TTD type (PF KGE' was 29% lower). Comparison of the PF and Gam TTDs further suggested “approximate equifinality” (Kirchner, 2016b) in the PF TTD results (Figures 4B–E For example, three separate PF TTD model runs yielded mTTs of 32.5, 29.5, and 35.5 years (Figure 4E; Case 5 in Supplementary Table 3) with very similar KGE' values (~0.4; Case 5 in Supplementary Table 3). In contrast, three separate Gam TTD runs yielded similar mTTs (mTT ~ 26 years; minimum: 25.9 years and maximum: 30.4 years) and α parameters (5.23; minimum: 2.2 and maximum: 14.6). Overall, the PF mTT varied between 4 and 33 years with a coefficient of variation of 0.57 (Table 1). The Gam mTT and α parameters varied between 26 and 30 years (mean = 27 years; coefficient of variation = 0.05) and 2.17 to 14.58 (unitless) (mean = 6.53; coefficient of variation = 0.64), respectively.
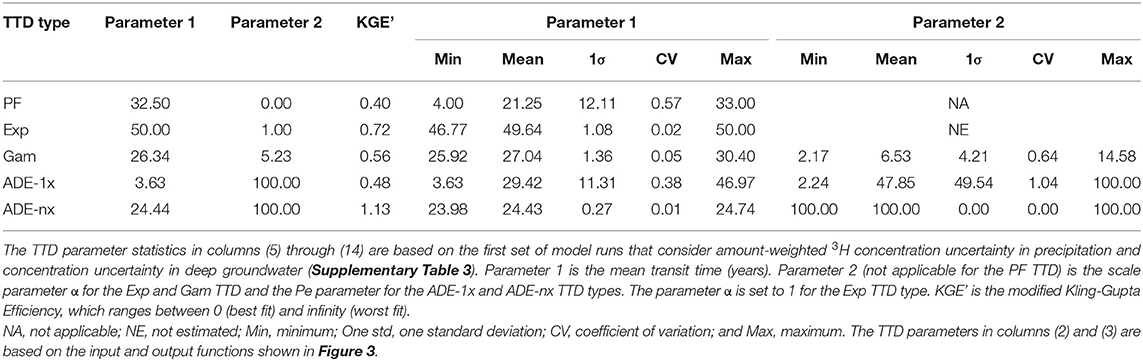
Table 1. Estimated TTD parameters for various TTD types.
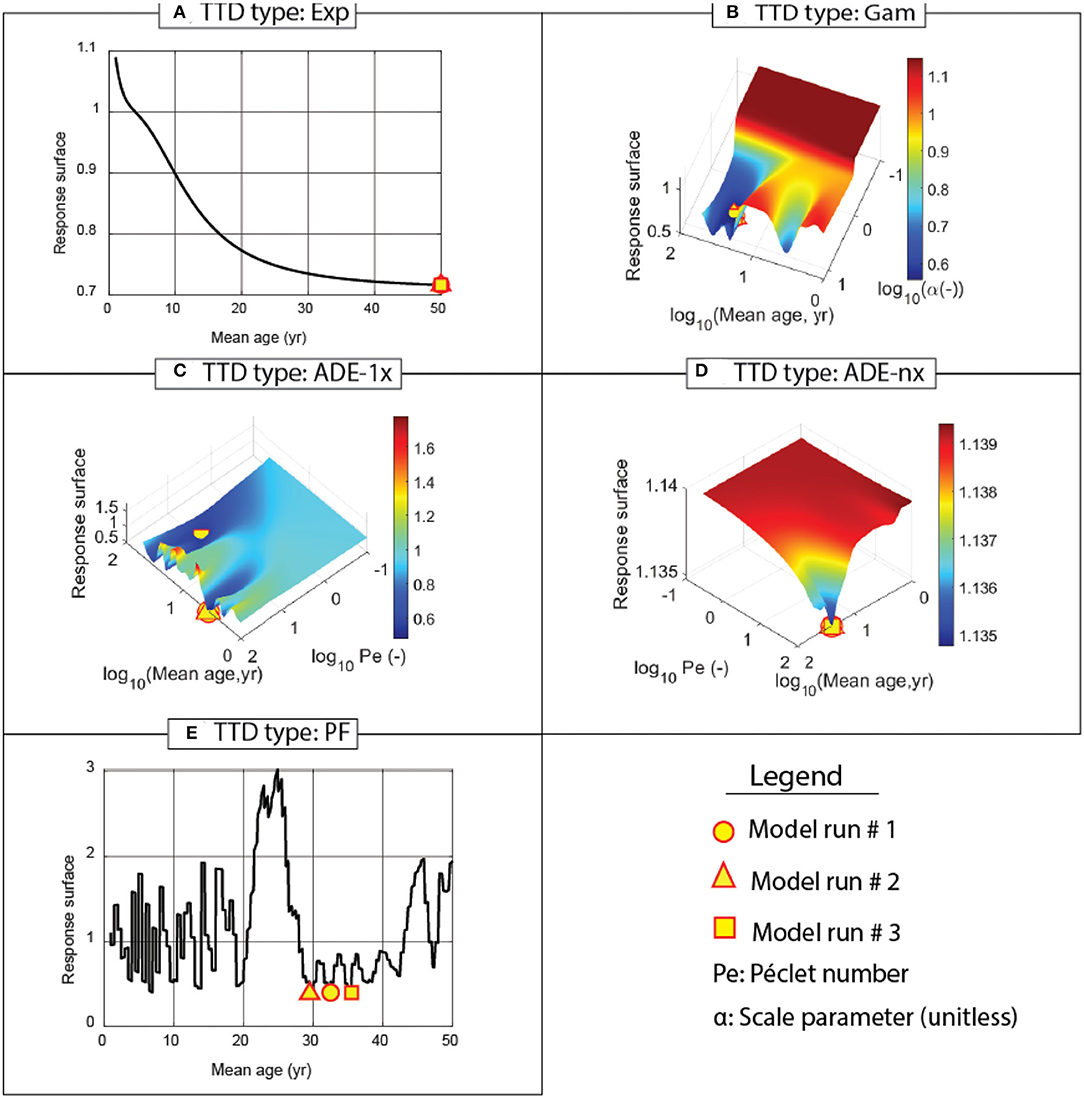
Figure 4. Response surfaces—defined as the natural log of KGE' as a function of TTD model parameters- for various TTD types using 3H concentrations in precipitation and deep groundwater (Figure 3). Results for the three separate model runs are shown as different symbols. Note that Supplementary Figure 3 through Supplementary Figure 7 in supporting information provide a zoomed-in view of the response surface for each TTD type as a separate figure. (A) TTD type: Exp, (B) TTD type: Gam, (C) TTD type: ADE-1x, (D) TTD type: ADE-1x, and (E) TTD type: PF.
Modeled 3H concentrations in deep groundwater were generally within their observed ranges, and remained within 1σ of their simulated means for both PF and Gam TTDs, but modeled 3H concentration variability was lower for the Gam TTD (Figure 5). The error bars in Figure 5 were determined by considering the analytical uncertainty in 3H concentrations and were based on the first set of model runs. Although the ADE-1x TTD-based model produced 3H concentrations that were within their observed ranges, the estimated TTD parameters were sometimes at the edge of the allowable parameter space (section 3H-Based TTD Type and mTT); simulated 3H concentrations from the ADE-nx TTD-based model were far from observed concentrations and indicated that this TTD type is not applicable at MGC.
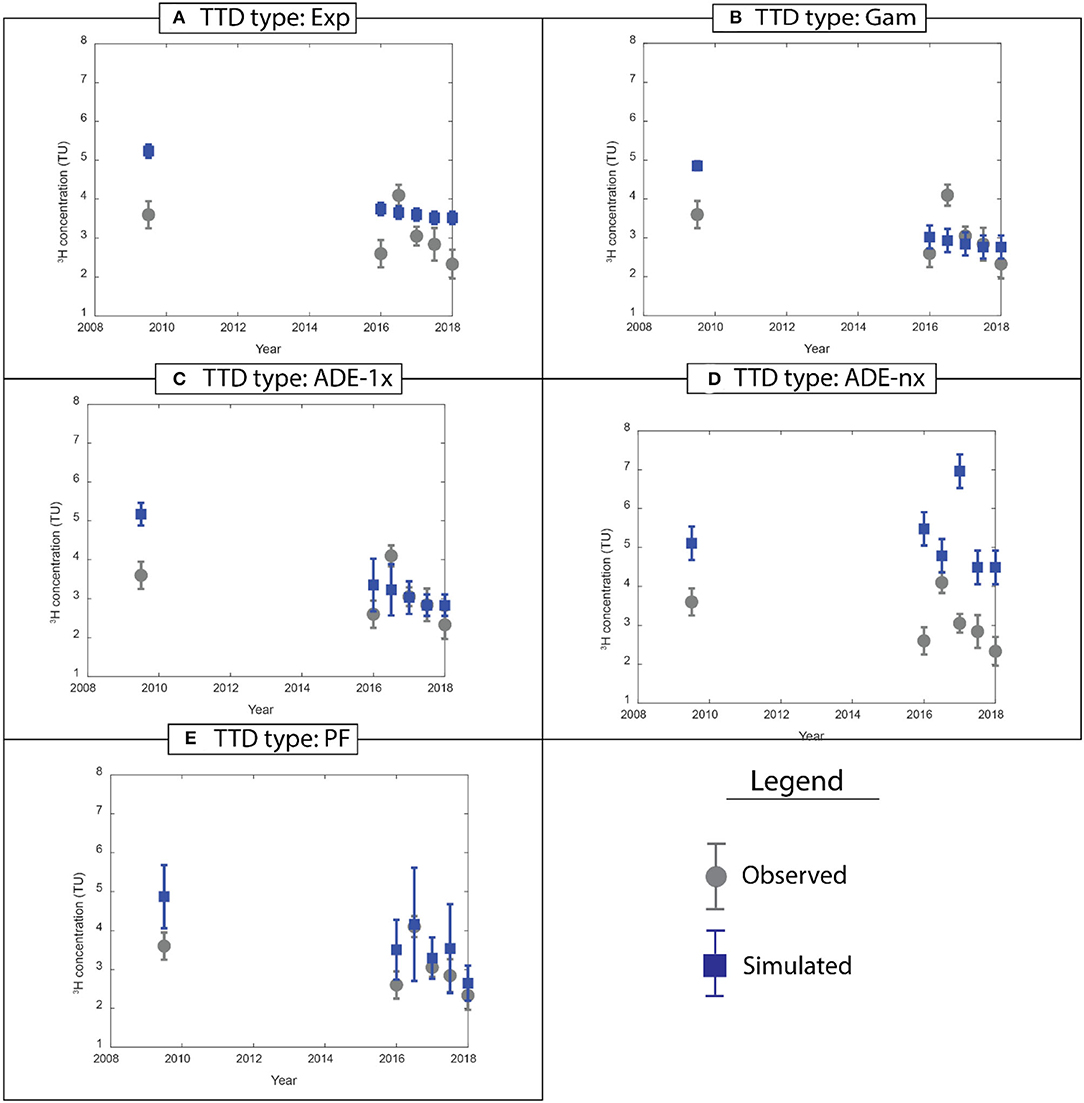
Figure 5. Observed (gray points) and modeled (blue points) 3H concentrations in deep groundwater for (A) Exp, (B) Gam, (C) ADE-1x, (D) ADE-nx, and (E) PF TTD types. Error bars for the modeled concentrations represent one standard deviation of all the modeled concentrations for the first model run (i.e., run #1 in Supplementary Table 3), based on uncertainty in amount-weighted 3H concentrations in precipitation and deep groundwater.
Considering variability due to δ18O variability in precipitation and stream water, the IRLS method yielded highly variable results, particularly for periods of <1 year (Figure 6A). For a seasonal tracer cycle, i.e., period = 0.5 years, the estimate was 52 ± 2.1 % (mean ± one standard deviation). However, for periods close to 0.5 years, estimates were 17 ± 0.3 % (for λ = 0.45 years) and ~99% (for λ = 0.56 years), respectively. Similarly, for the annual tracer cycle, the estimate was 11 ± 0.7 %, but for periods close to 1 year, estimates were 22 ± 1.3% (λ = 0.83 years) and 99 ± 0.6% (λ = 1.25 years). Note that the field site experiences two dominant wet seasons: a winter wet season due to Pacific cold fronts and a summer wet season due to the North American Monsoon (Eastoe and Dettman, 2016) such that both seasonal and annual periods may occur in isotopic time series data for precipitation. Thus, the estimates using sinusoidal curve fitting to the tracer cycle data showed significant variability with period, which is not yet recognized in the Fyw literature.
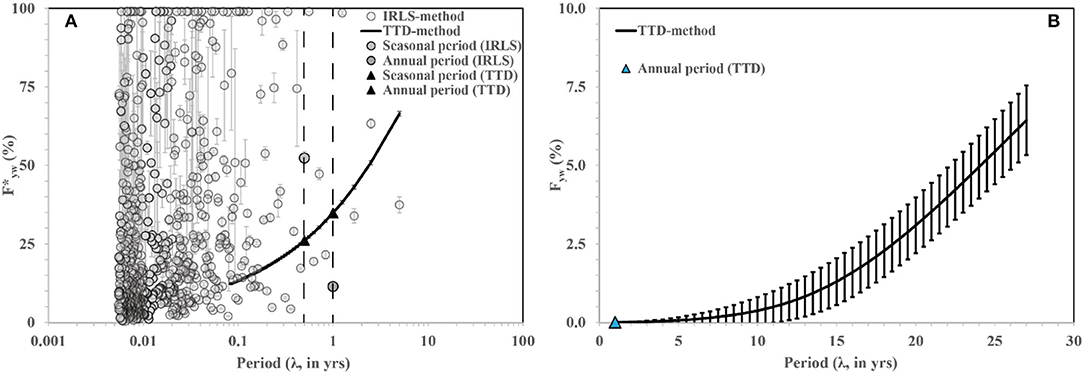
Figure 6. (A) (ensemble mean ± one standard deviation) vs. period (λ) based on δ18O data and (B) Fyw (ensemble mean ± one standard deviation) vs. period (λ) based on 3H data. The vertical error bars in each plot denote one standard deviation. The two gray points in (A) show ensemble mean estimates for seasonal (0.5 years) and annual periods using the IRLS method; the two black triangles show ensemble mean estimates for seasonal and annual periods using the TTD method. The two vertical dashed lines in (A) mark the seasonal and annual periods. The blue triangle in (B) shows the ensemble mean of Fyw for the annual period, calculated using the TTD method and 3H data.
The time series of 3H in groundwater and streamflow (Figure 3, inset) were too sparse and coarse for reliable estimation of AQ/AP using the IRLS method (Equation 1; see also Supplementary Section Sources of uncertainty for Fyw when considering annual cycles of 3H in precipitation and deep groundwater). Instead, the TTD method (Equation 3) was used to calculate Fyw with model parameters drawn from Section 3H-based TTD type and mTT for a Gamma TTD. The pattern of Fyw with period was characterized by a gradual increase with period (Figure 6B). For an annual tracer cycle, the ensemble mean-based Fyw was 1.6 ± 2.4 × 10⁻³ % (blue triangle in Figure 6B). For the highest period considered in our analysis, 27 years, Fyw was 6.4 ± 1.1%. Between periods 1 and 27 years, Fyw aand its slope with respect to period increased gradually. For example, dFyw/dλ changed from 0.06%/year (5 < λ < 10 years), to 0.19%/year (10 < λ < 15 years), to 0.36%/year (15 < λ < 20 years), and finally 0.47%/year (20 < λ < 25 years).
Previous estimates of TTD type and mTT at Marshall Gulch (MGC) were based on stable water isotopes (Heidbüchel et al., 2012; Dwivedi et al., 2021). The current work complements these studies by using a tracer (3H) that is applicable over decades rather than years. For both 3H and δ18O tracers, a Gamma TTD type was appropriate at MGC with an mTT of ~0.82 years (α = 0.42) using δ18O and ~27 years (α = 6.53) using 3H; similar differences in 3H- and δ18O-based mTTs have been noted by previous work (e.g., Stewart et al., 2010). The 3H-based mTT estimate was close to the 26-year interval over which the amount-weighted 3H data were available for precipitation and is consistent with ages of bedrock-hosted groundwater from Dwivedi et al. (2019a). Even with the coarser resolution of the tritium data, the current study was able to constrain deep groundwater flow paths at a representative mountain headwater site and identify unique solutions for Gamma TTD parameters (Figure 4B). Therefore, neither applicability nor poor fit of a particular TTD type should be considered as an indication of data limitation alone. Consequently, the large difference between mTTs from 3H and δ18O can be attributed to the sampled flow regime, i.e., slow flow of deep groundwater vs. highly dynamic flow of near surface and soil waters at MGC and is consistent with the range of applicability of each tracer (DeWalle et al., 1997; Aggarwal, 2013; Suckow, 2014; Dwivedi et al., 2021).
Estimates of from the IRLS method depended variably and non-systematically on period (section Based on δ18O). This finding presents a significant impediment to the use of sinusoidal curve fitting methods to estimate Fyw from a particular catchment or to compare flow dynamics between catchments. In contrast, the TTD-based method (Equations 2, 3) yielded a systematic relationship between and period (Figure 6A). On the basis of stable water isotope data, Dwivedi et al. (2021) reported that a combined Piston Flow and Gamma TTD was applicable for periods below 1 month, and a Gamma TTD alone was applicable for longer periods at MGC. Linking their estimated TTD parameters and corresponding uncertainties for the Gamma TTD type to a method similar to that used to calculate the tritium-based ensemble Fyw mean ± standard deviation (Section Estimation of Fyw using 3H), estimates for periods longer than 1 month gradually increased with period. At an annual period, the TTD-based ensemble-mean at MGC was 34.5%, which is comparable to results of previous work that used similar methods (Table 2). However, recent work using least-square fitting (Gallart et al., 2020) and IRLS and TTD (Stockinger et al., 2016) methods has suggested that Fyw estimates depend on the tracer sampling frequency. The TTD-based estimates from the current work support this line of reasoning insofar as the TTD-based represents a thorough sampling of flowpaths with transit time between 0 and . In this way, the TTD based results may be more reliable than the estimates derived from the IRLS methods that potentially lack thorough sampling of flowpaths and show non-systematic variability with period. However, the literature on is mostly based on IRLS or similar methods with few studies reporting TTD-based results (Table 2; Supplementary Table 6).
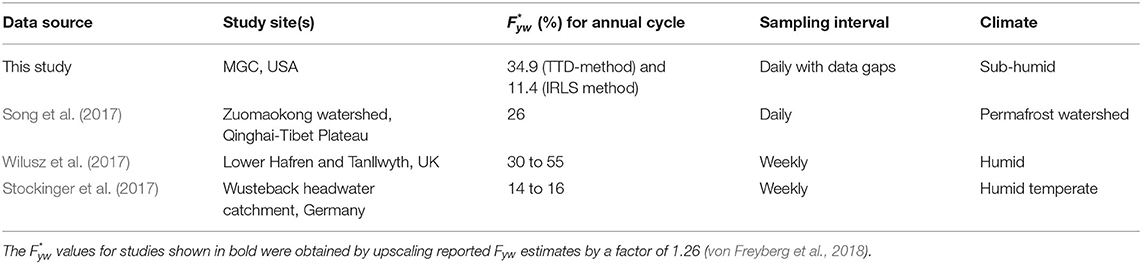
Table 2. Representative estimates based on the TTD method from the literature including the current study.
The tritium-based Fyw values reported in the current study are significantly lower than previously published estimates. The ensemble-mean Fyw determined from annual 3H cycles at MGC was 1.6 x 10⁻³ %, or effectively 0% (Figure 6B; Section Fyw based on 3H). For comparison, the lowest tritium-based Fyw value in Stewart et al. (2017) for an annual cycle was ~8% for a system composed of two homogeneous sub-systems, each having an mTT of 25 years with a Gamma TTD shape parameter α = 10. We attribute this difference i.e., 8 vs. ~0%, to either the constant Tyw value that Stewart et al. (2017) used for both α and tracer cycle period, or the use of multiple lumped parameter models by Stewart et al. (2017), as opposed to the Fyw values in the current work that are based on fitting a single TTD to the whole 3H dataset for deep groundwater. Using TTD parameter estimates from rSAS (rank StorAge Selection) functions, Rodriguez et al. (2021) reported a Fyw estimate of 1.8% for a forested headwater catchment that is closer to the near-zero Fyw estimate at MGC. This difference may result from differences in sampling protocols and/or calculation methods; Rodriguez et al. (2021) sampled stream water under varying flow conditions, in contrast to deep groundwater and base flow sampling in the current work.
A near-zero 3H-based Fyw at MGC calls into question the suitability of the 3H-based Fyw approach for deeper groundwater. The deep groundwater residing in fractured bedrock at MGC has a large mTT (~27 years), and the annual tracer cycle will be highly damped as a result (Fyw~ 0; Section Fyw based on 3H). From the standpoint of the IRLS method (Equation 1), useful 3H data in precipitation or deep groundwater should have an amplitude AP or AQ greater than the 3H measurement precision (0.5 TU, Section Tritium in Precipitation and Deep Groundwater) for some period between 1 and 27 years. At MGC, this is true for AP at periods <19 years, but not for AQ at any period up to 27 years (Supplementary Section Sources of uncertainty for Fyw when considering annual cycles of 3H in precipitation and deep groundwater); consequently, the available data are inadequate for calculating Fyw. This is apparent in the lack of consistent annual periodicity in the Tucson Basin precipitation data (Figure 3), which may not be possible to overcome even with a much larger 3H dataset.
Deep groundwater storage within the fractured bedrock aquifer is important because it recharges the surrounding valley fill aquifer through mountain front and/or mountain block recharge pathways (Wilson and Guan, 2004; Ajami et al., 2011). In the traditional approach [see Rodriguez et al. (2021) and references therein], subsurface storage is a function of the tracer-based mTT multiplied by the long-term mean discharge. Application of this approach to MGC for deep groundwater results in a storage estimate of 6.7 m using a 3H-based mTT of 27 years and the observed long-term streamflow (WY 2008 to WY 2017). In contrast, Gleeson et al. (2015) determined that global present-day groundwater is equivalent to a depth of only 3 m on the land surface. Acknowledging such issues, Kirchner (2016b)—using stable water isotopes and virtual experiments—suggested the use of volume-weighted rather than time-weighted mTTs. However, Peters et al. (2013) and Dwivedi et al. (2021) have shown that volume-weighted mTTs and time-weighted mTTs differ by only a factor of ~2 as opposed to orders of magnitude. Volume-weighted mTTs are also difficult to obtain via 3H data due to the lack of multi-decade observations of both streamflow and tracer concentrations in outflow. Further, the use of mean long-term discharge is problematic as the contribution of deep groundwater to streamflow is likely to be lower than contributions from soil water or other near surface storages. Using end-member mixing analysis, Dwivedi et al. (2019a) reported that deep groundwater contributes 4.5% of the long-term streamflow at MGC. If this fraction is included in the storage calculation, then the storage estimate decreases to a more plausible 0.3 m. Taken together, the results of the current work demonstrate that the tracer-based mTT can be used to estimate storage volumes, provided they are interpreted with appropriate caution.
Considered together, Fyw and TTD parameters such as the shape parameter and mTT for a Gamma TTD provide complementary information about subsurface flowpaths and their dynamic vs. slow behavior. However, the existing literature on Fyw mainly reports Fyw estimates based on either IRLS or similar sinusoidal curve fitting methods for annual or seasonal tracer cycles (Table 2 and Supplementary Table 6). The current work demonstrates that flux-weighted Fyw estimates or , when made using sinusoidal curve fitting methods, vary greatly and non-systematically with period (Figure 6A). For an annual tracer cycle, from the IRLS method was one-third of from the TTD method, and it is therefore likely that previously-reported Fyw estimates may be underestimated. This would have significant implications for Fyw-based understanding of contaminant and nutrient transport, surface water quality (Jasechko, 2016; Kirchner, 2016a), and estimation of TTD parameters (Lutz et al., 2018). As a result, we urge future studies utilizing IRLS or similar methods to report Fyw for various periods, in addition to the annual period, in order to better constrain the variability of results. Future studies that report TTD-based results will be useful to characterize the methodological sensitivity of Fyw across a broader range of natural systems.
The use of a 3H-based Fyw metric has been recommended for improved understanding of deep and/or slow flowpaths contributing to streamflow (Jacobs et al., 2018; Jasechko, 2019). However, the current study highlights a difficulty: that the 3H-based Fyw metric may be inappropriate when there are insufficient deep groundwater data, which is a general limitation of groundwater aquifers (Gleeson et al., 2015; Rodriguez et al., 2021), including MGC. This limitation can also lead to significant variability in the estimated Gamma TTD parameters when the 3H tracer is applied to the question of “hidden streamflow” (Stewart et al., 2010, 2012; Seeger and Weiler, 2014; Jacobs et al., 2018) i.e., the flowpaths that are untraceable by stable water isotope tracers alone. In contrast to Fyw, the 3H-based mTT metric does not depend on any particular period of tracer cycles in inflow and outflow, but aggregation errors may lead to estimates of mTT that are low by several orders of magnitude relative to known mTTs from virtual experiments (Kirchner, 2016b; Stewart et al., 2017), especially in heterogeneous catchments such as MGC. The current work also demonstrates that the 3H-based mTT can lead to greatly over-estimated deep groundwater storage estimates. To address this issue, appropriate long-term discharge estimates, not including storm runoff or discharge from shallow storages, are critical to accurate storage calculations for deep groundwater (Section Inferred Deep Groundwater Storage at MGC). Although the current literature supports the use of multiple (“lumped”) parameter models qualified by site-specific hydrogeological information to reduce aggregation errors in real catchments, model parameters may be difficult to constrain in the multiple parameter approach (Hrachowitz et al., 2009; Stewart et al., 2017; Jacobs et al., 2018).
Resultsv of the current study indicate that concurrent application of multiple metrics and short and long-residence time age tracers provide a more complete understanding of the highly transient and slow flow paths that contribute to streamflow in a sub-humid mountain headwater catchment. Among the various combinations of age tracers and metrics that were tested, the most appropriate metrics at MGC included δ18O-based Fyw and 3H-based deep groundwater mTT. Application of sinusoidal curve fitting methods (e.g., iteratively re-weighted least square or IRLS) for Fyw estimation yielded large, non-systematic changes in Fyw estimates with period. Conversely, Fyw estimates using the alternative transit time distribution or TTD-based method showed consistent patterns with period. The current study therefore suggests that data resultant from sinusoidal curve fitting methods to estimate Fyw and/or to compare dynamic groundwater flow behavior among catchments must be interpreted with caution.
The Gamma TTD-based mTT for deep groundwater using 3H data was 27 years. The same methodology yielded an mTT of 0.82 years when based on δ18O (Dwivedi et al., 2021); hence, we conclude that the former mTT may correspond to deep groundwater stored in fractured bedrock, whereas the latter applies to shallow storages in the soil profile. The shape parameters of the 3H-based Gamma TTD at MGC demonstrated significant variability arising from the short length of the available 3H time series data, and the utility of 3H for determining Fyw in deeper groundwater was limited due to both data quality and inconsistent seasonal cyclicity of the precipitation 3H time series data. Although data quality could be addressed by longer-term observation and attention to precision, irregular seasonal cyclicity of 3H in precipitation at some locations may restrict the applicability of this approach. In summary, using Fyw together with mTT and stable water isotope and tritium tracers can yield a more complete understanding of highly transient and slow flow paths that contribute to streamflow in mountain headwater catchments.
The original contributions in terms of tritium data presented in the study are included in the article/Supplementary Material, further inquiries can be directed to the corresponding author.
RD: conceptualization, formal analysis, investigation, methodology, validation, and visualization. CE: writing—original draft preparation and writing—review and editing. JK, RM, and GB-G: writing—review and editing. JM, PF, TM, and JC: funding acquisition, project administration, resources, supervision, writing—original draft preparation, and writing—review and editing. NA: data curation and writing—review and editing. MS: resources and writing—review and editing. All authors contributed to the article and approved the submitted version.
The authors acknowledge support from National Science Foundation Grants EAR 1331408 and 0724958 to the Santa Catalina Mountains and Jemez River Basin Critical Zone Observatory and NSF Grant no. EAR 2012123 to JC. RD also acknowledges the Geological Society of America for a Graduate Student Research grant, the American Geophysical Union for a Horton Research Grant, and the University of Arizona Graduate and Professional Student Council for Research and Travel grants; TM, JM, PF, and RD acknowledge additional support from the Water Resources Research Center 104(b).
MS was employed by company Mt. Lemmon Water District.
The remaining authors declare that the research was conducted in the absence of any commercial or financial relationships that could be construed as a potential conflict of interest.
All claims expressed in this article are solely those of the authors and do not necessarily represent those of their affiliated organizations, or those of the publisher, the editors and the reviewers. Any product that may be evaluated in this article, or claim that may be made by its manufacturer, is not guaranteed or endorsed by the publisher.
We would like to thank Drs. J. Kirchner and J. von Freyberg for guiding the fraction of young water analysis, and Drs. J. Kirchner and M. Stewart for helpful comments on a preliminary version of this paper. The corresponding author would like to thank his wife, Jessie Dwivedi, and their children, Darcy and Noah Dwivedi, for their patience and support during this project. Some aspects of this study are based on previously published data (Dwivedi et al., 2021).
The Supplementary Material for this article can be found online at: https://www.frontiersin.org/articles/10.3389/frwa.2022.841144/full#supplementary-material
Aggarwal, P. K. (2013). “Introduction,”in Isotope Methods for Dating Old Groundwater, eds A. Suckow, P. K. Aggarwal, L. Araguas-Araguas (Vienna : International Atomic Energy Agency), 1–4.
Ajami, H., Troch, P. A., Maddock, T., Meixner, T., and Eastoe, C. (2011). Quantifying mountain block recharge by means of catchment-scale storage-discharge relationships. Water Resourc. Res. 47, 1–14. doi: 10.1029/2010WR009598
Bryan, S. M. (2021). A dry year predicted along the Rio Grande River, in Arizona Daily Star (Tucson, AZ).
Carroll, R. W. H., Deems, J. S., Niswonger, R., Schumer, R., and Williams, H. K. (2019). The importance of interflow to groundwater recharge in a snowmelt-dominated headwater basin. Geophys. Res. Lett. 46, 5899–5908. doi: 10.1029/2019GL082447
Clow, D. W., Mast, M. A., and Sickman, O. J. (2018). Linking transit times to catchment sensitivity to atmospheric deposition of acidity and nitrogen in mountains of the western United States. Hydrol. Process. 32, 2456–2470. doi: 10.1002/hyp.13183
DeWalle, D. R., Edwards, P. J., Swistock, B. R., Aravena, R., and Drimmie, J. R. (1997). Seasonal isotope hydrology of three appalachian forest catchments. Hydrol. Process. 11, 1895–1906. doi: 10.1002/(SICI)1099-1085(199712)11:15<1895::AID-HYP538>3.0.CO ;2-#
Dickinson, W. R., Hirschberg, D. M., Pitts, G., Stephen, G., and Bolm, K. S. (2002). Spatial Digital Database of the Geologic Map of Catalina Core Complex and San Pedro Trough, Pima, Pinal, Gila, Graham, Cochise Counties, Arizona. Menlo Park, CA: Geological Survey US. doi: 10.3133/ofr02365
Doney, S. C., Glover, D. M., and Jenkins, W. J. (1992). A model function of the global bomb tritium distribution in precipitation 1960-1986. J. Geopys. Res. 97, 5481. doi: 10.1029/92jc00015
Dwivedi, R., Eastoe, C., Knowles, J. F., Hamann, L., Meixner, T., Ferre, P. A. T., et al. (2021). An improved practical approach for estimating catchment-scale response functions through wavelet analysis. Hydrol. Process. 35, 1–20. doi: 10.1002/hyp.14082
Dwivedi, R., Eastoe, C., Knowles, J. F., Wright, W. E., Hamann, L., Minor, R., et al. (2019b). Vegetation source water identification using isotopic and hydrometric observations from a subhumid mountain catchment. Ecohydrology 13, e2167. doi: 10.1002/eco.2167
Dwivedi, R., Meixner, T., McIntosh, J., Ferré, P. A. T., Eastoe, C. J., Niu, G.-Y., et al. (2019a). Hydrologic functioning of the deep critical zone and contributions to streamflow in a high elevation catchment: testing of multiple conceptual models. Hydrol. Process. 33, 476–494. doi: 10.1002/hyp.13363
Eastoe, C. J., and Dettman, L. D. (2016). Isotope amount effects in hydrologic and climate reconstructions of monsoon climates: implications of some long-term data sets for precipitation. Chem. Geol. 430, 78–89. doi: 10.1016/j.chemgeo.2016.03.022
Eastoe, C. J., Gu, A., and Long, A. (2004). The origins, ages and flow paths of groundwater in tucson basin: results of a study of multiple isotope systems, in Groundwater Recharge in a Desert Environment: The Southwestern United States, eds J. F. Hogan, F. M. Phillips, B, R. Scanlon (Washington, DC: American Geophysical Union). doi: 10.1029/009WSA12
Eastoe, C. J., Watts, C. J., Ploughe, M., and Wright, E. W. (2012). Future use of tritium in mapping pre-bomb groundwater volumes. Ground Water 50, 87–93. doi: 10.1111/j.1745-6584.2011.00806.x
Eppolito, S., and Fonseca, F. (2021). Utah stakes out rouge position as Western water shortage loom, in Arizona Daily Star (Tucson, AZ).
Frisbee, M. D., Wilson, J. L., Gomez-Velez, J. D., Phillips, F. M., and Campbell, R. A. (2013). Are we missing the tail (and the tale) of residence time distributions in watersheds? Geophys. Res. Lett. 40, 4633–4637. doi: 10.1002/grl.50895
Gallart, F., Valiente, M., Llorens, P., Cayuela, C., Sprenger, M., and Latron, J. (2020). Investigating young water fractions in a small Mediterranean mountain catchment: both precipitation forcing and sampling frequency matter. Hydrol. Process. 34, 3618–3634. doi: 10.1002/hyp.13806
Gleeson, T., Befus, K. M., Jasechko, S., Luijendijk, E., and Cardenas, B. M. (2015). The global volume and distribution of modern groundwater. Nat. Geosci. 9, 161–167. doi: 10.1038/ngeo2590
Godsey, S. E., Aas, W., Clair, T. A., de Wit, H. A., Fernandez, I. J., and Kahl, J. S. (2010), Generality of fractal 1/f scaling in catchment tracer time series, its implications for catchment travel time distributions. Hydrol. Process. 24, 1660–1671. 10.1002/hyp.7677.
Gupta, H. V. (2016). Fundamentals - Systems Approach to Hydrological Modeling (HWRS 528). Tucson, AZ: The University of Arizona.
Gupta, H. V., Kling, H., Yilmaz, K. K., and Martinez, G. F. (2009). Decomposition of the mean squared error and NSE performance criteria: Implications for improving hydrological modeling. J. Hydrol. 377, 80–91. doi: 10.1016/j.jhydrol.2009.08.003
Harpold, A., Brooks, P., Rajagopal, S., Heidbuchel, I., Jardine, A., and Stielstra, C. (2012). Changes in snowpack accumulation and ablation in the intermountain west. Water Resourc. Res. 48, 1–11. doi: 10.1029/2012WR011949
Heidbüchel, I., Troch, P. A., and Lyon, S. W. (2013). Separating physical and meteorological controls of variable transit times in zero-order catchments. Water Resour. Res. 49, 7644–7657. doi: 10.1002/2012wr013149
Heidbüchel, I., Troch, P. A., Lyon, S. W., and Weiler, M. (2012). The master transit time distribution of variable flow systems. Water Resourc. Res. 48, 1–19. doi: 10.1029/2011WR011293
Holleran, M. E. (2013). Quantifying Catchment Scale Soil Variability in Marshall Gulch, Santa Catalina Mountains Critical Zone Observatory. Tucson, AZ: The University of Arizona.
Hrachowitz, M., Soulsby, C., Tetzlaff, D., Dawson, J. J. C., and Malcolm, A. I. (2009). Regionalization of transit time estimates in montane catchments by integrating landscape controls. Water Resourc. Res. 45, 1–18. doi: 10.1029/2008WR007496
Jacobs, S. R., Timbe, E., Weeser, B., Rufino, M. C., Butterbach-Bahl, K., and Breuer, L. (2018). Assessment of hydrological pathways in East African montane catchments under different land use. Hydrol. Earth Syst. Sci. 22, 4981–5000. doi: 10.5194/hess-22-4981-2018
Jasechko, S. (2019). Global isotope hydrogeology-review. Rev. Geophys. 57, 835–965. doi: 10.1029/2018RG000627
Jasechko, S., Kirchner, J. W., Welker, J. M., and McDonnell, J. J. (2016), Substantial proportion of global streamflow less than three months old. Nature Geoscience 9, 126–129. 10.1038/ngeo2636
Jasechko, S., Wassenaar, L. I., and Mayer, B. (2017). Isotopic evidence for widespread cold-season-biased groundwater recharge and young streamflow across central Canada. Hydrol. Process. 31, 2196–2209. doi: 10.1002/hyp.11175
Kirchner, J. W. (2016a). Aggregation in environmental systems- Part 1: seasonal tracer cycles quantify young water fractions, but not mean transit times, in spatially heterogeneous catchments. Hydrol. Earth Syst. Sci. 20, 279–297. doi: 10.5194/hess-20-279-2016
Kirchner, J. W. (2016b). Aggregation in environmental systems –part 2: catchment mean transit times and young water fractions under hydrologic nonstationarity. Hydrol. Earth Syst. Sci. 20, 299–328. doi: 10.5194/hess-20-299-2016
Kirchner, J. W., Feng, X., and Neal, C. (2001). Catchment-scale advection and dispersion as a mechanism for fractal scaling in stream tracer concentrations. J. Hydrol. 254, 82–101. doi: 10.1016/S0022-1694(01)00487-5
Kirchner, J. W., and Neal, C. (2013). Universal fractal scaling in stream chemistry and its implications for solute transport and water quality trend detection. Proc. Natl. Acad. Sci. U.S.A. 110, 12213–12218. doi: 10.1073/pnas.1304328110
Kling, H., Fuchs, M., and Paulin, M. (2012). Runoff conditions in the upper Danube basin under an ensemble of climate change scenarios. J. Hydrol. 424–425, 264–277. doi: 10.1016/j.jhydrol.2012.01.011
Kohler, T., and Marselli, D. (2009). Mountains and Climate Change-From Understanding to Action. Bern: Geographica Bernensia with the support of the Swiss Agency for Development and Cooperation (SDC) and an international team of contributors.
Lucas, L. L., and Unterweger, P. M. (2000). Comprehensive review and critical evaluation of the half-life of tritium. J. Res. Natl. Inst. Stand. Technol. 105, 541–549. doi: 10.6028/jres.105.043
Lutz, S. R., Krieg, R., Müller, C., Zink, M., Knöller, K., Samaniego, L., et al. (2018). Spatial patterns of water age: using young water fractions to improve the characterization of transit times in contrasting catchments. Water Resour. Res. 54, 4767–4784. doi: 10.1029/2017WR022216
Lyon, S. W., Desilets, S. L. E., and Troch, A. P. (2009). A tale of two isotopes: differences in hydrograph separation for a runoff event when using δD versus δ18O. Hydrol. Process. 23, 2095–2101. doi: 10.1002/hyp.7326
Maloszewski, P., and Zuber, A. (1982). Determining the turnover time of groundwater systems with the aid of environmental tracers 1. Models and their applicability. J. Hydrol. 57, 207–231. doi: 10.1016/0022-1694(82)90147-0
Milly, P. C. D., and Dunne, A. K. (2020), Colorado River flow dwindles as warming-driven loss of reflective snow energizes evaporation. Science 367, eaay9187. 10.1126/science.aay9187
Nelder, J. A., and Mead, R. (1965). A simplex method for function minimization. Comput. J. 7, 308–313.
Pelletier, J. D., and Rasmussen, C. (2009).Geomorphically based predictive mapping of soil thickness in upland watersheds. Water Resour. Res. 45, 1–15. doi: 10.1029/2008wr007319
Peters, N. E., Burns, D. A., and Aulenbach, T. B. (2013). Evaluation of high-frequency mean streamwater transit-time estimates using groundwater age and dissolved silica concentrations in a small forested watershed. Aquat. Geochem. 20, 183–202. doi: 10.1007/s10498-013-9207-6
PRISM Climate Group. (2018). PRISM Gridded Climate Data for the Location: Lat: 32.4263 Lon: -110.7610 Elev: 7703ft. Edited by Oregon State University.
Rodriguez, N. B., Pfister, L., Zehe, E., and Klaus, J. (2021). Testing the truncation of travel times with StorAge selection functions using deuterium and tritium as tracers. Hydrol. Earth Syst. Sci. 25, 401–428. doi: 10.5194/hess-25-401-2021
Seeger, S., and Weiler, M. (2014). Reevaluation of transit time distributions, mean transit times and their relation to catchment topography. Hydrol. Earth Syst. Sci. 18, 4751–4771. doi: 10.5194/hess-18-4751-2014
Song, C., Wang, G., Liu, G., Mao, T., Sun, X., and Chen, X. (2017). Stable isotope variations of precipitation and streamflow reveal the young water fraction of a permafrost watershed. Hydrol. Process. 31, 935–947. doi: 10.1002/hyp.11077
Stewart, M. K., Morgenstern, U., Gusyev, M. A., and Maloszewski, P. (2017), Aggregation effects on tritium-based mean transit times young water fractions in spatially heterogeneous catchments groundwater systems, implications for past future applications of tritium. ydrol. Earth Syst. Sci. 21, 4615–4627. 10.5194/hess-21-4615-2017
Stewart, M. K., Morgenstern, U., Gusyev, M. A., and Maloszewski, P. (2017). Aggregation effects on tritium-based mean transit times and young water fractions in spatially heterogeneous catchments and groundwater systems, and implications for past and future applications of tritium. Hydrol. Earth Syst. Sci. 21, 4615–4627. doi: 10.5194/hess-2016-532
Stewart, M. K., Morgenstern, U., and McDonnell, J. J. (2010). Truncation of stream residence time: how the use of stable isotopes has skewed our concept of streamwater age and origin. Hydrol. Process. 24, 1646–1659. doi: 10.1002/hyp.7576
Stewart, M. K., Morgenstern, U., McDonnell, J. J., and Pfister, L. (2012). The ‘hidden streamflow' challenge in catchment hydrology: a call to action for stream water transit time analysis. Hydrol. Process. 26, 2061–2066. doi: 10.1002/hyp.9262
Stockinger, M. P., Bogena, H. R., Lücke, A., Diekkrüger, B., Cornelissen, T., and Vereecken, H. (2016). Tracer sampling frequency influences estimates of young water fraction and streamwater transit time distribution. J. Hydrol. 541, 952–964. doi: 10.1016/j.jhydrol.2016.08.007
Stockinger, M. P., Bogena, H. R., Lücke, A., Stumpp, C., and Vereecken, H. (2019). Time variability and uncertainty in the fraction of young water in a small headwater catchment. Hydrol. Earth Syst. Sci. 23, 4333–4347. doi: 10.5194/hess-23-4333-2019
Stockinger, M. P., Lücke, A., Vereecken, H., and Bogena, H. R. (2017). Accounting for seasonal isotopic patterns of forest canopy intercepted precipitation in streamflow modeling. J. Hydrol. 555, 31–40. doi: 10.1016/j.jhydrol.2017.10.003
Suckow, A. (2014). The age of groundwater – definitions, models and why we do not need this term. Appl. Geochem. 50, 222–230. doi: 10.1016/j.apgeochem.2014.04.016
U.S. Geological Survey. (2021a). USGS 1/3 Arc Second n33w111 20210301: U.S. Geological Survey. Available online at: https://apps.nationalmap.gov/ (accessed September 12, 2019).
U.S. Geological Survey. (2021b). USGS TNM Hydrography (NHD). Available online at: https://hydro.nationalmap.gov/arcgis/rest/services/nhd/MapServer (accessed November 12, 2021).
Viviroli, D., Dürr, H. H., Messerli, B., Meybeck, M., and Weingartner, R. (2007). Mountains of the world, water towers for humanity: typology, mapping, global significance. Water Resourc. Res. 43, 1–13. doi: 10.1029/2006WR005653
Viviroli, D., Weingartner, R., and Messerli, B. (2003). Assessing the hydrological significance of the world's mountains. Mountain Res. Dev. 23, 32–40. doi: 10.1659/0276-4741(2003)0230032:ATHSOT2.0.CO;2
von Freyberg, J., Allen, S. T., Seeger, S., Weiler, M., and Kirchner, W. J. (2018). Sensitivity of young water fractions to hydro-climatic forcing and landscape properties across 22 Swiss catchments. Hydrol. Earth Syst. Sci. 22, 3841–3861. doi: 10.5194/hess-22-3841-2018
Wilson, J. L., and Guan, H. (2004). “Mountain-block hydrology and mountain front recharge,” in Groundwater recharge in a desert environment: the southwestern United States, eds J. F. Hogan, F. M. Phillips, and B. R. Scanlon (Washington, DC: AGU), 113–138.
Keywords: tritium (3H), stable water isotopes, transit time distribution, fraction of young water, mean transit time (MTT), annual tracer cycle, seasonal tracer cycle, mountain headwater catchment
Citation: Dwivedi R, Eastoe C, Knowles JF, McIntosh J, Meixner T, Ferre PAT, Minor R, Barron-Gafford G, Abramson N, Stanley M and Chorover J (2022) Tandem Use of Multiple Tracers and Metrics to Identify Dynamic and Slow Hydrological Flowpaths. Front. Water 4:841144. doi: 10.3389/frwa.2022.841144
Received: 22 December 2021; Accepted: 12 April 2022;
Published: 19 May 2022.
Edited by:
Yun-Ya Yang, Andes Ag, Inc., United StatesReviewed by:
Huawu Wu, Nanjing Institute of Geography and Limnology (CAS), ChinaCopyright © 2022 Dwivedi, Eastoe, Knowles, McIntosh, Meixner, Ferre, Minor, Barron-Gafford, Abramson, Stanley and Chorover. This is an open-access article distributed under the terms of the Creative Commons Attribution License (CC BY). The use, distribution or reproduction in other forums is permitted, provided the original author(s) and the copyright owner(s) are credited and that the original publication in this journal is cited, in accordance with accepted academic practice. No use, distribution or reproduction is permitted which does not comply with these terms.
*Correspondence: Ravindra Dwivedi, cmF2aW5kcmFkd2l2ZWRpQGVtYWlsLmFyaXpvbmEuZWR1
Disclaimer: All claims expressed in this article are solely those of the authors and do not necessarily represent those of their affiliated organizations, or those of the publisher, the editors and the reviewers. Any product that may be evaluated in this article or claim that may be made by its manufacturer is not guaranteed or endorsed by the publisher.
Research integrity at Frontiers
Learn more about the work of our research integrity team to safeguard the quality of each article we publish.