 Yuntian Song1
 Yongpeng Lin
 Chenge An
 Hongbo Ma
- 1State Key Laboratory of Hydroscience and Engineering, Tsinghua University, Beijing, China
- 2Department of Environmental Sciences, University of Virginia, Charlottesville, VA, United States
Outburst floods released by failing barrier dams are likely to be catastrophic, posing high risk to downstream areas. However, emergent forecasting of the breaching process is still challenging due to the complex mechanisms as well as the lack of adequate data. During October and November 2018, four tremendous barrier lakes formed and breached on the Jinsha River and the Yarlung Zangbo River, China. In this paper, we present numerical simulations for three of these events (October 17 and October 29 at Jiala Village, Yarlung Zangbo; November 3 at Baige Village, Jinsha River), and investigate what factors control the magnitude and shape of the hydrograph of the outburst flood. A physically-based dam-breach model was established for the prediction. We first specified the model parameters based on the aerial images, DEM data and hydrological measurements during the emergency treatment. With these parameters, the model can successfully predict the breaching process of the two barrier dams in the Yarlung Zangpo, but underpredict the peak discharge of the outburst flood in the Jinsha River. The outburst flood in the Jinsha River, however, can be well-reproduced with refined information on dam height and grain size distribution. Moreover, both field data and our numerical simulation showed that the magnitude and shape of the outburst flood hydrograph can be affected by the dam morphology and the composition of dam material. Two patterns of outburst flood hydrographs with different symmetry characteristics were identified using statistical analysis. The approximately symmetrical breach hydrograph of the “November 3” Baige barrier lake could be partly attributed to the relatively fine grain size distribution of the dam material.
Introduction
As a consequence of tectonic movement and climate change, hazards caused by barrier lakes have hit mountain areas all around the world (Costa and Schuster, 1988; Miller and Cruden, 2002; Nicoletti and Parise, 2002; Abril and Knight, 2004; Korup and Tweed, 2007; Ruiz-Villanueva et al., 2017). Increasing attention has been paid on the studies of the breach mechanism, emergency simulation, as well as the mitigation measures of barrier dams (O'Connor et al., 2002; Cao et al., 2011a). In recent years, a series of severe earthquakes, including the 2008 Wenchuan earthquake (Ms. 8.0), the 2014 Ludian earthquake (Ms. 6.5) and the 2017 Milin earthquake (Ms. 6.9), have occurred in Southwest China, triggering thousands of landslides, glacier avalanches and numerous barrier lakes (Cui et al., 2009; Shi et al., 2017; Zhao et al., 2019). On October 11, October 17, October 29, and November 3 in 2018, four tremendous landslides blocked the Jinsha River and the Yarlung Zangbo River, inducing large barrier lakes and posing serious threats to downstream people and properties. Therefore, there is an urgent need to predict outburst flood hydrographs precisely and timely.
Among the parameters of outburst floods, the peak discharge (Qp), the occurrence time of peak discharge (Tp) and the shape of flood hydrographs are particularly important for the risk assessment and early warning (Herget et al., 2015). However, only a few observation data of breach hydrographs of landslide dams are available due to the limitations of measurement time and accessibility (Balmforth et al., 2009; Dang et al., 2014). Due to the lack of field observations, a comprehensive understanding and classification of the hydrograph of breach floods is rather difficult. Studies on the breach process of landslide dams and their influential factors have been carried out mostly by laboratory experiments (Spinewine and Zech, 2003), which show that the magnitude and shape of dam-breaching flood hydrograph are influenced by dam material, dam geometry, upstream inflow conditions, as well as artificial intervention (Balmforth et al., 2009; Schmocker and Hager, 2009; Gregoretti et al., 2010; Cao et al., 2011a; Chen et al., 2015, 2020). More specifically, the height of the landslide dam and the grain size distribution (GSD) of the dam material are two key factors that play significant roles in the process of dam breach. As it is difficult to scale both the actual sizes and material composition of natural landslide dams in laboratories, the conclusions obtained from experiments still need further validation (Schmocker and Hager, 2009; Cao et al., 2011b).
In addition to the difficulty of emergent field measurement, the complexity of the physical mechanism of the dam breach is another factor that limits the prediction of the breach process of landslide dams as well as the mitigation of breach hazards. Previous models are generally categorized into three types: statistical models, parametric models, and physically-based models, and all the three types of models have their own advantages and disadvantages in terms of emergency treatment (Ma and Fu, 2012; Dang et al., 2014). Because the physical mechanisms are not taken into account, most empirical formations of statistical models could predict only parameters such as Qp or Tp rather than the whole flood hydrographs (Froehlich, 2008; Wu et al., 2011). Although the input parameters required in statistical models are few, the uncertainty of predicted results is significant (Wahl, 1997, 2004; Pierce et al., 2009). With the simplification of the breach process and hydraulic calculation, parametric models have been widely applied in software such as DAMBRK (Fread, 1988), BEED (Singh et al., 1988), WINDAM (Temple et al., 2006), HEC-RAS (Fan et al., 2020), and DB-IWHR (Chen et al., 2019). However, some assumptions adopted in parametric models are inconsistent with the phenomena observed in the field and laboratory (Wahl et al., 2008). In addition, the empirical parameters applied in parametric models, such as the spillway incision rate, the ultimate depth/width of the breach, and the water depth at the peak time, need to be decided before the breach process, which further increases the uncertainty of the simulation results (Mohamed et al., 2002).
For such reasons, physically-based models with less simplifying assumptions could be a better choice for the simulation of the breach process in detail (Worni et al., 2014), and various physically-based models have been developed in recent decades (Tingsanchali and Chinnarasri, 2001; Wang and Bowles, 2006; Abderrezzak et al., 2008; Wang et al., 2008; Cao et al., 2011b; Liu et al., 2012; Li et al., 2020, 2021; Zhong et al., 2020). Since the interactions between water and sediment movement are complicated during the dam breach process, the accuracy of the simulation strongly depends on the sediment transport method incorporated in the model (Singh and Scarlatos, 1988; Cao et al., 2004; Wu and Wang, 2007). In previous research, bedload transport relations for uniform sediment have been widely adopted in physically-based models of dam breach (Tingsanchali and Chinnarasri, 2001; Zhong et al., 2020). Since the grain size of sediment, which consists the landslide dam often covers a rather wide range, implementing a characteristic grain size as a simplification will lead to an inaccurate sediment transport rate, thus introducing uncertainties in the prediction of the breach process. For such reasons, several researchers have extended the physically-based dam breach model to sediment mixtures (Wu and Wang, 2007; Wang et al., 2008; Fu et al., 2010; Liu et al., 2012; Li et al., 2020).
Nevertheless, the applicability of most existing models to natural landslide dams was tested in experimental cases due to the lack of observation data (Abderrezzak et al., 2008). Only a few physically-based models have been verified in the practice of emergency prediction of natural landslide dams. For the emergency treatment of landslide dams, a systematic approach is required to obtain the parameters based on limited data and implement physically-based models with efficiency.
The organization of this paper is as follows. In Section Simulation Method, a physically-based model is established for the emergency simulation of the dam breach process under the condition of limited field data. In Section Emergent Forecasts of the Breaching Process of Three Landslide-Dams, the parameters for the simulation are obtained based on the information from aerial images, DEM data and hydrological measurements, and the applicability of the model for dam-breach flood prediction is tested in the emergency treatment of three successive landslide-dammed lakes in 2018 in Southwest China. The model simulation shows high accuracy in the two cases of the Yarlung Tsangpo River. In Section Discussion, the dam-breach flood hydrographs of landslide dams are roughly categorized into two typical types based on data from a few field cases. The effects of grain size and height of the landslide dam on the outburst flood hydrograph were identified and discussed. Finally, conclusions are summarized in Section Conclusions.
Simulation Method
Considering that both efficiency and accuracy are important for the emergent prediction of breaching floods of landslide dams, 1-D hydrodynamic-morphodynamic models could be applied to simulate the hydraulic and morphological processes of landslide-dam breaching (Wang et al., 2008; Liu et al., 2012; Zhong et al., 2020). The spillway and downstream river are simplified as a trapezoidal channel, of which the bed and bank are both erodible (Figure 1).
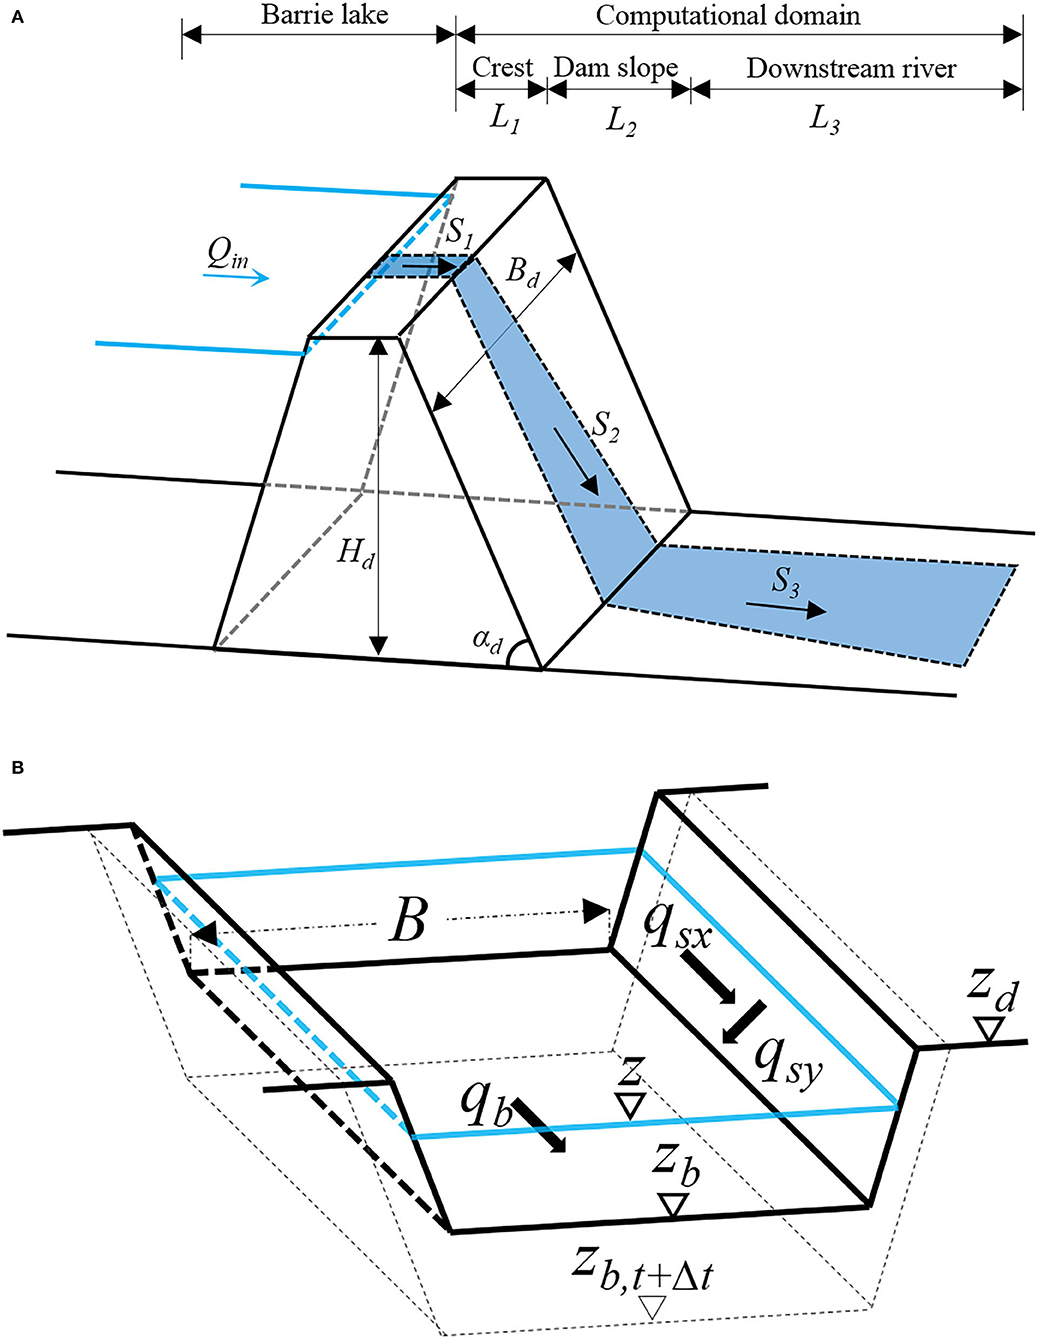
Figure 1. Sketches of a landslide-dam: (A) overview of the computational domain (B) sketch of the cross section and sediment transport rates.
Flood Routing
During the process of breaching, the flow through a spillway is complex as a result of the moving boundary conditions and the interaction between sediment and water. Unsteady, non-uniform flow during the breaching is described by the shallow water equations:
where x is the streamwise coordinate along the spillway [L], t is the time [T], Q is the flow discharge [L3T−1], A is the wetted cross-section area [L2], g is the acceleration of gravity [LT−2], z is the water surface level [L], and Sf is the friction slope [-], which is given as
where h is the water depth [L] and u* is the shear velocity calculated by the Manning-Strickler relation (Parker, 1990):
where u is the cross-sectional averaged flow velocity [LT−1], u = Q/A, ks is the bed roughness height [L], Ds90 is the 90th percentile of the surface grain size distribution [L], and dimensionless parameters αr = 8.1 and nk = 2 are implemented in this paper.
Bed Erosion
The movement of bedload dominates the change in channel bed elevation, while the effect of suspended load could be neglected for the breach development (Balmforth et al., 2009). In most cases, the grain size of debris material constructing landslide-dams varies over a wide range. The bedload transport rate is sensitive to the grain size distribution due to the interactions between coarse and fine grains, such as the hiding effect (Egiazaroff, 1965; Duan and Scott, 2007) and magic sand effect (Wilcock and Crowe, 2003; An et al., 2019). The conservation of sediment mixtures is described by the Exner equation with the active layer formulation (Parker et al., 2007). Sediment exchange with bed load in the upper active layer, of which the thickness La is proportional to Ds90:
In the simulation na is specified as 2. The sediment mixtures are divided into N groups according to the grain size. The relations governing the evolution of bed elevation and the conservation for each sediment group are given as
In the Equations (7)–(10), the index i denotes the i-th size range of the grain size distribution; zb denotes the bed elevation [L]; B denotes the channel width [L]; λp denotes the porosity of the bed deposit [-]; qbi denotes the volume bedload transport rate per unit width of the i-th range [L2T−1]; qbT denotes the total volume bedload transport rate per unit width [L2T−1]. Considering the erosions at the bank slope, two source terms are added on the basis of standard Exner equations: qsyi is the cross-sectional volume sediment input rate per unit length of the i-th range [L2T−1], qsyT is the total volume of cross-sectional sediment input rate per unit length [L2T−1] and qsyT = Σqsyi. In addition, Fi denotes the volume fraction of the i-th range in the active layer, fIi denotes the volume fraction of the i-th range that exchanges at the interface between the substrate layer and the active layer, which takes the form
When the bed degrades, the active layer directly extends to the substrate, and fi is the volume fraction of the i-th range in the substrate layer. The surface material and bedload are transferred to the substrate as bed aggrades, pbi= qbi/qbT is the volume fraction of the i-th range in bedload, and the coefficient α is set to 0.5 in the calculation (Toro-Escobar et al., 1996; An et al., 2017).
The mixed-size sediment transport relation (Wilcock and Crowe, 2003) is used to calculate qbi in Equation (8), which is specified as follows
where s is the specific gravity of sediment (2.65 for quarz on earth). is the dimensionless sediment transport rate, defined by
where τb = ρu*2 is the bed shear stress and τri is the reference shear stress for the i-th range of sediment:
where Di is the grain size of the i-th range and Dsg is the geometric mean grain size of the active layer. The reference Shields number is given as
Fs denotes the fraction of sand (D < 2 mm) in the active layer, which characterizes the magic sand effect. That is, the existence of sand on the bed can evidently enhance the sediment mobility of coarse particles. The exponent b is computed as
Equations (15) and (17) represent a hiding function used in mixed-size sediment transport models.
Bank Erosion
The erosion of sidewall conveys massive sediment to the spillway channel, playing a key role in the process of breach development. The morphodynamic model proposed by Cantelli et al. (2007), which could describe the evolution of the erodible bed and bank, is adopted here. The equation governing the channel width is given as
As shown in Figure 1B, SS is the side slope of bank [-], zd is the elevation of the dam crest [L], qsxT is the streamwise volume sediment transport rate [L3T−1], and the lateral erosion coefficient β = 0.2 is implemented in this paper. The detailed calculation method of qsyT can be found in Cantelli et al. (2007).
Computational Conditions
As shown in Figure 1A, the computational domain is comprised of three sections: (1) spillway channel along the dam crest, (2) downstream slope of the barrier dam and (3) downstream river channel. The parameters L1, S1, L2, S2, L3, and S3 denote the length and bed slope of the three sections, respectively. The geometrical parameters, including the dam height Hd, dam width Bd, initial depth H0 and initial width B0 of the spillway, could be obtained from DEM data, field measurements or empirical estimations. Based on the water level-storage relation, the water level at the inlet of the spillway channel z0 [L] can be obtained from the water storage of the barrier lake V [L3]:
where ΔV is the variation of V per unit time [L3T−1], Qin is the upstream inflow discharge into the barrier lake [L3T−1], and Qout is the outflow discharge at the inlet of the spillway [L3T−1]. The downstream boundary is set as a free flow condition.
In our simulation, the governing equations of the flow hydraulics (Equations 1, 2) are solved by a Godunov-type scheme with the HLL (Harten-Lax-van Leer) approximate Riemann solver (Harten et al., 1983; Toro, 2001), which can effectively capture discontinuities in unsteady and non-uniform open channel flows. When solving the governing equation of the bed elevation (Equation 7), a second-order central scheme is implemented to discretize the spatial derivatives, and a first-order explicit scheme is implemented to discretize the temporal derivatives. For the governing equations of the bed surface texture (Equation 8) and channel width (Equation 18), a first-order upwind scheme is implemented to discretize the spatial derivatives, and a first-order explicit scheme is implemented to discretize the temporal derivatives.
Emergent Forecasts of the Breaching Process of Three Landslide-Dams
In 2018, four large landslides occurred successively on October 11, October 17, October 29, and November 3 in southwestern China, damming the Jinsha River and the Yarlung Zangbo River (Figure 2). The landslide-dams blocked the rivers and impounded huge barrier lakes, posing great threats to tens of thousands of people's lives and properties downstream. The physically-based model established in this paper was used to forecast the outburst floods of barrier lakes on October 17, October 29 and November 3.
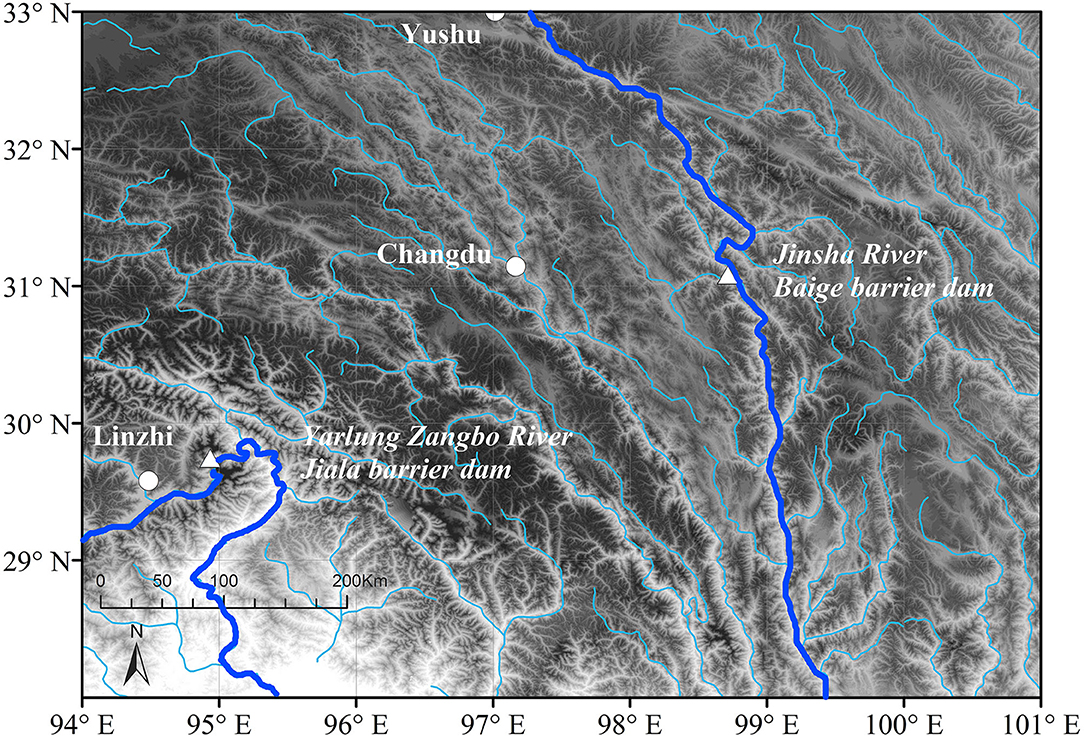
Figure 2. Locations of the barrier lakes.
Overview of the Landslide Dam Lakes at Jiala Village and Baige Village
On October 17, 2018, a large landslide triggered by glacier avalanches occurred on the left bank of the Yarlung Zangbo River near Jiala village, Tibet, China (29°44′42″N, 94°56′6″ E). Massive debris material dammed the river, creating a barrier lake with a storage capacity more than 600 million m3. Detailed measurements of the dam geometry and composition of dam material were rather difficult due to inaccessibility to the barrier dam shortly after the landslide. The water level of the dammed lake started decreasing at 15:00 on October 19, indicating that overtopping on the dam crest had begun. In the evening of October 19, the landslide dam finally failed and the outburst flood propagated to the Dexing gauging station with a peak discharge of 23,400 m3/s (Jin, 2019).
On October 29, the landslide reactivated and dammed the Yarlung Zangbo River for a second time, forming a new barrier lake at Jiala village. The barrier lake swelled rapidly due to the continual inflow from upstream and remained inaccessible to the landslide dam. At 10:00 on October 31, the dammed lake started draining naturally. On the evening of October 31, a peak discharge of 12,200 m3/s occurred at the Dexing gauging station 2 h after the arrival of the flood.
On the evening of October 10, a large-scale landslide from the right bank blocked the Jinsha River and led to a barrier lake near Baige village, Tibet, China (31°4′53″ N, 98°42′48″ E). The landslide dam was 25 million m3 in total volume with a height of 61 m. The landslide dam breached naturally on October 13 with a peak discharge of 10,000 m3/s (Jin, 2019). On November 3, a second landslide occurred at the same place, with a larger magnitude than the previous one. With the constant incoming flow, the huge dammed lake drowned several towns upstream and posed great potential to cause a catastrophic flood. As the water level increased constantly, an artificial spillway had been excavated to prevent catastrophic consequences since November 5. Eventually, the spillway on the dam crest was 220 m long, 13–15 m deep, and 3 m wide at the bottom. The lake started to drain in the morning of November 12 and at 14:00 on November 14, the water level began to rapidly drop and the process of dam failure was accelerating. Four hours later, the flood discharge reached a peak of 30,960 m3/s (Fan et al., 2020; Zhong et al., 2020), which is the 10,000-yr flood.
Emergent Survey and Measurement for the Model Parameters
Considering the inaccessibility to landslide dams and the high risk of dam failure in a short time, direct measurements of the morphology and composition of landslide dams were difficult and dangerous. During the process of emergent forecasts of outburst floods, the needed parameters for the simulations could be obtained or estimated based on the limited information from aerial images, DEM data and hydrological measurements at upstream gauging stations.
In the emergent forecast process of the Jiala landslide dams on October 19 and October 29, the level-storage curve of the barrier lake (Figure 3A) and the elevation of the river channel before the landslide at the dam site (2,750 m, Huang Hai Datum) were obtained based on the DEM data. The inflow discharge was measured at an upstream gauging station (Jin, 2019).
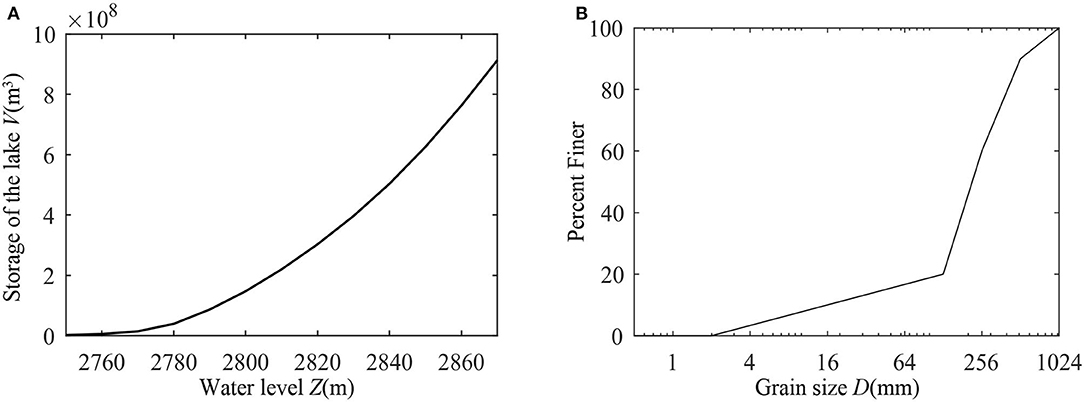
Figure 3. Calculation conditions for the breach simulation of the Jiala barrier dam. (A) The level-storage curve of the Jiala barrier lake; (B) GSD of dam material adopted in the emergency simulation of the Jiala barrier dam and Baige barrier dam.
The dam height Hd, the dam crest length L1, the dam width Bd and the initial morphological parameters of the spillway were estimated by the visual interpretation of aerial images. According to the photographs taken above the crest, the barrier dam was mainly made up of large blocks, boulders and gravelly soil. Synthesizing the information from aerial images and experience from other similar examples (Shi et al., 2017), the GSD of the landslide-dam at Jiala village was estimated and shown in Figure 3B.
Assuming that the dam slope angle αd and sidewall slope of spillway SS were consistent with the angle of repose, the parameters adopted in the dam breach simulation are presented in Table 1.
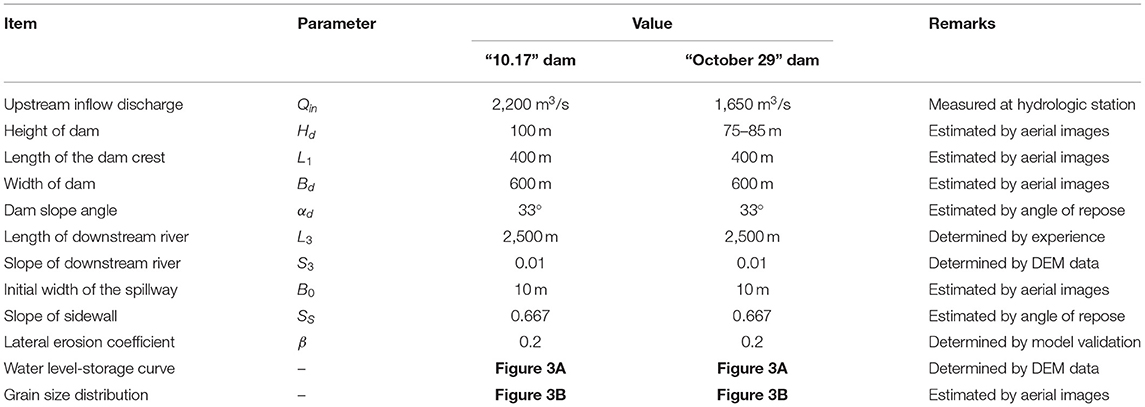
Table 1. Parameters adopted in the breach simulation of the barrier lake in Jiala village.
In the emergent forecast process of the “November 3” Baige landslide dam, the water level-storage curve was also obtained by DEM data (Figure 4A). According to the aerial images, the debris particles on the dam crest were similar to those of the landslide dams at Jiala village. Therefore, the GSD data presented in Figure 3B were also adopted in the breach simulation of this dam. The value of inflow discharge measured at an upstream gauging station was 700 m3/s (Jin, 2019).
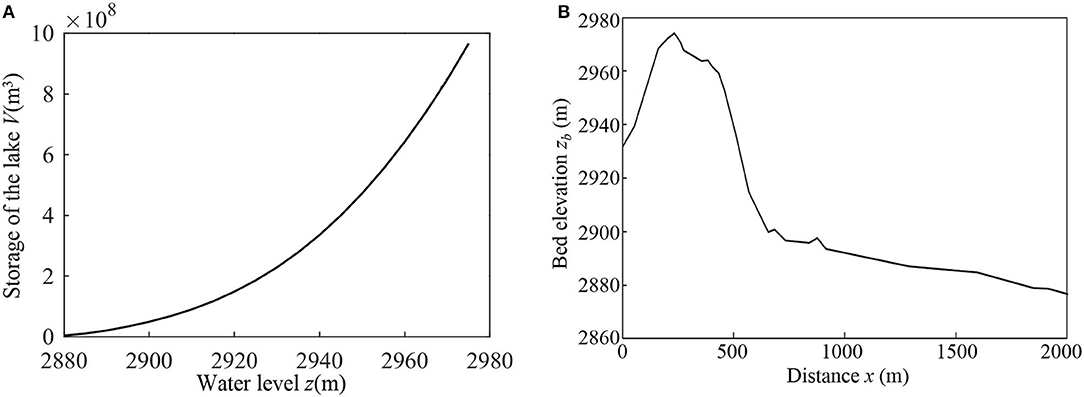
Figure 4. Calculation conditions for the breach simulation of the Baige barrier lake. (A) The level-storage curve of the Baige barrier lake; (B) the longitudinal profile of the “November 3” Baige landslide dam (measured by SBSMG and SKLGP).
With a smaller value of inflow discharge, the risk of the “November 3” Baige landslide dam overtopping in a short time is relatively lower than that of the “October 19” and “October 29” landslide dams at Jiala village, which made it possible to implement measurements in more detail. On November 5, the elevation of the dam crest was measured to be 2,966 m (Zhong et al., 2020). Four days later, the Sichuan Bureau of Surveying, Mapping and Geoinformation (SBSMG) and the State Key Laboratory of Geohazard Prevention and Geo-environment Protection (SKLGP) of China obtained detailed topographic data of the landslide dam using the unmanned aerial vehicle (UAV). Figure 4B presents the longitude profile measured by SBSMG and SKLGP. In particular, the elevation of the dam crest was 2,974 m according to this data version. In the following simulations, the former value (2,966 m) was appointed as the input data. Other topographic parameters were obtained by the measured data and the parameters adopted in the emergency simulation are presented in Table 2.
Table 2. Parameters adopted in the breach simulation of the barrier lake in Baige village.
From November 5 to November 13, multiple scenarios of simulations were performed based on gradually-fed detailed data and different topographic conditions to support the decision-making for hazard mitigation. The ultimate elevation of the spillway channel bed was set to 2952.5 m, based on the crest elevation of 2,966 m at the inlet of the spillway (Liu et al., 2021).
As detailed surveys and accurate measurements of landslide dams are usually difficult during emergent treatment, parameters for modeling should be estimated using different methods if possible. Among the various input parameters in the model, the geometry and composition parameters of the dam have greater uncertainties than the water level-storage relation and inflow discharge, which can be obtained directly in most cases.
To assess the prediction effect, we performed statistical analysis between our simulated outburst flood discharge and the observed data. The Pearson correlation coefficient R = cov(X, Y)/(σXσY) was used to assess the linear correlation, where X and Y denote simulated and observed values of flow discharge, cov(X, Y) is the covariance of X and Y, and σX and σY are the standard deviation of X and Y, respectively. Moreover, the root mean square error (RMSE) se= [Σ(X-Y)2/N]1/2 was used to assess the simulating error, where N denotes the number of data points.
Forecast Results
In the emergent forecast process of the “October 19” Jiala landslide dam on the Yarlung Zangbo River, the dam breaching simulation was carried out for the decisions on hazard mitigation and provided the predicted results 4 h before the peak discharge appeared.
The simulation described the breach process 20 h after the moment when the dam began to drain. Figure 5A illustrates the predicted and measured data of the breaching flood hydrograph. The simulated hydrograph curve is asymmetrical, with a steep rising limb and a gentle falling limb. Two hours since the start of draining, discharge at the inlet of the breach reached 2,187 m3/s, close to the discharge of upstream inflow. After another 2 h, the peak discharge occurred with a value of 26,658 m3/s. The measured data were obtained at the Dexing hydrological station which is 158 km downstream of the barrier dam site. It took 2.5 h for the discharge to rise to the peak value since the flood arrived at the Dexing gauging station, and the peak discharge was observed as 23,400 m3/s. A comparison between the predicted and measured data shows that our hydrodynamic-morphodynamic model predicts the hydrograph of dam breaching flow quite well, including both the peak discharge and its occurrence time. The observed falling limb, however, is gentler than the predicted limb. This difference can be partially explained by the fact that the predicted hydrograph was at the dam site, whereas the measured hydrograph was observed downstream of the dam site. The flood wave diffused while propagating downstream. As shown in Figure 5B, the cumulative flood volume reaches 560 million m3 after 20 h. Figure 5C presents the temporal variation in the water level of the barrier lake. At the beginning of the breach, flood discharge through the spillway was less than that of upstream inflow, and the water level kept growing slightly. As the flood discharge increased, the water level of the dammed lake dropped at an accelerating pace. When the flood discharge reached its peak value, the inflection point of the water level curve occurred. Hereafter, the water level dropped at a decelerating pace and approached 2,808 m. Figure 5D shows the morphological changes of the channel bed profile. During the breach process, the dam crest eroded by 55 m within 20 h, with the material of the barrier dam depositing along the downstream river.
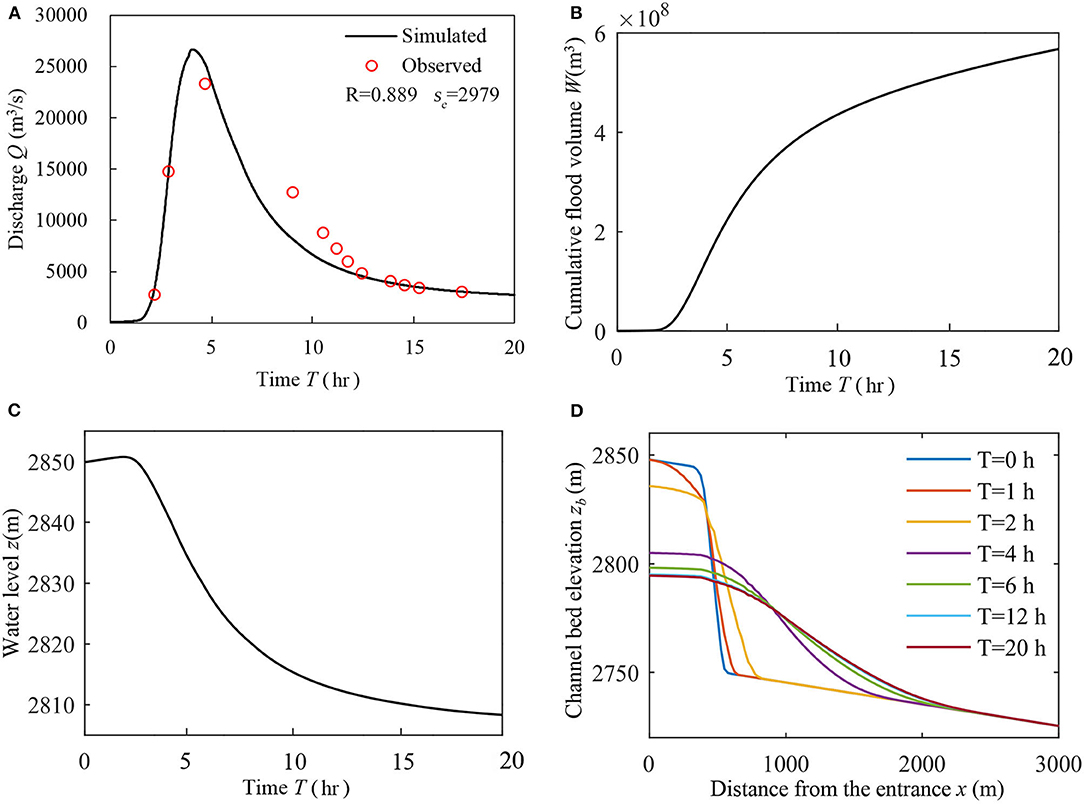
Figure 5. The breach process of the “October 19” barrier lake. (A) Simulated flow hydrograph compared with the observed flow hydrograph. The Pearson correlation coefficient R is 0.889, and the root mean square error RMSE (se) is 2,979; (B) simulated cumulative flood volume; (C) simulated water level at the inlet of the spillway; (D) simulated longitudinal profiles of the river channel in the computational domain.
In the emergent forecast process of the “October 29” Jiala landslide dam, the height of the dam was estimated to be 75–85 by different rounds of aerial observations. Three scenarios of Hd = 75, 80 and 85 m were simulated due to the uncertainty of the morphology parameters. Correspondingly, the initial water level of the dammed lake was set to 2,825, 2,830, and 2,835 m (Huang Hai Datum).
Figure 6A shows the temporal variation in the water level of the barrier lake. According to the observed results of the temporary hydrological station established near the dam site, the water level dropped by more than 20 m within the first 8 h. Figure 6B shows the simulated hydrographs compared with the data observed at the Dexing gauging station. Recalling that flood wave diffused along the way, the dam height was more likely to be 80~85 m. Two hours after the draining, the discharges of three scenarios rise to 1,670 m3/s, exceeding the discharge of the upstream inflow. After another 2 h, the discharges of three scenarios reach 11,314, 13,359, and 16,325 m3/s. Based on the available information, the peak discharge at the dam site was expected to be 13,000–17,000 m3/s. The predicted results of the breach process were provided 2 h in advance of the occurrence of peak discharge.
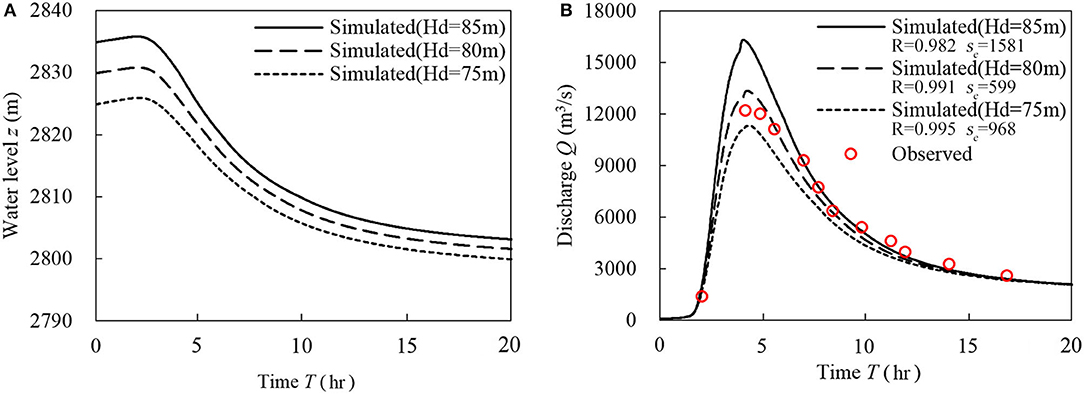
Figure 6. The breach process of the “October 29” dammed lake. (A) Time series of the simulated water level at the inlet of spillway; (B) simulated flow hydrograph compared with the measurements. The Pearson correlation coefficient R under different dam heights vary in the range of 0.982–0.995, and the values of root mean square error RMSE (se) vary in the range of 599–1,581.
Good agreement could be found between the predicted results and observed data. In the process of emergency treatment of two consecutive landslide-dams at Jiala village, the model established in this paper successfully predicted the flood hydrographs with limited time and field data.
In the emergent forecast process of the “November 3” Baige landslide dam, tens of scenarios with different initial elevations of the spillway bed were simulated to help with the decision-making of mitigation from November 5 to November 14. It was found that the lower the initial elevation of artificial spillway channel bed is, the lower peak discharges become and the later the occurrence time. The reduced peak and delayed occurrence time both help reduce the risk of the dam breaching flood, indicating that the engineering intervention is very effective in terms of risk reduction.
Based on the initial value of spillway bed elevation (2952.5 m), our model predicted that the peak discharge could be contained within 12,000 m3/s. However, what occurred on-site was utterly unexpected. The flood discharge reached a peak of 30,960 m3/s, which is the 10,000-yr flood, as shown in Figure 7. In addition, the flood hydrograph of the “November 3” Baige barrier lake is approximately symmetric, with a steep rising limb as well as a rapid falling limb, which is different from the majority of hydrographs of other landslide-dammed lakes (Herget et al., 2015).
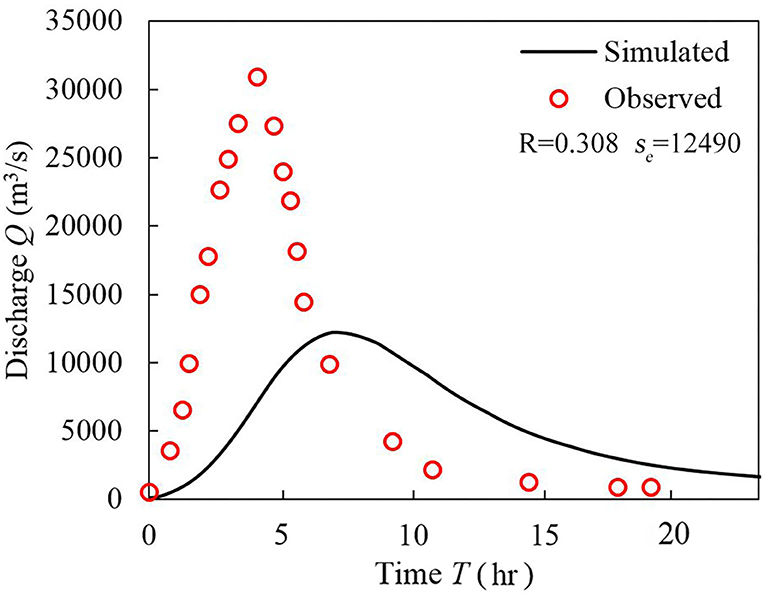
Figure 7. The simulated flow hydrograph of the “November 3” Baige barrier lake compared with the observed data. The Pearson correlation coefficient R is 0.308, and the root mean square error RMSE (se) is 12,490.
Further analysis is carried out in the following section to find out the reason for the excessive outburst flood peak.
Discussion
In Section Emergent Forecasts of the Breaching Process of Three Landslide-Dams, we implement our numerical model to simulate the breach processes of three barrier dams (two at Jiala Village in Yarlung Zangpo and at Baige Village in Jinsha River). With the limited field data obtained during the emergency treatment, the model can successfully simulate the two outburst floods in the Yarlung Zangpo, but underpredict the outburst flood in the Jinsha River. In this section, we discuss the reason for the underprediction of our model in the case of the “November 3” Baige barrier dam, Jinsha River, and explore whether the model performance could be improved with refined field information (with the consideration that the availability and accuracy of the field data was seriously limited during the emergency treatment). Moreover, using both field data and numerical simulations, we discuss the main factors that can control the magnitude and shape of the outburst flood hydrograph, which is of vital importance for the mitigation of flood hazards.
Patterns of Flood Hydrographs
Both field observations and experimental studies indicate that the hydrograph of outburst floods can be affected by the morphology of landslide dams and the composition of debris material (Costa and Schuster., 1988; Gregoretti et al., 2010; Chen et al., 2015). In addition to the peak discharge (Qp) and peak occurrence time (Tp), the shape of the hydrograph also has a significant impact on the disastrous consequences of the outburst flood (Herget et al., 2015). Floods with different hydrograph shapes, different discharge values (Q(x,t)) and cumulative flood volumes (W(x,t)) at a specific channel (reservoir) section would lead to different erosion/deposition patterns, different impounded water volumes and different water levels in the reservoir.
Based on previous research, the breach hydrographs of natural landslide barrier lakes can be classified into three typical patterns (Cenderelli, 2000), as sketched in Figure 8.
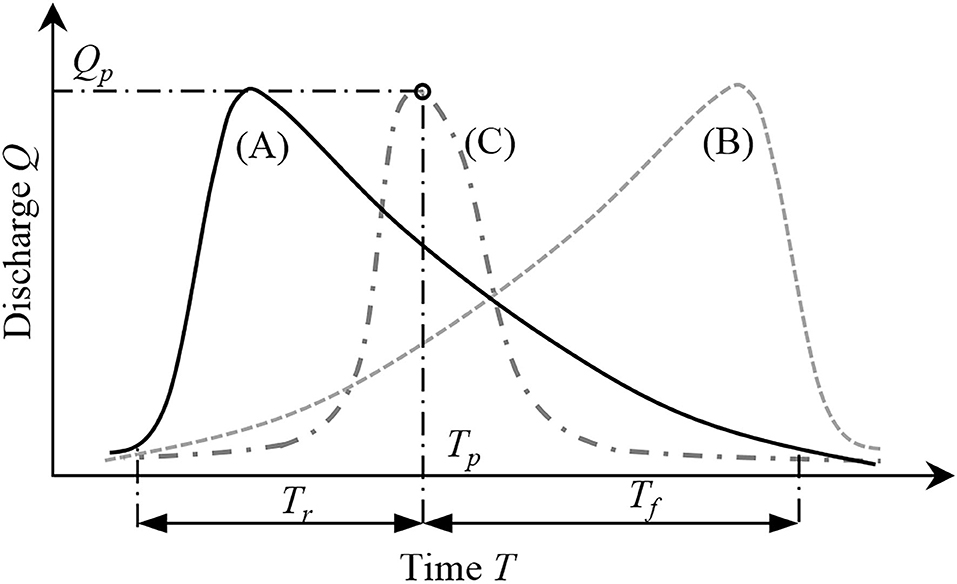
Figure 8. A sketch of the typical patterns of hydrographs of breach floods.
In Figure 8, Tr denotes the duration of the rising limb of the hydrograph, and Tf denotes the duration of the falling limb of the hydrograph. In most cases, the hydrographs with a gentle rising limb (curve B in Figure 8) are related to the enlargement of tunnels in glacier dams. Symmetric shaped hydrographs (curve C) usually appear in the breach of subglacial water pockets (Walder and Costa, 1996) and man-made concrete dams (Cenderelli, 2000).
In addition to the data summarized by Herget et al. (2015), the breaching hydrographs of typical earthen dams (landslide dams or moraine dams), including the Mayunmarca barrier lake, Mapanuepe barrier lake, HaHa barrier lake, Tangjiashan barrier lake, Yigong barrier lake, Jiala barrier lake and Baige barrier lake (Lee and Duncan, 1975; Umbal and Rodolfo, 1996; Capart et al., 2007; Liu et al., 2012; Capart, 2013; Delaney and Evans, 2015) were also normalized and analyzed in the same way as Herget et al. (2015). Figure 9 presents the normalized outburst flood hydrographs of all the recorded landslide/moraine-dammed lakes.
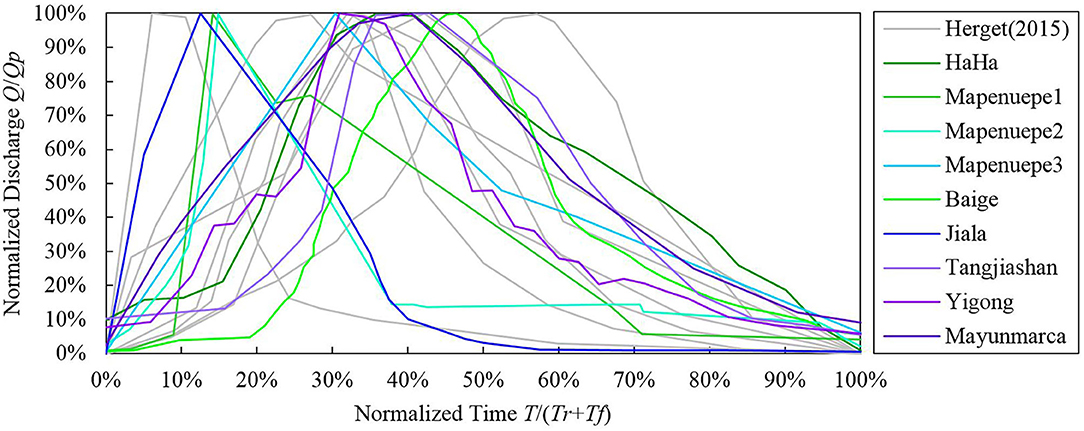
Figure 9. Normalized hydrographs of landslide (moraine) dams' breach floods.
As shown in Figure 9, it is obvious that most outburst floods of landslide/moraine dams are characterized by a steep rising limb and a gentle falling limb, resulting in a peak skewed to the left (curve A in Figure 8).
However, it is worth noting that the hydrograph of the Baige outburst flood is approximately symmetrical, which is rather uncommon in the previously recorded cases of landslide (moraine) dams. In order to reveal the reasons for various hydrographs, influential factors such as the GSD of the dam material and the height of the landslide dam are analyzed as follows.
Grain Size Distribution (GSD) of Landslide Deposit
The composition of landslide material plays a significant role in the breaching process of landslide dams (Morris et al., 2007; Schmocker and Hager, 2009). Effects of GSD on the breaching process are investigated in this section.
In our emergency simulation of the breach process of the Baige landslide dam, the GSD of the landslide deposit was estimated by the images of the dam crest, with the assumption that the GSD of the substrate was similar to that of the surface. After dam failure, it could be clearly recognized from the video that the interior of the landslide dam was made of much finer materials (despite the existence of a small quantity of large boulders) than the surface of the dam (Figure 10). Therefore, the failure of emergency simulation in the case of the Baige landslide dam may be due to the inaccuracy of the GSD adopted in the simulation. In addition to the GSD used in the emergency simulation in Section Emergent Forecasts of the Breaching Process of Three Landslide-Dams (termed as “GSD1”), another two sets of GSD (termed as “GSD2” and “GSD3”) are implemented in the simulation to analyze the effect of GSD on the flood hydrograph. The three GSDs are shown in Figure 11. Fine particles (D < 2 mm) of GSD2 and GSD3 account for 60% of the landslide deposit, which is much higher than that of GSD1 (5%).
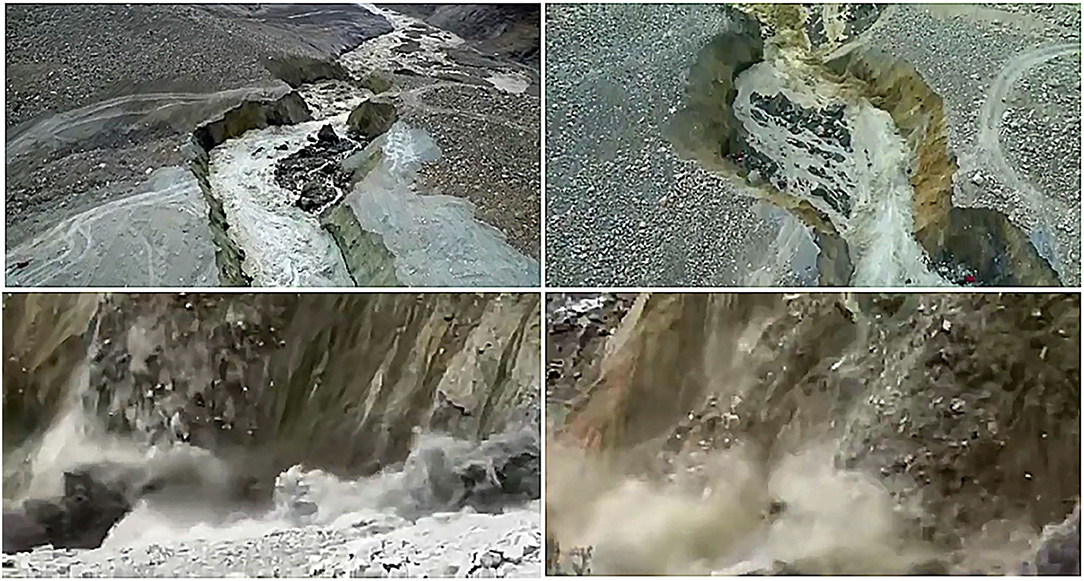
Figure 10. Images of the breach process of the “November 3” Baige landslide dam (taken by the Ministry of Emergency Management of China and the Fire Brigade of Sichuan Province).
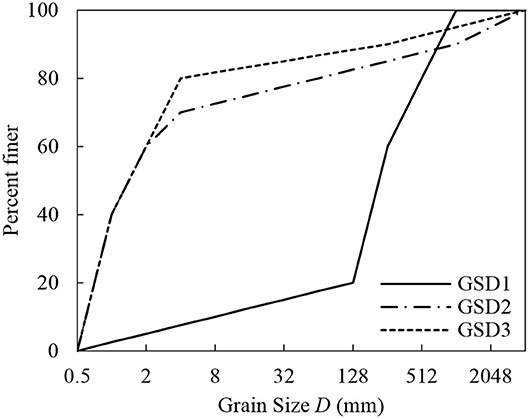
Figure 11. Three GSDs implemented to study the effect of GSD on the hydrograph of breach flood in the case of the “November 3” Baige barrier lake.
Following the topography measurement used in the emergency calculation, the dam crest elevation was determined to be 2,966 m and as a result, the initial elevation of the spillway bed was set to 2952.5 m. The other parameters were the same as those used in section Emergent Forecasts of the Breaching Process of Three Landslide-Dams. Three scenarios of GSD (GSD1, GSD2, and GSD3) were implemented. The breach processes with the three different GSDs are shown in Figure 12. For the coarsest GSD1, the outburst flood reaches a peak of 12,238 m3/s at 426 min. The rates of water level falling, bed erosion and lateral widening are relatively slow, and the breach keeps expanding after the occurrence of the peak discharge. When GSD2 (median) is considered, the dam becomes more erodible, and its breaching process is significantly faster than that of GSD1 due to the increment of the proportion of fine sediment, resulting in an increment of 25.7% in Qp and 96 min earlier of Tp. The peak discharge of 15,386 m3/s occurs at 330 min. For the finest GSD3, the peak discharge rises to 20,479 m3/s within 234 min and both the rising limb and falling limb of the flood hydrograph become steeper than GSD1 and GSD2. Changes in the bed elevation (zb) and the channel width (Bb) are rapid and approximately linear in the earlier stage and then become almost invariant after the occurrence of the peak discharge.
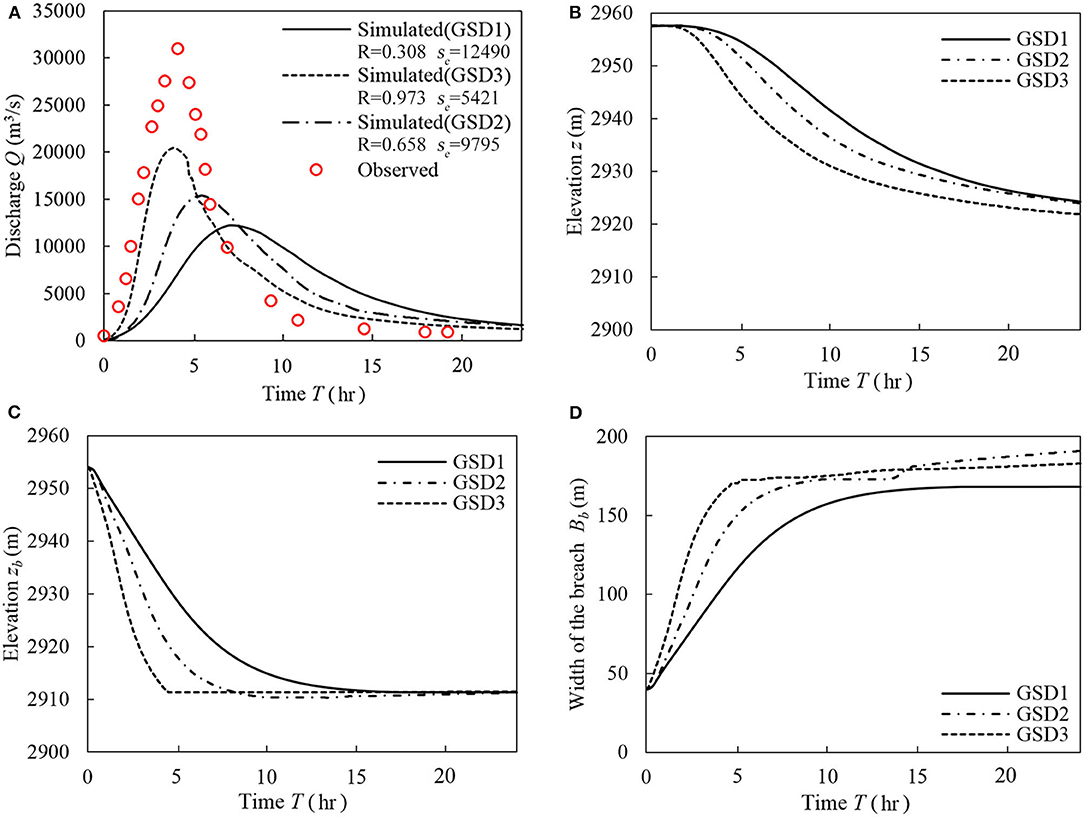
Figure 12. The breach process of the “November 3” Baige barrier dam with different GSDs. (A) the simulated hydrographs and the observed one. The Pearson correlation coefficients R under different GSDs vary in the range of 0.308–0.973, and the values of root mean square error RMSE (se) vary in the range of 5,421–12,490; (B) simulated water level; (C) simulated bed elevation at the inlet; (D) simulated width of the breach channel at the inlet.
A comparison between the simulation and the observation data shows that the GSD of landslide deposits has a significant influence on the breach process of landslide dams as well as the hydrograph of breach floods. A finer GSD will lead to a sharper and more symmetric hydrograph.
In order to test this assessment, three other dam breaching flood cases, the Yigong barrier lake in 2000, Tangjiashan barrier lake in 2008 and Jiala barrier lake in 2018, are further analyzed. As shown in Figure 13, outburst flood hydrographs of four landslide dams are differently skewed, corresponding to different GSDs. To quantify the level of symmetry (skewness) of the hydrographs, we propose a dimensionless parameter Fn. The reason for the new dimensionless parameter quantifying skewness is that conventionally the values of Tr and Tf are both sensitive to the start timing and duration of the recorded hydrograph, and we want to rule out the uncertainties of the start timing and recording duration. Therefore, the proportion of flow below n-percent of the perk is subtracted to define a low-flow-irrelevant symmetry (skewness) parameter and:
where n denotes the ratio of the subtracted base discharge to the peak discharge, krn and kfn denote the change rate of flood discharge in the water rising stage and water dropping stage, Trn and Tfn are the durations of the two stages, respectively. With Fn = 1 representing the symmetrical hydrograph, the outburst floods can be differentiated into three patterns: left skewing (Fn> 1), right skewing (Fn <1) and symmetrical (Fn≈ 1). Figure 13A shows the normalized hydrographs of four outburst floods, of which the horizontal axis represents the actual flood duration and the vertical axis represents the normalized discharge.
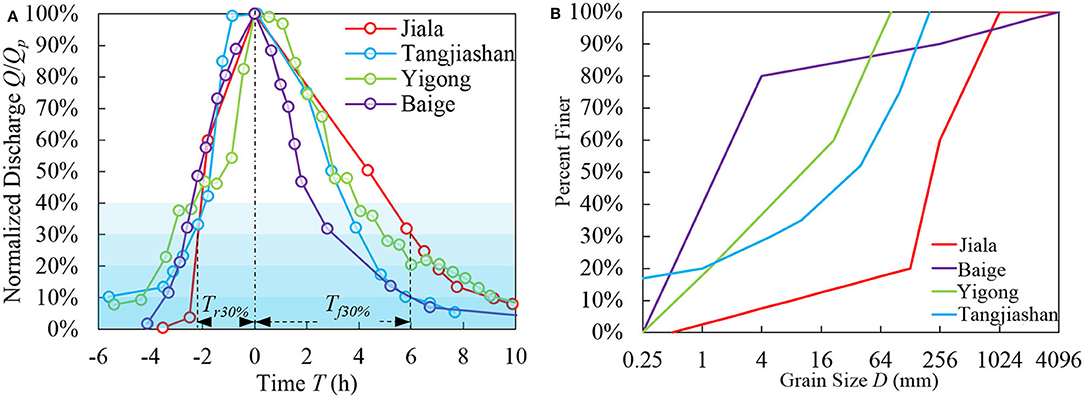
Figure 13. Observation data of four typical landslide dams. (A) Normalized outburst flood hydrographs, where Tr30% and Tf30% in the figure correspond to the outburst hydrograph of the Jiala landslide dam; (B) GSDs of four landslide dams, among which the GSDs of the Tangjiashan barrier dam and Yigong barrier dam are measured by field survey and the GSDs of the Jiala barrier dam and Baige barrier dam are estimated by images and then verified by simulation.
As shown in Table 3, from Jiala, Tangjiashan to Yigong, Baige, Fn decreases from ~2.5 to ~1, with a trend from left skewing (Jiala, Tangjiashan, Yigong) to symmetrical (Baige). This trend well represents the skewness of hydrographs as compared in Figure 13A. A closer look at Table 3 shows that there is a clear positive correlation between D50 and Fn. This indicates that our assessment based on Jiala and Baige cases that a finer GSD will lead to a sharper and more symmetric hydrograph is well-supported by field observations.
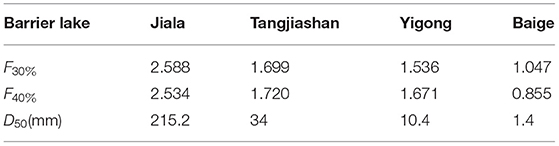
Table 3. The symmetry parameter of four typical barrier lake outburst floods.
Both the simulation results and analyses of field measurements reveal that the GSD of the dam material has an important impact on the outburst flood hydrograph of a landslide-dammed lake. The symmetric hydrograph can occur when GSD is sufficiently fine, which adds a new possible scenario to the conventional left-skewing shaped hydrograph. The results also indicate that for the emergency treatment of barrier dams, finer dam materials might lead to a larger and earlier outburst flood peak, and more people in the downstream region need to be resettled in advance to mitigate the flood hazard.
Height of Landslide Dam
The peak discharge of an outburst flood increases with the dam height (Gregoretti et al., 2010). The crest elevation of the Baige landslide dam was set to 2,966 m in the emergency simulation (Jin, 2019), while its value was 2,974 m in another version of topography data (Figure 4B). According to the second version of the longitudinal profile and the depth of the spillway, the initial elevation of the spillway bed (zb0) turned to 2960.5 m. The uncertainty of the dam height (via measurement uncertainty, different datums, etc.) thus may result in significant uncertainties in the prediction results. We quantify this effect in this subsection.
With the water level-storage relation of Baige barrier lake (Figure 4A), the dam height value could be verified by the initial water storage in the lake. In the process of dam breach, the barrier lake's water storage conforms to the following mass conservation relation:
where V0 denotes the initial volume of the water storage in the barrier lake before the breach process, Vr denotes the remaining volume of water after the start of the breach process, and Wout and Win denote the cumulative flood volume of outflow and inflow, respectively.
Based on the observed flood hydrographs of Baige barrier lake (Wang et al., 2019), it could be calculated that the cumulative flood volumes within 24 h (Wout) at the dam site, Yebatan section (54 km downstream of the dam site) and Batang section (158 km downstream of the dam site) are 560 million m3, 640 million m3, and 650 million m3, respectively. The base flow discharges before the flood rose at Yebatan and Batang stations were 125 and 176 m3/s (Wang et al., 2019), suggesting that the lateral inflow along this reach could be negligible. Therefore, the difference between the three values may be caused by the uncertainty of the dam height measurement. We implement a value of 613 million m3 for Wout, which is the average of the values at the three sites. During the 24 h of the breach process, the cumulative volume of upstream inflow (Win) calculated by the inflow discharge was about 43 million m3. Twenty-four hours later, the water level fell back to 2,908 m with a remaining volume (Vr) of 81 million m3. Substituting the above variables into Equation (22), a value of 650 million m3 was obtained for the initial volume of water storage V0, corresponding to an initial water level of 2960.5 m and an initial elevation of 2,958 m at the inlet of the channel. Four scenarios of zb0= 2952.5, 2,957, 2,958, and 2,959 m were implemented in the simulation of this section. The GSD of dam material was set to GSD3 in Figure 11. Other computational conditions are the same as in section Emergent Forecasts of the Breaching Process of Three Landslide-Dams. Figure 14 presents the simulated hydrographs compared with the observed results.
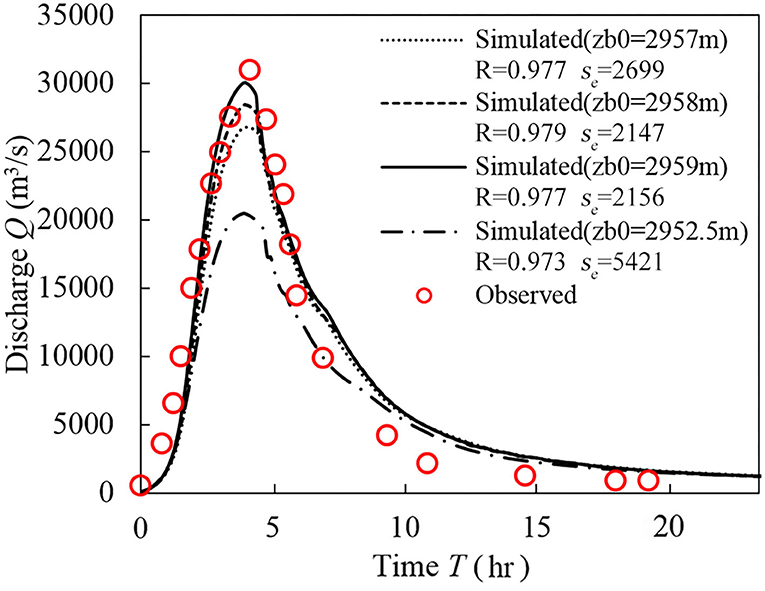
Figure 14. The observed hydrograph of “November 3” Baige barrier lake and simulated results of different initial spillway bed elevations. The Pearson correlation coefficients R under different dam heights vary in the range of 0.973–0.979, and the values of root mean square error RMSE (se) vary in the range of 2,147–5,421.
Figure 14 shows that Qp is sensitive to the elevation of the dam crest (i.e., initial elevation of the artificial spillway channel). The higher the value of zb0 is, the sharper the hydrograph and the higher the peak. The peak discharge reaches 20,479, 26,808, 28,455, and 30,064 m3/s, corresponding to initial dam crest elevations of 2952.5, 2,957, 2,958, and 2,959 m, respectively. The occurrence time of peak discharge (Tp) is relatively insensitive to the initial elevation of the spillway bed (zb0), resulting in an approximately invariable occurrence time of peak discharge as well as similar symmetry of hydrographs. This indicates that excavating a spillway would be an effective method to reduce the outburst flood discharge and thus mitigate the flood hazard.
When the spillway elevation is set at about 2,959 m, the simulated hydrograph agrees well with the observed results. This value is close to the last measurement of the initial spillway bed elevation (2960.5 m). However, this was not used to predict the outburst flood before it occurred, unfortunately. With refined dam height and grain size distribution, the model can also well reproduce the breaching process of the “November 3” Baige barrier dam on the Jinsha River.
Conclusions
A physically-based hydro-morphodynamic model was established and implemented to simulate the breaching process of barrier dams. The applicability of the proposed model was proven in various scenarios. Based on limited information from aerial images, DEM data and hydrological measurements, the model parameters could be obtained shortly after the occurrence of barrier dams, which aided the emergent simulation. The established model successfully predicted the key parameters of two successive outburst floods in the Yarlung Zangbo River in advance, providing pivotal information to support the decision-making of the hazard mitigation. The model could also well reproduce the outburst flood of the “November 03” Baige barrier lake in the Jinsha River with a well-refined dam height and GSD of dam material. Good agreement between the simulation results and the observed data confirms the applicability of this model for emergency treatment.
Both the dam height and the GSD of dam material have a significant influence on the breaching process and the outburst flood hydrograph. The simulation results showed that finer dam material will lead to a faster erosion rate, thus resulting in a greater flood peak discharge and an earlier occurrence time of the flood peak. More specifically, a fine GSD of dam material leads to a sharper and more symmetrical flood hydrograph, thus controlling the overall shape of the hydrograph. Meanwhile, both the initial water storage of the barrier lake and the peak discharge of outburst floods increase with increasing dam height, whereas the skewness of the hydrograph is barely influenced by the height of the landslide dam.
Based on the analysis of four groups of field data, a dimensionless parameter Fn is proposed to describe the skewness of the hydrograph. Two hydrograph patterns were identified for the outburst floods of landslide barrier dams. For most cases with field data, the hydrograph is asymmetric and left skewed (Fn> 1), with a steeply rising limb and a gently decaying limb. However, the symmetric hydrograph (Fn = 1) also exists for certain cases, e.g., the “November 3” Baige barrier dam in the Jinsha River. A further analysis of the four sets of field data shows that the shape/symmetry of the hydrograph is correlated with the median grain size of dam material. The uncommon symmetric flood hydrograph of Baige barrier lake can be partly ascribed to the relatively fine GSD of dam material.
The dam breach model developed in this paper provides a practical tool to predict the outburst flood hydrograph and the morphological evolution subjected to landslide barrier dams. More specifically, the main factors identified in this paper that control the magnitude and shape of outburst flood hydrographs could provide guidance for data collection during the emergency treatment of barrier dams. This notwithstanding, the study in this paper still has several limitations, including: (1) Our model provides deterministic prediction for the dam breach process. However, considering the limited accessibility and quality of the field data during emergency treatment, a prediction with a confidence interval that considers the uncertainties of input data would be more helpful. (2) In this paper, we focus on the timescale of the outburst flood (which is about 1 day), which is reasonable for the purpose of emergency treatment. However, a large volume of landslide deposits will remain in the channel after the outburst flood. The long term morphological and ecological effects of landslide deposits are also an important issue that would merit future research.
Data Availability Statement
The original contributions presented in the study are included in the article/supplementary material, further inquiries can be directed to the corresponding authors.
Author Contributions
XF and CA designed the research. YS, CA, and HM collected and analyzed data. YS and YL performed the numerical simulation. YS wrote the paper with the contribution of all authors. All authors contributed to the article and approved the submitted version.
Funding
This investigation was supported by the National Natural Science Foundation of China (Grants 91747207, 51525901, U20A20319, and 52009063).
Conflict of Interest
The authors declare that the research was conducted in the absence of any commercial or financial relationships that could be construed as a potential conflict of interest.
Publisher's Note
All claims expressed in this article are solely those of the authors and do not necessarily represent those of their affiliated organizations, or those of the publisher, the editors and the reviewers. Any product that may be evaluated in this article, or claim that may be made by its manufacturer, is not guaranteed or endorsed by the publisher.
Acknowledgments
Special thanks are due to Gary Parker and Marwan Hassan for their constructive advice.
References
Abderrezzak, K. E. K., Paquier, A., and Gay, B. (2008). One-dimensional numerical modelling of dam-break waves over movable beds: application to experimental and field cases. Environ. Fluid Mech. 8, 169–198. doi: 10.1007/s10652-008-9056-9
Abril, B., and Knight, D. (2004). Stabilising the Paute river in Ecuador. Proc. Inst. Civil Eng. Civil Eng. 157, 32–38. doi: 10.1680/cien.2004.157.1.32
An, C., Cui, Y., Fu, X., and Parker, G. (2017). Gravel-bed river evolution in earthquake-prone regions subject to cycled hydrographs and repeated sediment pulses. Earth Surface Processes Landforms 42, 2426–2438. doi: 10.1002/esp.4195
An, C., Parker, G., Hassan, M. A., and Fu, X. (2019). Can magic sand cause massive degradation of a gravel-bed river at the decadal scale? Shi-ting River, China. Geomorphology 327, 147–158. doi: 10.1016/j.geomorph.2018.10.026
Balmforth, N., Von Hardenberg, J., and Zammett, R. (2009). Dam-breaking seiches. J. Fluid Mech. 628, 1–21. doi: 10.1017/S0022112009005825
Cantelli, A., Wong, M., Parker, G., and Paola, C. (2007). Numerical model linking bed and bank evolution of incisional channel created by dam removal. Water Resour. Res. 43, W07436. doi: 10.1029/2006WR005621
Cao, Z., Pender, G., Wallis, S., and Carling, P. (2004). Computational dam-break hydraulics over erodible sediment bed. J. Hydraulic Eng. 130, 689–703. doi: 10.1061/(ASCE)0733-9429(2004)130:7(689)
Cao, Z., Yue, Z., and Pender, G. (2011a). Landslide dam failure and flood hydraulics. Part I: experimental investigation. Natural Hazards 59, 1003–1019. doi: 10.1007/s11069-011-9814-8
Cao, Z., Yue, Z., and Pender, G. (2011b). Landslide dam failure and flood hydraulics. Part II: coupled mathematical modelling. Natural Hazards 59, 1021–1045. doi: 10.1007/s11069-011-9815-7
Capart, H. (2013). Analytical solutions for gradual dam breaching and downstream river flooding. Water Resour. Res. 49, 1968–1987. doi: 10.1002/wrcr.20167
Capart, H., Spinewine, B., Young, D. L., Zech, Y., Brooks, G. R., Leclerc, M., et al. (2007). The 1996 Lake Ha! Ha! breakout flood, Quebec: test data for geomorphic flood routing methods. J. Hydraulic Res. 45, 97–109. doi: 10.1080/00221686.2007.9521836
Cenderelli, D. A. (2000). “Floods from natural and artificial dam failures,” in Inland Flood Hazards: Human, Riparian and Aquatic Communities, ed. E. E. Wohl (Cambridge University Press), 73–103. doi: 10.1017/CBO9780511529412.004
Chen, C., Zhang, L., Xiao, T., and He, J. (2020). Barrier lake bursting and flood routing in the Yarlung Tsangpo Grand Canyon in October 2018. J. Hydrol. 583, 124603. doi: 10.1016/j.jhydrol.2020.124603
Chen, S.-C., Lin, T.-W., and Chen, C.-Y. (2015). Modeling of natural dam failure modes and downstream riverbed morphological changes with different dam materials in a flume test. Eng. Geol. 188, 148–158. doi: 10.1016/j.enggeo.2015.01.016
Chen, Z., Ping, Z., Wang, N., Yu, S., and Chen, S. (2019). An approach to quick and easy evaluation of the dam breach flood. Sci. China Technol. Sci. 62, 1773–1782. doi: 10.1007/s11431-018-9367-4
Costa, J. E., and Schuster, R. L. (1988). The formation and failure of natural dams. Geol. Soc. Am. Bull. 100, 1054–1068. doi: 10.1130/0016-7606(1988)100<1054:TFAFON>2.3.CO
Cui, P., Zhu, Y. Y., Han, Y. S., Chen, X. Q., and Zhuang, J. Q. (2009). The 12 May Wenchuan earthquake-induced landslide lakes: distribution and preliminary risk evaluation. Landslides 6, 209–223. doi: 10.1007/s10346-009-0160-9
Dang, C., Chu, N., and Ding, Y. (2014). Predictive uncertainty of peak outflow relations for landslides dam breach. Environ. Earth Sci. 72, 4265–4271. doi: 10.1007/s12665-014-3321-7
Delaney, K. B., and Evans, S. G. (2015). The 2000 Yigong landslide (Tibetan Plateau), rockslide-dammed lake and outburst flood: review, remote sensing analysis, and process modelling. Geomorphology 246, 377–393. doi: 10.1016/j.geomorph.2015.06.020
Duan, J. G., and Scott, S. (2007). Selective bed-load transport in Las Vegas Wash, a gravel-bed stream. J. Hydrol. 342, 320–330. doi: 10.1016/j.jhydrol.2007.06.001
Egiazaroff, I. (1965). Calculation of nonuniform sediment concentrations. J. Hydraulics Div. 91, 225–247. doi: 10.1061/JYCEAJ.0001277
Fan, X., Yang, F., Siva Subramanian, S., et al. (2020). Prediction of a multi-hazard chain by an integrated numerical simulation approach: the Baige landslide, Jinsha River, China. Landslides 17, 147–164. doi: 10.1007/s10346-019-01313-5
Fread, D. (1988). BREACH: An Erosion Model for Earthen Dam Failures (Model Description and User Manual). Silver Spring, MD: National Oceanic and Atmospheric Administration, National Weather Service.
Froehlich, D. C. (2008). Embankment dam breach parameters and their uncertainties. J. Hydraulic Eng. 134, 1708–1721. doi: 10.1061/(ASCE)0733-9429(2008)134:12(1708)
Fu, X., Liu, F., Ma, H., and Wang, G. (2010). Physically based simulation of the breaching of the Tangjiashan Quake Lake. J. Tsinghua Univ. 2010, 1910–1914. doi: 10.16511/j.cnki.qhdxxb.2010.12.008
Gregoretti, C., Maltauro, A., and Lanzoni, S. (2010). Laboratory experiments on the failure of coarse homogeneous sediment natural dams on a sloping bed. J. Hydraulic Eng. 136, 868–879. doi: 10.1061/(ASCE)HY.1943-7900.0000259
Harten, A., Lax, P. D., and Leer, B. (1983). On upstream differencing and godunov-type schemes for hyperbolic conservation laws. SIAM Rev. 25, 35–61. doi: 10.1137/1025002
Herget, J., Schütte, F., and Klosterhalfen, A. (2015). Empirical modelling of outburst flood hydrographs. Zeitschrift Fur Geomorphologie 59, 177–198. doi: 10.1127/zfg_suppl/2015/S-59224
Jin, X. (2019). reviews and reflections on emergency response countermeasures for barrier lakes in Jinsha river and Yarlung Zangbo river. Yangtze River 50, 5–9. doi: 10.16232/j.cnki.1001-4179.2019.03.002
Korup, O., and Tweed, F. (2007). Ice, moraine, and landslide dams in mountainous terrain. Quat. Sci. Rev. 26, 3406–3422. doi: 10.1016/j.quascirev.2007.10.012
Lee, K., and Duncan, J. (1975). Landslide of April 25, 1974 on the Mantaro River. Peru; Washington, DC: Committee on Natural Disasters, Commission on Sociotechnical Systems; National Research Council.
Li, J., Cao, Z., Cui, Y., and Borthwick, A. (2020). Barrier lake formation due to landslide impacting a river: a numerical study using a double layer-averaged two-phase flow model. Appl. Math. Model. 80, 574–601. doi: 10.1016/j.apm.2019.11.031
Li, J., Cao, Z., Cui, Y., Fan, X., Yang, W., Huang, W., et al. (2021). Hydro- sediment-morphodynamic processes of the Baige landslide-induced barrier lake, Jinsha River, China. J. Hydrol. 596, 126134. doi: 10.1016/j.jhydrol.2021.126134
Liu, D., Cui, Y., Wang, H., Jin, W., Wu, C., Bazai, N. A., et al. (2021). Assessment of local outburst flood risk from successive landslides: case study of Baige landslide-dammed lake, upper Jinsha river, eastern Tibet. J. Hydrol. 599, 126294. doi: 10.1016/j.jhydrol.2021.126294
Liu, F., Fu, X., Wang, G., and Duan, J. (2012). Physically based simulation of dam breach development for Tangjiashan Quake Dam, China. Environ. Earth Sci. 65, 1081–1094. doi: 10.1007/s12665-011-1025-9
Ma, H. B., and Fu, X. D. (2012). Real time prediction approach for floods caused by failure of natural dams due to overtopping. Adv. Water Resour. 35, 10–19. doi: 10.1016/j.advwatres.2011.08.013
Miller, B. G. N., and Cruden, D. M. (2002). The Eureka River landslide and dam, Peace River Lowlands, Alberta. Can. Geotech. J. 39, 863–878. doi: 10.1139/t02-038
Mohamed, M. A., Samuels, P., Morris, M., and Ghataora, G. (2002). “Improving the accuracy of prediction of breach formation through embankment dams and flood embankments,” in Paper presented at the River Flow 2002 Proceedings of the International Conference on Fluvial Hydraulics (Lisse: Swets and Zeitlinger).
Morris, M., Hassan, M., and Vaskinn, K. (2007). Breach formation: field test and laboratory experiments. J. Hydraulic Res. 45, 9–17. doi: 10.1080/00221686.2007.9521828
Nicoletti, P. G., and Parise, M. (2002). Seven landslide dams of old seismic origin in southeastern Sicily (Italy). Geomorphology 46, 203–222. doi: 10.1016/S0169-555X(02)00074-0
O'Connor, J. E., Grant, G. E., and Costa, J. E. (2002). The geology and geography of floods. Ancient floods, modern hazards and applications of paleoflood hydrology. water science and application. Am. Geophys. Union 5, 359–395. doi: 10.1029/WS005p0359
Parker, G. (1990). Surface-based bedload transport relation for gravel rivers. J. Hydraulic Res. 28, 417–436. doi: 10.1080/00221689009499058
Parker, G., Hassan, M., and Wilcock, P. (2007). Adjustment of the bed surface size distribution of gravel-bed rivers in response to cycled hydrographs. Dev. Earth Surface Processes 11, 241–285. doi: 10.1016/S0928-2025(07)11127-5
Pierce, M. W., Thornton, C. I., and Abt, S. R. (2009). Predicting peak outflow from breached embankment dams. J. Hydrologic Eng. 15, 338–349. doi: 10.1061/(ASCE)HE.1943-5584.0000197
Ruiz-Villanueva, V., Allen, S., Arora, M., Goel, N. K., and Stoffel, M. (2017). Recent catastrophic landslide lake outburst floods in the Himalayan mountain range. Progress Phys. Geogr. 41, 3–28. doi: 10.1177/0309133316658614
Schmocker, L., and Hager, W. H. (2009). Modelling dike breaching due to overtopping. J. Hydraulic Res. 47, 585–597. doi: 10.3826/jhr.2009.3586
Shi, Z., Xiong, X., Peng, M., Zhang, L., Xiong, Y., Chen, H., et al. (2017). Risk assessment and mitigation for the Hongshiyan landslide dam triggered by the 2014 Ludian earthquake in Yunnan, China. Landslides 14, 269–285. doi: 10.1007/s10346-016-0699-1
Singh, V., Scarlatos, P., Collins, J., and Jourdan, M. (1988). Breach erosion of earthfill dams (BEED) model. Natural Hazards 1, 161–180. doi: 10.1007/BF00126613
Singh, V. P., and Scarlatos, P. D. (1988). Analysis of gradual earth-dam failure. J. Hydraulic Eng. 114, 21–42. doi: 10.1061/(ASCE)0733-9429(1988)114:1(21)
Spinewine, B., and Zech, Y. (2003). Dam-break waves on a movable bed: a test case exploring different bed materials and an initial bed discontinuity. Paper presented at the EC Contract EVG1-CT-2001-00037 IMPACT Investigation of Extreme Flood Processes and Uncertainty, Proceedings 3rd Project Workshop (Louvain-la-Neuve).
Temple, D. M., Hanson, G. J., and Neilsen, M. L. (2006). WINDAM–analysis of overtopped earth embankment dams. Paper presented at the 2006 ASAE Annual Meeting (Portland, OR).
Tingsanchali, T., and Chinnarasri, C. (2001). Numerical modelling of dam failure due to flow overtopping. Hydrol. Sci. J. 46, 113–130. doi: 10.1080/02626660109492804
Toro, E. F. (2001). Shock-Capturing Methods for Free-Surface Shallow Flows. New York, NY: John Wiley.
Toro-Escobar, C. M., Paola, C., and Parker, G. (1996). Transfer function for the deposition of poorly sorted gravel in response to streambed aggradation. J. Hydraulic Res. 34, 35–53. doi: 10.1080/00221689609498763
Umbal, J. V., and Rodolfo, K. S. (1996). The 1991 lahars of southwestern Mount Pinatubo and evolution of the lahar-dammed Mapanuepe Lake. Fire and mud: Eruptions and Lahars of Mount Pinatubo, Philippines (Quezon), 951–970.
Wahl, T. L. (1997). Predicting embankment dam breach parameters-a needs assessment. Paper presented at the Proceedings of the Congress-International Association for Hydraulic Research (San Francisco, CA).
Wahl, T. L. (2004). Uncertainty of predictions of embankment dam breach parameters. J. Hydraulic Eng. 130, 389–397. doi: 10.1061/(ASCE)0733-9429(2004)130:5(389)
Wahl, T. L., Hanson, G. J., Courivaud, J.-R., Morris, M. W., Kahawita, R., McClenathan, J. T., et al. (2008). Development of next-generation embankment dam breach models. Paper presented at the USSD Conference (Portland, OR).
Walder, J. S., and Costa, J. E. (1996). Outburst floods from glacier-dammed lakes: the effect of mode of lake drainage on flood magnitude. Earth Surface Processes Landforms 21, 701–723. doi: 10.1002/(SICI)1096-9837(199608)21:8<701::AID-ESP615>3.0.CO;2-2
Wang, G., Liu, F., Fu, X., and Li, T. (2008). Simulation of dam breach development for emergency treatment of the Tangjiashan Quake Lake in China. Sci. China Ser. E Technol. Sci. 51, 82–94. doi: 10.1007/s11431-008-6019-9
Wang, M., Lu, J., Yao, S., Zhu, Y., and Zhou, J. (2019). Study on dam break flood forecast error and improvement for Baige barrier lake on Jinsha river. Yangtze River 50, 34–39.
Wang, Z., and Bowles, D. S. (2006). Three-dimensional non-cohesive earthen dam breach model. Part 1: Theory and methodology. Adv. Water Resourc. 29, 1528–1545. doi: 10.1016/j.advwatres.2005.11.009
Wilcock, P. R., and Crowe, J. C. (2003). Surface-based transport model for mixed-size sediment. J. Hydraulic Eng. 129, 120–128. doi: 10.1061/(ASCE)0733-9429(2003)129:2(120)
Worni, R., Huggel, C., Clague, J. J., Schaub, Y., and Stoffel, M. (2014). Coupling glacial lake impact, dam breach, and flood processes: a modeling perspective. Geomorphology 224, 161–176. doi: 10.1016/j.geomorph.2014.06.031
Wu, W., Altinakar, M. S., Al-Riffai, M., Bergman, N., Bradford, S. F., and Cao, Z. (2011). ASCE/EWRI Task Committee on Dam/Levee Breaching: earthen embankment breaching. J. Hydraulic Eng. 137, 1549–1564. doi: 10.1061/(ASCE)HY.1943-7900.0000498
Wu, W., and Wang, S. S. (2007). One-dimensional modeling of dam-break flow over movable beds. J. Hydraulic Eng. 133, 48–58. doi: 10.1061/(ASCE)0733-9429(2007)133:1(48)
Zhao, B., Li, W., Wang, Y., Lu, J., and Li, X. (2019). Landslides triggered by the Ms 6.9 Nyingchi earthquake, China (18 November 2017): analysis of the spatial distribution and occurrence factors. Landslides 16, 765–776. doi: 10.1007/s10346-019-01146-2
Keywords: barrier lake, dam-breaching flood, emergency prediction, symmetric hydrograph, Jinsha River, Yarlung Zangbo River
Citation: Song Y, Fu X, Lin Y, An C and Ma H (2022) What Controls the Magnitude and the Shape of Landslide Dam-Breaching Flood Hydrograph? Case Studies of Emergent Forecasts for Outburst Floods of Jiala and Baige Barrier Lakes. Front. Water 4:834132. doi: 10.3389/frwa.2022.834132
Received: 13 December 2021; Accepted: 31 January 2022;
Published: 28 February 2022.
Edited by:
Alban Kuriqi, Universidade de Lisboa, PortugalReviewed by:
Behrouz Mehdinejadiani, University of Kurdistan, IranAbeer Abd El Moneam El Shahawy, Suez Canal University, Egypt
Mehmet Ardiclioglu, Erciyes University, Turkey
Copyright © 2022 Song, Fu, Lin, An and Ma. This is an open-access article distributed under the terms of the Creative Commons Attribution License (CC BY). The use, distribution or reproduction in other forums is permitted, provided the original author(s) and the copyright owner(s) are credited and that the original publication in this journal is cited, in accordance with accepted academic practice. No use, distribution or reproduction is permitted which does not comply with these terms.
*Correspondence: Xudong Fu, eGRmdUBtYWlsLnRzaW5naHVhLmVkdS5jbg==; Chenge An, YW5jaGVuZ2UwOEAxNjMuY29t